Introduction
Liver fibrosis is a major consequence of chronic
liver disease and its different stages determine the disease
prognosis. Progression of fibrosis is linked to portal
hypertension, hepatic failure and risk of hepatocellular carcinoma
(1). Early treatment and prevention
of the progression to liver cirrhosis is important, as the fibrotic
process is dynamic and there is a possibility of reversibility
(2).
Liver biopsy is considered the gold standard for the
evaluation of fibrosis and determination of the stage. However, it
is invasive and has major limitations, including sampling
variability and interobserver variability (3). There are certain non-invasive methods,
including magnetic resonance elastography (MRE) (4), ultrasound-based acoustic radiation
force impulse (ARFI) (5) and
measurement of biomarkers of fibrosis in serum. MRE is a widely
used shear wave imaging technique for the staging of liver fibrosis
with high diagnostic accuracy (4).
Recently, a novel marker, Wisteria floribunda
agglutinin-positive Mac-2-binding protein (WFA+-M2BP;
also called M2BPGi), was introduced for determining liver fibrosis
and has been confirmed to be a reliable marker for the staging of
liver fibrosis (6). To the best of
our knowledge, no previous studies have compared the diagnostic
accuracy of MRE with that of WFA+-M2BP. Therefore, the
present study aimed to determine serum WFA+-M2BP cutoff
values for assessing the fibrosis stage and compared the diagnostic
accuracy of MRE and WFA+-M2BP.
Materials and methods
Patients
The present study was a retrospective
cross-sectional study. Ethical approval was obtained from the
Institutional Review Board of Changhua Christian Hospital
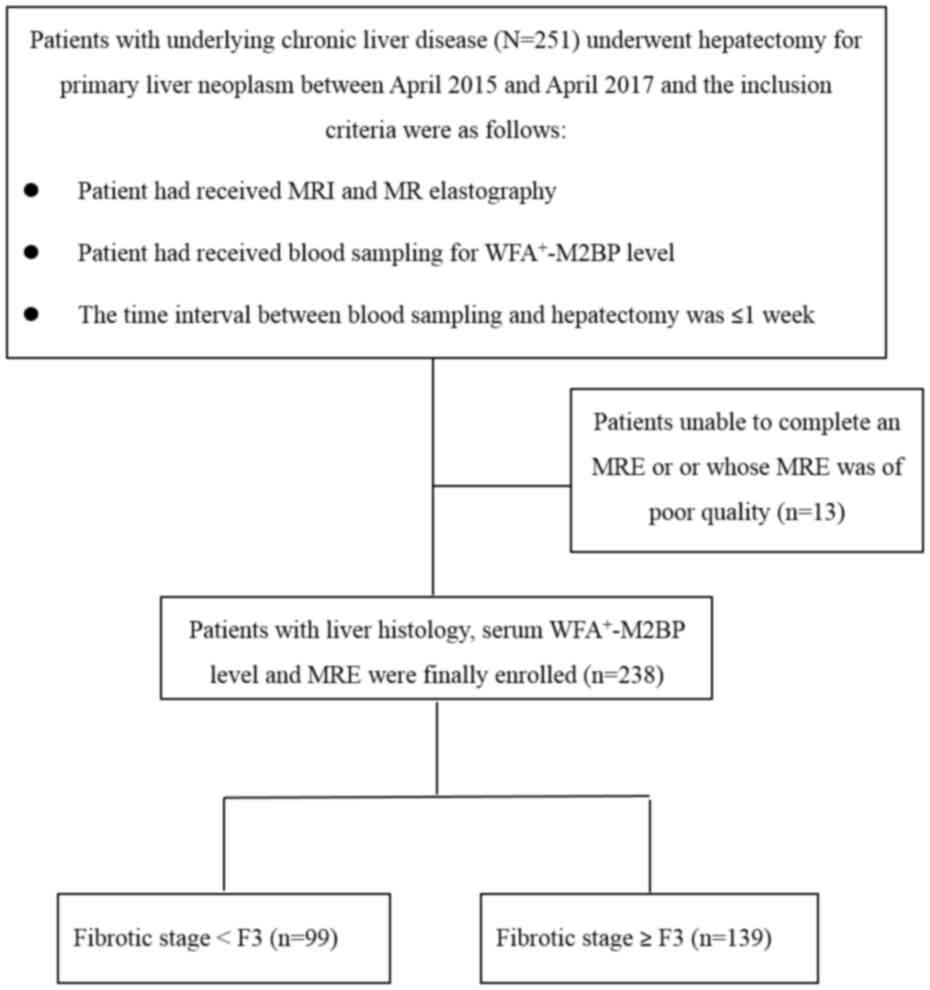
(Changhua, China; no. 120611). Between April 2015 and April 2017,
251 patients with hepatic tumors underwent hepatectomy at Changhua
Christian Hospital (Changhua, Taiwan) and had underlying chronic
liver disease. These patients had also received MRE and blood
sampling for analysis of serum WFA+-M2BP levels. The
time interval between hepatectomy and blood sampling was <1
week. Patients who were unable to complete an MRE and those whose
MRE was of poor quality were excluded. Finally, 238 patients were
enrolled (Fig. 1). Of these 238
patients, 99 had early-stage hepatic fibrosis (<F3) and 139 had
advanced fibrosis (≥F3). Patient characteristics, including age,
sex, body mass index (BMI), underlying liver disease and laboratory
data were recorded.
MRE
MRI was performed on a 1.5 Tesla magnet system
(Aera; Siemens AG) using a 16-channel phased-array body coil for
the acquisition of routine clinical MR and MRE images. When paired
with an acoustic driver system (Resoundant), the MRE system is
capable of generating acoustic shear waves in human livers. A 19-cm
diameter, 1.5-cm thick cylindrical passive driver was connected
with a flexible plastic tube to an acoustic active driver. The
passive driver was placed against the right chest wall located at
the level of the xiphoid process. Propagating shear waves were
produced from continuous acoustic vibrations at 60 Hz that were
transmitted from the active driver in the liver and they were
imaged with an axial 2-dimensional gradient-echo sequence. The
parameters of the MRE sequence are described as follows: Repetition
time/echo time, 50/22.7; flip angle, 25̊; bandwidth, 260 Hz/pixel;
hydrogen resonance frequency, 63.5 MHz; acquisition matrix, 256x64;
section thickness, 5 mm; and field of view, 400x400 mm. The scanning
time of each axial slice was 21 sec per breath-hold. Patients were
requested to hold their breath at the end-expiratory stage to
obtain a consistent position of the liver for each phase offset. A
total of five slices of axial images were acquired for each patient.
After all post-processing steps were applied automatically, liver
stiffness measurements were determined in kilopascals. If a
reflective wave, disturbed wave or artifact occurred on wave
imaging, the passive driver was re-positioned on the chest wall to
acquire well-propagating wave images. The following elastograms
were reviewed automatically by the intrinsic software for
artifacts, including significant wave interference and oblique wave
propagation. Confidence mapping, which provided regions that had
adequate wave amplitudes, was automatically performed by the MRE
software.
MRE analysis
All analyses were performed on a dual-screen
diagnostic workstation (GE Healthcare). Two abdominal radiologists
(CTC and KLW) evaluated the MRE images. One radiologist had >20
years of clinical experience in abdominal imaging and the other had
three years of experience. The MRE images to be evaluated included
the anatomic image sets, the wave image sets and the elastogram
sets. The two radiologists were blinded to the patients' clinical
information, serum WFA+-M2BP levels and
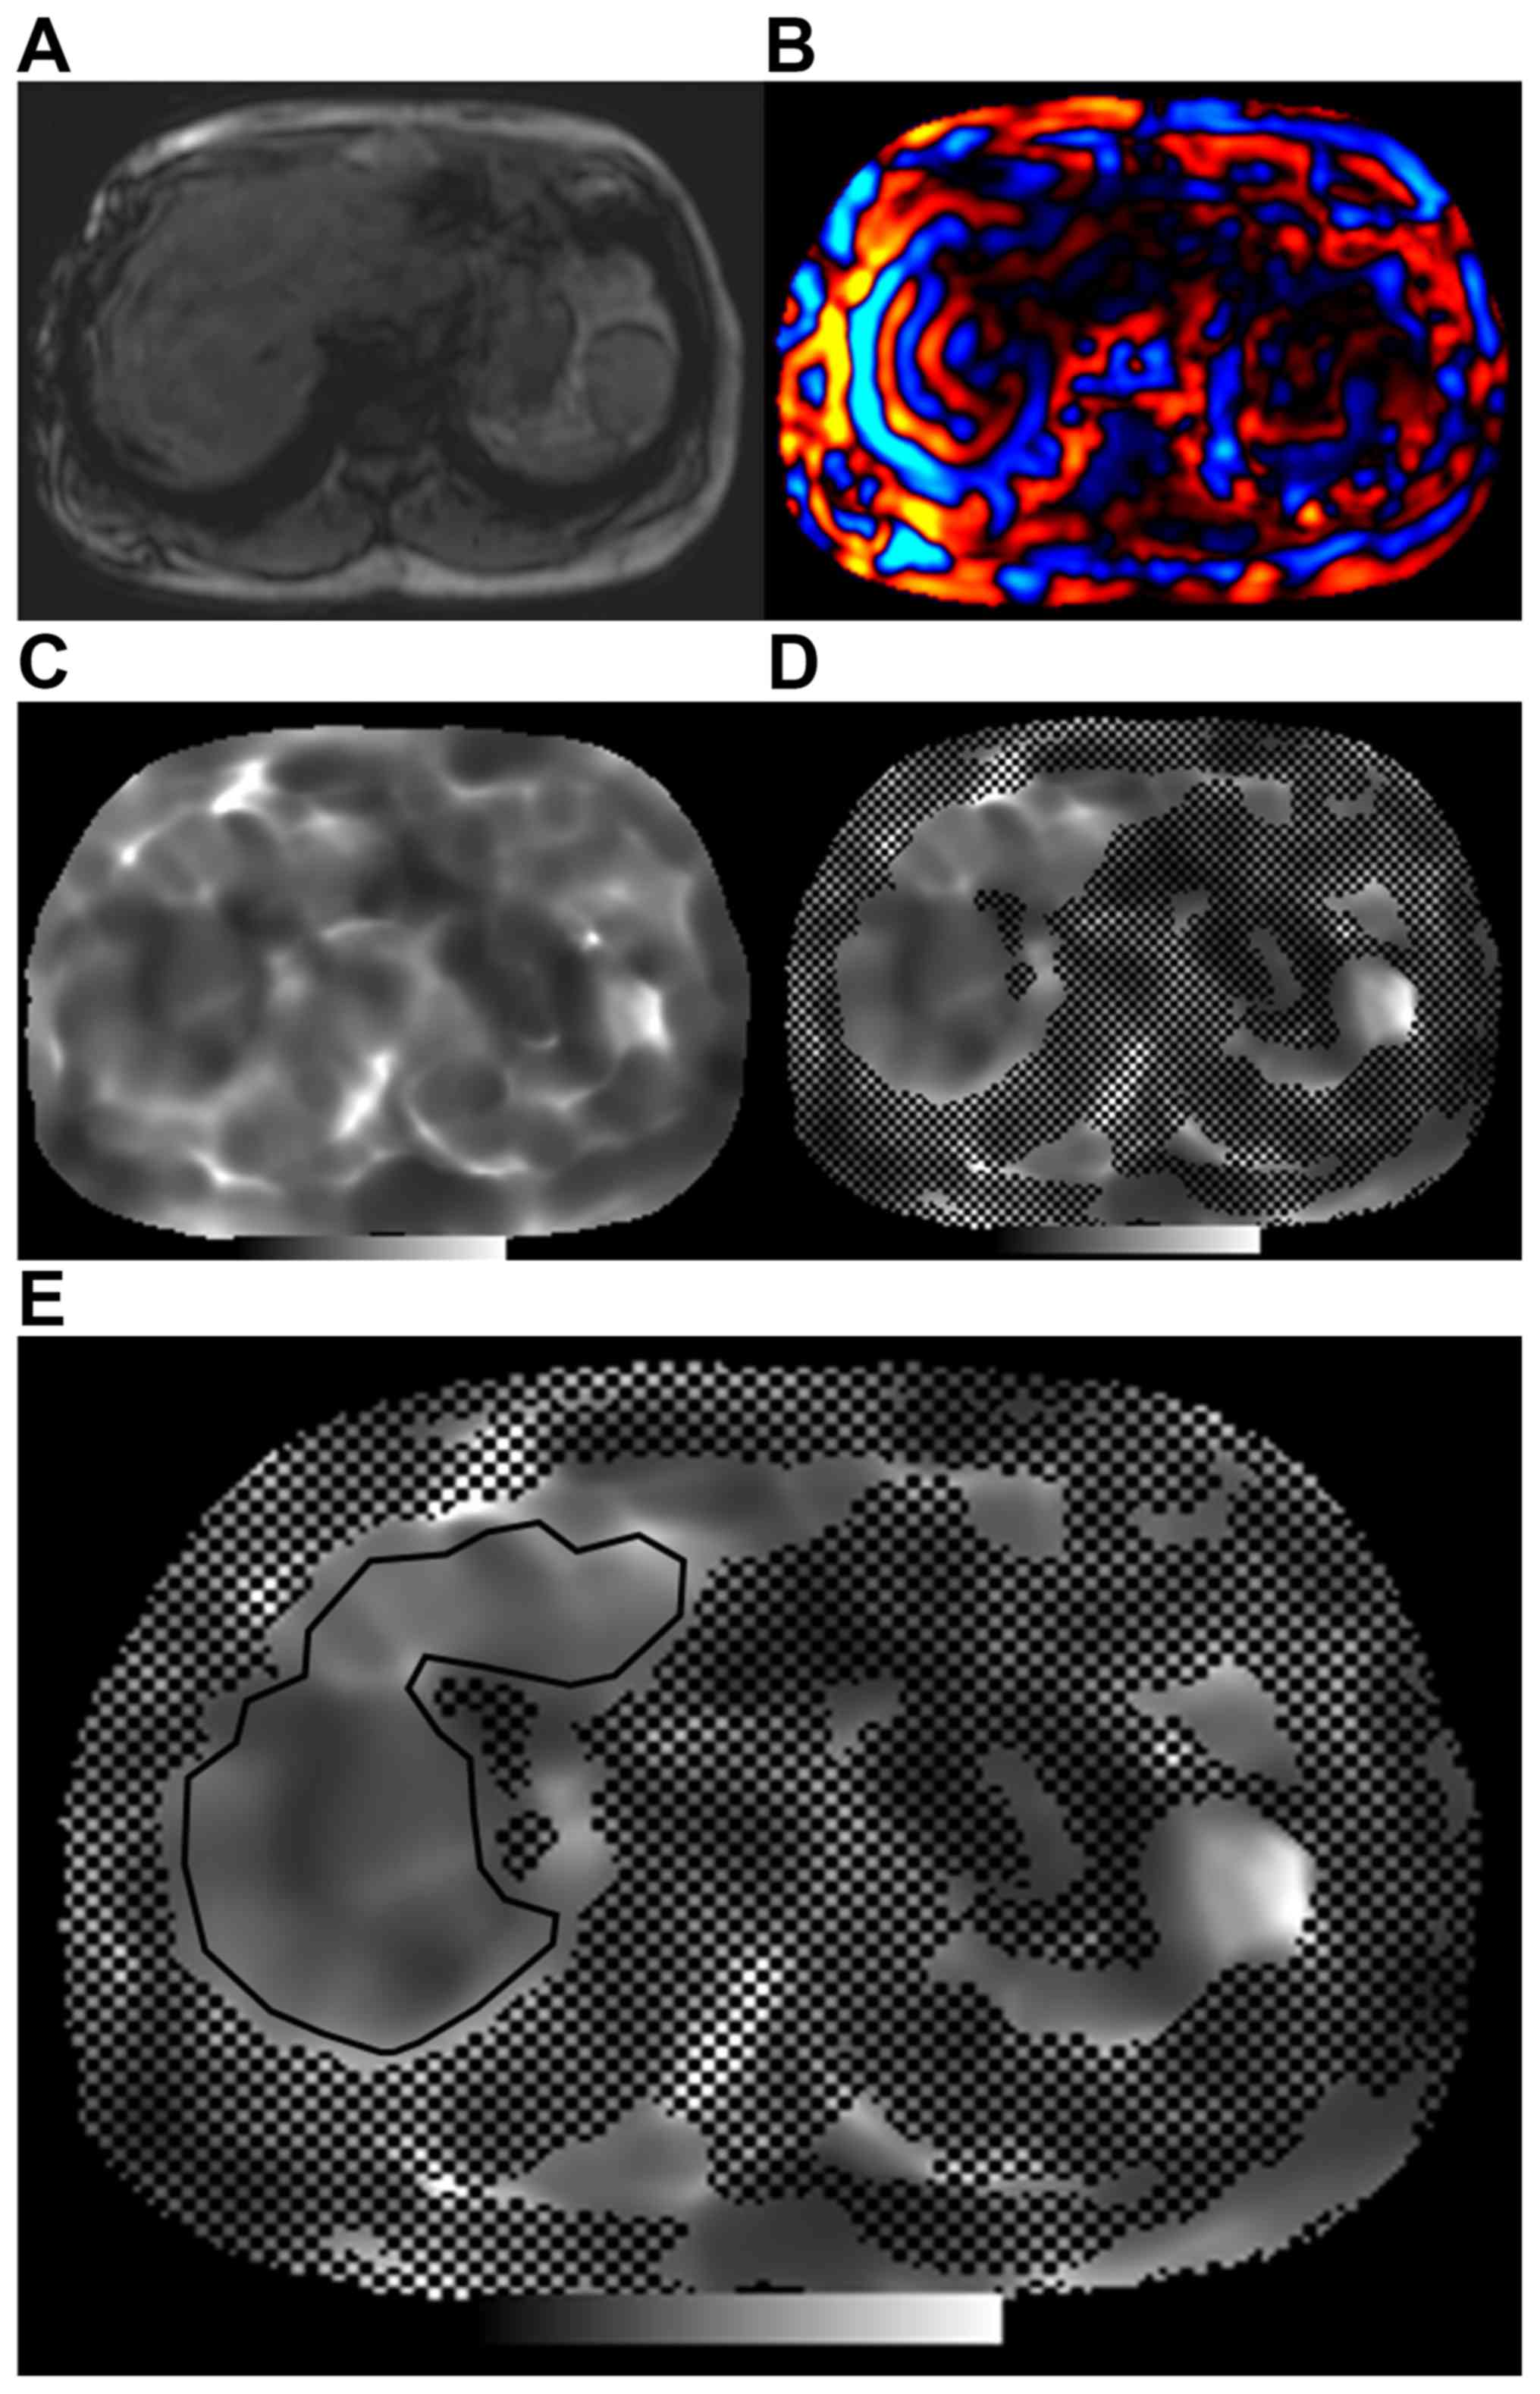
histopathological results. Representative images are displayed in
Fig. 2. Fig. 2A provides liver anatomic information
from an MRE slice. Fig. 2B is a wave
image revealing the pattern of a propagating wave. The two
preliminary steps of measurement of liver stiffness were as
follows: First, wave images were evaluated for adequate wave
quality. Poor propagating imaging was not applied if there was a
presence of a reflective wave, disturbing wave or artifact.
Furthermore, the areas of the liver with poorly propagating waves
were not included. Using the software of the MR unit (MAGNETOM
Aera, Skyra and Avantofit, VE11; Siemens Healthineers), elastograms
of the MRE slices were generated (Fig.
2C). The elastograms were developed automatically by the
intrinsic software to produce the confidence maps (Fig. 2D); the areas without black spots
indicate the reliability of the liver stiffness measurement at each
voxel. Therefore, the region of interest was manually drawn to
include only the parenchyma of the liver on the confidence maps
(Fig. 2E). Artifacts including the
liver border, hepatic tumors, wave interference and large blood
vessels were avoided. The mean stiffness value (in kPa) for each
elastography image (five slices per patient) was recorded. The
overall mean stiffness value of the liver parenchyma was calculated
by averaging the mean stiffness values of the five slices for each
patient.
Histopathologic analysis
For each patient, five different sections of
non-tumoral tissue from the resected specimen were used for
histologic examination. The size of histopathologic specimens was
determined as the largest tumor diameter plus a free margin of at
least 1 cm. All surgical specimens were analyzed by one pathologist
with >10 years of clinical experience in interpreting hepatic
histology. The pathologist was blinded to the MRE results and serum
WFA+-M2BP levels, as well as the clinical data. After
the tissue was sampled, it was fixed in 10% neutral buffered
formalin in room temperature at ≤12 h and embedded in paraffin. The
samples were deparaffinized, and rehydrated usingthrough xylene and
a descending ethanol series and subjected to standard techniques of
H&E and Masson trichrome staining. For each patient, the
pathologist recorded histologic findings, including the percentage
of fat deposition, fibrosis pattern, pattern of necrosis (focal,
piecemeal or bridging necrosis) and evidence of portal inflammation.
Fibrosis stage (F grade) was assessed using the METAVIR scoring
system (7). Fibrosis stage was
graded on a scale of 0 to 4 as follows: F0, no fibrosis; F1, mild
fibrosis, portal fibrosis without septa; F2, substantial fibrosis,
portal fibrosis with few septa; F3, moderate to advanced fibrosis,
numerous septa without cirrhosis; and F4, cirrhosis.
Measurement of serum
WFA+-M2BP
Serum samples were collected at the time-point of
the MRE measurement. The WFA+-M2BP levels were
quantified by a lectin antibody sandwich immunoassay using an
automated analyzer (HISCL-800 Sysmex Co.) (8). The WFA+-M2BP values
conjugated to WFA were indexed with scored values using the
following equation (8,9):
Cutoff index=[(WFA+-M2BP)
sample-(WFA+-M2BP) NC]/[(WFA+-M2BP)
PC-(WFA+-M2BP) NC] where [WFA+-M2BP] sample
is the WFA+-M2BP level in the serum sample, PC is the
positive control and NC is the negative control. The positive
control was supplied by the manufacturer as a calibration solution
preliminarily standardized to yield a cutoff value of 1.0.
Statistical analyses
Continuous variables, including age and laboratory
test results, are expressed as the mean ± standard deviation.
Pearson's correlation coefficient was determined to examine the
association between serum WFA+-M2BP levels and the BMI.
A receiver operating characteristic (ROC) curve analysis, which was
performed by plotting sensitivity against 1-specificity, and the
highest Youden index (the highest sensitivity + specificity) were
used to determine the optimal cutoff values for MRE average and
WFA+-M2BP level. The area under the ROC curve (AUC) was
determined to evaluate the diagnostic accuracy for different stages
of hepatic fibrosis in the total cohort and in subgroups of
patients with chronic hepatitis B (HBV) or HCV infection. Using the
approach of DeLong et al (10), the statistical significance of the
difference between two AUCs was evaluated. P<0.05 was considered
to indicate statistical significance. All statistical analyses were
performed with MedCalc for Windows, version 16.8.4 (MedCalc
Software bvba).
Results
Patient characteristics
A total of 238 patients were enrolled in the present
study. The clinical characteristics of the patients are presented
in Table I. The mean age of the
patients with HCC patients was 61.66±11.12 years (193 males and 45
females). According to the Metavir scores (F0-F4), 7 had no
evidence of fibrosis (F0), 32 had mild fibrosis (F1), 60 presented
with substantial fibrosis (F2), 55 had advanced fibrosis without
evidence of cirrhosis (F3) and 84 had cirrhosis (F4). Among the
enrolled patients, 135 had chronic HBV, 75 had HCV, 12 had combined
chronic HBV and HCV, 13 had alcoholic liver disease and 3 had
cryptogenic causes resulting in liver fibrosis. The mean BMI was
24.70±3.53. The serum WFA+-M2BP level was not
significantly correlated with the BMI (r=0.021; P=0.752). No
steatosis was identified in 121 patients, 99 patients had mild
steatosis, moderate steatosis was identified in 14 patients and 4
patients had severe steatosis.
 | Table IClinical characteristics of the
patients enrolled in the present study (n=238). |
Table I
Clinical characteristics of the
patients enrolled in the present study (n=238).
| Parameter | Total number of
patients |
|---|
| Age (years) | 61.66±11.12 |
| BMI
(kg/m2) | 24.70±3.53 |
| Gender | |
|
Male | 193 (81.1) |
|
Female | 45 (18.9) |
| Underlying
disease | |
|
HBV | 135 (56.7) |
|
HCV | 75 (31.5) |
|
HBV+HCV | 12 (5.0) |
|
Alcoholic
liver disease | 13 (5.5) |
|
Cryptogenic
causes | 3 (1.3) |
| METAVIR score
(%) | |
|
0 | 7 (2.9) |
|
1 | 32 (13.4) |
|
2 | 60 (25.2) |
|
3 | 55 (23.1) |
|
4 | 84 (35.3) |
| Hepatic
steatosisa | |
|
0 | 121 (50.8) |
|
1 | 99 (41.6) |
|
2 | 14 (5.9) |
|
3 | 4 (1.7) |
| AST (U/l) | 65.34±67.82 |
| ALT (U/l) | 58.64±54.31 |
| Bilirubin
(mg/d) | 0.85±0.40 |
| PLT
(103/µl) | 174.01±71.25 |
| APTT (sec) | 32.82±4.62 |
| PT (sec) | 11.41±1.09 |
| INR | 1.10±0.59 |
| Necroinflammatory
activity | |
|
No | 83 (34.9) |
|
Yes | 155 (65.1) |
| WFA+-M2BP
(C.O.I.) | 1.74±1.58 |
| MRE average
(kPa) | 3.82±1.22 |
Application of MRE and
WFA+-M2BP predicting to predict hepatic fibrosis
stage
ROC curve analysis was used to estimate the cutoff
value, sensitivity and specificity of MRE and serum
WFA+-M2BP in predicting each fibrosis stage. The results
are summarized in Tables II and
III, respectively. With a liver
stiffness cutoff value of 3.762 kPa, MRE yielded a sensitivity of
66.91%, a specificity of 95.96% and an AUC of 0.886 for predicting
≥F2 in the total cohort of 238 patients. Its predictive ability was
statistically significant (P<0.001), and similar results were
also observed for the prediction of stages ≥F3 and F4. Similar
results for estimating each fibrosis stage were also obtained in
the HBV and HCV subgroups. With a cutoff value of 1.32,
WFA+-M2BP had a sensitivity of 58.99%, a specificity of
67.68% and an AUC of 0.649 for predicting stage ≥F2 in all
patients, and the predictive ability was statistically significant.
Similar results were obtained for predicting stages ≥F3 and F4,
even in the HBV and HCV subgroups. However, there was no
significant difference between F0-1 and F2-4 in the total cohort
and in the HCV subgroup, and there was also no significance for
differentiating F0-1 from F2-4 and F0-2 from F3-4 in the HBV
subgroup. In Table IV, the HBV
subgroup was divided into two groups according to the level of
alanine aminotransferase (ALT; ≥40 mg/dl vs. <40 mg/dl). In the
HBV subgroup with ≥40 mg/dl of ALT, WFA+-M2BP was able
to significantly to distinguish fibrosis stage F4 from F0-3 with a
cutoff value of 1.41 (P=0.007). Conversely, in the HBV subgroup
with <40 mg/dl of ALT, WFA+-M2BP was not able to
significantly differentiate between patients with each fibrosis
stage as F0-3 and those with F4.
| Table IIDiagnostic performance of MR
elastography in the estimation of the liver fibrosis stage using
receiver operating characteristic analysis. |
Table II
Diagnostic performance of MR
elastography in the estimation of the liver fibrosis stage using
receiver operating characteristic analysis.
|
Cohort/comparison | Cut-off value | AUC | 95% CI | Sensitivity | Specificity | P-value |
|---|
| Total (n=238) |
|
F0-F1 vs.
F2-F4 | 3.158 | 0.898 | 0.853-0.934 | 77.39 | 89.74 | <0.001 |
|
F0-F2 vs.
F3-F4 | 3.762 | 0.886 | 0.839-0.923 | 66.91 | 95.96 | <0.001 |
|
F0-F3 vs.
F4 | 3.983 | 0.904 | 0.859-0.938 | 85.71 | 88.31 | <0.001 |
| HBV (n=135) |
|
F0-F1 vs.
F2-F4 | 2.768 | 0.879 | 0.812-0.929 | 93.22 | 76.47 | <0.001 |
|
F0-F2 vs.
F3-F4 | 3.668 | 0.862 | 0.792-0.915 | 63.75 | 94.55 | <0.001 |
|
F0-F3 vs.
F4 | 3.893 | 0.843 | 0.770-0.900 | 75.51 | 87.21 | <0.001 |
| HCV (n=75) |
|
F0-F1 vs.
F2-F4 | 3.432 | 0.912 | 0.823-0.965 | 72.31 | 100.00 | <0.001 |
|
F0-F2 vs.
F3-F4 | 3.768 | 0.879 | 0.783-0.943 | 69.39 | 96.15 | <0.001 |
|
F0-F3 vs.
F4 | 3.900 | 0.975 | 0.909-0.997 | 100.00 | 87.50 | <0.001 |
| Table IIIDiagnostic performance of serum
Wisteria floribunda agglutinin-positive Mac-2-binding protein
in the estimation of the liver fibrosis stage using receiver
operating characteristic analysis. |
Table III
Diagnostic performance of serum
Wisteria floribunda agglutinin-positive Mac-2-binding protein
in the estimation of the liver fibrosis stage using receiver
operating characteristic analysis.
|
Cohort/comparison | Cut-off value | AUC | 95% CI | Sensitivity | Specificity | P-value |
|---|
| Total (n=238) |
|
F0-F1 vs.
F2-F4 | 1.11 | 0.579 | 0.513-0.642 | 60.30 | 64.10 | 0.088 |
|
F0-F2 vs.
F3-F4 | 1.32 | 0.649 | 0.585-0.710 | 58.99 | 67.68 | <0.001 |
|
F0-F3 vs.
F4 | 1.32 | 0.657 | 0.592-0.717 | 64.29 | 61.04 | <0.001 |
| HBV (n=135) |
|
F0-F1 vs.
F2-F4 | 1.11 | 0.566 | 0.478-0.651 | 52.54 | 76.47 | 0.346 |
|
F0-F2 vs.
F3-F4 | 1.19 | 0.593 | 0.506-0.677 | 55.00 | 67.27 | 0.060 |
|
F0-F3 vs.
F4 | 1.07 | 0.617 | 0.529-0.699 | 65.31 | 55.81 | 0.023 |
| HCV (n=75) |
|
F0-F1 vs.
F2-F4 | 2.21 | 0.622 | 0.503-0.732 | 46.15 | 90.00 | 0.143 |
|
F0-F2 vs.
F3-F4 | 2.21 | 0.755 | 0.642-0.847 | 59.18 | 92.31 | <0.001 |
|
F0-F3 vs.
F4 | 2.45 | 0.728 | 0.613-0.825 | 59.26 | 79.17 | 0.001 |
| Table IVSerum WFA+-M2BP
performance in estimating the liver fibrosis stage among patients
with hepatitis B virus infection (n=135) using ROC analysis. |
Table IV
Serum WFA+-M2BP
performance in estimating the liver fibrosis stage among patients
with hepatitis B virus infection (n=135) using ROC analysis.
|
Cohort/comparison | Cut-off value | AUC | 95% CI | Sensitivity | Specificity | P-value |
|---|
| ALT ≥40 (n=63) |
|
F0-F1 vs.
F2-F4 | 1.11 | 65.8 | 0.528-0.773 | 66.07 | 71.43 | 0.182 |
|
F0-F2 vs.
F3-F4 | 1.32 | 63.4 | 0.503-0.752 | 62.50 | 69.57 | 0.067 |
|
F0-F3 vs.
F4 | 1.41 | 68.9 | 0.560-0.799 | 62.96 | 75.00 | 0.007 |
| ALT<40
(n=72) |
|
F0-F1 vs.
F2-F4 | 1.02 | 52.1 | 0.400-0.640 | 56.45 | 20.00 | 0.816 |
|
F0-F2 vs.
F3-F4 | 0.91 | 56.1 | 0.439-0.677 | 55.00 | 65.62 | 0.381 |
|
F0-F3 vs.
F4 | 0.98 | 53.5 | 0.414-0.653 | 54.55 | 62.00 | 0.641 |
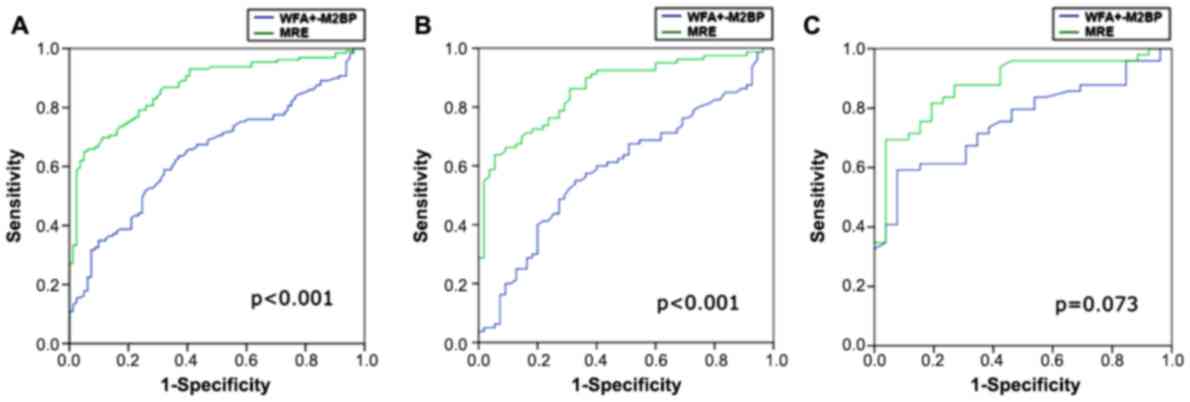
Comparison of diagnostic ability
between MRE and WFA+-M2BP
The diagnostic performance of WFA+-M2BP
to distinguish between fibrosis stages F0-2 and F3-4 by using ROC
curve analysis was compared with that of MRE (Table V and Fig.
3). The prediction had statistical significance for the total
cohort and the HBV subgroup, and in each case, MRE had a
significantly larger AUC than WFA+-M2BP for detecting
severe fibrosis (≥F3). A similar result was obtained in the HCV
subgroup, with a larger AUC for MRE (0.88) than that for
WFA+-M2BP (0.76), although there was no significant
difference.
| Table VComparison of the diagnostic
performance MRE and WFA+-M2BP in the prediction of liver
fibrosis stage ≥F3 (F0-F2 vs. F3-F4) using ROC analysis. |
Table V
Comparison of the diagnostic
performance MRE and WFA+-M2BP in the prediction of liver
fibrosis stage ≥F3 (F0-F2 vs. F3-F4) using ROC analysis.
|
Cohort/modality | Cut-off value | AUC | 95% CI | Sensitivity | Specificity | P-value | Difference between
areas (MRE vs. Mac 2) | P-value |
|---|
| Total (n=238) | | | | | | | 0.237 | <0.001 |
|
MRE | 3.76 | 0.886 | 0.839-0.923 | 66.91 | 95.96 | <0.001 | | |
|
WFA+-M2BP | 1.32 | 0.649 | 0.585-0.710 | 58.99 | 67.68 | <0.001 | | |
| HBV (n=135) | | | | | | | 0.268 | <0.001 |
|
MRE | 3.67 | 0.862 | 0.792-0.915 | 63.75 | 94.55 | <0.001 | | |
|
WFA+-M2BP | 1.19 | 0.593 | 0.506-0.677 | 55.00 | 67.27 | 0.060 | | |
| HCV (n=75) | | | | | | | 0.124 | 0.073 |
|
MRE | 3.77 | 0.879 | 0.783-0.943 | 69.39 | 96.15 | <0.001 | | |
|
WFA+-M2BP | 2.21 | 0.755 | 0.642-0.847 | 59.18 | 92.31 | <0.001 | | |
Discussion
The present results revealed that serum
WFA+-M2BP had a better diagnostic performance for
determining severe hepatic fibrosis (≥F3) in patients with HCV
infection (AUC, 0.76) than in patients with chronic HBV infection
(AUC, 0.59). Among patients with HBV infection, there was no
statistically significant difference except for in the subgroup of
advanced hepatic fibrosis stage (≥F4). Similar results were
obtained for MRE (AUC, 0.88 for HCV) and there was no statistically
significant difference from the diagnostic value of
WFA+-M2BP (P=0.073). However, in the entire study group
and the HBV subgroup, the diagnostic performance of
WFA+-M2BP in detecting severe fibrosis was significantly
lower than that of MRE (P<0.001). Kuno et al (9) first described the use of serum
WFA+-M2BP as a non-invasive biomarker for hepatic
fibrosis and it now serves as a reliable serum biomarker. Toshima
et al (11) reported that the
AUC value for using WFA+-M2BP to predict the hepatic
fibrosis stage was similar to that for ARFI and the diagnostic
performance of WFA+-M2BP is superior to that of other
surrogate markers, including the aspartate
aminotransferase-to-platelet ratio index. WFA+-M2BP is
also useful for evaluating liver fibrosis in patients with
non-alcoholic fatty liver disease (12), autoimmune hepatitis (13), primary biliary cirrhosis (14) and biliary atresia (15). The present study also demonstrated
that serum WFA+-M2BP had satisfactory results in
determining severe hepatic fibrosis (≥F3) in patients with chronic
liver disease (AUC, 0.65) and even in the HCV subgroup (AUC,
0.76).
In the present study, it was determined that the AUC
for WFA+-M2BP serum levels in the prediction of fibrosis
stages ≥F3 was 0.65 in the total cohort, 0.59 in the HBV subgroup
and 0.76 in the HCV subgroup. These AUC values were similar to the
results of prior studies only for patients with HCV infection and
the AUCs for predicting patients with chronic HBV infection were
lower than those in the previous studies. Toshima et al
(11) determined that the stage of
hepatic fibrosis may be accurately estimated using the serum levels
of WFA+-M2BP, with an AUC of 0.81 in determining an
advanced histologic stage (≥F3), an AUC of 0.80 in the HCV subgroup
and an AUC of 0.62 in the HBV subgroup. Their study included only a
few patients with fibrosis stage F3 (n=16) and HBV infection
(n=21). Nishikawa et al (16)
reported an AUC of 0.72 for determining severe fibrosis in the HBV
subgroup (111 patients) and an AUC of 0.83 in the HCV subgroup (275
patients). The reasons for the discrepancy remain elusive, but they
may be due to different patient numbers in the HBV and HCV
subgroups, as well as differences in viral activity and fibrosis
period. Further validation will be required in future studies.
Furthermore, percutaneous liver needle biopsy performed for
assessing the hepatic fibrosis stage in the study by Nishikawa
et al (16) may have been
associated with sampling errors, although numerous patients with
HBV and HCV were enrolled. However, the present results suggest
that the diagnostic performance of serum WFA+-M2BP is
more accurate in HCV patients than in HBV patients and caution
should be taken when using WFA+-M2BP to assess the
degree of liver fibrosis in patients with HBV.
In the present study, the AUC value for serum
WFA+-M2BP was higher in patients with HCV infection than
in patients with HBV infection and the same trend was observed for
MRE. However, the serum WFA+-M2BP value demonstrated a
better diagnostic performance in distinguishing between fibrosis
stages F0-3 and F4 in patients with HBV and ≥40 mg/dl of ALT than
in patients with HBV and <40 mg/dl of ALT. ALT levels are
important to characterize the phase of infection (17). A higher ALT level is indicative of a
more severe inflammatory condition that may contribute to more
advanced fibrosis and is associated with a better diagnostic
accuracy of serum WFA+-M2BP.
Nishikawa et al (16) observed a similar phenomenon and
reported higher cut-off points of WFA+-M2BP levels for
identifying F4, ≥F3 and ≥F2 in their HCV subgroup compared to their
HBV subgroup, with a significant difference even for the same
degree of liver fibrosis. This may be due to different patterns of
liver fibrosis between HBV and HCV, as the presence of thicker
fibrotic septa in HCV results in a larger amount of fibrotic tissue
(18) and in patients with hepatitis
C infection, it may also be faster progression of hepatic lesions
compared with in patients with hepatitis B, which is a result of
continuous viral replication, inflammation and fibrogenesis after
disease progression to cirrhosis (18). Conversely, inflammation was reported
to become inactive in most cases with advanced hepatic fibrosis, as
HBe seroconversion leads to termination of the progression of liver
fibrosis (19,20). Further studies are required to
evaluate the individual cutoff values in other etiologies of
chronic liver disease.
Blood sampling to obtain serum WFA+-M2BP
levels is a convenient and non-invasive method for evaluating
advanced hepatic fibrosis in patients with chronic liver disease.
Based on the present study, the diagnostic ability is similar to
that of MRE, particularly in patients with chronic hepatitis. In
contrast to MR, the assessment time is short and claustrophobia is
not an issue. Furthermore, owing to its simple and reproducible
characteristics, MRE may be applied to period surveillance under
antiviral therapy of chronic hepatitis. The American Association
for the Study of Liver Diseases guidelines also concluded that the
patients at the highest risk of liver-associated complications,
including HCV with advanced hepatic fibrosis, benefit from
treatment (21). Therefore, serum
WFA+-M2BP levels may be used for periodic surveillance
of patients with advanced liver disease who are not able to receive
treatment immediately.
Of note, the present study had several limitations.
It was a retrospective study and there was low statistical power
due to the different case numbers of each etiology of chronic liver
disease. In particular, the HBV and HCV subgroups had 135 and 75
patients, respectively. A prospective study may be required for
further clarification. In addition, the patients of the present
study were diagnosed with liver tumors and received hepatectomy.
The hepatic fibrosis stage was determined based on the normal
peritumoral liver tissue in the surgical specimen; assessment of
the whole liver fibrosis stage may be performed in a future
study.
In conclusion, the diagnostic accuracy of serum
WFA+-M2BP is reliable and comparable to that of MRE in
determining severe hepatic fibrosis associated with chronic liver
disease. Owing to its rapid, simple and non-invasive measurement,
serum WFA+-M2BP may be useful in the initial screening
and therapeutic follow-up for patients with chronic liver disease
and most suitable for the patient with hepatitis C infection.
Supplementary Material
Table SI. Correlation between serum
WFA+-M2BP level and BMI.
Acknowledgements
The authors would like to express gratitude to the
pathologist (Dr. Hui-Ting Hsu, Department of Surgical Pathology,
Changhua Christian Hospital, Changhua, Taiwan) for her assistance
with the interpretation of the hepatic histology data.
Funding
No funding was received.
Availability of data and materials
The datasets used and/or analyzed during the current
study are available from the corresponding author on reasonable
request.
Authors' contributions
KLW, YLC, CJK, PYL and CTC contributed to the study
conception. KLW, YLC and CTC drafted the manuscript. CJK, PYL and
CTC contributed to the study design, analysis and interpretation of
data. KLW, YLC and CTC critically revised the manuscript for
important intellectual content. All authors read and approved the
final manuscript.
Ethics approval and consent to
participate
All procedures followed were in accordance with the
ethical standards of the responsible committee on human
experimentation (Changhua Christian Hospital, Changhua, Taiwan) and
with the Helsinki Declaration of 1964 and later versions.
Institutional Review Board approval was obtained from Changhua
Christian Hospital (Changhua, Taiwan; approval dated 20 May
2016).
Patient consent for publication
Not applicable.
Competing interests
The authors declare that they have no competing
interests.
References
|
1
|
Barr RG, Ferraioli G, Palmeri ML, Goodman
ZD, Garcia-Tsao G, Rubin J, Garra B, Myers RP, Wilson SR, Rubens D
and Levine D: Elastography assessment of liver fibrosis: Society of
radiologists in ultrasound consensus conference statement.
Radiology. 276:845–861. 2015.PubMed/NCBI View Article : Google Scholar
|
|
2
|
Marcellin P, Gane E, Buti M, Afdhal N,
Sievert W, Jacobson IM, Washington MK, Germanidis G, Flaherty JF,
Aguilar Schall R, et al: Regression of cirrhosis during treatment
with tenofovir disoproxil fumarate for chronic hepatitis B: A
5-year open-label follow-up study. Lancet. 381:468–475.
2013.PubMed/NCBI View Article : Google Scholar
|
|
3
|
Bedossa P, Dargère D and Paradis V:
Sampling variability of liver fibrosis in chronic hepatitis C.
Hepatology. 38:1449–1457. 2003.PubMed/NCBI View Article : Google Scholar
|
|
4
|
Cui J, Heba E, Hernandez C, Haufe W,
Hooker J, Andre MP, Valasek MA, Aryafar H, Sirlin CB and Loomba R:
Magnetic resonance elastography is superior to acoustic radiation
force impulse for the diagnosis of fibrosis in patients with
biopsy-proven nonalcoholic fatty liver disease: A prospective
study. Hepatology. 63:453–461. 2016.PubMed/NCBI View Article : Google Scholar
|
|
5
|
Toshima T, Shirabe K, Takeishi K, Motomura
T, Mano Y, Uchiyama H, Yoshizumi T, Soejima Y, Taketomi A and
Maehara Y: New method for assessing liver fibrosis based on
acoustic radiation force impulse: A special reference to the
difference between right and left liver. J Gastroenterol.
46:705–711. 2011.PubMed/NCBI View Article : Google Scholar
|
|
6
|
Ito K, Murotani K, Nakade Y, Inoue T,
Nakao H, Sumida Y, Kamada Y and Yoneda M: Serum Wisteria floribunda
agglutinin-positive Mac-2-binding protein levels and liver
fibrosis: A meta-analysis. J Gastroenterol Hepatol. 32:1922–1930.
2017.PubMed/NCBI View Article : Google Scholar
|
|
7
|
Bedossa P and Poynard T: An algorithm for
the grading of activity in chronic hepatitis C. Hepatology.
24:289–293. 1996.PubMed/NCBI View Article : Google Scholar
|
|
8
|
Kuno A, Sato T, Shimazaki H, Unno S,
Saitou K, Kiyohara K, Sogabe M, Tsuruno C, Takahama Y, Ikehara Y
and Narimatsu H: Reconstruction of a robust glycodiagnostic agent
supported by multiple lectin-assisted glycan profiling. Proteomics
Clin Appl. 7:642–647. 2013.PubMed/NCBI View Article : Google Scholar
|
|
9
|
Kuno A, Ikehara Y, Tanaka Y, Ito K,
Matsuda A, Sekiya S, Hige S, Sakamoto M, Kage M, Mizokami M and
Narimatsu H: A serum ‘sweet-doughnut’ protein facilitates fibrosis
evaluation and therapy assessment in patients with viral hepatitis.
Sci Rep. 3(1065)2013.PubMed/NCBI View Article : Google Scholar
|
|
10
|
DeLong ER, DeLong DM and Clarke-Pearson
DL: Comparing the areas under two or more correlated receiver
operating characteristic curves: A nonparametric approach.
Biometrics. 44:837–845. 1988.PubMed/NCBI
|
|
11
|
Toshima T, Shirabe K, Ikegami T, Yoshizumi
T, Kuno A, Togayachi A, Gotoh M, Narimatsu H, Korenaga M, Mizokami
M, et al: A novel serum marker, glycosylated Wisteria floribunda
agglutinin-positive Mac-2 binding protein (WFA(+)-M2BP), for
assessing liver fibrosis. J Gastroenterol. 50:76–84.
2015.PubMed/NCBI View Article : Google Scholar
|
|
12
|
Abe M, Miyake T, Kuno A, Imai Y, Sawai Y,
Hino K, Hara Y, Hige S, Sakamoto M, Yamada G, et al: Association
between Wisteria floribunda agglutinin-positive Mac-2 binding
protein and the fibrosis stage of non-alcoholic fatty liver
disease. J Gastroenterol. 50:776–784. 2015.PubMed/NCBI View Article : Google Scholar
|
|
13
|
Nishikawa H, Enomoto H, Iwata Y, Hasegawa
K, Nakano C, Takata R, Nishimura T, Yoh K, Aizawa N, Sakai Y, et
al: Clinical significance of serum Wisteria floribunda agglutinin
positive Mac-2-binding protein level and high-sensitivity
C-reactive protein concentration in autoimmune hepatitis. Hepatol
Res. 46:613–621. 2016.PubMed/NCBI View Article : Google Scholar
|
|
14
|
Umemura T, Joshita S, Sekiguchi T, Usami
Y, Shibata S, Kimura T, Komatsu M, Matsumoto A, Ota M and Tanaka E:
Serum wisteria floribunda agglutinin-positive Mac-2-binding protein
level predicts liver fibrosis and prognosis in primary biliary
cirrhosis. Am J Gastroenterol. 110:857–864. 2015.PubMed/NCBI View Article : Google Scholar
|
|
15
|
Yamada N, Sanada Y, Tashiro M, Hirata Y,
Okada N, Ihara Y, Urahashi T and Mizuta K: Serum Mac-2 binding
protein glycosylation isomer predicts grade F4 liver fibrosis in
patients with biliary atresia. J Gastroenterol. 52:245–252.
2017.PubMed/NCBI View Article : Google Scholar
|
|
16
|
Nishikawa H, Enomoto H, Iwata Y, Kishino
K, Shimono Y, Hasegawa K, Nakano C, Takata R, Nishimura T, Yoh K,
et al: Serum Wisteria floribunda agglutinin-positive Mac-2-binding
protein for patients with chronic hepatitis B and C: A comparative
study. J Viral Hepat. 23:977–984. 2016.PubMed/NCBI View Article : Google Scholar
|
|
17
|
Terrault NA, Bzowej NH, Chang KM, Hwang
JP, Jonas MM and Murad MH: AASLD guidelines for treatment of
chronic hepatitis B. Hepatology. 63:261–283. 2016.PubMed/NCBI View Article : Google Scholar
|
|
18
|
Kage M, Shimamatu K, Nakashima E, Kojiro
M, Inoue O and Yano M: Long-term evolution of fibrosis from chronic
hepatitis to cirrhosis in patients with hepatitis C: Morphometric
analysis of repeated biopsies. Hepatology. 25:1028–1031.
1997.PubMed/NCBI View Article : Google Scholar
|
|
19
|
McMahon BJ: The natural history of chronic
hepatitis B virus infection. Hepatology. 49 (Suppl 5):S45–S55.
2009.PubMed/NCBI View Article : Google Scholar
|
|
20
|
Bedossa P: Reversibility of hepatitis B
virus cirrhosis after therapy: Who and why? Liver Int. 35 (Suppl
1):S78–S81. 2015.PubMed/NCBI View Article : Google Scholar
|
|
21
|
AASLD/IDSA HCV Guidance Panel: Hepatitis C
guidance: AASLD-IDSA recommendations for testing, managing, and
treating adults infected with hepatitis C virus. Hepatology 62:
932-954, 2015.
|