Introduction
Osteoporosis is prevalent in the aging population
and has become a major health threat worldwide. Osteoporotic
fractures can seriously impact the quality of life in certain
patient groups, for example, in post-menopausal women (1). Bone mineral density (BMD) and bone cell
homeostasis are regarded as the two most important risk factors in
fractures (2). Additionally,
aberrant osteoblastic activities, such as depressed osteoblast
maturation, and osteoclastic activities, such as resorption can
significantly influence bone homeostasis. Fracture healing is a
complex biological process that requires interactions amongst a
series of different cell types and includes increasing
differentiation and maturation of osteoblasts and osteoclast
activity in bone remodeling (3).
MicroRNAs (miRNAs/miRs) have been reported as
potential biomarkers of fracture prediction in osteoporotic
patients (4). miRNAs negatively
regulate gene expression through post-transcriptional mechanisms by
endonuclease mediated target mRNA degradation. Numerous studies
have revealed the importance of miRNAs in the regulation of bone
formation, remodeling and homeostasis (5-7). An
increasing quantity of miRNA array data is being uploaded and
stored in the Gene Expression Omnibus (GEO) database. Using the GEO
database, several studies have employed high throughput miRNA
arrays to profile miRNA expression signatures for the purpose of
biomarker identification (8,9). Understanding of miRNA regulation and
biomarker identification in bone metabolism has potential to
significantly benefit miRNA-based therapeutics in bone disease.
Seeliger et al (10),
identified 6 miRNAs upregulated in osteoporotic fracture patients
which included miR-21, miR-23a, miR-24, miR-25, miR-100 and
miR-125b. Garmilla-Ezquerra et al (11), also detected miR-187 and miR-518f as
being differentially expressed between the control and patients
with osteoporotic fractures.
Whilst several studies have focused on miRNA
expression levels in osteoporotic and healthy patients, cross
validation in different cohorts remains challenging and is an under
reported area (6). In osteoporotic
derived fractures, studies have revealed varied miRNA expression
profiles by comparing patients with fractures with healthy controls
and certain reports have performed further validation (12,13). The
aim of the present study was to identify an aberrant miRNA
expression signature in osteoporotic patients with recent
fractures. miRNAs associated with osteoporotic fractures were
identified and were validated across GEO datasets from different
study cohorts. Furthermore, a support vector machine (SVM)
algorithm-based miRNA expression signature model was built to
predict the possibility of fractures in osteoporotic patients.
Materials and methods
Cell culture and reagents
Human hFOB1.19 cells (cat. no. CRL-11372) were
purchased from the American Type Culture Collection. The culture
medium for hFOB1.19 cells was a 1:1 mixture of Ham's F12 Medium and
DMEM (Gibco; Thermo Fisher Scientific, Inc.), supplemented with 2.5
mM L-glutamine (without phenol red; cat no. 25030081; Gibco; Thermo
Fisher Scientific, Inc.), 0.3 mg/ml G418 and 10% FBS. The cells
were cultured in an incubator at 34˚C with 100% humidity at 5%
CO2. Differentiation of hFOB1.19 was performed as
described in a previous study (14).
The sequences of miR-576-3p, miR-135a-5p, miR-576-3p and
miR-135a-5p were as follows: 5'-AAGAUGUGGAAAAAUUGGAAUC-3',
5'-UAUGGCUUUUUAUUCCUAUGUGA-3', 5'-ATTCTA ATGGGCCACGTCTTT-3' and
5'-TATAGGGATACT TAGCCGTGGG-3' respectively. The miRNAs and
anti-sense miRNAs were synthesized and constructed into
pLVX-shRNA2-EGFP-Puro plasmids (controls) by Youbio Technology Co.,
Ltd. using pLVX-shRNA2-miR-576-3p (pLVX-miR-576-3p),
pLVX-shRNA2-miR-576-3p -antisense (pLVX-miR-576-3p-antisense),
pLVX-shRNA2-miR-135a-5p (pLVX-miR-135a-5p),
pLVX-shRNA2-miR-135a-5p- antisense (pLVX-miR-135a-5p-antisense)
vectors. MiRNAs containing plasmids and controls (1 µg/ml) were
transfected using JetPRIME transfection reagent (PloySciences
Inc.), according to the manufacturer's protocol. At 24 h
post-transfection, adherent cells or culture supernatant were ready
for subsequent treatment or collected for further analysis. Plasmid
transfection efficiency was observed using fluorescence microscopy
(magnification, x100; MF43; Micro-shot Technology Co., Ltd) and
images were captured by microscopy-computer system (MShot Image
Analysis System; v1.0; Micro-Shot Technology Co., Ltd).
Cohort of patients and controls
All information and expression data of the patient
cohorts were downloaded from Gene Expression Omnibus database of
the National Center for Biotechnology Information (ncbi.nlm.nih.gov/gds/). In the current study,
according to the GSE70318 dataset, healthy post-menopausal women
without type 2 diabetes were selected as the control group (n=17)
and post-menopausal women with osteoporotic fractures without type
2 diabetes were selected as the experimental group (n=19) (15). The GSE74209 dataset was defined as
validated data, with 6 healthy controls and 6 fracture patients
(8). Data are presented in Table I.
 | Table ISummary of the patients and profile
data from the GSE70318 and GSE74209 datasets. |
Table I
Summary of the patients and profile
data from the GSE70318 and GSE74209 datasets.
| | GSE70318 | GSE74209 |
|---|
| Index | Control | Fracture | Control | Fracture |
|---|
| Number of
patients | 17 | 19 | 6 | 6 |
| Age (years) | 58.10±5.00 | 64.70±5.80 | 72.50±7.42 | 75.16±3.54 |
| Height (cm) | 161.10±5.80 | 162.40±8.20 | - | - |
| Weight (kg) | 68.00±13.70 | 67.20±10.40 | - | - |
| Body mass index
(kg/m2) | 26.00±4.40 | 25.50±3.40 | 26.06±3.25 | 24.38±2.83 |
| Vitamin D (µg/l) | 27.70±12.10 | 42.20±11.60 | - | - |
| Parathyroid hormone
(µg/l) | 39.90±13.50 | 32.30±23.90 | - | - |
| Bone mineral density
(g/cm2) | 0.88±0.13 | 0.83±0.07 | 0.79±0.07 | - |
| Sample source | Serum | Serum | Bone tissue | Bone tissue |
GEO matrix data and data
normalization
Osteoporotic fracture patients and controls derived
from the miRNA matrix dataset, GSE70318(15), were used for initial analysis. An
additional matrix dataset was downloaded, GSE74209(8), for the validation study. Patient
information and serological indices of these datasets are listed in
Table I.
Although the miRNA arrays were performed on
different platforms and completed by different research teams, the
data were normalized for analysis using the geometric mean of the
endogenous controls. In the GEO74209 dataset, none of the
participants had a history of metabolic or endocrine diseases,
chronic renal failure, chronic liver disease, malignancy, Paget's
disease of bone, malabsorption syndrome and did not receive hormone
replacement therapy, anti-resorptive or anabolic agents, oral
corticosteroids, anti-epileptic drugs, or treatment with lithium,
heparin or warfarin (8). Patient
miRNA data were obtained from GEO, which is open access, free and
does not require ethical approval or patient consent. The validated
and predicted target genes of these miRNAs were searched and
collected using online software and database (diana.imis.athena-innovation.gr/DianaTools/index.php?r=tarbase/index).
ROC curve analysis
Receiver operating characteristic (ROC) curve
analysis is a commonly used method to visualize the performance of
a binary classifier and is widely used in biostatistics. For the
evaluation of diagnostic biomarkers, the sensitivity and
specificity are of importance to their applications. Several miRNA
biomarker studies have used the ROC curve method (16,17). In
the present study, miRNA expressions levels in patients with
fractures were compared with healthy controls. Following ROC curve
analysis, the statistical significance and area under the curve
were analyzed for the selected miRNAs and plotted with 95%
confidence intervals (CI) using GraphPad Prism v5.0 (GraphPad
Software, Inc.).
SVM algorithm for classification of
selected miRNAs
An SVM classifier algorithm was applied to determine
the feasibility of fracture prediction using miRNA expression
signatures in osteoporotic patients. The SVM classification
algorithm was finished using MultiExperiment Viewer software (v4.2;
GitHub Inc.) (18). The algorithm
mechanism was completely studied and reported by Maulik and
Chakraborty (19). The SVM algorithm
is capable of reducing the misclassification rate of the miRNAs
through a process of positive and negative filtering which results
in increased accuracy. Briefly, the miRNA expression data were
formatted into columns as raw data and saved as a .txt file. SVM
classification function was chosen in the software menu bar. The
miRNA expression data file was loaded for calculation. The output
results showed the weight index of each miRNA. According to the SVM
algorithm index, miRNA subsets from the training cohort were
selected and combined, parameters were identified for each of the
included miRNAs and the different SVM-based miRNA sets were
compared (after calculation) using ROC curves. A higher value of
area under the ROC curve represented a more accurate SVM
classification. Various miRNA combinations were used until the
highest value for area under the ROC curve was obtained for
fracture prediction, suggesting the highest sensitivity and
specificity for the biomarker signature.
Osteoblast alkaline phosphatase (ALP)
activity
ALP activity of human cultured osteoblasts was
examined using an ALP activity detection kit (cat. no. P0321;
Beyotime Institute of Biotechnology, Inc.). Following stimulation
by 10 ng/ml of transforming growth factor (TGF)-β1 and 4 mM
L-glutamine for 3 days, osteoblasts were treated with miRNA or
miRNA antagonist for 2 days following pre-induction with TGF-β1 and
L-glutamine. ALP activity was determined in the cell culture
supernatants and osteoblasts lysates, according to the
manufacturer's protocol. All standards, test samples and buffers
were pre-warmed to room temperature. A total of 50 µl/well of
p-nitrophenol as a substrate was added to a 96-well plate and 100
µl of standard or unknown samples were mixed well with the
substrate. The 96-well plate was incubated at 37˚C in an incubator
for 10 min and the reaction was stopped by adding 100 µl of stop
solution. The plate was read using a plate reader at a wavelength
of 405 nm (BioTek Synergy 2; BioTek Instruments). ALP activity of
the unknown samples was calculated according to the standard sample
activity divided by the reaction time of 10 min.
Western blotting
Protein expression levels were semi-quantified by
western blotting as described previously (14). Osteoblasts were washed with ice-cold
PBS 3 times before being lysed with ice-cold lysis buffer
supplemented with protease and phosphatase inhibitors. Cell
supernatant was collected after centrifugation at 12, 000 x g at
4˚C for 15 min. A total of ~20 µg/lane samples were loaded onto a
10% SDS gel and resolved using SDS-PAGE. Proteins were transferred
to Hybond C nitrocellulose membrane using a blotting cassette at a
100 v in ice-cold conditions for 60 min. The membrane was blocked
with 5% non-fat milk in TBS-Tween (TBST) at room temperature for 30
min. After blocking, the membrane was incubated with primary
antibodies overnight at 4˚C with slight shaking. A dilution of
1:2,000 in TBST was used for all primary antibody dilution. The
primary antibody used were as follows: CSNK1A1L (cat. no. 2655;
Cell Signaling Technology, Inc.), LRP6 (cat. no. 2560; Cell
Signaling Technology, Inc.), β-catenin (cat. no. 8480; Cell
Signaling Technology, Inc.) and actin (cat. no. sc-376421; Santa
Cruz Biotechnology, Inc.). After washing four times in TBST, the
membrane was probed with horseradish peroxidase-conjugated
secondary antibodies (cat. nos. 111035003 and 115035062; Jackson
ImmunoResearch Inc.; 1:3,000 in TBST) for a further 1 h at room
temperature. Signals were visualized using ECL reagent (GE
Healthcare) and detected using the ChemiDoc XRS gel documentation
system (Bio-Rad Laboratories, Inc.).
Statistical analysis
In the initial miRNA data analysis, comparison
between fracture and healthy control patients was tested using a
Mann-Whitey U-test where P<0.05 was considered to indicate a
statistically significant difference. One-way ANOVA was performed
for comparison of multiple groups and the Bonferroni test was used
for post-hoc analysis. P<0.05 was considered to indicate a
statistically significant difference. In KEGG and GO annotation
analyses, in order to reduce type I errors, a false discovery rate
value of <0.05 and P<0.05 was considered to indicate a
statistically significant difference. All statistical analysis were
performed using SPSS v13.0 (SPSS, Inc.) unless specifically
indicated otherwise in the study.
Results
Aberrant expression of miRNAs in
osteoporotic associated fractures
The GSE70318 dataset was downloaded from the GEO
database which contained the expression levels of 153 miRNAs from
healthy patients and patients with osteoporotic fractures.
Quantification of serum circulating miRNAs was performed in a
custom 384 well panel. Aberrant expression of circulating miRNAs
was quantified as the fold change. To explore the potential for
identification of diagnostic biomarkers, the sensitivity and
specificity were calculated using ROC curves. Before performing ROC
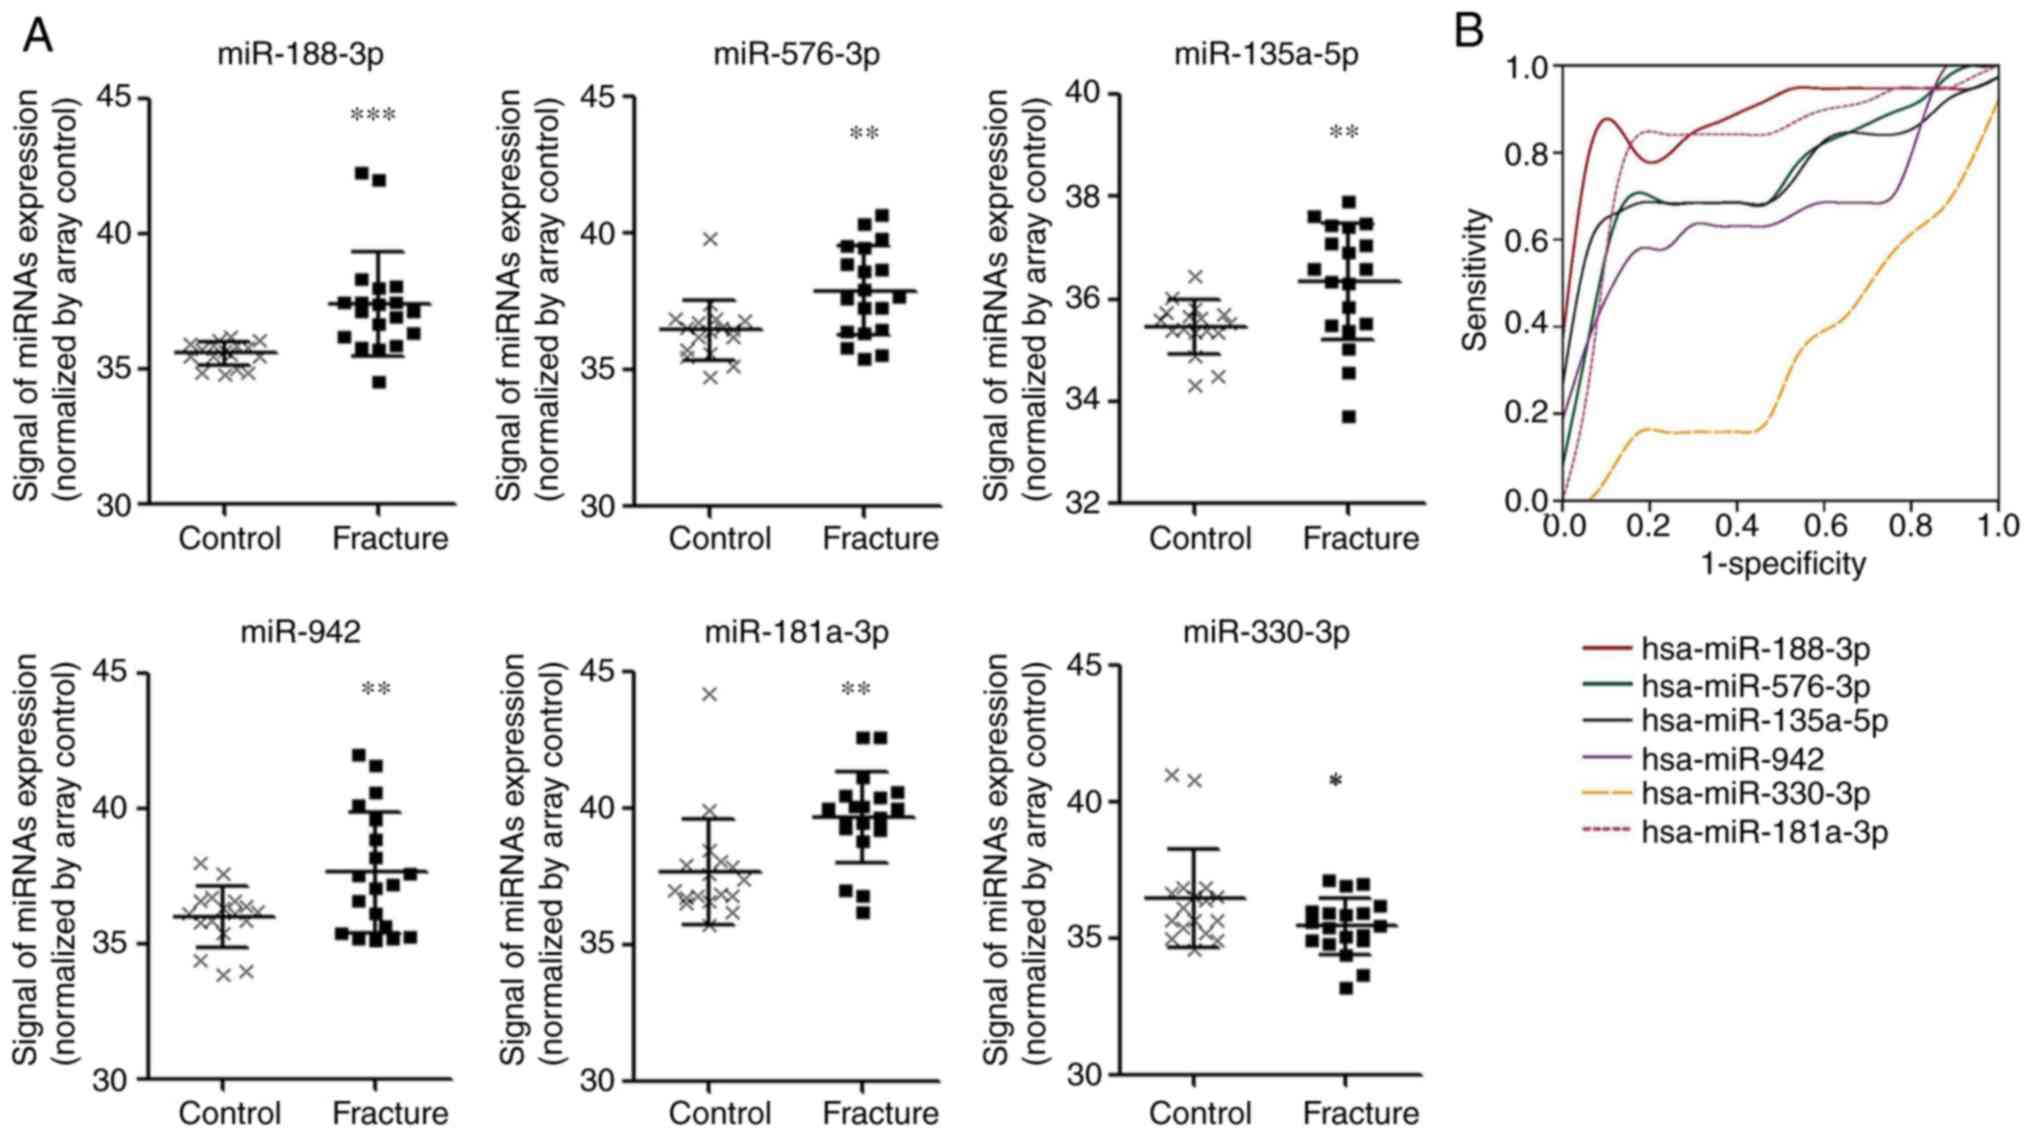
curve analysis, scatter dot plots were generated as shown in
Fig. 1. The results showed that the
expression of miR-188-3p, miR-942-3p, miR-181a-3p, miR-576-3p and
miR-135a-5p were significantly different from the healthy controls
(P<0.01; Fig. 1A). In the ROC
curve and AUC analysis, it was shown that miR-188-3p, miR-942-3p,
miR-576-3p and miR-135a-5p had higher sensitivity (Fig. 1B) and the AUC values were:
miR-188-3p, 0.889; miR-576-3p, 0.751; miR-135a-5p, 0.759;
miR-942-3p, 0.678 miR-181a-3p, 0.817; and miR-330-3p, 0.342.
Female fracture risk factors using ROC
curves and the SVM algorithm
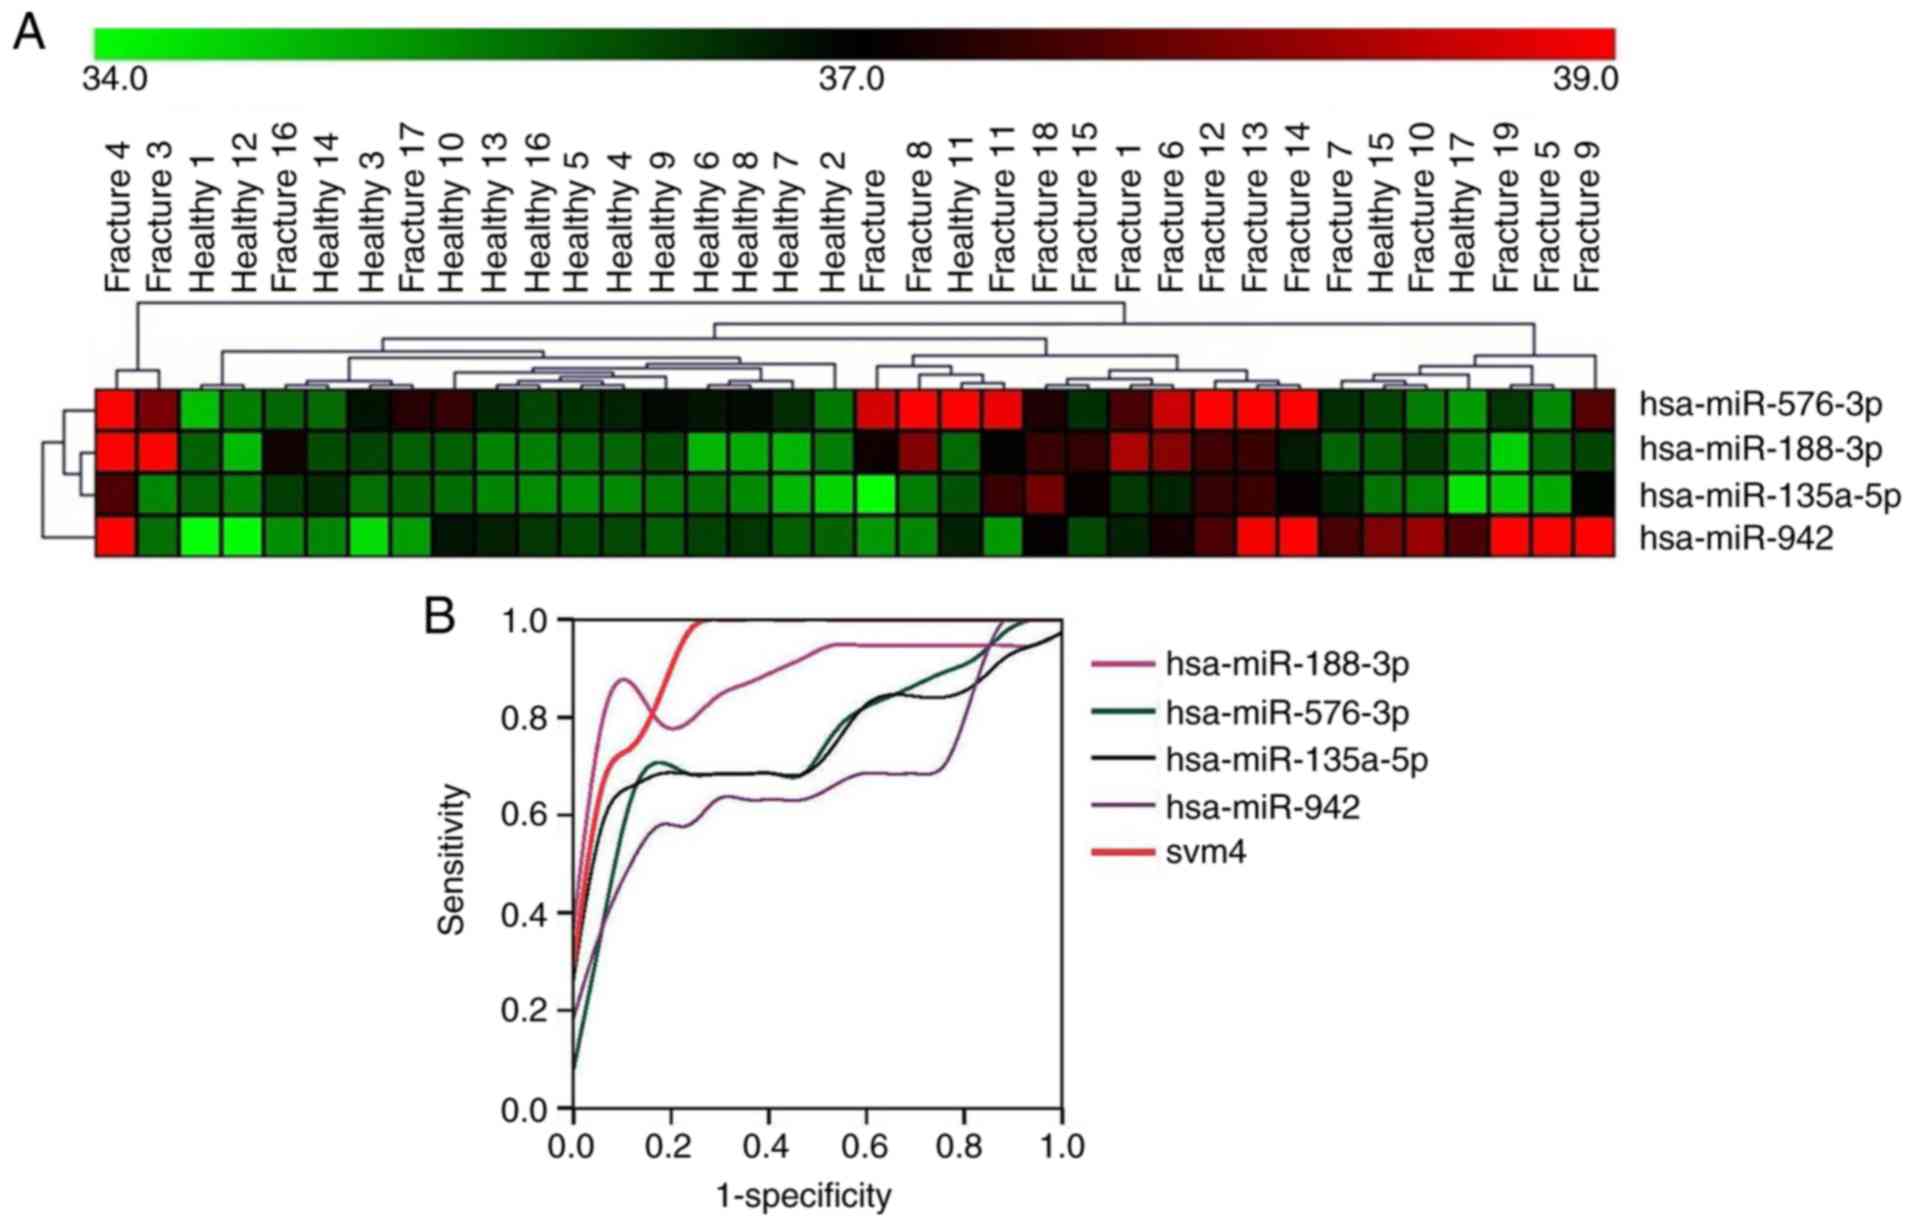
For improved classification of patients with
osteoporotic fractures from healthy controls, hierarchical
clustering was used for dichotomization. A total of 6 miRNAs were
identified which could accurately discriminate between fracture
patients and healthy controls (Fig.
2A) with an accuracy of >85% (16/19 cases). Furthermore,
differentially expressed miRNAs were clustered together to improve
diagnostic confidence. miR-188-3p, miR-942-3p, miR-576-3p and
miR-135a-5p were further calculated using the SVM classifier method
in MultiView version 4.2. After SVM weighting and calculation, the
data was input into SPSS for ROC curve analysis. The SPSS analysis
showed SVM 4-miR had the highest AUC (0.941) in all miRNAs
(Fig. 2B), with the following AUC
values: miR-188-3p, 0.889; miR-576-3p, 0.751; miR-135a-5p, 0.759;
miR-942-3p, 0.678; and svm4, 0.941. The other two miRNAs,
miR-181a-3p and miR-330-3p, did not show improved accuracy in
clustering with other miRNAs, which decreased accuracy to 78% and
75%, respectively. Therefore, these two miRNAs were removed from
the clustering of miRNAs. Collectively, the results indicated the
vital importance of circulating miRNAs in the prediction of
osteoporotic fractures. However, the use of miRNAs as biomarkers
was still unreliable due to outcome data for patients with
fractures not being available before and after fractures. In
addition, the findings require cross study validation using
different patient cohorts with different demographics and
disease-related variables in both controls and fracture
patients.
Cross validation with a different GEO
dataset
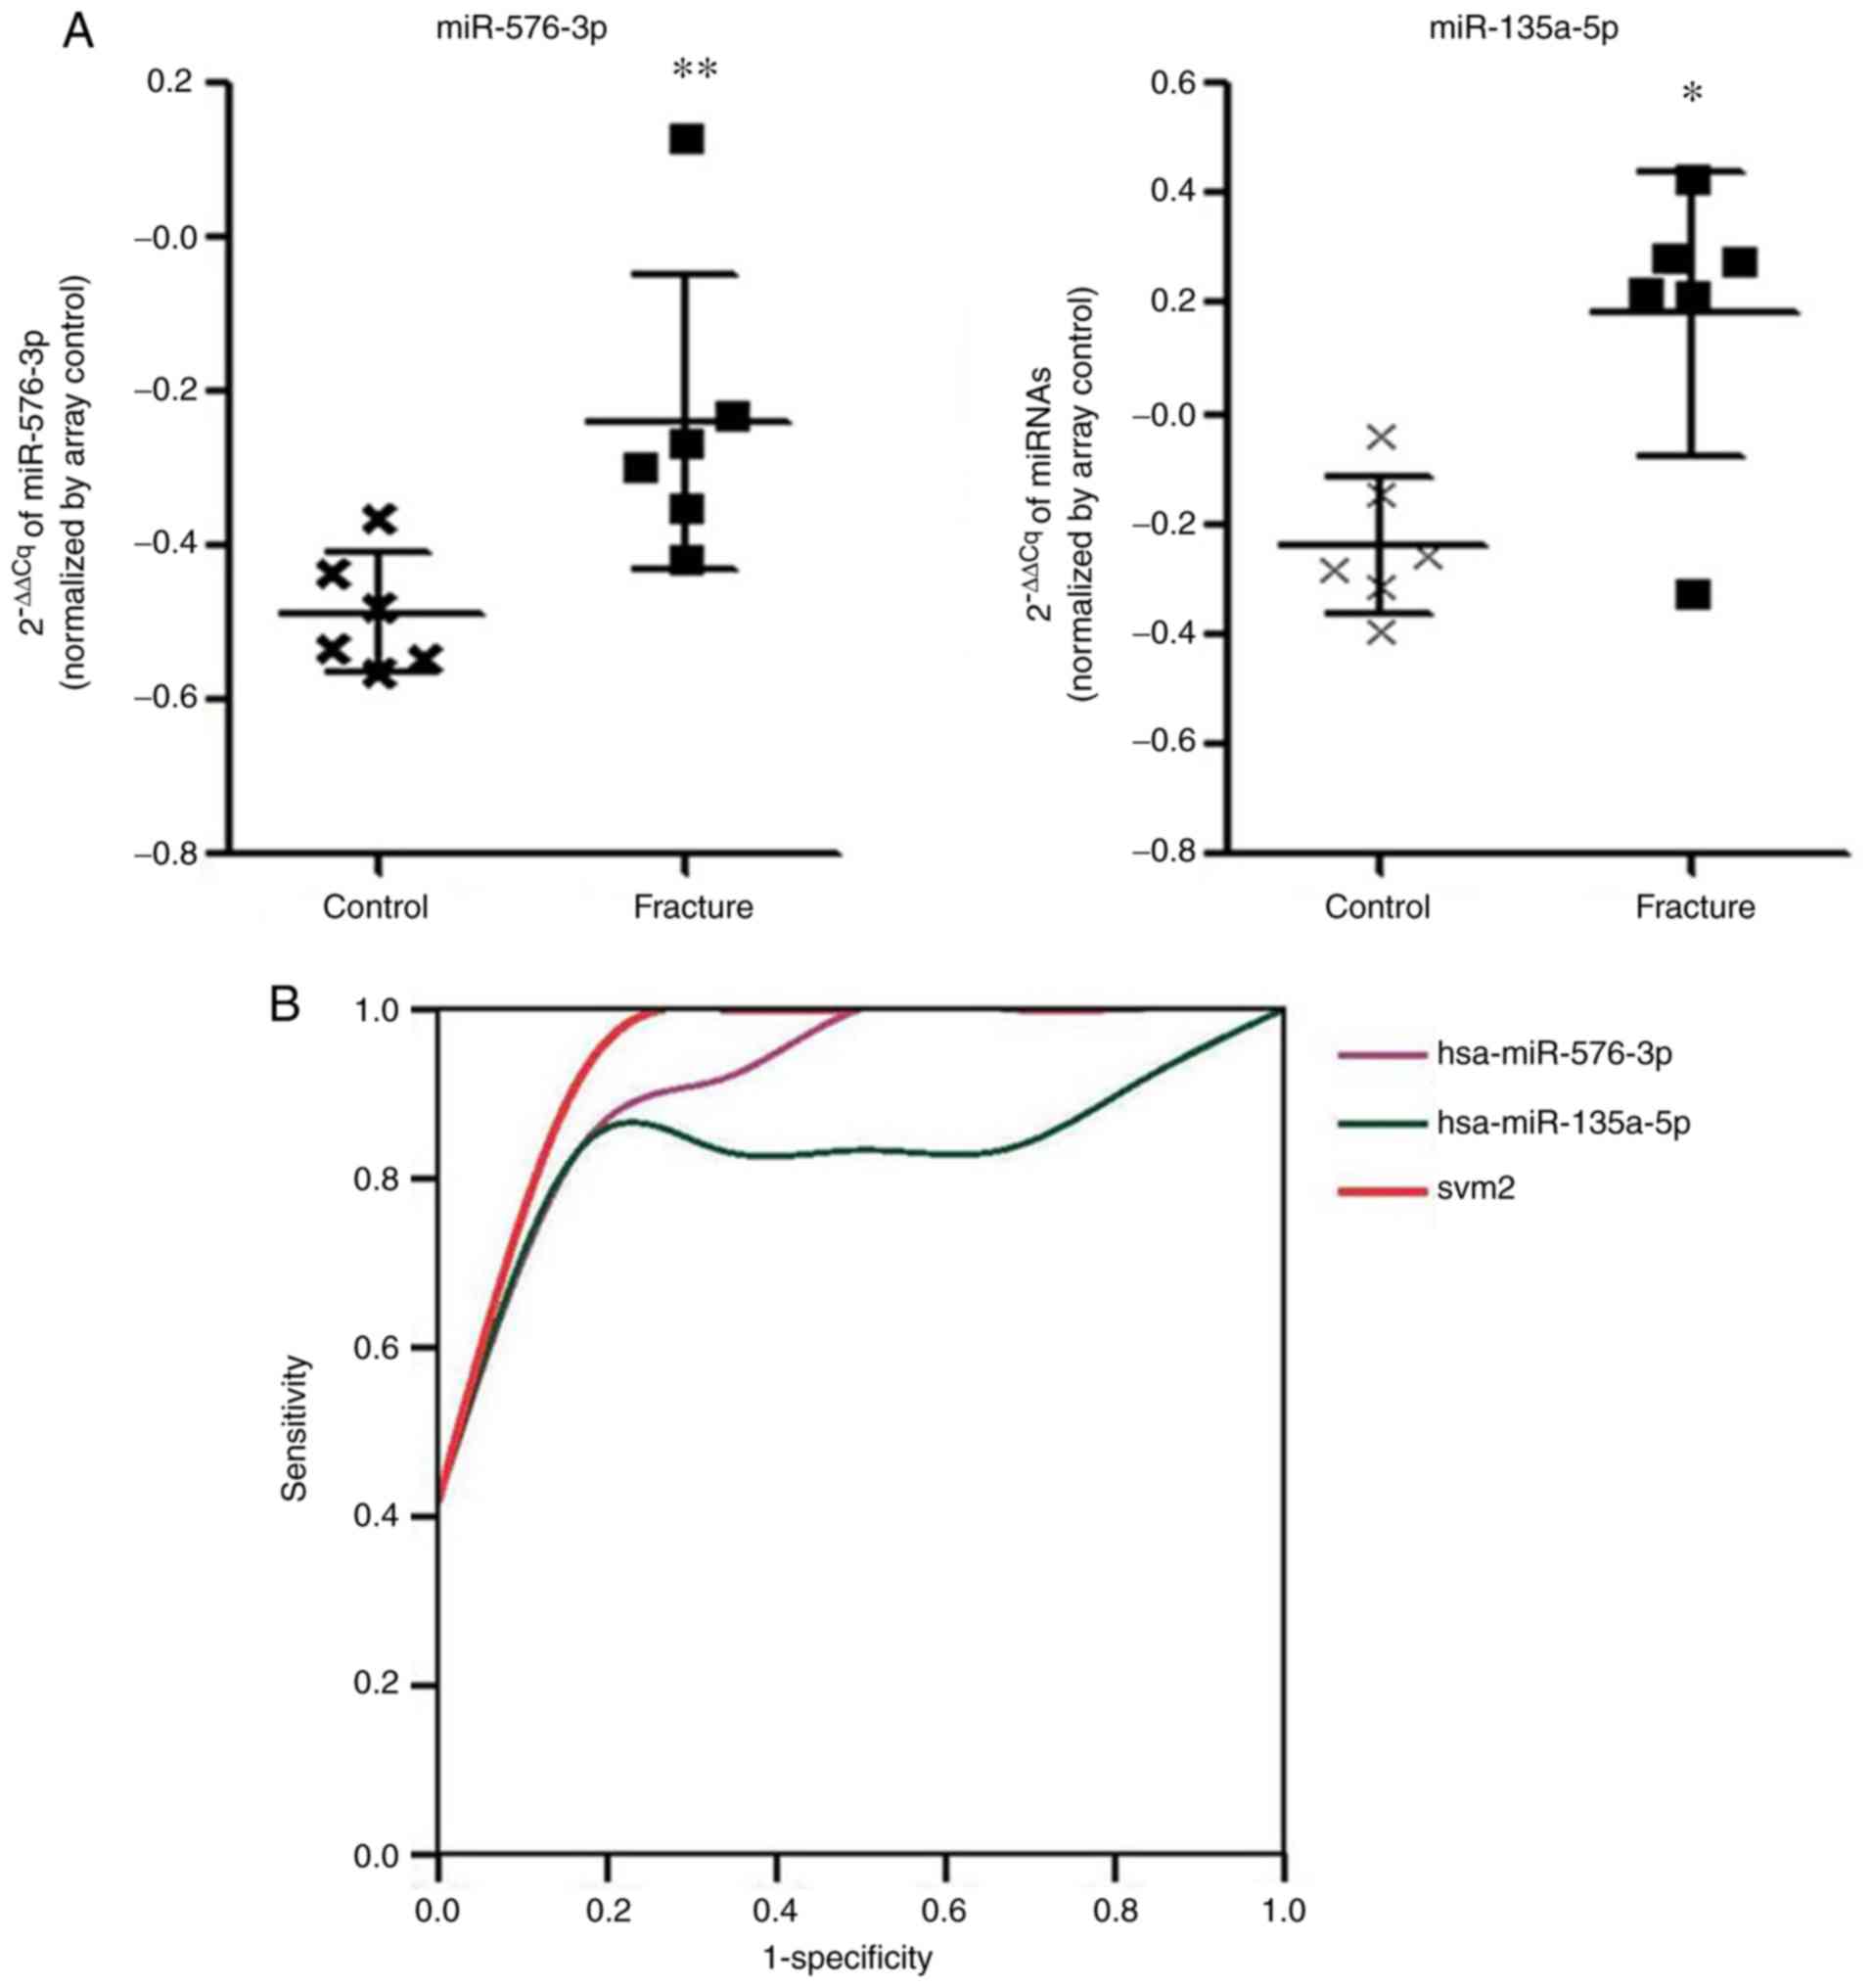
To confirm the above findings, the miRNA expression
signature was validated in another GEO dataset, GSE74209. The
experimental design and the included patients fitted the above
training cohort (GSE70318) precisely. Patient information and
serological indices of these datasets are listed in Table I. After comparison, it was confirmed
that miR-576-3p and miR-135a-5p could discriminate between
osteoporotic patients with and without fractures with an AUC of
0.9440 and 95% CI of 0.8485-1.1584 and 0.8611 with 95% CI of
0.6039-1.1119, respectively (Fig.
3A). SVM2 classification consisting of the above two miRNAs
showed the highest AUC, with values of 0.972 with 95% CI of
0.8885-1.230 (Fig. 3B), the AUC of
miRNAs were: miR-576-3p, 0.944; miR-135a-5p, 0.861; and svm2,
0.972. There was no statistically significant difference in miR-188
and miR-942 in this dataset (data not shown) and it was not
possible to perform further validation as other datasets were not
available.
Two miRNA signature in KEGG and GO
annotation analysis
The function of miRNAs is mediated primarily through
transcriptional modification by RNA-induced silencing complex
(RISC). RISC cuts the miRNA-mRNA complex and degrades the mRNA
(20). The validated and predicted
target genes of these miRNAs were searched and collected using
online software and database (diana.imis.athena-innovation.gr/DianaTools/index.php?r=tarbase/index).
KEGG signal pathway and GO annotation analysis were
used to analyze the selected miRNAs that were differentially
expressed in osteoporotic fractures (data not shown). When
combined, the analysis of KEGG and GO annotation, the most
significantly associated pathways were associated with cancer as
they were tightly linked to cellular metabolism, dead cell
clearance, organ development, cell growth and ubiquitination.
Although KEGG signaling pathway analysis is usually employed to
elucidate associated pathways containing differentially expressed
genes, the value of the KEGG pathway may be negative even if the
input gene served a vital role in the pathway. Due to the small
number of input gene numbers and the GO annotation analysis, it was
not possible to delineate meaningful pathways, GO functions or GO
components in bone formation. In order to identify which pathways
were involved in osteoporotic fractures associated with the
regulation of the 4-miRNA signature, bone formation, metabolism and
homeostasis associated with signaling pathways were analyzed. Bone
formation associated genes and signaling pathways were reported in
bone biology and bone signaling pathways (21). The Wingless-related integration site
(WNT), Hedgehog, TGF-β and osteoclast differentiation pathways were
selected for further analysis based on previous studies on bone
biology (22-24).
Several genes which were regulated by miR-57-3p and miR-135a-3p
co-participated in the aforementioned pathways (Table II). The results of the present study
showed that several genes were involved in bone formation and
homeostasis including WNT3/4, CSNK1A1L, TNFRSF11B, LRP6 and
PTCH1.
| Table IIBone formation pathways associated
with the two miRNA targets. |
Table II
Bone formation pathways associated
with the two miRNA targets.
| miRNA | WNT pathway
hsa04310 | Hedgehog pathway
hsa04340 | Osteoclast
differentiation hsa04380 | TGF-β pathway
hsa04350 |
|---|
| hsa-miR-576-3p | VANGL1, CSNK1A1L,
PSEN1 | CSNK1A1L | - | ACVR1C,
RPS6KB1 |
|
hsa-miR-135a-5p | LRP6, NLK, GSK3B,
TCF7L2, ROCK2, WNT3, PLCB1, SIAH1, FZD1, RBX1, MAPK10 |
GSK3B,CSNK1G2,CSNK1G3, WNT3 | TNFRSF11B, CAMK4,
PIK3R2, PIK3CD, MAPK10, PIK3R2 | ROCK1, SMAD2,
NODAL, ACVR1B, INHBA, SMAD5, SP1, RBX1 |
miR-576-3p and miR-135a-5p stimulates
differentiation of human osteoblasts and mineralization through the
WNT signaling pathway
It was hypothesized that the increased levels of
miR-188-3a, miR-576-3p, miR-942-3p and miR-135a-5p in serum and
bone cells may downregulate the expression of bone formation genes
and therefore cause fractures. To determine if the miR-576-3p and
miR-135a-3p could steadily regulate bone formation, a miRNA
sequence was constructed into expression vectors and osteoblasts
were transfected in vitro. The transfection efficiency of
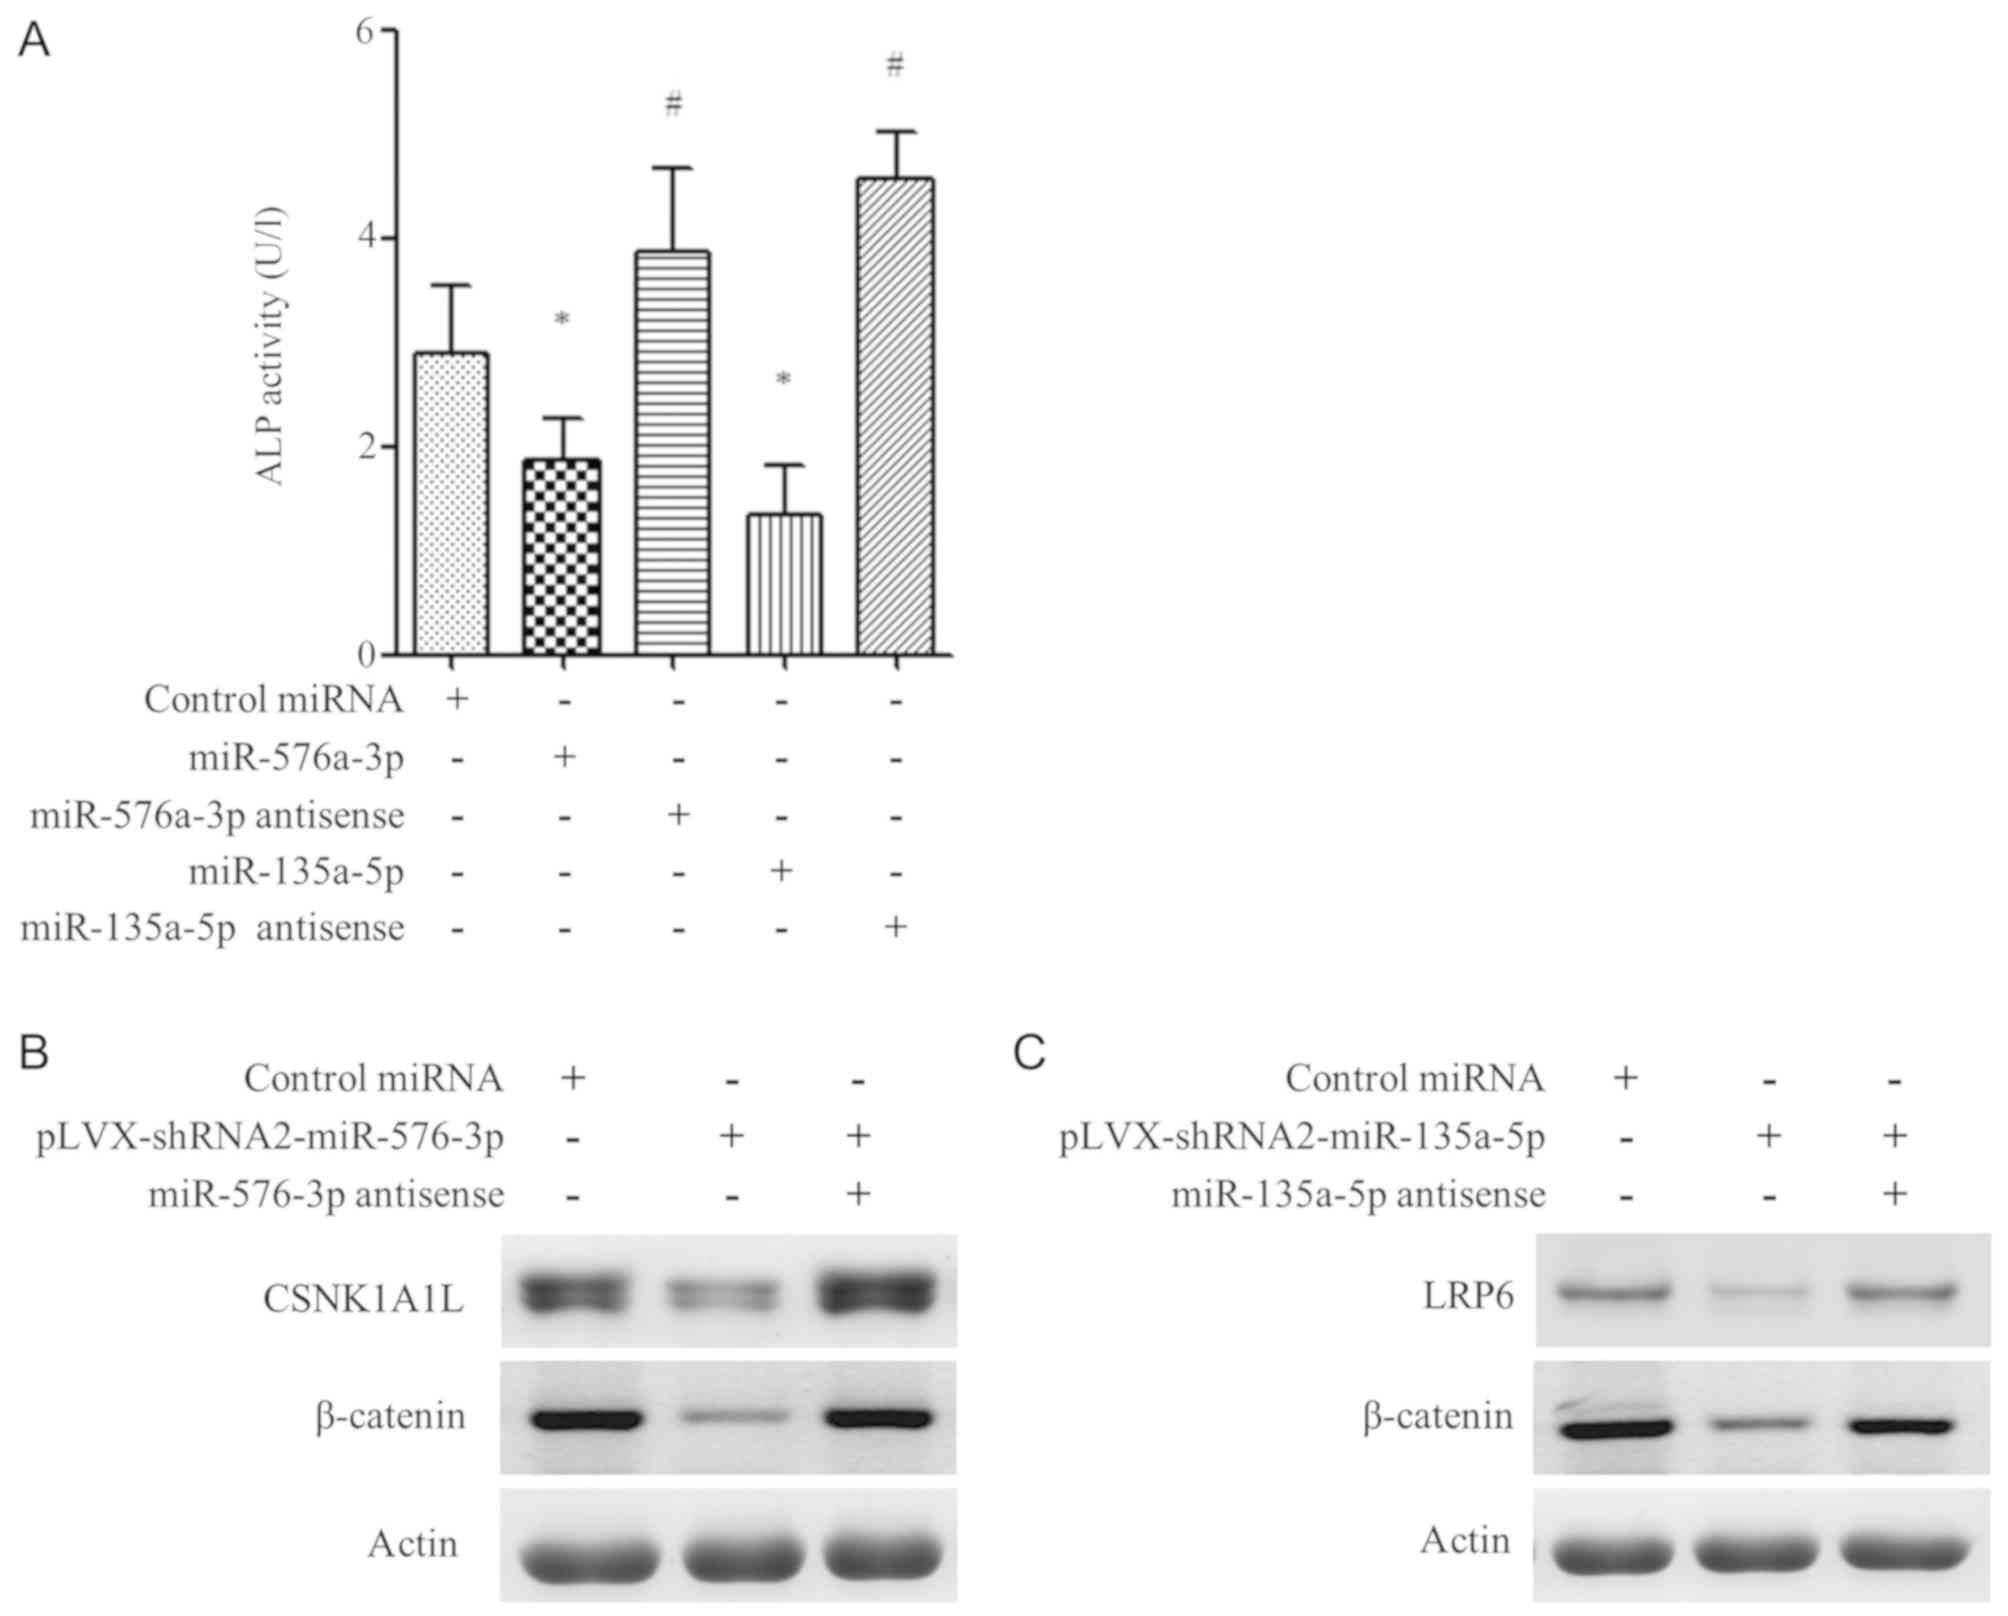
miRNA or anti-sense miRNA containing plasmids are shown in Fig. S1. In the cellular function
experiments, bone formation biomarkers were used to determine the
effects of miR-576-3p and miR-135-5p blocking antisense
oligonucleotides. In the ALP activity assay, results showed that
transfection of miR-576-3p or miR-135-5p decreased ALP activity
(P<0.05; Fig. 4A). The effects
were further confirmed at the protein level by measuring expression
of CSNK1A1L and LRP6 via western blotting. The data showed that
miR-576-3p and miR-135-5p decreased CSNK1A1L and LRP6 protein
levels, respectively (Fig. 4B and
C). In the combination treatment
group, the two miRNAs significantly decreased β-catenin
expression.
Discussion
Analysis of the GSE70318 dataset comparing
osteoporotic fracture patients and healthy controls was combined
with significantly expressed miRNAs using the SVM classifier
method. The results indicated that the SVM index from a 4-miRNA
expression signature showed the highest AUC (0.941) in all miRNAs.
Subsequently, the findings in different GEO datasets were validated
and the SVM classification algorithm method was applied in the
cross validation analysis. It was confirmed that miR-188-3p and
miR-942-3p expression was higher in patients with high BMD compared
with low BMD (data not shown). miR-576-3p and miR-135a-5p were
shown to exhibit important roles in the development of osteoporosis
as shown in the GSE74209 dataset, indicating the vital importance
of circulating miRNAs in the prediction of osteoporotic
fractures.
Seeliger et al (10), identified 6 miRNAs that were
upregulated in osteoporotic fracture patients including miR-21,
miR-23a, miR-24, miR-25, miR-100 and miR-125b. Garmilla-Ezquerra
et al (11), also showed
miR-187 and miR-518f were differentially expressed between controls
and osteoporotic fracture cohorts. Comparison between serum
circulating miRNA and fresh bone tissue from the fracture site
showed it was difficult to differentiate the most appropriate
sample for biomarker development. Fresh bone tissues from fractured
sites provided a scenario closer to the pathophysiological
situation. It was speculated that the pathophysiology of
osteoporosis ultimately causing fractures had a heterogeneous
etiology with different miRNA expression patterns (8). However, for the prediction of early
fractures, circulating miRNAs may have significant utility. In the
present study, a circulating miRNA signature was used to cross
validate the miRNA signature from bone tissues and it was
hypothesized that there were inter-connections between circulating
miRNAs and fractured bone tissue. The primary factor may be closely
associated with the bone weakening induced by osteoporosis, whilst
external pressures may only exert a minor role in causing
osteoporotic fractures. Thus, circulating miRNAs may better reflect
the entire mechanism occurring in patients with osteoporotic
fractures. Throughout the present study, a complete identical miRNA
signature for osteoporotic fracture was not found. This was not
only because of the complexity of the pathophysiology of
osteoporosis and fractures, but also due to the lack of identical
organization of patients and controls in the study. Therefore,
patients with osteoporotic fractures were paired with healthy
controls from a similar experimental platform, to improve the
analysis and allow a true platform for cross validation. However,
similar experimental designs and cohort criteria are required for
improved data validation.
Both GSE60230 and GSE70318 cohorts employed
post-menopausal patients suffering osteoporotic fractures.
Therefore, cross validation was performed using GSE60230. However,
an aberrantly expressed miRNA signature was not found as in the
case of GSE70318. Another different specific miRNA signature was
found, which has also been previously reported (15). Although the GSE60230 cohort fitted
the GSE70318 cohort, the sample size (n=7) was too small to be
used.
In the cross validation with BMD associated aberrant
miRNA expression, the GSE63446 dataset used high BMD or low BMD as
a risk factor in post-menopausal osteoporosis. Validation results
showed that miR-188-3p and miR-942-3p expression was increased in
patients with high BMD compared with patients with low BMD (data
not shown). A previous study also indicated that miR-188-3p serves
an important role in osteoporosis (15). miR-942-3p participates in
osteoporotic development through regulation of the WNT/β-catenin
pathway (25). IFN-γ derived
mesenchymal stem cells have also been shown to improve fracture
healing (26). However, due to the
limited number of patients (n=5) in the aforementioned study, the
dataset lacked statistical power. Other miRNAs which did not show
any difference in the GSE63446 dataset may be attributed to the
small sample size. Additionally, the GSE74209 dataset used bone
tissues from patients with arthritis and patients with osteoporotic
fractures to develop an miRNA signature (8). miR-576-3p and miR-135a-5p were
validated for the diagnosis of osteoporotic fractures and for their
feasibility of prediction. In addition to the findings from the
GSE74209 dataset and the present study, other reports have revealed
the important roles of these miRNAs in osteoporosis and fractures
(15,27,28).
In conclusion, the present study developed a novel
circulating miRNA signature for prediction of osteoporotic
fractures and validated these miRNAs in different GEO datasets.
These miRNAs may serve as biomarkers in monitoring of patients with
osteoporosis and for prediction of fracture risk to inform possible
fracture prevention strategies.
Supplementary Material
Fluorescence of cells transfected with
the control plasmid pLVX-shRNA2-EGFP-Puro, pLVX-miR-576-3p,
pLVXmiR-576-3p-antisense, pLVX-miR-135a-5p or
pLVX-miR-135a-5p-antisense (x100). GFP fluorescence represent
plasmid transfection efficiency. miR, microRNA; sh, short hairpin;
GFP, green fluorescent protein.
Acknowledgements
The authors would like to thank Dr Caiguo Ye
(Department of Pathophysiology, Guangdong Medical University,
Dongguan, Guangdong 523000, P.R. China) for his help with the ROC
and SVM algorithm methods.
Funding
The present study was supported by Foshan Bureau of
Science and Technology grant (grant no. 2018AB001903) and the
Guangdong Education platform of Science and Technology Grant Youth
Talent Project (grant no. 2018GkQNCX027).
Availability of data and materials
All data generated or analyzed during this study are
included in this published article.
Authors' contributions
XT designed the study, performed data analysis,
finished the ALP assay experiments and wrote the manuscript. YB
performed GEO database mining and analysis, the ROC and SVM
algorithm calculations and revised the manuscript. ZZ carried out
the cell cultures, transfections and western blotting, and offered
experimental materials and facilities. JL designed the miR-576-3p
microRNA and anti-sense RNA, conducted the transfection experiments
and wrote the sections on miRNA and transfections in the
manuscript. All authors read and approved the final manuscript.
Ethics approval and consent to
participate
Not applicable.
Patient consent for publication
Not applicable.
Competing interests
The authors declare that they have no competing
interests.
References
|
1
|
An T, Hao J, Sun S, Li R, Yang M, Cheng G
and Zou M: Efficacy of statins for osteoporosis: a systematic
review and meta-analysis. Osteoporos Int. 28:47–57. 2017.PubMed/NCBI View Article : Google Scholar
|
|
2
|
McNabb BL, Vittinghoff E, Schwartz AV,
Eastell R, Bauer DC, Ensrud K, Rosenberg E, Santora A,
Barrett-Connor E and Black DM: BMD changes and predictors of
increased bone loss in postmenopausal women after a 5-year course
of alendronate. J Bone Miner Res. 28:1319–1327. 2013.PubMed/NCBI View Article : Google Scholar
|
|
3
|
Sousa CP, Dias IR, Lopez-Peña M, Camassa
JA, Lourenço PJ, Judas FM, Gomes ME and Reis RL: Bone turnover
markers for early detection of fracture healing disturbances: A
review of the scientific literature. An Acad Bras Cienc.
87:1049–1061. 2015.PubMed/NCBI View Article : Google Scholar
|
|
4
|
Weilner S, Skalicky S, Salzer B, Keider V,
Wagner M, Hildner F, Gabriel C, Dovjak P, Pietschmann P,
Grillari-Voglauer R, et al: Differentially circulating miRNAs after
recent osteoporotic fractures can influence osteogenic
differentiation. Bone. 79:43–51. 2015.PubMed/NCBI View Article : Google Scholar
|
|
5
|
Taipaleenmäki H, Bjerre Hokland L, Chen L,
Kauppinen S and Kassem M: Mechanisms in endocrinology: micro-RNAs:
targets for enhancing osteoblast differentiation and bone
formation. Eur J Endocrinol. 166:359–371. 2012.PubMed/NCBI View Article : Google Scholar
|
|
6
|
Suttamanatwong S: MicroRNAs in bone
development and their diagnostic and therapeutic potentials in
osteoporosis. Connect Tissue Res. 58:90–102. 2017.PubMed/NCBI View Article : Google Scholar
|
|
7
|
Chen J, Qiu M, Dou C, Cao Z and Dong S:
MicroRNAs in bone balance and osteoporosis. Drug Dev Res.
76:235–245. 2015.PubMed/NCBI View Article : Google Scholar
|
|
8
|
De-Ugarte L, Yoskovitz G, Balcells S,
Güerri-Fernández R, Martinez-Diaz S, Mellibovsky L, Urreizti R,
Nogués X, Grinberg D, García-Giralt N, et al: MiRNA profiling of
whole trabecular bone: Identification of osteoporosis-related
changes in MiRNAs in human hip bones. BMC Med Genomics.
8(75)2015.PubMed/NCBI View Article : Google Scholar
|
|
9
|
Lei SF, Papasian CJ and Deng HW:
Polymorphisms in predicted miRNA binding sites and osteoporosis. J
Bone Miner Res. 26:72–78. 2011.PubMed/NCBI View
Article : Google Scholar
|
|
10
|
Seeliger C, Karpinski K, Haug AT, Vester
H, Schmitt A, Bauer JS and van Griensven M: Five freely circulating
miRNAs and bone tissue miRNAs are associated with osteoporotic
fractures. J Bone Miner Res. 29:1718–1728. 2014.PubMed/NCBI View Article : Google Scholar
|
|
11
|
Garmilla-Ezquerra P, Sañudo C,
Delgado-Calle J, Pérez-Nuñez MI, Sumillera M and Riancho JA:
Analysis of the bone microRNome in osteoporotic fractures. Calcif
Tissue Int. 96:30–37. 2015.PubMed/NCBI View Article : Google Scholar
|
|
12
|
Zhang Y, Gao Y, Cai L, Li F, Lou Y, Xu N,
Kang Y and Yang H: MicroRNA-221 is involved in the regulation of
osteoporosis through regulates RUNX2 protein expression and
osteoblast differentiation. Am J Transl Res. 9:126–135.
2017.PubMed/NCBI
|
|
13
|
Meng J, Zhang D, Pan N, Sun N, Wang Q, Fan
J, Zhou P, Zhu W and Jiang L: Identification of miR-194-5p as a
potential biomarker for postmenopausal osteoporosis. PeerJ.
3(e971)2015.PubMed/NCBI View Article : Google Scholar
|
|
14
|
Tang X, Lin J, Wang G and Lu J:
MicroRNA-433-3p promotes osteoblast differentiation through
targeting DKK1 expression. PLoS One. 12(e0179860)2017.PubMed/NCBI View Article : Google Scholar
|
|
15
|
Heilmeier U, Hackl M, Skalicky S, Weilner
S, Schroeder F, Vierlinger K, Patsch JM, Baum T, Oberbauer E,
Lobach I, et al: Serum miRNA signatures are indicative of skeletal
fractures in postmenopausal women with and without type 2 diabetes
and influence osteogenic and adipogenic differentiation of adipose
tissue-derived mesenchymal stem cells in vitro. J Bone Miner Res.
31:2173–2192. 2016.PubMed/NCBI View Article : Google Scholar
|
|
16
|
Lu M, Kong X, Wang H, Huang G, Ye C and He
Z: A novel microRNAs expression signature for hepatocellular
carcinoma diagnosis and prognosis. Oncotarget. 8:8775–8784.
2017.PubMed/NCBI View Article : Google Scholar
|
|
17
|
Zhou X, Zhu W, Li H, Wen W, Cheng W, Wang
F, Wu Y, Qi L, Fan Y, Chen Y, et al: Diagnostic value of a plasma
microRNA signature in gastric cancer: A microRNA expression
analysis. Sci Rep. 5(11251)2015.PubMed/NCBI View Article : Google Scholar
|
|
18
|
Saeed AI, Sharov V, White J, Li J, Liang
W, Bhagabati N, Braisted J, Klapa M, Currier T, Thiagarajan M, et
al: TM4: A free, open-source system for microarray data management
and analysis. Biotechniques. 34:374–378. 2003.PubMed/NCBI View Article : Google Scholar
|
|
19
|
Maulik U and Chakraborty D: Fuzzy
preference based feature selection and semisupervised SVM for
cancer classification. IEEE Trans Nanobioscience. 13:152–160.
2014.PubMed/NCBI View Article : Google Scholar
|
|
20
|
Bernstein E, Caudy AA, Hammond SM and
Hannon GJ: Role for a bidentate ribonuclease in the initiation step
of RNA interference. Nature. 409:363–366. 2001.PubMed/NCBI View
Article : Google Scholar
|
|
21
|
Iñiguez-Ariza NM and Clarke BL: Bone
biology, signaling pathways, and therapeutic targets for
osteoporosis. Maturitas. 82:245–255. 2015.PubMed/NCBI View Article : Google Scholar
|
|
22
|
Luo M, Huang HX, Huang H, Li ZT and Lai
YY: Hedgehog signaling pathway and osteoporosis. Zhongguo Gu Shang.
27:169–172. 2014.PubMed/NCBI(In Chinese).
|
|
23
|
Regan JN, Trivedi T, Guise TA and Waning
DL: The role of TGFβ in bone-muscle crosstalk. Curr Osteoporos Rep.
15:18–23. 2017.PubMed/NCBI View Article : Google Scholar
|
|
24
|
Saad FA: Novel insights into the complex
architecture of osteoporosis molecular genetics. Ann N Y Acad Sci.
1462:37–52. 2019.PubMed/NCBI View Article : Google Scholar
|
|
25
|
McCubrey JA, Fitzgerald TL, Yang LV,
Lertpiriyapong K, Steelman LS, Abrams SL, Montalto G, Cervello M,
Neri LM, Cocco L, et al: Roles of GSK-3 and microRNAs on epithelial
mesenchymal transition and cancer stem cells. Oncotarget.
8:14221–14250. 2017.PubMed/NCBI View Article : Google Scholar
|
|
26
|
Chi Y, Cui J, Wang Y, Du W, Chen F, Li Z,
Ma F, Song B, Xu F, Zhao Q, et al: Interferon-γ alters the microRNA
profile of umbilical cord-derived mesenchymal stem cells. Mol Med
Rep. 14:4187–4197. 2016.PubMed/NCBI View Article : Google Scholar
|
|
27
|
Fang S, Deng Y, Gu P and Fan X: MicroRNAs
regulate bone development and regeneration. Int J Mol Sci.
16:8227–8253. 2015.PubMed/NCBI View Article : Google Scholar
|
|
28
|
Panizo S, Naves-Díaz M, Carrillo-López N,
Martínez-Arias L, Fernández-Martín JL, Ruiz-Torres MP,
Cannata-Andía JB and Rodríguez I: MicroRNAs 29b, 133b, and 211
regulate vascular smooth muscle calcification mediated by high
phosphorus. J Am Soc Nephrol. 27:824–834. 2016.PubMed/NCBI View Article : Google Scholar
|