Introduction
Hepatocellular carcinoma (HCC) and hepatic
metastasis of rectal cancer (HMRC) are common malignant lesions of
the liver, as well as major causes of mortality due to their high
risk and rapid development (1-3).
According to recent statistics, HCC is the fourth most common cause
of cancer-associated mortality worldwide (4). The incidence of HMRC has been reported
to be ~25% at the time of diagnosis of rectal cancer (5). As these diseases exhibit distinctive
biological activities, clinicians must identify the properties and
tumor types of these hepatic lesions and provide different clinical
treatment regimens to improve the surgical methods and patient
survival rates.
Clinically, aside from laboratory examination,
imaging-based differential diagnosis of these two diseases relies
on traditional computed tomography (CT), magnetic resonance imaging
(MRI) and ultrasonography (6). MRI
was initially popular for the diagnosis of liver tumors; however,
dynamic contrast-enhanced MRI (DCE-MRI) with quantitative or
semi-quantitative functions has been gradually applied in clinical
practice, as it provides a more comprehensive assessment of
microvascular parameters and information in tumors compared with
conventional contrast-enhanced MRI (7). Quantitative and semi-quantitative
pharmacokinetic parameters can be produced by simulating the
metabolic process of the contrast agent in the lesion (7). The endothelial transfer constant
(Ktrans) reflects the microvascular changes in the
lesion area, and the Ktrans value in the tumor area is
markedly increased compared with that in normal tissue, which may
be used to observe the vascular permeability changes of the liver
and tumor tissues (8). The initial
area under the gadolinium concentration curve during the first 60
sec (IAUC) is a semi-quantitative parameter that represents the
contrast agent concentration in the lesion during the first 60 sec
(9). Hepatic perfusion index (HPI)
refers to the hepatic artery blood supply fraction related to the
portal vein as a reference standard; lesions with different
pathogeneses have different HPI values (10). Previous studies have demonstrated
that quantified pharmacokinetic parameters, such as
Ktrans, IAUC and HPI, derived from DCE-MRI exhibit high
potential in assessing liver tumors (7-10).
Radiomics analysis is a high-throughput automated
computing method used to transform the gray information of the
region of interest (ROI) into high-dimensional image features in
medical images (11). The image
features may provide assistance and support for the diagnosis,
treatment assessment and prognosis in clinical practice with
precise quantitative analysis (11).
Previous studies have reported the application of this analysis in
the differential diagnosis and grade malignancy detection of
non-small cell lung cancer, keratoma and prostate cancer (11). Compared with traditional technical
methods, radiomics analysis provides more diagnostic and
differential diagnosis information. For example, Huang et al
(12) evaluated lymph node
metastasis in patients with colorectal cancer by combining the
lymph node status reported by CT and radiomics analysis, which may
be conveniently used to facilitate preoperative individualized
prediction. In another study, Huang et al (13) evaluated a subset of radiomic features
extracted from CT images; in contrast with previous studies,
CT-based radiomics analysis revealed its potential use as a
predicted imaging biomarker in the diagnosis of non-small cell lung
cancer. Radiomics analysis provides information that cannot be
observed by the naked eye, and indicates the property of the
lesions by evaluating the radiomic features extracted from them
(11-13).
Differential diagnosis of HCC and HMRC would benefit
patients and clinical practice. Therefore, the present study aimed
to evaluate the ability of pharmacokinetic parameters, as well as
radiomic features derived from DCE-MRI, to differentiate HCC from
HMRC.
Materials and methods
Patient data
The patients provided written informed consent
before undergoing DCE-MRI. A total of 75 patients (64 male and 11
female) with a mean age of 54.8±11.6 years (range, 25-78 years)
were consecutively recruited between December 2018 and July 2019.
The recruited patients were divided into two groups according to
histopathological results: i) HCC, n=41 (35 male and 6 female); and
ii) HMRC, n=34 (25 male and 9 female). The patients were selected
according to the following criteria (14): i) The HCC group lesions were obtained
from patients who suffered from a single lesion; ii) the HRMC group
included the largest lesion selected from patients with ≤3 lesions;
iii) the diameter of the lesions was 1-5 cm in both groups; iv) no
contrast-enhanced MR examination had been performed within 30 days;
v) all patients could follow the MR technician's request to
complete the full scan. All lesions were histopathologically
confirmed by surgery or biopsy 1 week after the MR examination.
Patients with severe motion artifacts in the MRI and those who had
received any antineoplastic treatment prior to their MR examination
were excluded from the study.
MRI acquisition
Imaging of the whole liver was performed on a 3.0T
HDX TwinSP MR system (GE Healthcare) using an 8-channel abdominal
phased array body coil. Prior to the examination, breathing
exercise training was provided to patients. Routine axial images,
including T1-weighted images (TR/TE, 2.7/1.2 msec; FOV, 410x287 mm;
slice thickness/space, 6/2 mm; slab, 24), T2-weighted images
(TR/TE, 6670/87 msec; FOV, 410x287 mm; slice thickness/space, 6/2
mm; slab, 24) and diffusion-weighted images (TR/TE, 5700/67 msec; b
value, 1,000 sec/mm2; b value, 0), were first obtained.
Multiple flip-angle images were collected using a 3D LAVA sequence
(TR/TE, 2.8/1.3 msec; matrix, 288x188; FOV, 400x320 mm; phase FOV,
0.85; slice thickness/space, 6/2 mm; acceleration, 2.50; slab, 64;
time resolution, 6.0 sec) with in-flip angles of 3, 6, 9, 12 and
15̊ (14).
DCE-MRI was performed with 22 acquiring phases in a
12-flip angle (14). Two unenhanced
phases were first collected as the baseline. A contrast agent
(Omniscan; GE Healthcare) was injected into the elbow vein at 2.0
ml/sec (0.3 mmol/kg) using a high-pressure injector
(Mississippi™ XD 2000 Injector; Ulrich GmbH & Co.
KG) and was effective from the third phase. Following injection, 20
ml saline was delivered at a rate of 2.0 ml/sec to flush the
injector and its accessory tube.
Data acquisition
A specialized medical image post-processing software
package (OmniKinetics V2.0.10, GE Healthcare) for DCE-MRI was used
in the present study (14,15). First, the multiple flip angle images
(3, 6, 9, 12 and 15˚) were imported into the software for T1
mapping calculation, and all DCE-MR images aligned by 3D non-rigid
registration function, which attached to the OmniKinetics software,
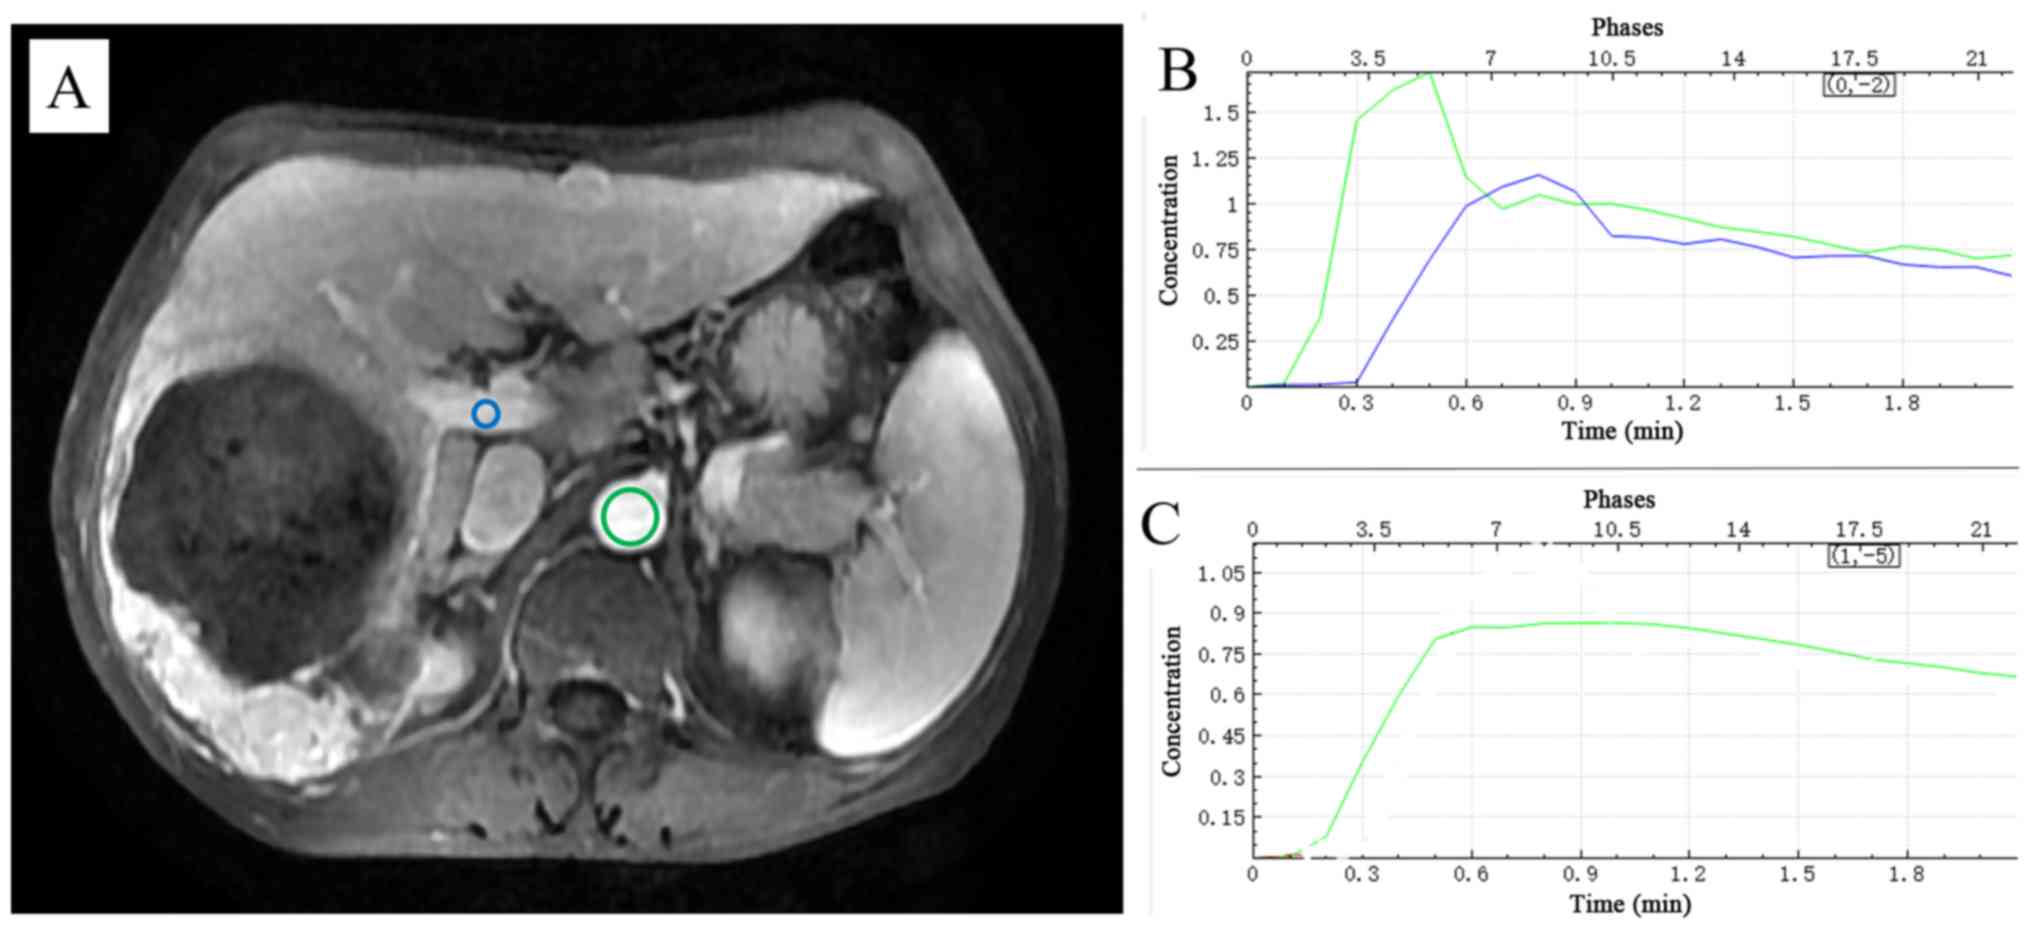
were subsequently loaded. Secondly, a dual-input two-compartment
tracer kinetic liver model termed Extended Tofts was selected from
OmniKinetics. Hepatic artery and portal vein ROIs were drawn by
hand, and were performed by two radiologists in consensus, both
with 8 and 12 years of experience, respectively, to obtain the
arterial input function (AIF) and portal input function (PIF) of
the contrast agent time-concentration curve. The contrast agent
time-concentration curve of the dual vascular input function (VIF)
in the liver (Fig. 1) was fitted by
AIF and PIF. The ROI of the hepatic artery was placed on the
abdominal aorta near the entrance of the celiac trunk, replacing
the hepatic artery, and the ROI of the portal vein was placed on
the main portal vein. Thirdly, two radiologists with 8 and 12 years
of experience in MRI reviewed the DCE-MRI, and the images were
selected from the phase that corresponded to the peak of hepatic
artery enhancement based on AIF. A consensus was reached through
consultation. An oval or polygonal ROI was manually drawn along the
edge of the largest cross-section of the lesion, and image
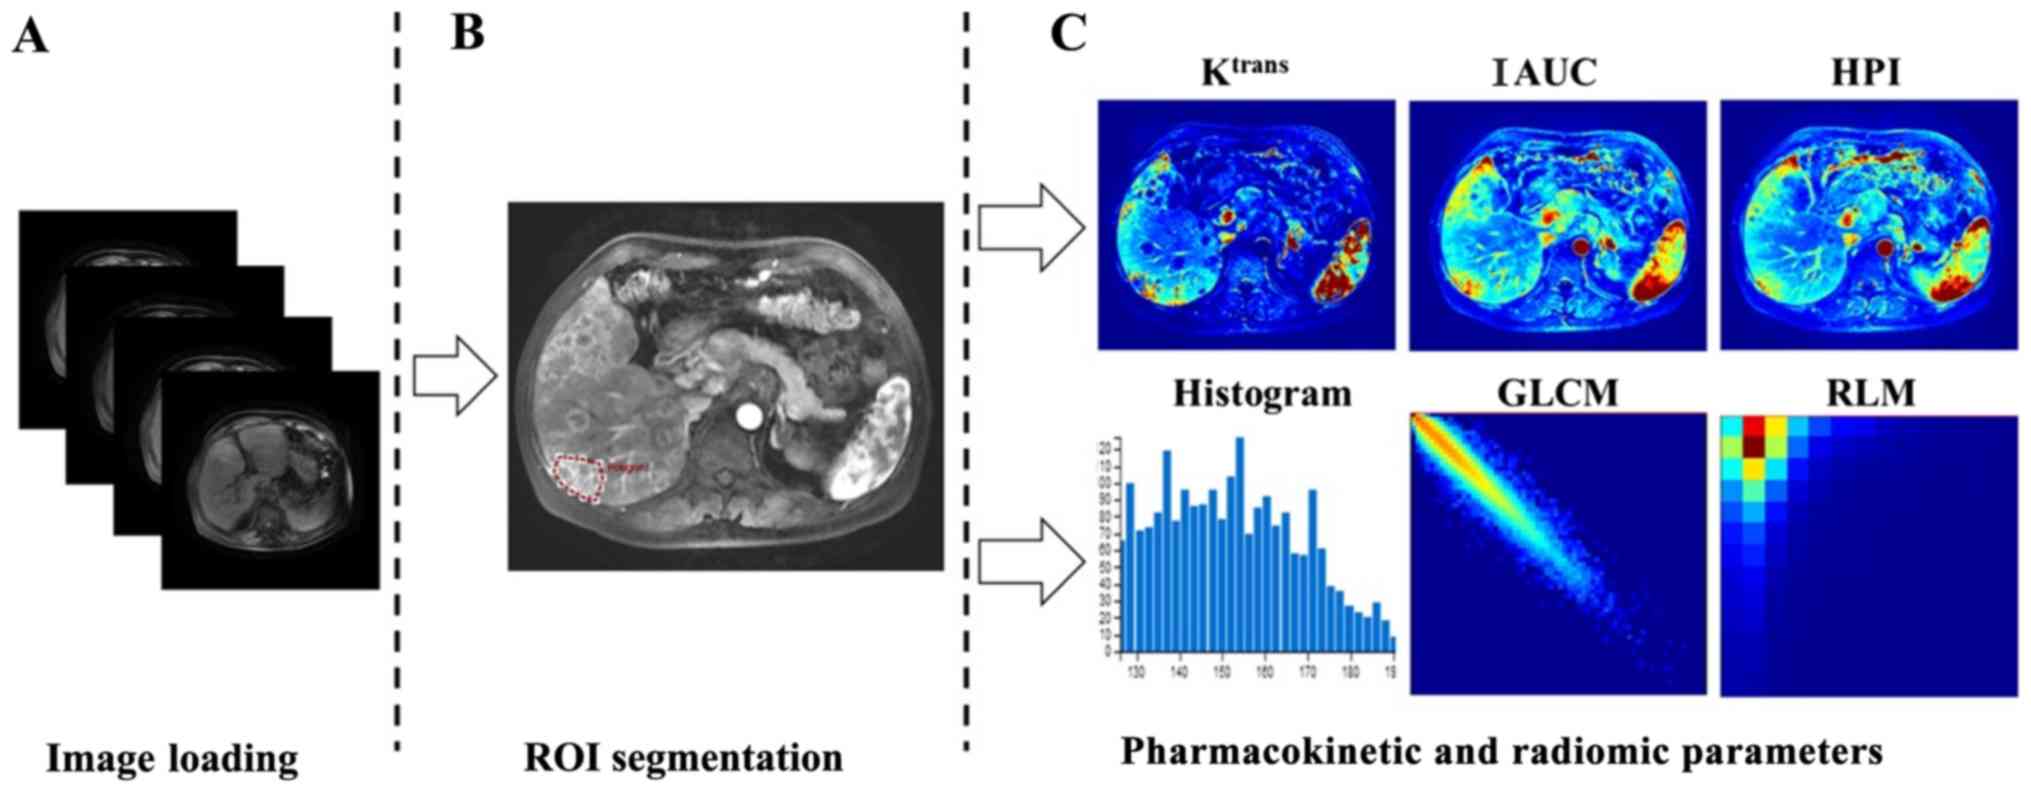
segmentation of the ROI lesion was obtained. Finally,
pharmacokinetic parameters and radiomic features were calculated
using the ‘calculate’ function of the OmniKinetic software. The
values of the pharmacokinetic parameters were obtained, including
Ktrans, IAUC and HPI, which contributed to the
differentiation of liver tumors in previous studies (7-10)
and were thus used in the present study. The values of radiomic
features were calculated using the ‘CalcTexturePragram’ function of
the software (Fig. 2). Three
successive ROIs based on the largest cross-section of the lesion,
including the upper and lower layers, were measured for
pharmacokinetic parameters and radiomic features, and the mean
values of the three measurements were calculated by clicking the
‘merge’ button on the software.
The radiomic features derived from the lesion
DCE-MRI were selected in the phase when AIF reached the peak of the
contrast agent time-concentration curve of the hepatic artery
(14,15). These parameters, which were
calculated by OmniKinetics software, included five types of
features: First order, histogram, gray level co-occurrence matrix,
Haralick and run length matrix. The features are listed in Table I.
 | Table IRadiomic features derived from
dynamic contrast-enhanced magnetic resonance imaging by
OmniKinetics software. |
Table I
Radiomic features derived from
dynamic contrast-enhanced magnetic resonance imaging by
OmniKinetics software.
| Type | Radiomic
features | N |
|---|
| First order | MinIntensity,
MaxIntensity, MedianIntensity, MeanValue, stdDeviation, Variance,
VolumeCount, VoxelValueSum, Root Meant Square, Range,
MeanDeviation, RelativeDeviation, MinLocation, MaxLocation | 14 |
| Histogram | Energy, Entropy,
Kurtosis, Skewness, Uniformity, FrequencySize, Uniformity Positive
Pixel, Mean Positive Pixel, Quantile5, Quantile10, Quantile25,
Quantile50, Quantile75, Quantile90, Quantile95 | 15 |
| GLCM | GlcmEnergy,
GlcmEntropy, GlcmBinSize, GlcmTotalFrequency, GlcmMatrixMean,
GlcmRelativeFrequency, Inertia, Correlation,
InverseDifferenceMoment, ClusterShade, ClusterProminence,
HaralickCorrelation, InvalidFeatureName | 13 |
| Haralick |
AngularSecondMoment, Contrast,
HaraVariance, sumAverage, sumVariance, sumEntropy,
differenceVariance, differenceEntropy, inverseDifferenceMoment | 9 |
| RLM | MaxIntensity,
MinIntensity, MinSize, NumberOfIntensityBins, MaxSize,
NumberOfSizeBins, ShortRunEmphasis, LongRunEmphasis,
GreyLevelNonuniformity, RunLengthNonuniformity,
LowGreyLevelRunEmphasis, HighGreyLevelRunEmphasis,
ShortRunLowGreyLevelEmphasis, ShortRunHighGreyLevelEmphasis,
LongRunLowGreyLevelEmphasis, LongRunHighGreyLevelEmphasis | 16 |
Statistical analysis
R package version 3.5.0 (https://www.Rproject.org) was used for the present
study (16). Normally distributed
continuous variables, including the values of pharmacokinetic
parameters and radiomic features, are presented as the mean ±
standard deviation. Student's t-test was used to compare these
variables between the HCC and HMRC groups. The sensitivity,
specificity, cut-off value, area under the curve (AUC) and 95%
confidence interval (CI) were calculated by receiver operating
characteristic (ROC) curve using the ‘pROC’ package (17). Binary logistic regression was used to
analyze the variables to differentiate between HCC and HMRC using
pharmacokinetic parameters and radiomic features with statistical
differences as independent variables, and pathological results as
dependent variables. A combination of variables was produced after
eliminating the variables. Fisher discriminant analysis (FDA) and
leave-one-out cross-validation were used to build linear
discriminant models. Two-tailed P<0.05 was considered to
indicate a statistically significant difference.
Results
Patients
The age range of the 35 male and 6 female patients
in the HCC group was 25-75 years. The age range of 29 male and 5
female patients in the HMRC group was 26-78 years. No significant
differences were observed in the age and sex between the two groups
(Table II; P>0.05).
| Table IIClinicopathological characteristics
of patients with HCC and HMRC. |
Table II
Clinicopathological characteristics
of patients with HCC and HMRC.
| Characteristic | HCC (n=41) | HMRC (n=34) |
t/χ2 | P-value |
|---|
| Age, years | 51.59±10.25 | 53.88±13.21 | 0.61 | 0.54 |
| Sex, n (%) | | | | |
|
Male | 35 (85.37) | 29 (85.29) | <0.01 | >0.99 |
|
Female | 6 (14.63) | 5 (14.71) | | |
Pharmacokinetic parameters and
radiomic features
Statistically significant differences in
Ktrans, IAUC and HPI values were observed between the
HCC and HRMC groups (Table III).
In addition, statistically significant differences were identified
in 17 features between the two groups (Table IV).
| Table IIIPharmacokinetic parameters of HCC and
HMRC. |
Table III
Pharmacokinetic parameters of HCC and
HMRC.
| Parameter | HCC (n=41) | HMRC (n=34) | AUC (95 %CI) | Cut-off | Sensitivity | Specificity | Youden's index | P-value |
|---|
| Ktrans,
min-1 | 1.11±0.73 | 0.63±0.47 | 0.73
(0.61-0.84) | 0.45 | 0.88 | 0.53 | 0.41 | 0.000 |
| IAUC, mmol x
min | 1.43±0.56 | 0.93±0.41 | 0.77
(0.67-0.88) | 1.18 | 0.68 | 0.79 | 0.48 | 0.000 |
| HPI | 0.73±0.14 | 0.61±0.18 | 0.67
(0.55-0.79) | 0.59 | 0.83 | 0.50 | 0.33 | 0.004 |
| Table IVRadiomic features of HCC and HMR. |
Table IV
Radiomic features of HCC and HMR.
| Type | Feature | HCC (n=41) | HMRC (n=34) | P-value | AUC (95%CI) | Cut-off | Sensitivity | Specificity | Youden's index |
|---|
| First order | MaxIntensity | 801.47±317.41 | 1143.22±307.91 | <0.01 | 0.78
(0.67-0.88) | 873.50 | 0.85 | 0.62 | 0.47 |
| | Median
Intensity | 518.8±176.15 | 700.36±198.87 | <0.01 | 0.76
(0.65-0.87) | 651.89 | 0.61 | 0.82 | 0.43 |
| | MeanValue | 516.45±173.44 | 698.78±192.66 | <0.01 | 0.77
(0.66-0.88) | 635.66 | 0.61 | 0.82 | 0.43 |
| | Standard
Deviation | 94.17±47.83 | 137.62±52.93 | <0.01 | 0.75
(0.64-0.86) | 92.23 | 0.83 | 0.59 | 0.42 |
| | RMS | 526.63±174.84 | 714.08±192.79 | <0.01 | 0.77
(0.66-0.88) | 648.53 | 0.61 | 0.82 | 0.43 |
| | MeanDeviation | -261.45±173.44 | -443.77±192.66 | <0.01 | 0.77
(0.66-0.88) | -380.7 | 0.61 | 0.82 | 0.43 |
| Histogram | MPP | 516.45±173.44 | 698.78±192.66 | <0.01 | 0.77
(0.66-0.88) | 635.66 | 0.61 | 0.82 | 0.43 |
| | Quantile10 | 392.18±153.75 | 519.74±173.69 | <0.01 | 0.71
(0.60-0.83) | 406.41 | 0.80 | 0.59 | 0.39 |
| | Quantile50 | 518.3±176.15 | 700.15±198.77 | <0.01 | 0.76
(0.65-0.87) | 651.09 | 0.61 | 0.82 | 0.43 |
| | Quantile75 | 582.57±189.87 | 790.95±210.68 | <0.01 | 0.77
(0.67-0.88) | 652.89 | 0.78 | 0.65 | 0.43 |
| | Quantile90 | 635.34±206.64 | 875.33±222.91 | <0.01 | 0.79
(0.69-0.89) | 796.89 | 0.66 | 0.82 | 0.48 |
| | Quantile95 | 667.39±219.68 | 923.93±232.64 | <0.01 | 0.79
(0.68-0.89) | 796.24 | 0.76 | 0.74 | 0.49 |
| GLCM | Inertia | 572.99±381.47 | 400.14±223.26 | 0.02 | 0.63
(0.50-0.76) | 489.09 | 0.73 | 0.53 | 0.26 |
| Haralick | Entropy | 0.64±0.06 | 0.68±0.05 | <0.01 | 0.71
(0.59-0.83) | 0.62 | 0.90 | 0.47 | 0.37 |
| | AngSecMoment | 0.0014±0.0011 | 0.0009±0.0004 | 0.01 | 0.69
(0.56-0.81) | 0.001 | 0.73 | 0.59 | 0.32 |
| | SumEntropy | 0.82±0.05 | 0.80±0.06 | 0.04 | 0.63
(0.49-0.76) | 0.77 | 0.88 | 0.41 | 0.29 |
| RLM | MaxIntensity | 801.47±317.41 | 1143.22±307.91 | <0.01 | 0.78
(0.67-0.88) | 873.50 | 0.85 | 0.62 | 0.47 |
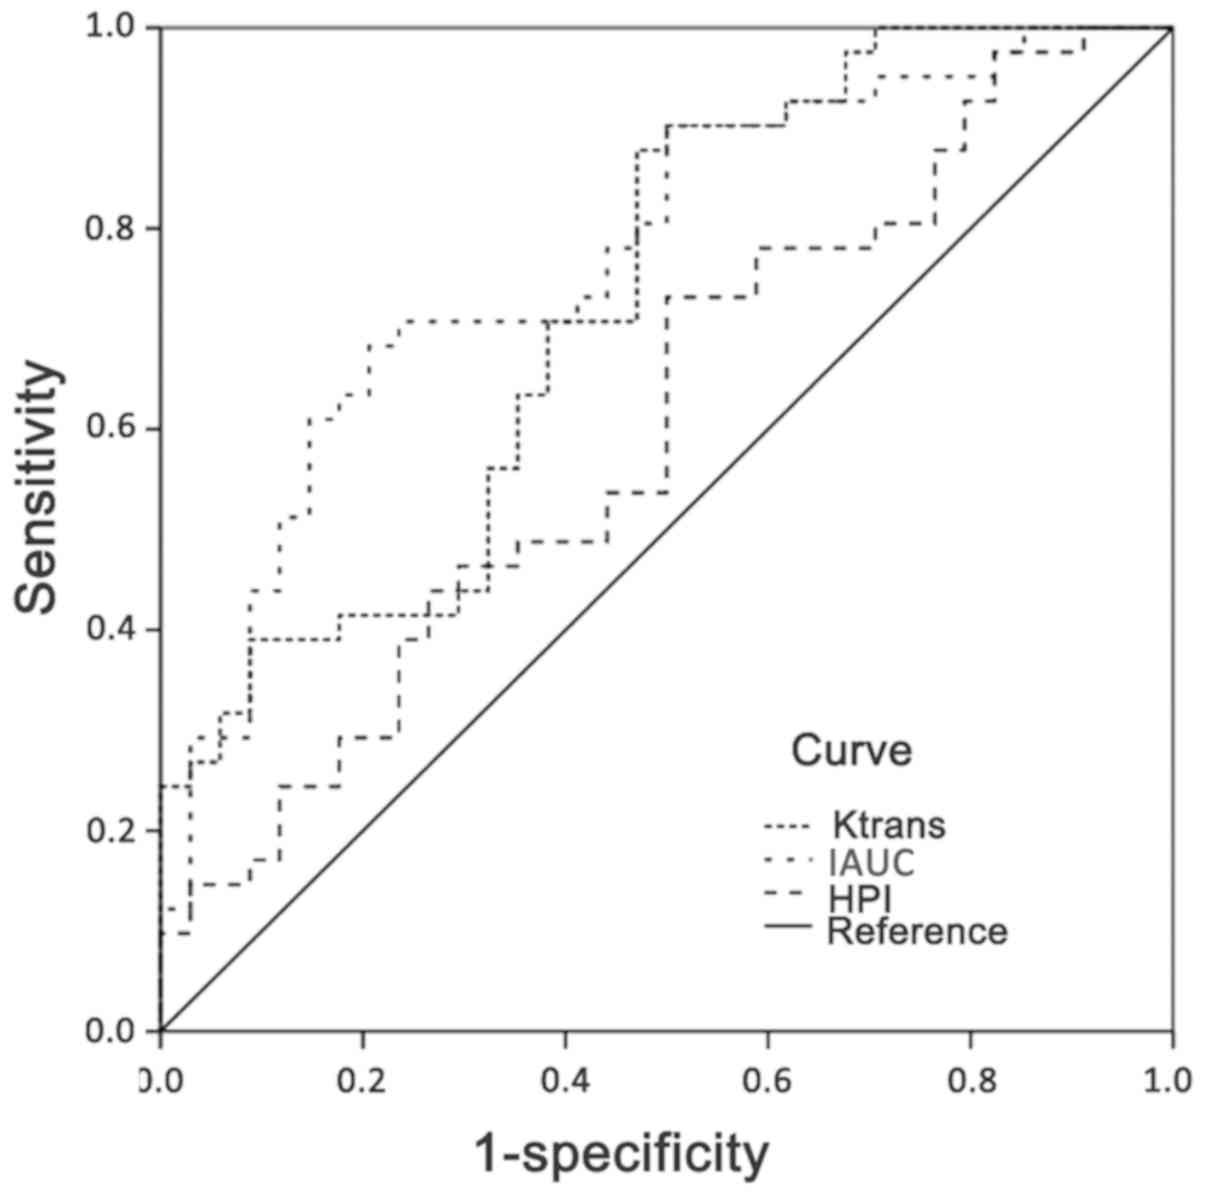
Efficacy of pharmacokinetic parameters
and radiomic features
The areas under the ROC curves of pharmacokinetic
parameters Ktrans, IAUC and HPI were 0.73 (0.61-0.84,
95% CI),0.77 (0.67-0.88, 95% CI) and 0.67 (0.55-0.79, 95% CI),
respectively (Table III and
Fig. 3). The areas under the ROC
curves of the 17 radiomic features with statistical differences
were between 0.63 and 0.79 (Table
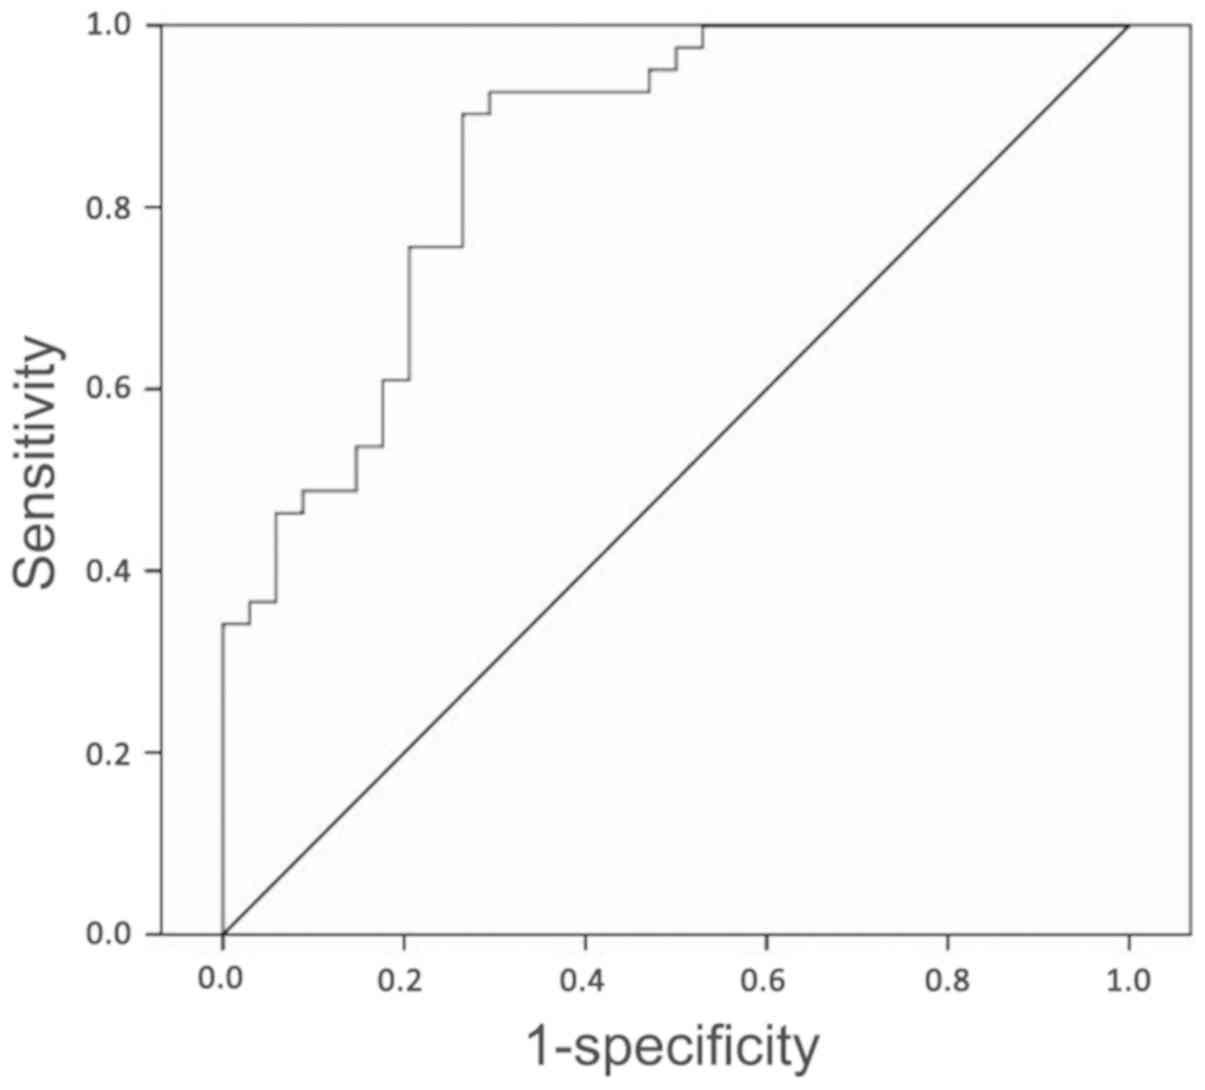
IV and Fig. 4). The combination
of pharmacokinetic parameters and radiomic features was termed the
P-R parameter. The area under the ROC curve of the P-R parameter
was 0.86 (95% CI, 0.77-0.94), with a sensitivity of 90.24% and
specificity of 73.53% (Fig. 5).
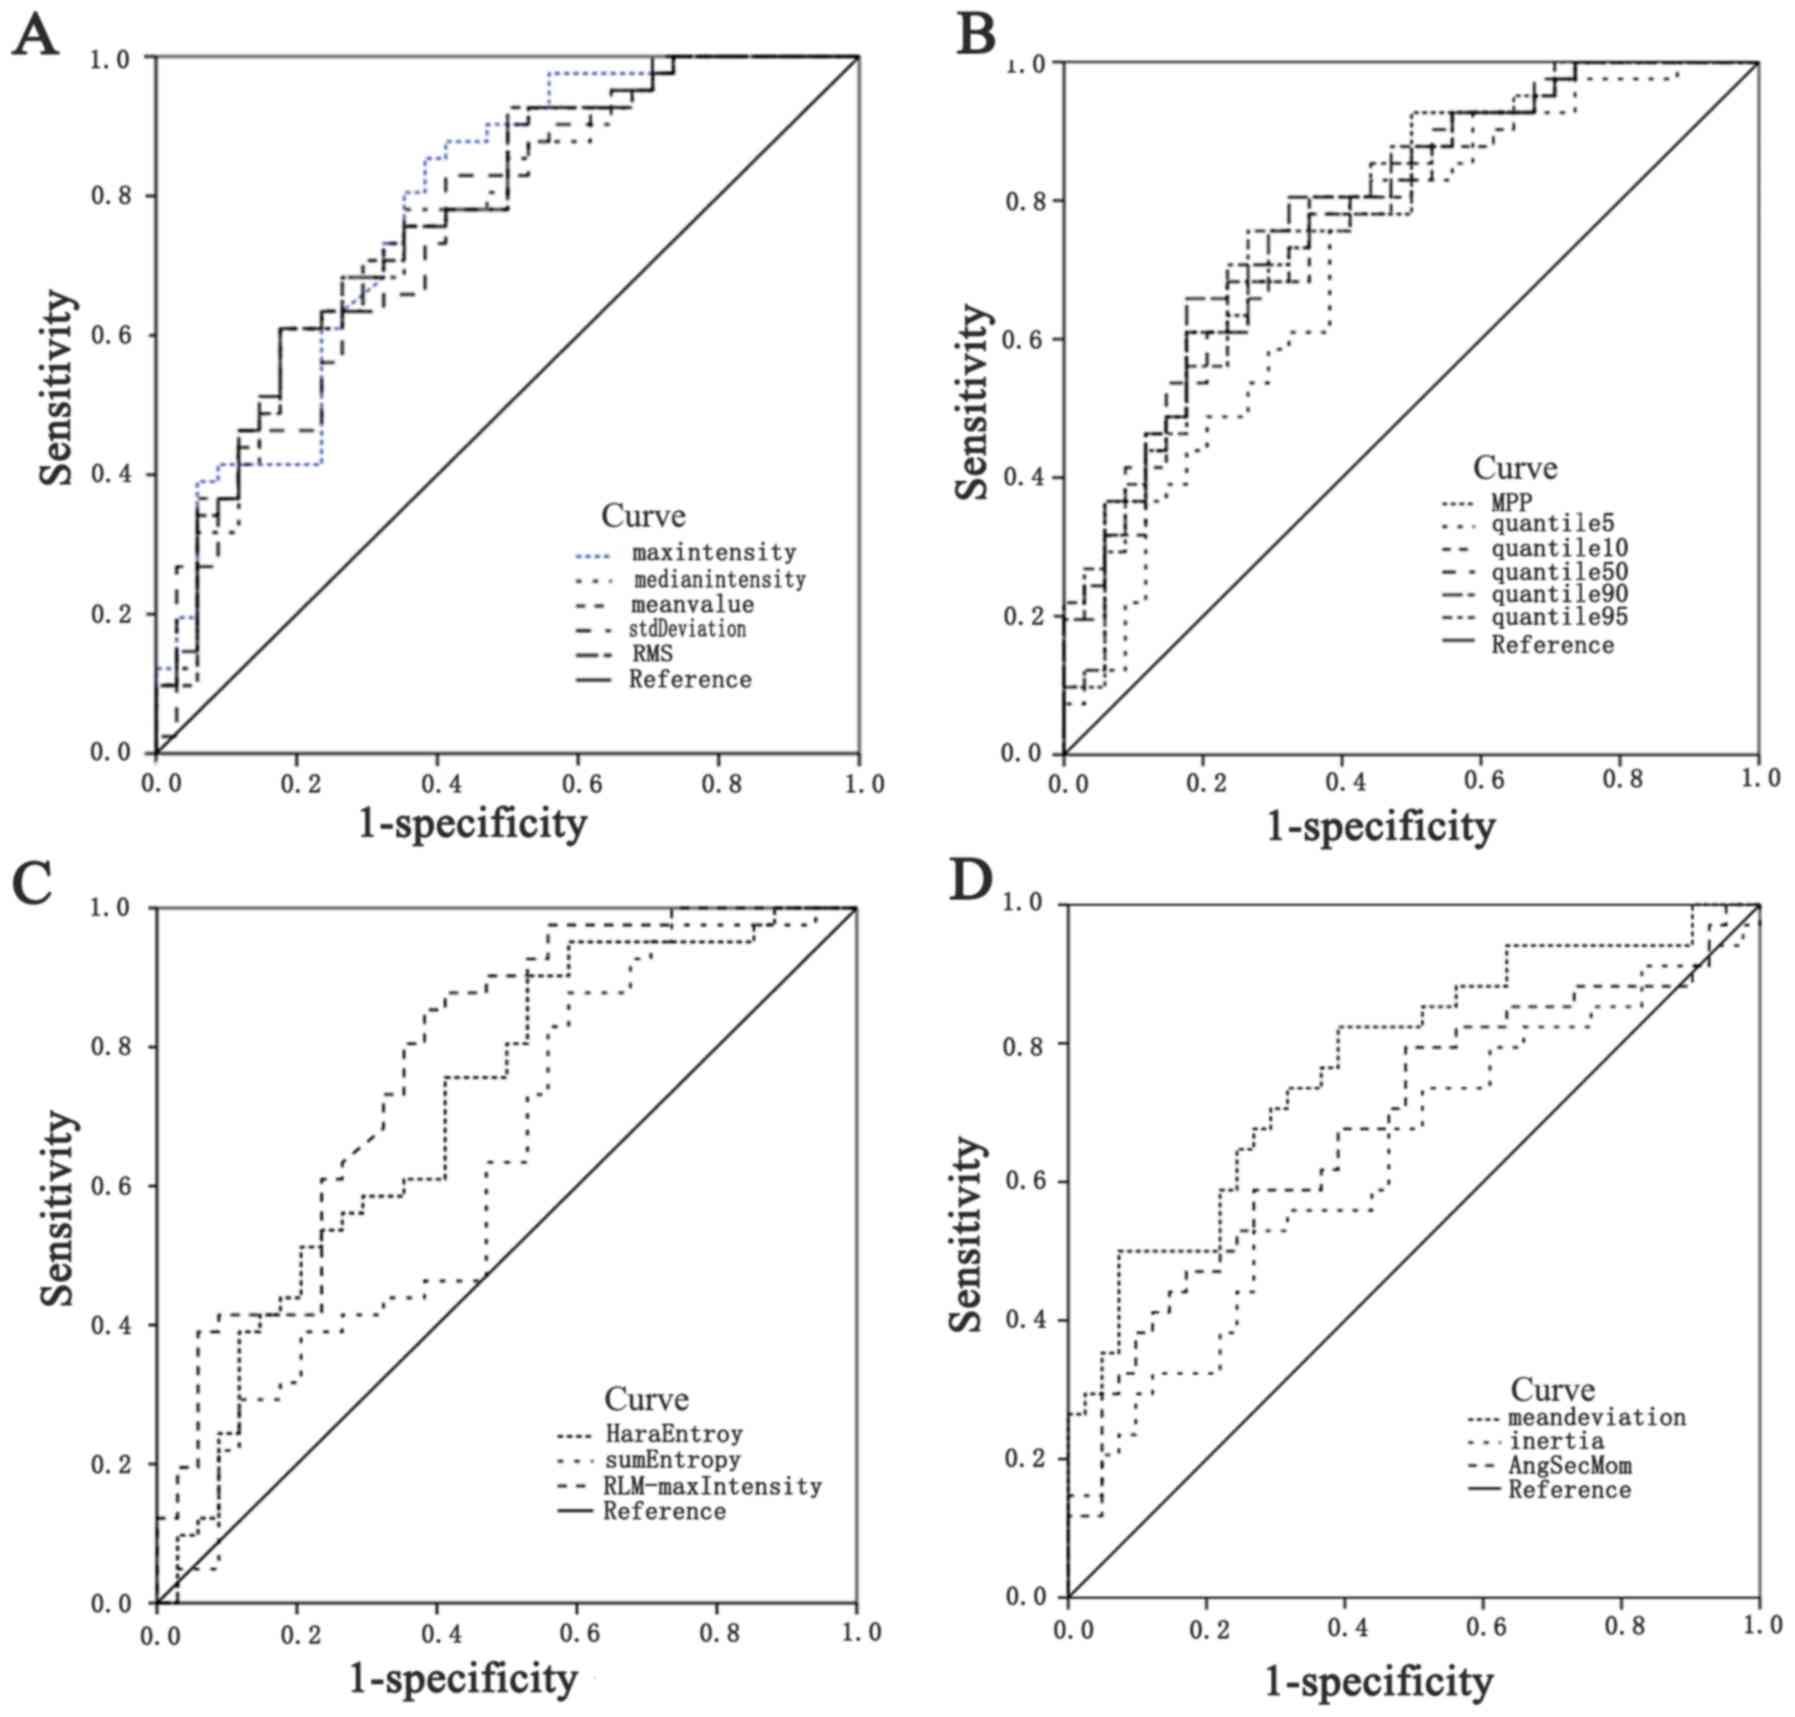 | Figure 4Receiver operating characteristic
curves of the radiomic features. (A) Max intensity,Median
intensity,Mean value,Standard deviation,RMS; (B) MPP,
Quantile5,Quantile10,Quantile50,Quantile90,Quantile95; (C) Haralick
entropy,Sum entropy, RLM-Max intensity; (D) Mean deviation,Inertia,
AngSecMoment. RMS,root mean square; MPP,mean positive pixel;
RLM,run length matrix; AngSecMom,angular second moment. |
Discriminant models based on the
radiomic features
The training dataset comprised the 67 radiomic
features from the two groups (a total of 75 cases). Accordingly, 14
radiomic features were enrolled to build the discriminant functions
required to differentiate HCC from HMRC by calculating the
correlation coefficient of intraclass and interclass cases as
follows:
Where Yi (Y1, HCC;
Y2, HMRC) refers to the corresponding scores that
determine the tumor classification. If the score of one specified
lesion was close to 1, the corresponding case was recognized as
HCC. If the score of one specified lesion was close to 2, the case
was recognized as HMRC. The FDA model automatically iterated 67
times to achieve accuracy, and the leave-one-out cross-validation
method was performed to validate that accuracy (Table V).
| Table VResults of the discriminant models
based on the radiomic features. |
Table V
Results of the discriminant models
based on the radiomic features.
| | Prediction | |
|---|
| Method | Group | N | HCC (%) | HMRC (%) | Discriminant
accuracy (%) |
|---|
| FDA training
dataset | HCC | 41 | 39 (95.1) | 2 (4.9) | 89.3 |
| | HMRC | 34 | 6 (17.6) | 28 (82.4) | |
| Leave-one-out
cross-validation | HCC | 41 | 35 (85.4) | 6 (14.6) | 80.0 |
| | HMRC | 34 | 9 (26.5) | 25 (73.5) | |
Discussion
In the present retrospective study, in order to
evaluate HCC and HMRC in the DCE-MRI of lesions, two types of
parameters were examined, namely pharmacokinetic parameters and
radiomic features, and their values were comprehensively analyzed.
Both types of parameters contributed to differentiating HCC from
HRMC, and their incorporation improved the efficacy of diagnosis
compared with that of either type alone. In addition, the
discriminant model based on the radiomic features further enhanced
the identification of HCC and HMRC.
In the present study, a number of measures were
taken to acquire accurate data (18-21).
First, the same MR scanner was used for all patients. Scanning was
performed at the end-expiratory breath holding, and 3D non-rigid
registration was used to reduce motion artifacts. Contrast agent
was simultaneously injected and scanned, and the scanning interval
was ≤6 sec in the four following phases to ensure that the images
with the most notable enhancement phase of the hepatic artery were
captured. A total of 22 phases were scanned to uniformly obtain
successive and complete DCE-MRIs. Following an elbow vein injection
in all cases, the constants of the injection rate and concentration
were determined to ensure the consistency of the contrast agent
concentration perfusion to the liver in correspondence with VIF.
These measures also prevented any differences caused by various
contrast agent concentrations. Secondly, an extended Tofts with
dual-input two-compartment model was selected instead of the
traditional two-compartment Tofts model. The selected model
considered hepatic artery and portal vein input to the liver.
Images of the derived radiomic features were selected from the
phase when AIF reached the peak; images from this phase were the
most representative of disease characteristics and revealed the
most information about these characteristics. Thirdly, in image
segmentation, vascular, cystic and necrotic areas were avoided by
manually drawing the ROIs to ensure the precision of the selected
area. Three successive layers were measured to avoid statistical
accidental error in the selected lesions. All measures taken in
this experiment were conducive to obtaining the accurate values of
pharmacokinetic parameters and radiomic features.
As a non-invasive and radiation-free examination
method, MRI reveals the internal information of malignant tumors
from multiple perspectives using different imaging technology
modes. In addition, DCE-MRIs were also indicated in addition to the
enhancement characteristics. The perfusion and permeability
parameters obtained though the pharmacokinetic model may be used to
assess the changes microvascular blood supply to the tumor
(22). These functional
pharmacokinetic parameters, such as Ktrans, IAUC and
HPI, may reflect the hemodynamic changes of microvessels in the
tumor region, describe the characteristics of tumor lesions and
reflect the properties of the lesions from different perspectives
to identify tumors to a certain extent (21,23).
Ktrans refers to the rate by which the contrast agent
leaks into the extracellular fluid space outside blood vessels and
is associated with total blood perfusion, vascular surface area and
vascular permeability, thus reflecting the changes in the integrity
of tissue microvessels (8). Compared
with normal tissues, tumor tissues are characterized by an
abundance of nascent capillaries, higher microvascular density,
larger vascular osmotic surface area, immature microvessels, wider
endothelial cell space, incomplete basement membrane and
pathological basement membrane structure; this results in increases
in tumor tissue microvascular permeability and its
Ktrans value (24). In
the present study, the Ktrans value of HCC was higher
compared with that of HRMC, indicating that HCC exhibited a higher
level of infiltration and permeability compared with those of HRMC
on the vascular surface, which may be used for the differential
diagnosis of the two lesions. The IAUC value, which was represented
by the AUC of the time-concentration curve of the contrast agent,
refers to the estimated value of the concentration of the contrast
agent in the lesion (9). The degree
of enhancement varies for lesions with different etiologies, and
the IAUC value may be used to identify lesions with different
properties (19,21). The results of the present study
demonstrated that the IAUC values of the two groups were
significantly different, suggesting that IAUC discriminated between
the two lesions, which was consistent with a previously published
study (25). The perfusion parameter
HPI is the perfusion ratio of the hepatic artery, and the hepatic
artery provides 20-30% of the blood supply under the physiological
status of the liver (26). The
biological behavior of the tumor, which includes tumorigenesis,
growth and progression, depends on angiogenesis; therefore,
different types of tumors have different blood supplies (26). HCC is usually associated with a rich
blood supply that mainly originates from the hepatic artery
(26). However, the richness or
poorness of the blood supply of the tumor remains controversial.
Previous studies have demonstrated that the hepatic artery is the
main source of blood supply for HMRC, regardless of whether the
blood supply is rich or poor (19,27). The
results of the present study revealed that the HPI values of the
two groups were significantly higher compared with those of normal
liver tissue, confirming that the hepatic artery was the main
source of blood supply for HCC and HMRC tumors. In addition, the
HPI values between the two groups were significantly different.
This result was consistent with the findings of previous studies,
which demonstrated that HPI distinguished HCC from HMRC (19,27). The
pharmacokinetic parameters Ktrans, IAUC and HPI reflect
the relevant characteristics and properties of lesions from
different perspectives, which may be used to identify HCC and
HMRC.
Radiomics analysis, which uses the law of change and
distribution of image pixel gray value, is used as a mathematical
engineering method to express radiomics characteristic information
(28). The differences in medical
images caused by tumor heterogeneity can be quantified using
radiomic features. Therefore, radiomics data are potentially
associated with pathology (29). In
addition, radiomics data provide quantitative information about
tumor characteristics and have the potential to discover disease
characteristics that cannot be observed by the naked eye by
combining mathematics, engineering and medical science (30). DCE-MRI based on anatomical structure
provides functional information, including that on perfusion and
metabolism, due to differences in lesion tissues (31). The functional information differences
in DCE images of biological characteristics and heterogeneity of
tumors may be reflected by the values of the radiomic features
(31,32). In addition, the present study
confirmed that radiomics analysis could be used in the differential
diagnosis of HCC and HMRC. In the present study, 67 radiomic
features were obtained using OmniKinetic software; however, only 17
features exhibited significant differences, indicating that there
were several common features in the tumor characteristics between
HCC and HMRC lesions, including blood supply and microvascular
changes. Identifying these images by the naked eye is challenging;
however, after considerable information screening, highly efficient
radiomic features of the identity of the two lesions were obtained.
Therefore, radiomic feature analysis may help clinicians identify
HCC and HMRC.
In the present study, ROC curves and logistic
regression were used for analysis. ROC curves used AUC to evaluate
the diagnostic efficiency of each pharmacokinetic parameter and
radiomic feature. These high values of AUCs of Ktrans,
IAUC, HPI and radiomic features indicate that pharmacokinetic
parameters and radiomic features effectively differentiated HCC
from HMRC (Tables III and IV; Figs. 3
and 4). The AUC of incorporated
parameter P-R was 0.86, which was higher compared with that of each
of the pharmacokinetic parameters and radiomic features alone. P-R
was also demonstrated to have high sensitivity and specificity.
Therefore, it can be concluded that combining pharmacokinetics and
high-accuracy radiomics improved the detection rate of HCC.
Radiomic features and regression model analysis for
evaluating disease diagnosis, development, treatment and prognosis
have become popular in recent years (33). In the present study, the mathematical
model FDA was applied for the analysis of the radiomic features.
FDA established the discriminant model to determine the minimum
covariance between samples within the same category, and maximum
covariance between samples within different categories. The FDA
method provided two discriminant functions Y1 and
Y2 for HCC and HMRC, respectively. The category of
unidentified liver tumors may be easily recognized through this
model, which can automatically draw conclusions using statistical
calculations. The FDA model exhibited 89.3% discriminant accuracy
and good calibration with 80% accuracy within the datasets of the
two groups, thereby showing marked discrimination. To the best of
our knowledge, previous studies propounded several radiomics
methods for the differentiation of tumors, but a limited number of
studies have provided discriminant functions (34). Compared with complicated discriminant
methods, FDA is an accessible approach that considers intergroup
and intragroup covariance (33).
However, the present study is a pilot study of differentiation
research on HCC and HMRC; considering the limited number of cases,
no additional patients were used as an external dataset to validate
the regression. This will be addressed in a future study.
The present study had several limitations. The MRI
system, sequences, time resolution, perfusion time, contrast agent,
dose, concentration and injection rate affected the value of the
parameters; therefore, the findings might differ from those of
previous studies (35). However, the
study design was based on the same reference standard for all
patients. Secondly, the radiomic features extracted from DCE-MRI
may be different from those presented in previous studies due to
variations in radiomics analysis software (36). Thirdly, radiomics and FDA require
further multicenter analysis with a large sample size.
In conclusion, the present study demonstrated that
DCE-MRI was useful for the differential diagnosis of HCC and HMRC
by extracting pharmacokinetic parameters and radiomic features, and
the incorporation of the two methods improved the diagnostic
efficacy. When mathematical engineering techniques are adequately
exploited, the discriminant models based on the radiomic features
have potential to diagnose unidentified liver tumors. Thus, this
method is worthy of further exploration in clinical settings.
Acknowledgements
The authors would like to thank Professor Dechao
Feng and Dr Meng Zhao (Department of Radiology, Qilu Hospital,
Shandong University, Jinan, China), Dr Jieqiong Wang (Department of
Radiology, Taikang Xianlin Drum Tower Hospital, Nanjing, China) and
Dr Yumei Zhang (Department of Radiology, Yantai Yuhuangding
Hospital, Qingdao Medical College, Yantai, China) for their advice
on the operation of MRI technology. The current study was supported
by Dr Xiao Xu (GE Healthcare, Shanghai, China) on the technology of
OmniKinetic software application.
Funding
Not applicable.
Availability of data and materials
The datasets used and/or analyzed during the current
study are available from the corresponding author on reasonable
request.
Authors' contributions
ZJL contributed to the conception and design of the
study, data acquisition and analysis, figure modification and
writing of the manuscript. FX and XHX contributed to the data
acquisition. QW contributed to the conception and design of the
study and revising of the manuscript. XXZ contributed to the
conception and design of the study, data analysis and figure
creation. All authors read and approved the final manuscript.
Ethics approval and consent to
participate
The present study was approved by Ethics Committee
for Human Studies, Qilu Hospital, Cheeloo College of Medicine,
Shandong University (Shandong, China), and written informed consent
was obtained from all patients.
Patient consent for publication
Not applicable.
Competing interests
XXZ is affiliated with GE Healthcare, which provided
computer equipment with the OmniKinetics software installed and
technology support for this study. All other authors declare that
they have no competing interests.
References
|
1
|
Bosetti C, Turati F and La Vecchia C:
Hepatocellular carcinoma epidemiology. Best Pract Res Clin
Gastroenterol. 28:753–770. 2014.PubMed/NCBI View Article : Google Scholar
|
|
2
|
Hartke J, Johnson M and Ghabril M: The
diagnosis and treatment of hepatocellular carcinoma. Semin Diagn
Pathol. 34:153–159. 2017.PubMed/NCBI View Article : Google Scholar
|
|
3
|
Balyasnikova S and Brown G: Optimal
imaging strategies for rectal cancer staging and ongoing
management. Curr Treat Options Oncol. 17(32)2016.PubMed/NCBI View Article : Google Scholar
|
|
4
|
Yang JD, Hainaut P, Gores GJ, Amadou A,
Plymoth A and Roberts LR: A global view of hepatocellular
carcinoma: Trends, risk, prevention and management. Nat Rev
Gastroenterol Hepatol. 16:589–604. 2019.PubMed/NCBI View Article : Google Scholar
|
|
5
|
Kye BH, Lee SH, Jeong WK, Yu CS, Park IJ,
Kim HR, Kim J, Lee IK, Park KJ, Choi HJ, et al: Which strategy is
better for resectable synchronous liver metastasis from colorectal
cancer, simultaneous surgery, or staged surgery? Multicenter
retrospective analysis. Ann Surg Treat Res. 97:184–193.
2019.PubMed/NCBI View Article : Google Scholar
|
|
6
|
Lamba R, Fananapazir G, Corwin MT and
Khatri VP: Diagnostic imaging of hepatic lesions in adults. Surg
Oncol Clin N Am. 23:789–820. 2014.PubMed/NCBI View Article : Google Scholar
|
|
7
|
Kim H, Mousa M, Schexnailder P,
Hergenrother R, Bolding M, Ntsikoussalabongui B, Thomas V and
Morgan DE: Portable perfusion phantom for quantitative DCE-MRI of
the abdomen. Med Phys. 44:5198–5209. 2017.PubMed/NCBI View
Article : Google Scholar
|
|
8
|
Chen BB, Hsu CY, Yu CW, Liang PC, Hsu C,
Hsu CH, Cheng AL and Shih TT: Early perfusion changes within 1 week
of systemic treatment measured by dynamic contrast-enhanced MRI may
predict survival in patients with advanced hepatocellular
carcinoma. Eur Radiol. 27:3069–3079. 2017.PubMed/NCBI View Article : Google Scholar
|
|
9
|
Chouhan MD, Bainbridge A, Atkinson D,
Punwani S, Mookerjee RP, Lythgoe MF and Taylor SA: Improved hepatic
arterial fraction estimation using cardiac output correction of
arterial input functions for liver DCE MRI. Phys Med Biol.
62:1533–1546. 2017.PubMed/NCBI View Article : Google Scholar
|
|
10
|
Joo I, Lee JM, Han JK, Yang HK, Lee HJ and
Choi BI: Dynamic contrast-enhanced MRI of gastric cancer:
Correlation of the perfusion parameters with pathological
prognostic factors. J Magn Reson Imaging. 41:1608–1614.
2015.PubMed/NCBI View Article : Google Scholar
|
|
11
|
Lambin P, Leijenaar RTH, Deist TM,
Peerlings J, de Jong EEC, van Timmeren J, Sanduleanu S, Larue RTHM,
Even AJG, Jochems A, et al: Radiomics: The bridge between medical
imaging and personalized medicine. Nat Rev Clin Oncol. 14:749–762.
2017.PubMed/NCBI View Article : Google Scholar
|
|
12
|
Huang Y, Liang C, He L, Tian J, Liang CS,
Chen X, Ma ZL and Liu ZY: Development and validation of a radiomics
nomogram for preoperative prediction of lymph node metastasis in
colorectal cancer. J Clin Oncol. 34:2157–2164. 2016.PubMed/NCBI View Article : Google Scholar
|
|
13
|
Huang Y, Liu Z, He L, Chen X, Pan D, Ma Z
and Liang C, Tian J and Liang C: Radiomics signature: A potential
biomarker for the prediction of disease-free survival in
early-stage (I or II) non-small cell lung cancer. Radiology.
281:947–957. 2016.PubMed/NCBI View Article : Google Scholar
|
|
14
|
Yang JF, Zhao ZH, Zhang Y, Zhao L, Yang
LM, Zhang MM, Wang BY, Wang T and Lu BC: Dual-input two-compartment
pharmacokinetic model of dynamic contrast-enhanced magnetic
resonance imaging in hepatocellular carcinoma. World J
Gastroenterol. 22:3652–3662. 2016.PubMed/NCBI View Article : Google Scholar
|
|
15
|
Tao X, Wang L, Hui Z, Liu L, Ye F, Song Y,
Tang Y, Men Y, Lambrou T, Su Z, et al: DCE-MRI Perfusion and
permeability parameters as predictors of tumor response to CCRT in
patients with locally advanced NSCLC. Sci Rep.
6(35569)2016.PubMed/NCBI View Article : Google Scholar
|
|
16
|
R Core Team: R: A language and environment
for statistical computing. R Foundation for Statistical Computing,
Vienna, Austria, 2013.
|
|
17
|
Li J, Wang W, Xia P, Wan L, Zhang L, Yu L,
Wang L, Chen X, Xiao Y and Xu C: Identification of a five-lncRNA
signature for predicting the risk of tumor recurrence in patients
with breast cancer. Int J Cancer. 143:2150–2160. 2018.PubMed/NCBI View Article : Google Scholar
|
|
18
|
Heacock L, Gao Y, Heller SL, Melsaether
AN, Babb JS, Block TK, Otazo R, Kim SG and Moy L: Comparison of
conventional DCE-MRI and a novel golden-angle radial multicoil
compressed sensing method for the evaluation of breast lesion
conspicuity. J Magn Reson Imaging. 45:1746–1752. 2017.PubMed/NCBI View Article : Google Scholar
|
|
19
|
Ginsburg SB, Algohary A, Pahwa S, Gulani
V, Ponsky L, Aronen HJ, Boström PJ, Böhm M, Haynes AM, Brenner P,
et al: Radiomic features for prostate cancer detection on MRI
differ between the transition and peripheral zones: Preliminary
findings from a multi-institutional study. J Magn Reson Imaging.
46:184–193. 2017.PubMed/NCBI View Article : Google Scholar
|
|
20
|
Aronhime S, Calcagno C, Jajamovich GH,
Dyvorne HA, Robson P, Dieterich D, Fiel MI, Martel-Laferriere V,
Chatterji M, Rusinek H and Taouli B: DCE-MRI of the liver: Effect
of linear and nonlinear conversions on hepatic perfusion
quantification and reproducibility. J Magn Reson Imaging. 40:90–98.
2014.PubMed/NCBI View Article : Google Scholar
|
|
21
|
Grossmann P, Narayan V, Chang K, Rahman R,
Abrey L, Reardon DA, Schwartz LH, Wen PY, Alexander BM, Huang R and
Aerts HJWL: Quantitative imaging biomarkers for risk stratification
of patients with recurrent glioblastoma treated with bevacizumab.
Neuro Oncol. 19:1688–1697. 2017.PubMed/NCBI View Article : Google Scholar
|
|
22
|
O'Neill AF, Qin L, Wen PY, de Groot JF,
Van den Abbeele AD and Yap JT: Demonstration of DCE-MRI as an early
pharmacodynamic biomarker of response to VEGF Trap in glioblastoma.
J Neurooncol. 130:495–503. 2016.PubMed/NCBI View Article : Google Scholar
|
|
23
|
Lee SH, Hayano K, Zhu AX, Sahani DV and
Yoshida H: Dynamic contrast-enhanced MRI kinetic parameters as
prognostic biomarkers for prediction of survival of patient with
advanced hepatocellular carcinoma: A pilot comparative study. Acad
Radiol. 22:1344–1360. 2015.PubMed/NCBI View Article : Google Scholar
|
|
24
|
Gandhi M, Choo SP, Thng CH, Tan SB, Low
AS, Cheow PC, Goh AS, Tay KH, Lo RH, Goh BK, et al: Single
administration of selective internal radiation therapy versus
continuous treatment with sorafeNIB in locally advanced
hepatocellular carcinoma (SIRveNIB): Study protocol for a phase III
randomized controlled trial. BMC Cancer. 16(856)2016.PubMed/NCBI View Article : Google Scholar
|
|
25
|
Gaeta M, Benedetto C, Minutoli F, D'Angelo
T, Amato E, Mazziotti S, Racchiusa S, Mormina E, Blandino A and
Pergolizzi S: Use of diffusion-weighted, intravoxel incoherent
motion, and dynamic contrast-enhanced MR imaging in the assessment
of response to radiotherapy of lytic bone metastases from breast
cancer. Acad Radiol. 21:1286–1293. 2014.PubMed/NCBI View Article : Google Scholar
|
|
26
|
Şen H, Tan YZ, Binnetoğlu E, Aşik M, Güneş
F, Erbağ G, Gazi E, Cevizci S, Özdemir S, Akbal E and Ükinç K:
Evaluation of liver perfusion in diabetic patients using 99
mTc-sestamibi. Wien Klin Wochenschr. 127:19–23. 2015.PubMed/NCBI View Article : Google Scholar
|
|
27
|
Kusano M, Honda M, Okabayashi K, Akimaru
K, Kino S, Tsuji Y, Watanabe M, Suzuki S, Yoshikawa T, Sakamoto J,
et al: Randomized controlled phase III study comparing hepatic
arterial infusion with systemic chemotherapy after curative
resection for liver metastasis of colorectal carcinoma: JFMC
29-0003. J Cancer Res Ther. 13:84–90. 2017.PubMed/NCBI View Article : Google Scholar
|
|
28
|
Avanzo M, Stancanello J and El Naqa I:
Beyond imaging: The promise of radiomics. Phys Med. 38:122–139.
2017.PubMed/NCBI View Article : Google Scholar
|
|
29
|
Peeken JC, Nüsslin F and Combs SE:
‘Radio-oncomics’: The potential of radiomics in radiation oncology.
Strahlenther Onkol. 193:767–779. 2017.PubMed/NCBI View Article : Google Scholar
|
|
30
|
Peeken JC, Bernhofer M, Wiestler B,
Goldberg T, Cremers D, Rost B, Wilkens JJ, Combs SE and Nüsslin F:
Radiomics in radiooncology-challenging the medical physicist. Phys
Med. 48:27–36. 2018.PubMed/NCBI View Article : Google Scholar
|
|
31
|
Limkin EJ, Sun R, Dercle L, Zacharaki EI,
Robert C, Reuzé S, Schernberg A, Paragios N, Deutsch E and Ferté C:
Promises and challenges for the implementation of computational
medical imaging (radiomics) in oncology. Ann Oncol. 28:1191–1206.
2017.PubMed/NCBI View Article : Google Scholar
|
|
32
|
Li Y, Liu X, Xu K, Qian Z, Wang K, Fan X,
Li S, Wang Y and Jiang T: MRI features can predict EGFR expression
in lower grade gliomas: A voxel-based radiomic analysis. Eur
Radiol. 28:356–362. 2018.PubMed/NCBI View Article : Google Scholar
|
|
33
|
Li Z, Sun J, Chen L, Huang N, Hu P, Hu X,
Han G, Zhou Y, Bai W, Niu T and Yang X: Assessment of liver
fibrosis using pharmacokinetic parameters of dynamic
contrast-enhanced magnetic resonance imaging. Magn Reson Imaging.
44:98–104. 2016.PubMed/NCBI View Article : Google Scholar
|
|
34
|
Shan QY, Hu HT, Feng ST, Peng ZP, Chen SL,
Zhou Q, Li X, Xie XY, Lu MD, Wang W and Kuang M: CT-based
peritumoral radiomics signatures to predict early recurrence in
hepatocellular carcinoma after curative tumor resection or
ablation. Cancer Imaging. 19(11)2019.PubMed/NCBI View Article : Google Scholar
|
|
35
|
Khalifa F, Soliman A, El-Baz A, Abou
El-Ghar M, El-Diasty T, Gimel'farb G, Ouseph R and Dwyer AC: Models
and methods for analyzing DCE-MRI: A review. Med Phys.
41(124301)2014.PubMed/NCBI View Article : Google Scholar
|
|
36
|
Rizzo S, Botta F, Raimondi S, Origgi D,
Fanciullo C, Morganti AG and Bellomi M: Radiomics: The facts and
the challenges of image analysis. Eur Radiol Exp.
2(36)2018.PubMed/NCBI View Article : Google Scholar
|