Introduction
Cholestasis is a disease in which bile flow is
impaired. Cholestasis may be caused by either intrahepatic or
extrahepatic dysfunction (1), and
may lead to a range of clinical hepatobiliary diseases, such as
liver failure, hepatobiliary malignancy and bile fibrosis,
cirrhosis (2). Ursodeoxycholic acid
(UDCA) is currently the only treatment approved by the US Food and
Drug Administration for the treatment of patients with cholestasis
(3). However, according to the
Primary Biliary Cholangitis Treatment and Management Guidelines
from the British Society of Gastroenterology from 2018, oral UDCA
is not an ideal therapeutic option as it may aggravate liver injury
and one-third of patients are unresponsive to it (4,5).
Melatonin is a hormone secreted primarily by the
pineal gland (6,7). Melatonin is involved in the regulation
of circadian rhythms, such as the sleep/wake rhythm, neuroendocrine
rhythm and body temperature cycles (8,9). There
are numerous studies suggesting that melatonin may be used to treat
liver disease and the hepatoprotective effects of melatonin may be
associated with its antioxidant properties (10). Previous studies by our group
demonstrated that the therapeutic effects of melatonin against
α-naphthyl isothiocyanate (ANIT)-induced acute cholestasis are
associated with the attenuation of oxidative stress (11,12).
ANIT is a widely utilized chemical substance able to
induce acute cholestasis by injuring bile duct epithelium and
hepatic parenchymal cells (13,14).
However, the mechanisms underlying ANIT-induced acute cholestasis
have remained to be fully elucidated. Due to its similarities with
drug-induced cholangiolitic hepatitis in humans, ANIT-induced acute
cholestasis has been widely used as a model of acute cholestasis in
susceptible species, such as rats (15-17).
Proteomics provides essential information on the
quantity, function and relationship of protein complexes (18). Isobaric tags for relative and
absolute quantitation (iTRAQ) combined with liquid
chromatography-tandem mass spectrometry (LC-MS/MS) analysis has
been used to determine protein quantities and their compositions
(19-22).
In the present study, the anti-cholestatic effect of melatonin in
rats was assessed using iTRAQ combined with LC-MS/MS to identify
the differentially expressed proteins in the samples. The
differentially expressed proteins were subjected to Gene Ontology
(GO) annotation and Kyoto Encyclopedia of Genes and Genomes (KEGG)
analyses in order to understand their effects and mechanisms.
Materials and methods
Chemicals and drugs
Table I provides
details of chemicals and drugs. AST, ALT, TBIL and DBIL were
detected by chemical oxidation assays. All other reagents were of
analytical grade or higher.
 | Table IDetails of chemicals and drugs. |
Table I
Details of chemicals and drugs.
|
Chemicals/drugs | Company |
|---|
| α-naphthyl
isothiocyanate | Sigma-Aldrich
(Merck KGaA) |
| Melatonin | Sigma-Aldrich
(Merck KGaA) |
| Carboxymethyl
cellulose sodium salt | Yuanye Biological
Technology Co., Ltd. |
| Aspartate
aminotransferase (cat. no. C010-2) | Nanjing Jiancheng
Bioengineering Institute |
| Alanine
aminotransferase (cat. no. C0009-2) | Nanjing Jiancheng
Bioengineering Institute |
| Total bilirubin
(cat. no. C019-1) | Nanjing Jiancheng
Bioengineering Institute |
| Direct bilirubin
(cat. no. C019-2) | Nanjing Jiancheng
Bioengineering Institute |
Experimental animals
Male Sprague-Dawley rats (weight, 240-280 g; age, 7
weeks) were procured from SPF-JD-SPF Biotech Co., Ltd. (Beijing,
China; certification no. SCXK-JING 2016-0002) and were allowed to
acclimatize for 1 week. All rats were maintained in cages with free
access to rat chow and water in a temperature-controlled (22-24˚C)
environment under a 12-h dark/light cycle with 50% humidity. The
present study was performed in accordance with the guidelines of
the animal care regulations of Beijing University of Chinese
Medicine and was approved by the Ethics Committee for Animal Care
and Treatment of Beijing University of Chinese Medicine (Beijing,
China; approval no. bucm-4-2017122735-4035).
Experimental design and experimental
groups
Table II provides
details on the grouping of the 30 rats. They were randomly
allocated into three groups of 10 as follows: Control group, model
group and melatonin group. The rats were fasted for 12 h prior to
injections. ANIT was dissolved in olive oil for administration at a
dose of 75 mg/kg body weight; in other words, 1 ml of ANIT solution
in olive oil (75 mg/ml) was given per 100 g b.w. ANIT solution was
administered by intraperitoneal injection at a dose of 75 mg/kg
body weight to induce liver injury with cholestasis in the model
and melatonin groups. The control group was injected with an
equivalent volume of olive oil (23,24). A
total of 12 h after the ANIT injection, each rat was weighed and
intervention was performed according to the group: In the melatonin
group, rats were administered melatonin via oral gavage at a dose
of 100 mg/kg, whereas the control and model groups were
administered with an equivalent volume of 1 ml 0.25% CMC. At 36 h
after ANIT treatment, rats were euthanized under pentobarbital
anesthesia (100 mg/kg) by exsanguination, and liver tissues and
serum samples were taken and frozen rapidly in liquid nitrogen
(24). All the samples were stored
at -80˚C.
| Table IIDetails of the animal experimental
design. |
Table II
Details of the animal experimental
design.
| | Treatment at each
time-point (h) |
|---|
| Group | 0 | 12 | 24 | 36 | 48 |
|---|
| Control | Fasting | Olive oil | 0.25% CMC | Fasting | Sacrifice |
| Model | Fasting | 75 mg/kg ANIT | 0.25% CMC | Fasting | Sacrifice |
| MT | Fasting | 75 mg/kg ANIT | 100 mg/kg MT | Fasting | Sacrifice |
Serum biochemistry
ALT, AST, TBIL and DBIL levels in rat serum were
measured using the corresponding commercially available kits
according to the manufacturer's protocol.
H&E staining and liver
biochemistry analysis
After sacrificing the rats, liver tissues were
collected and fixed using 10% formaldehyde and cut into 1x1x0.3 cm
slices. Sections were dehydrated in a gradient of alcohol
solutions, embedded in paraffin and the wax blocks were sliced into
4-5 µm sections. All sections were stained with H&E for
analysis of necrosis using a light microscope (BX53 microscope;
Olympus Corp.).
Proteomics chemicals and reagents
Urea, DL-dithiothreitol (DTT), iodoacetamide (IA),
IPG buffer and formic acid (FA) were purchased from GE Healthcare.
SDS, Tris-(hydroxymethyl)-amino-methane, trichloroacetic acid,
ammonium persulfate and N,N,N',N'-tetramethylethylenediamine were
purchased from Amresco. Tetraethyl-ammonium bromide (TEAB) and
Coomassie brilliant blue G-250 were obtained from Sigma-Aldrich
(Merck KGaA). Trypsin was from Promega Corp. and acetonitrile (ACN;
HPLC grade) and H2O were purchased from Thermo Fisher
Scientific, Inc.
Protein extraction
Samples were immediately ground in liquid nitrogen
and subsequently, 300 µl SDS lysis buffer was added. Protease
inhibitor (phenylmethylsulfonylfluoride) was added to a final
concentration of 1 mM, followed by mixing. The samples were
sonicated in an ice bath at 80 W with 1-sec on/off cycles for 3
min, which was repeated three times. The supernatant was collected
after centrifugation at 12,000 x g for 20 min at 4˚C. The
concentration of extracted protein in the supernatant was
determined using a bicinchoninic acid assay. The protein extract
was stored at -80˚C.
Protein digestion and iTRAQ
labeling
A total of 100 µg protein extract was mixed in 120
µl reducing buffer [10 mM DTT, 8 mM urea and 100 mM TEAB, pH 8.0]
and the solution was incubated at 60˚C for 1 h. IA was added to a
final concentration of 50 mM and left in the dark at room
temperature for 40 min. The supernatant was collected after
centrifugation at 12,000 x g for 20 min at 4˚C, and 100 µl 100 mM
TEAB was added, followed by centrifugation at 12,000 x g for 20 min
at 4˚C and the supernatant was collected. This step was repeated
twice, and after a final centrifugation at 12,000 x g for 20 min at
4˚C and the supernatant was collected, the peptides were collected.
A total of 50 µl 100 mM TEAB was added, the mixture was centrifuged
at 12,000 x g for 20 min at 4˚C again and the supernatant was
collected and lyophilized. The sample was reconstituted in 100 µl
100 mM TEAB and subsequently, 40 µl sample was transferred to a new
tube for labeling. A total of 100 µl of iTRAQ reagent was
transferred to the sample tube and 200 µl water was added to quench
the labeling reaction. The solution was lyophilized and the sample
was stored at -80˚C.
MS analysis
All analyses were performed on a Triple time of
flight 5600 MS machine (SCIEX) equipped with a Nanospray III source
(SCIEX). Samples were loaded onto a capillary C18 trap column (3 cm
x 100 µm) and then separated by a C18 column (15 cm x 75 µm) on an
Eksigent nanoLC-1D plus system (SCIEX). The flow rate was 300
nl/min and a linear gradient was applied over 90 min (from 5-85% B
over 90 min; mobile phase A was 0.1% FA in water and phase B was
95% ACN/0.1% FA in water). Data were acquired using a 2.4-kV ion
spray voltage, 35 psi curtain gas, 5 psi nebulizer gas and an
interface heater temperature at 150˚C. The MS scanned between 400
and 1,500 m/z with an accumulation time of 250 msec. For
Information-Dependent Acquisition, 30 MS/MS spectra (80 msec each;
mass range, 100-1,500 m/z) of MS peaks above an intensity of 260
with a charge state between 2 and 5 were acquired. A rolling
collision energy voltage was used for collision induced
dissociation fragmentation and MS/MS spectra acquisitions. Mass was
dynamically excluded for 22 sec.
Bioinformatics analysis of proteomic
data
Functional analysis of the differentially expressed
proteins identified was performed using GO annotation in the
categories molecular function (MF), biological process (BP) or
cellular component (CC) with the Database for Annotation,
Visualization and Integrated Discovery (DAVID) version 6.8
(david.ncifcrf.gov/). The overall steps
consisted of Sequence alignment, GO entry extraction mapping, GO
annotation and data augmentation. Subsequently, KEGG (genome.jp/kegg/pathway.html) was used to predict
the metabolic pathways of proteins in cells and the function of
these proteins. The data were obtained using the Search Tool for
the Retrieval of Interacting Genes and proteins (STRING) network
analysis (string-db.org/) and Cytoscape version
3.7.1. To be considered differentially expressed proteins, the
criteria were P<0.05 and a fold-change >1.5 or <0.67.
Western blot analysis
Western blots were performed using automated
capillary western blot, an automated capillary-based size sorting
system (ProteinSimple). All procedures were performed according to
the manufacturer's protocol. In brief, 8 µg of diluted protein
lysate was mixed with 2 µg fluorescent Master Mix (mixed 5 times)
and heated at 95˚C for 5 min. The samples, blocking reagents, wash
buffer, primary antibodies, secondary antibodies and
chemiluminescent substrate were dispensed into designated wells in
a manufacturer-provided microplate. The plate was loaded into the
instrument and protein was drawn into individual capillaries using
a 25-capillary cassette, provided by the manufacturer. Protein
separation and obtainment of the resulting chemiluminescent signal
were performed automatically on the individual capillaries using
the default settings. The data were analyzed using Compass software
(ProteinSimple; v2.7.1). Malate dehydrogenase 1 (MDH1) and
glutathione S-transferase Yb-3 (GSTM3) antibodies were purchased
from ProteinTech (1:50 dilution; cat. no. 15904-1-AP and
15214-1-AP, respectively); β-actin antibody was obtained from Cell
Signaling Technology, Inc. (1:50 dilution; cat. no. 4970; Cell
Signaling Technology, Inc.) and used as the loading control.
Secondary antibody was purchased from ProteinSimple (cat. no.
042-206). Incubation with primary and secondary antibodies was
performed at room temperature for 30 min.
Statistical analysis
Data analyses were performed using GraphPad Prism
software (version 5.0; GraphPad Software, Inc.). The individual
statistical tests used were the Mann-Whitney U-test, Wilcoxon's
matched-pairs signed-rank test and Spearman's test for
correlations. Student's t-test was used for analysis of statistical
significance between two groups and one-way analysis of variance
followed by Dunnett's post-hoc test was applied to analyse
statistical significance among three or more groups. P<0.05 was
considered to indicate a statistically significant difference.
Results
Histological observations
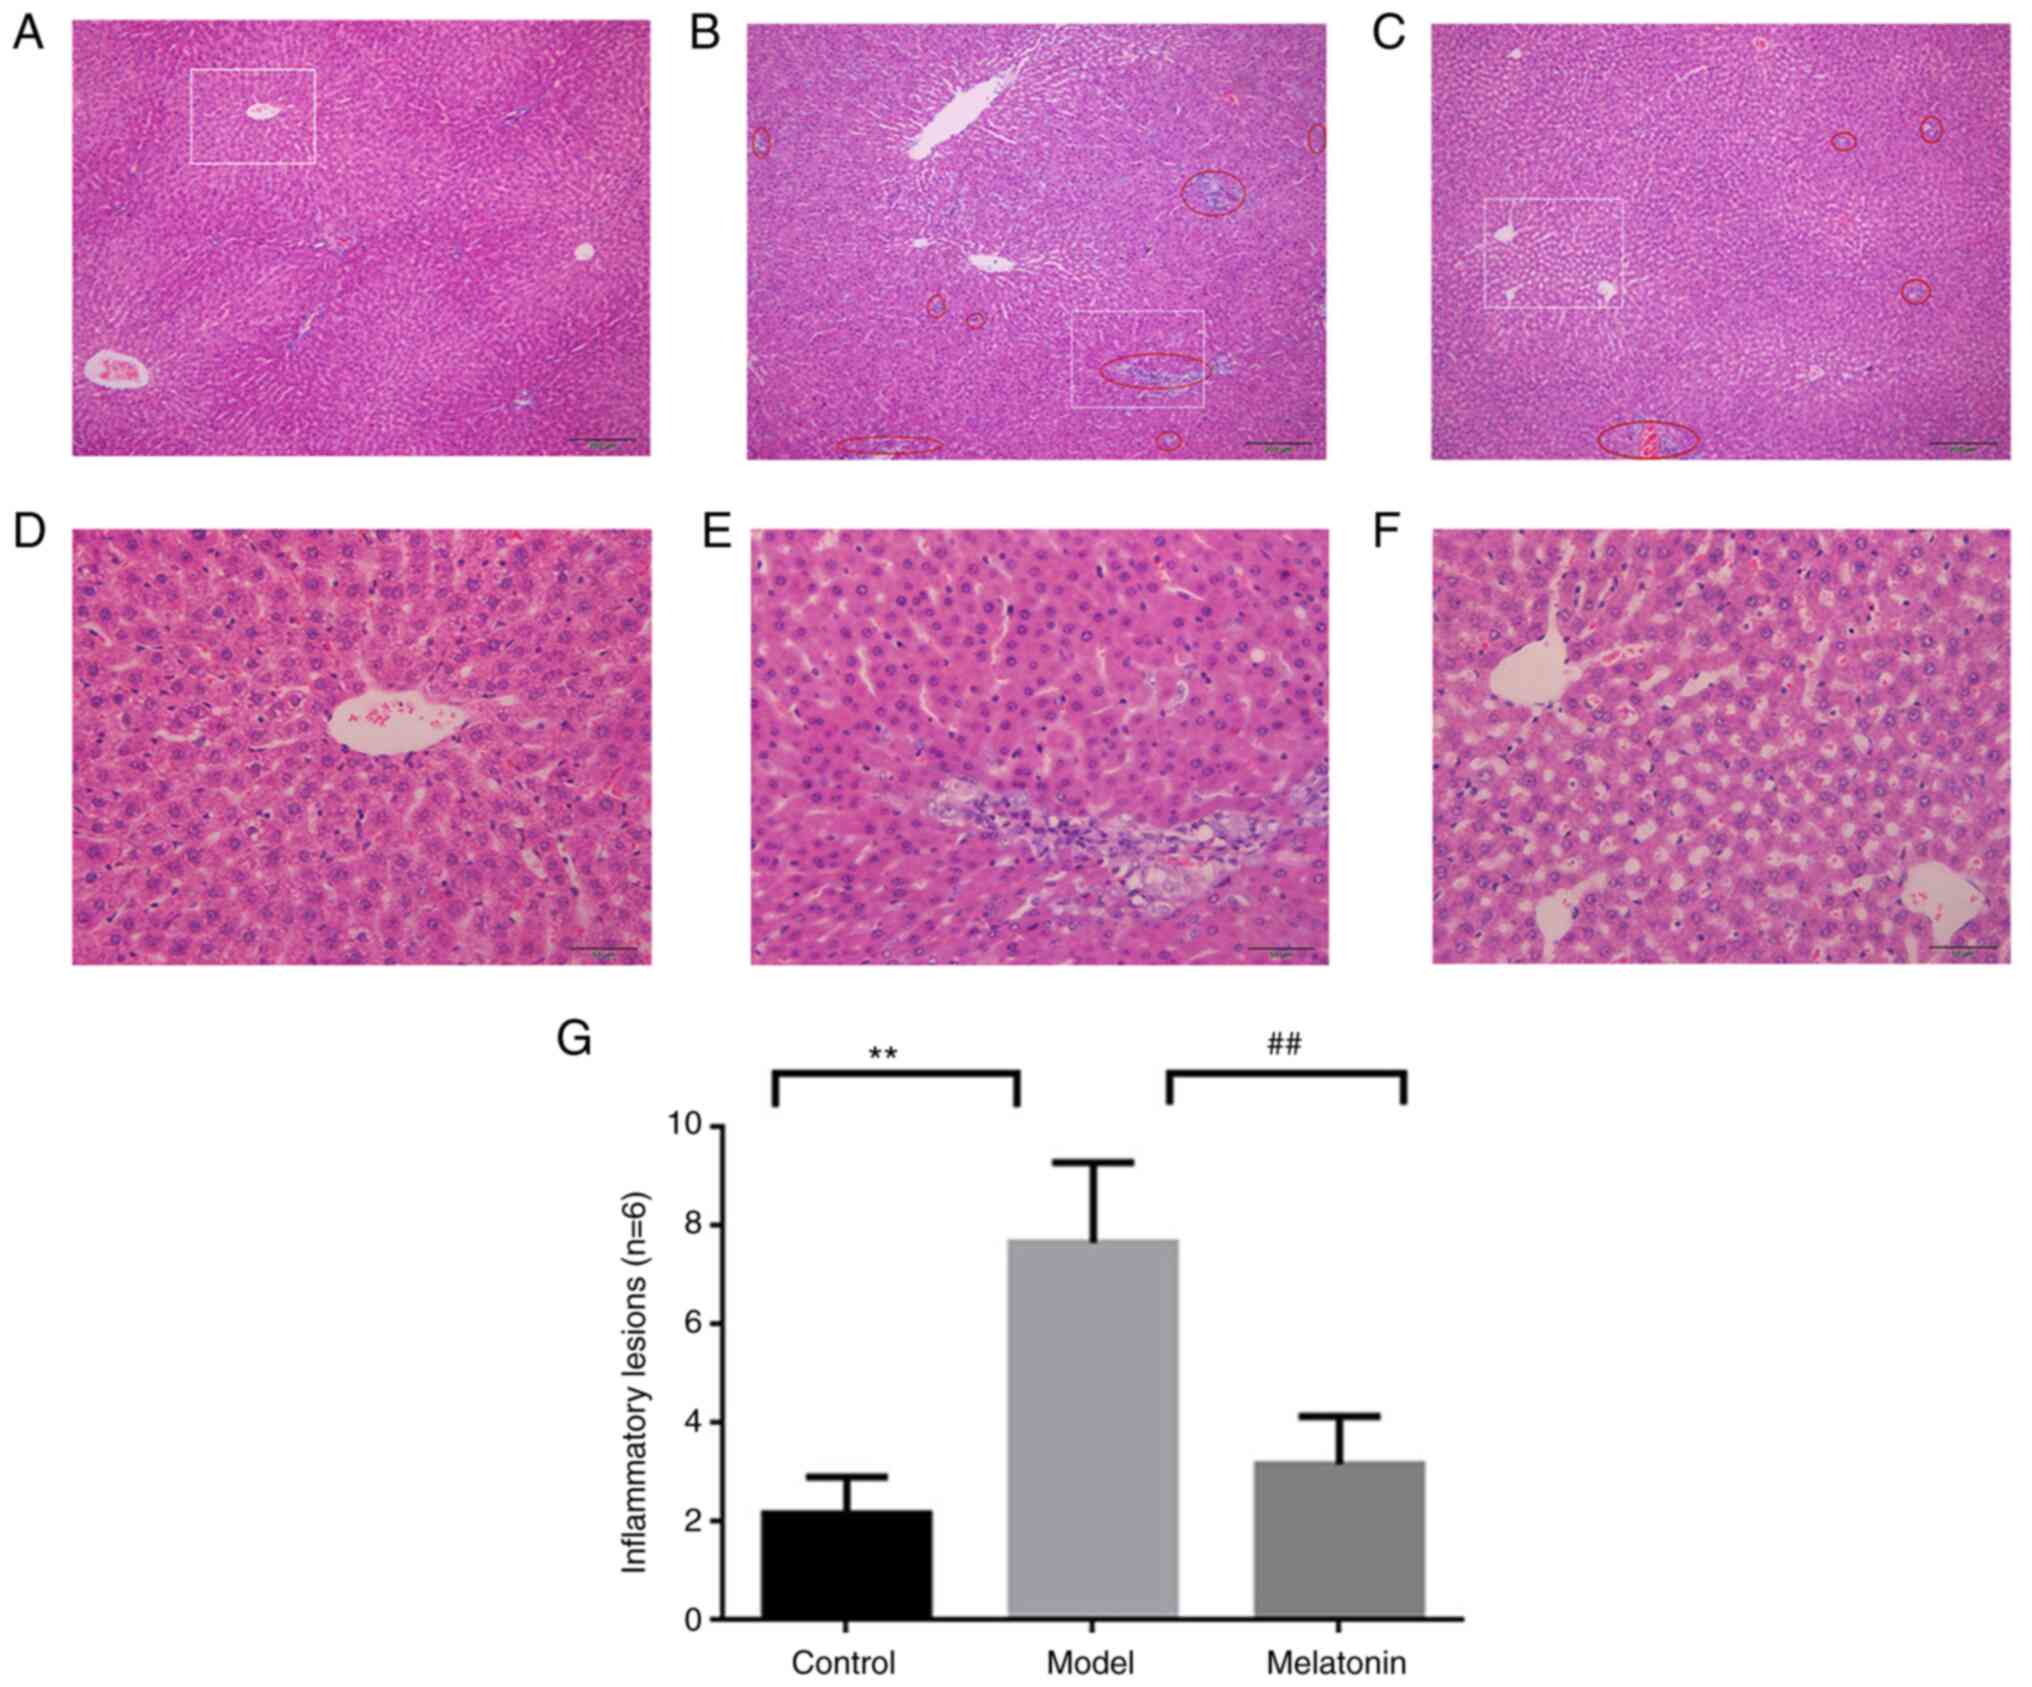
The histology results are provided in Fig. 1. H&E staining of the control
group indicated a normal hepatic lobular structure with hepatic
cell cords arranged radially outward from the terminal venules, as
well as a uniformly distributed portal area (Fig. 1D). The specimens from the
ANIT-induced model group displayed evidence of neutrophil
infiltration in the bile duct between the hepatic lobule, sinusoid
congestion and necrotic inflammation (Fig. 1E). A small amount of neutrophil
infiltration was observed in the melatonin-treated group, with mild
inflammation and mild cell edema (Fig.
1F). These results were consistent with those of previous
studies by our group (11,12). For each group, 6 random fields of
view were statistically evaluated for inflammatory lesions
(examples in Fig. 1A-C) and the
quantitative results are presented in Fig. 1G. The quantitative results indicated
that a significant amount of inflammatory lesions appeared in the
model vs. control group, which was significantly decreased in the
melatonin vs. model group.
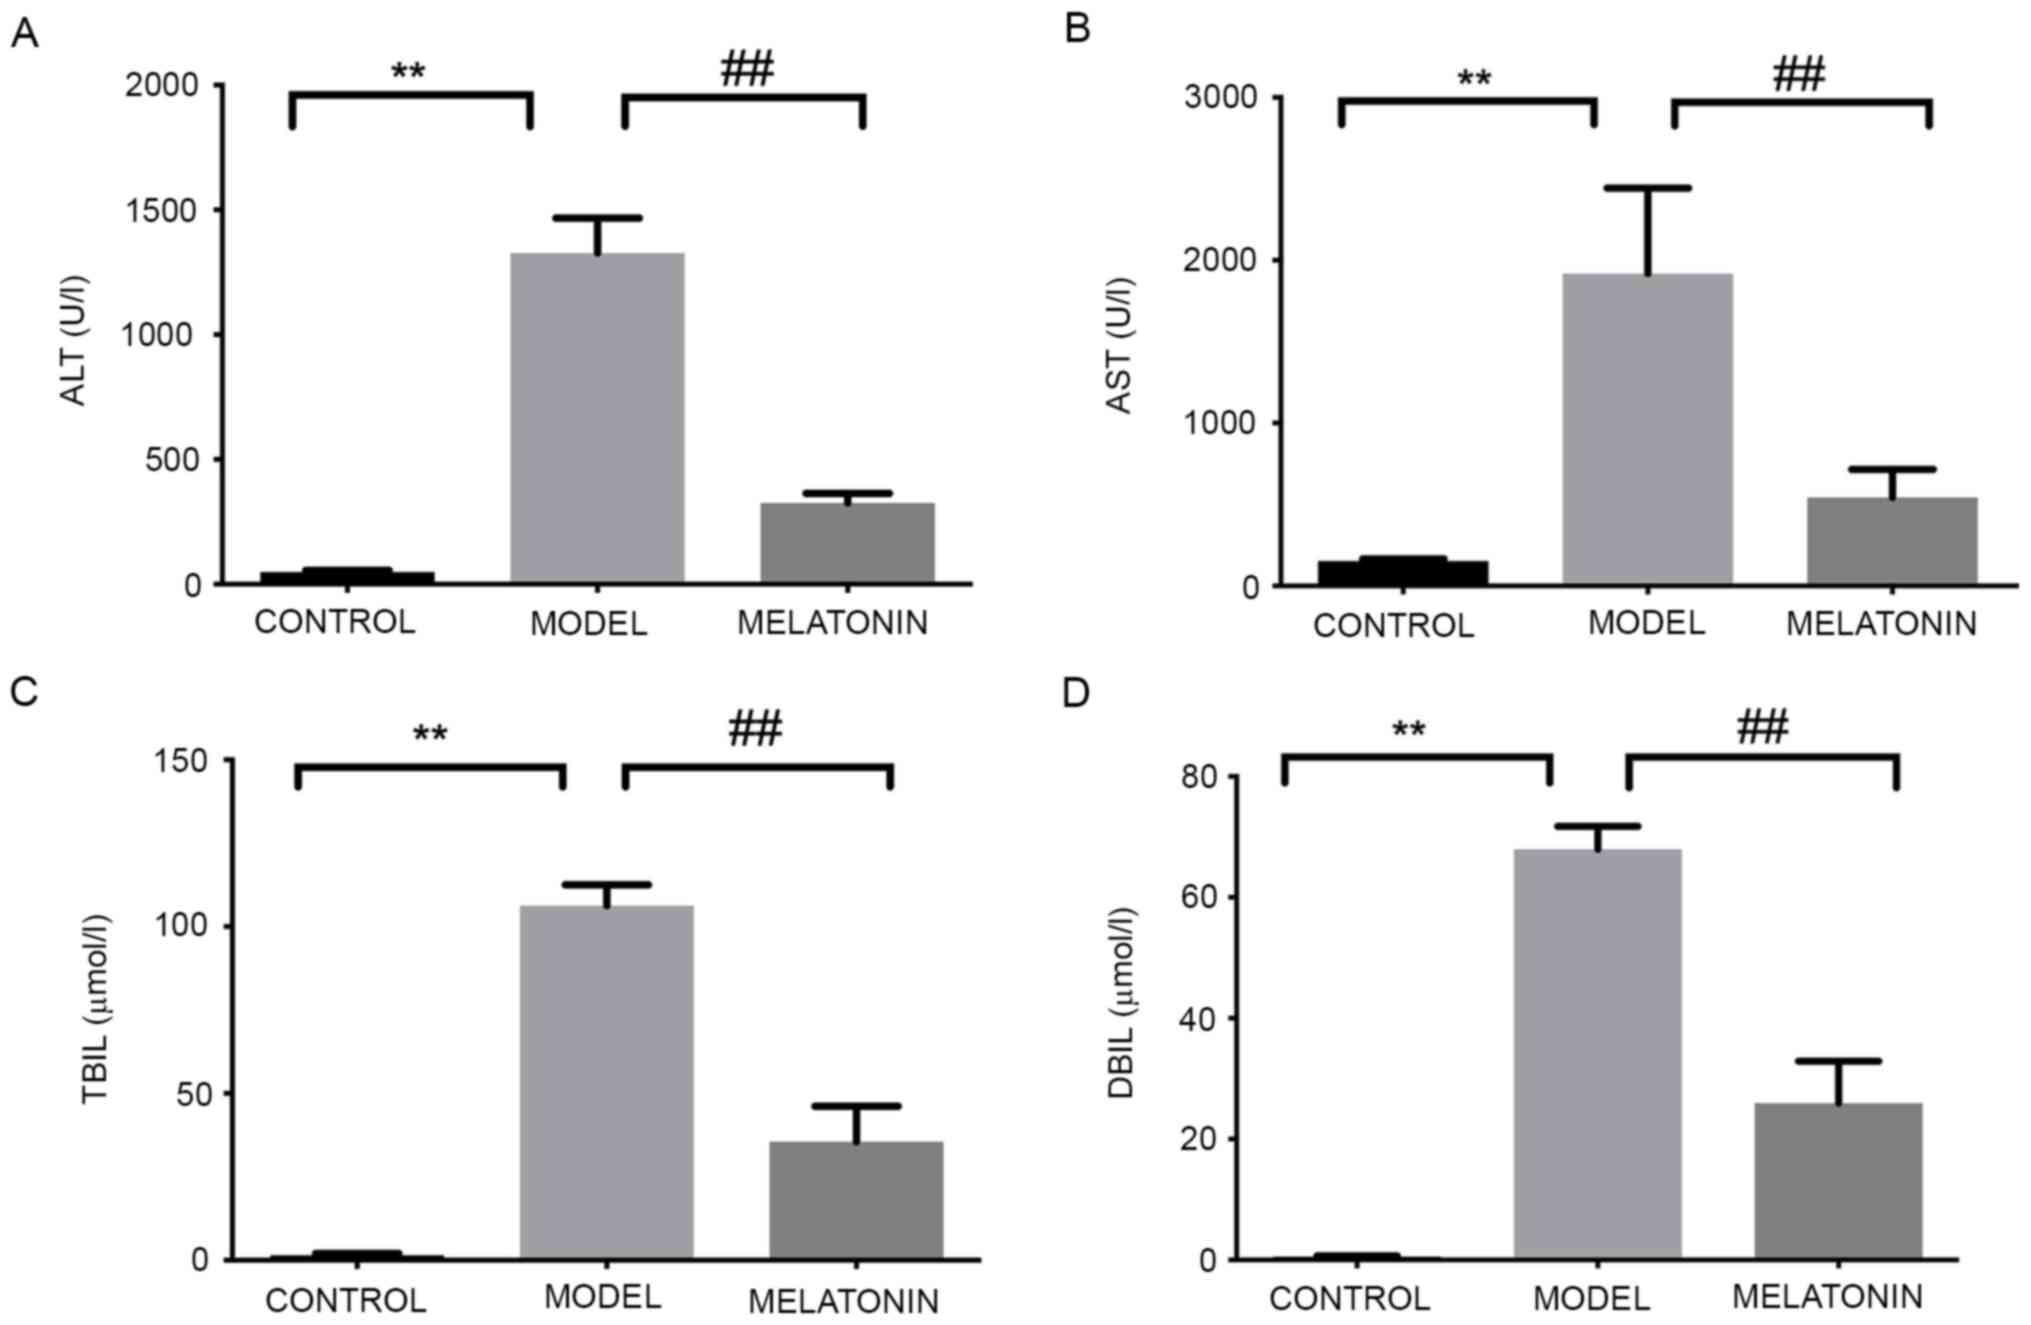
Effects of melatonin on serum
biochemistry
The levels of ALT, AST, TBIL and DBIL were
significantly increased in the rats intraperitoneally injected with
ANIT and were significantly reduced following treatment with
melatonin (Fig. 2). These results
were consistent with those of previous studies by our group
(11,12).
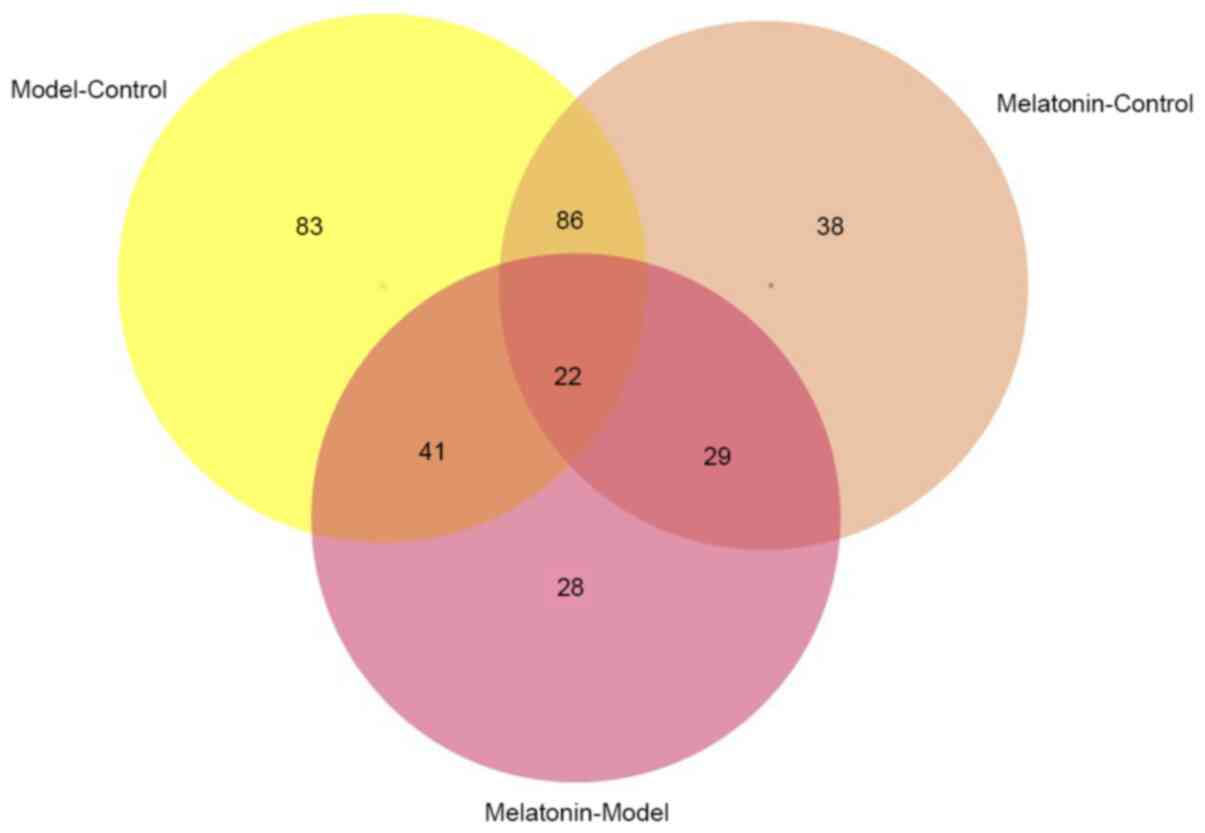
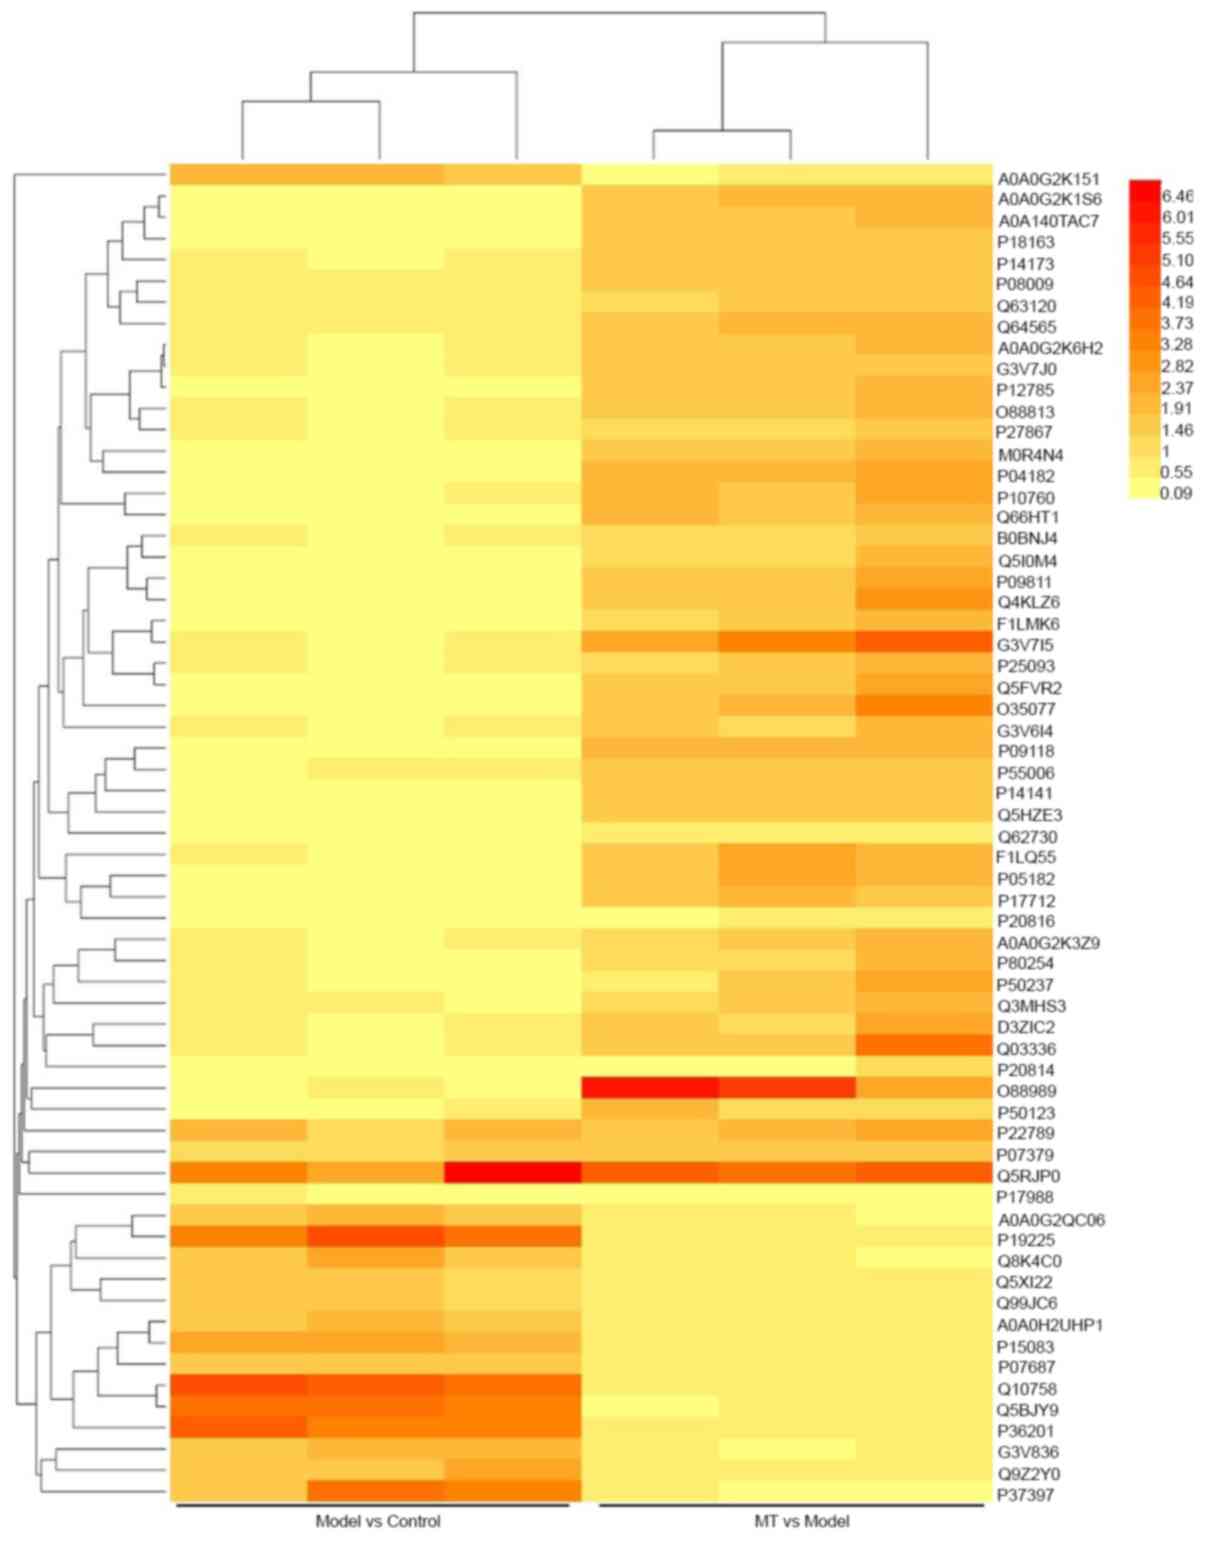
ITRAQ-based quantitative proteomics
analysis of the hepatoprotective effect of melatonin
The hepatic tissue proteins from the three groups
with technical duplicates were pooled for the iTRAQ coupled
LC-MS/MS analysis. A total of 2,059 proteins were detected and
quantified with a minimum confidence level of 95% and all proteins
contained 2 or more peptides. After screening the data, 327
dynamically changed proteins were obtained in each different group.
There were 63 differentially expressed proteins between control
group vs. model group (Model-Control) and model group vs. melatonin
group (Melatonin-Model) (Figs. 3
and 4). Therefore, further research
should assess the function of these proteins.
Results of classification of
differential protein analysis
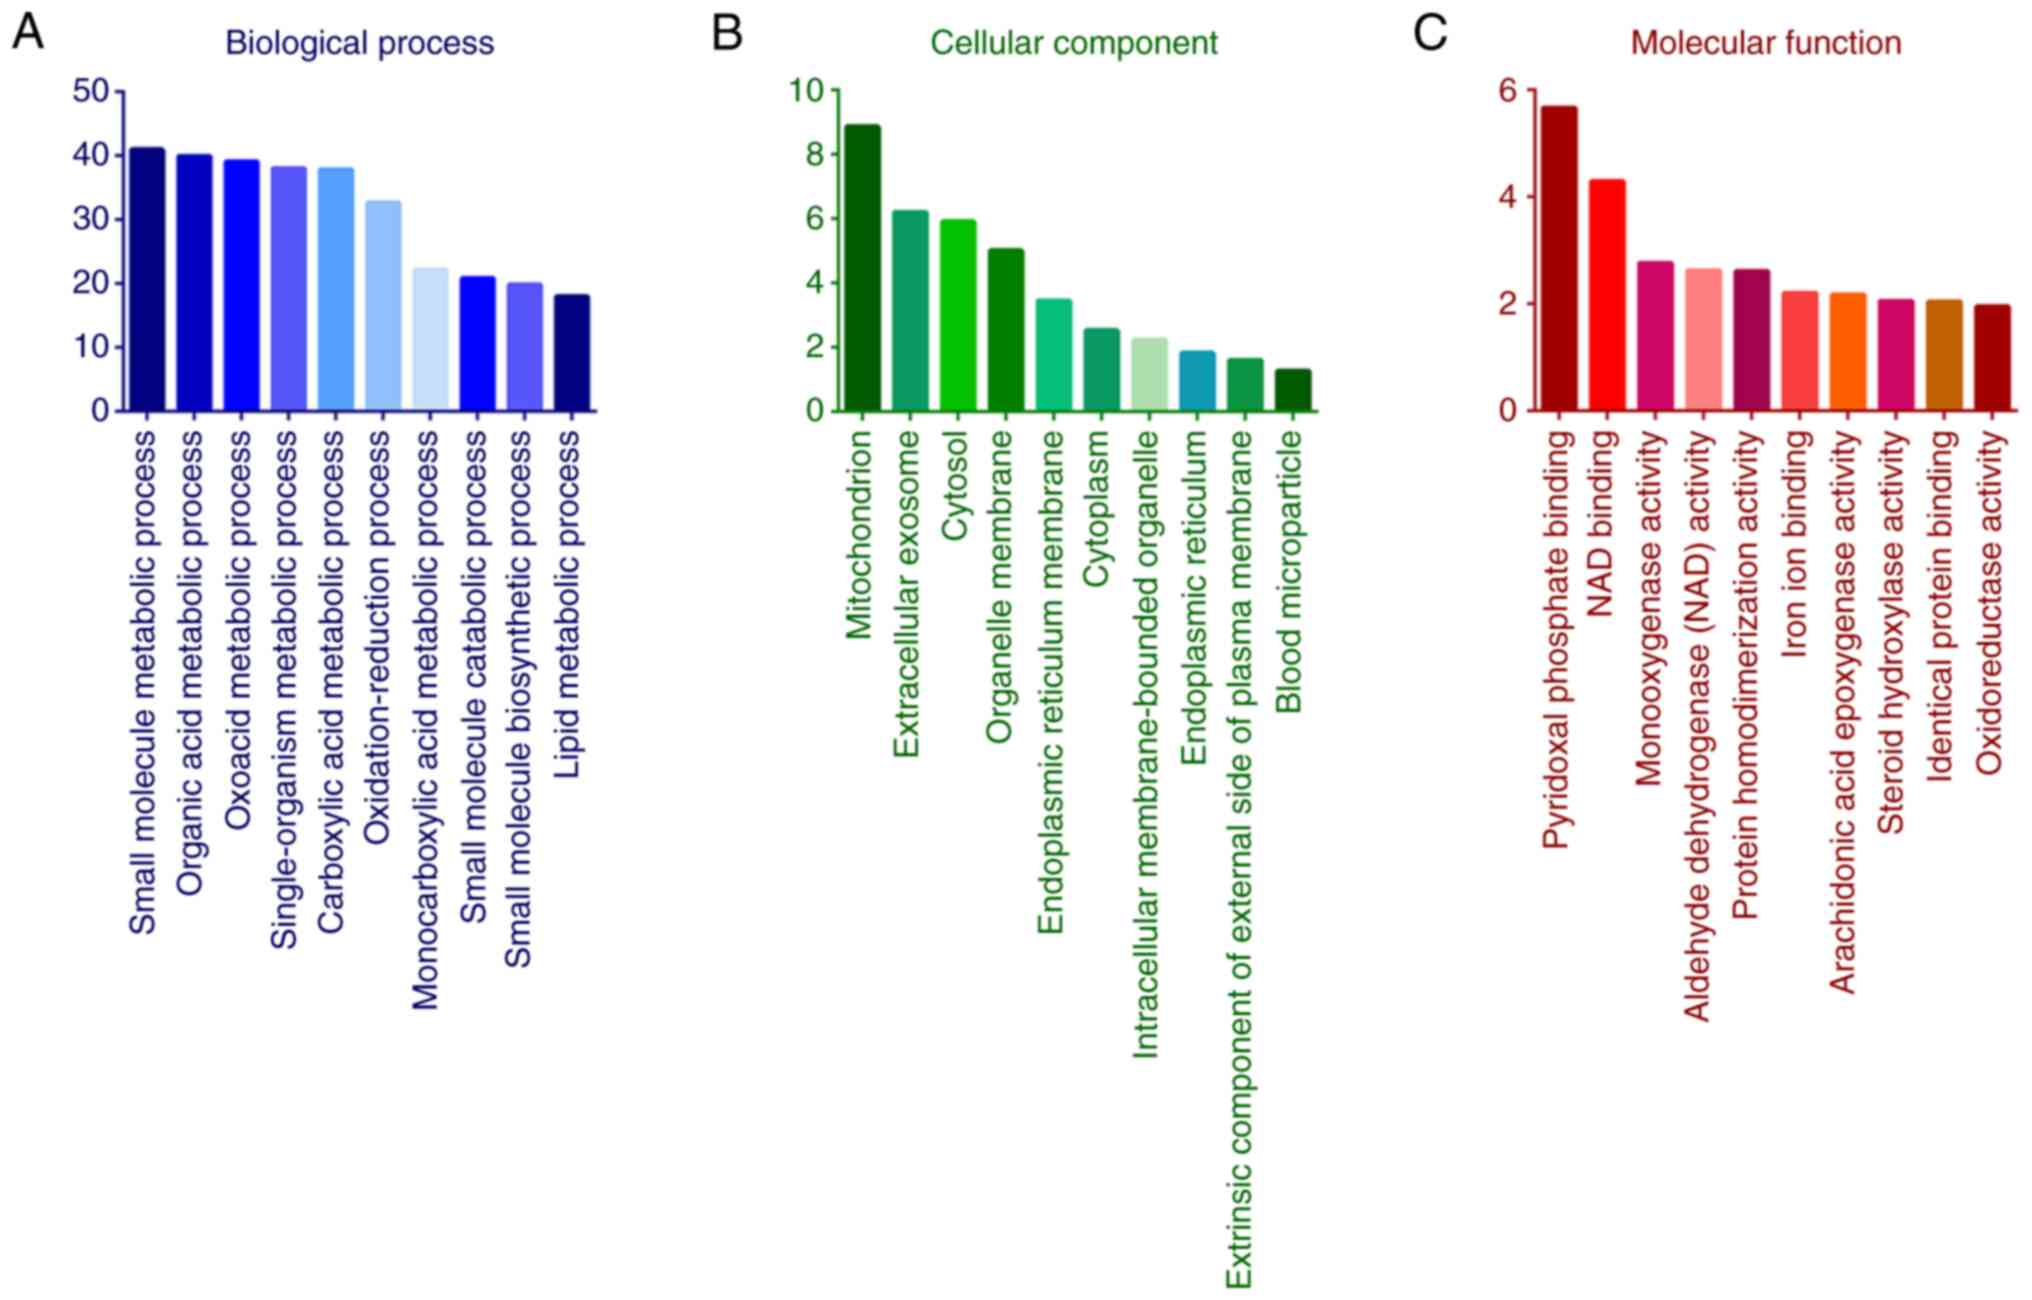
GO analysis indicated that the functional terms in
the BP category were ‘small molecule metabolic process’, ‘organic
acid metabolic process’, ‘oxoacid metabolic process’,
‘single-organism metabolic process’, ‘carboxylic acid metabolic
process’ and ‘oxidation-reduction process’ (Fig. 5A). In the category CC, the most
relevant enriched terms by the differentially expressed proteins
were ‘mitochondrion’, ‘extracellular exosome’, ‘cytosol’,
‘organelle membrane’, ‘endoplasmic reticulum membrane’ and
‘cytoplasm’ (Fig. 5B). The most
relevant enriched terms in the category MF were ‘oxidoreductase
activity’, catalytic activity, cofactor binding and acting on CH-OH
group of donors (Fig. 5C).
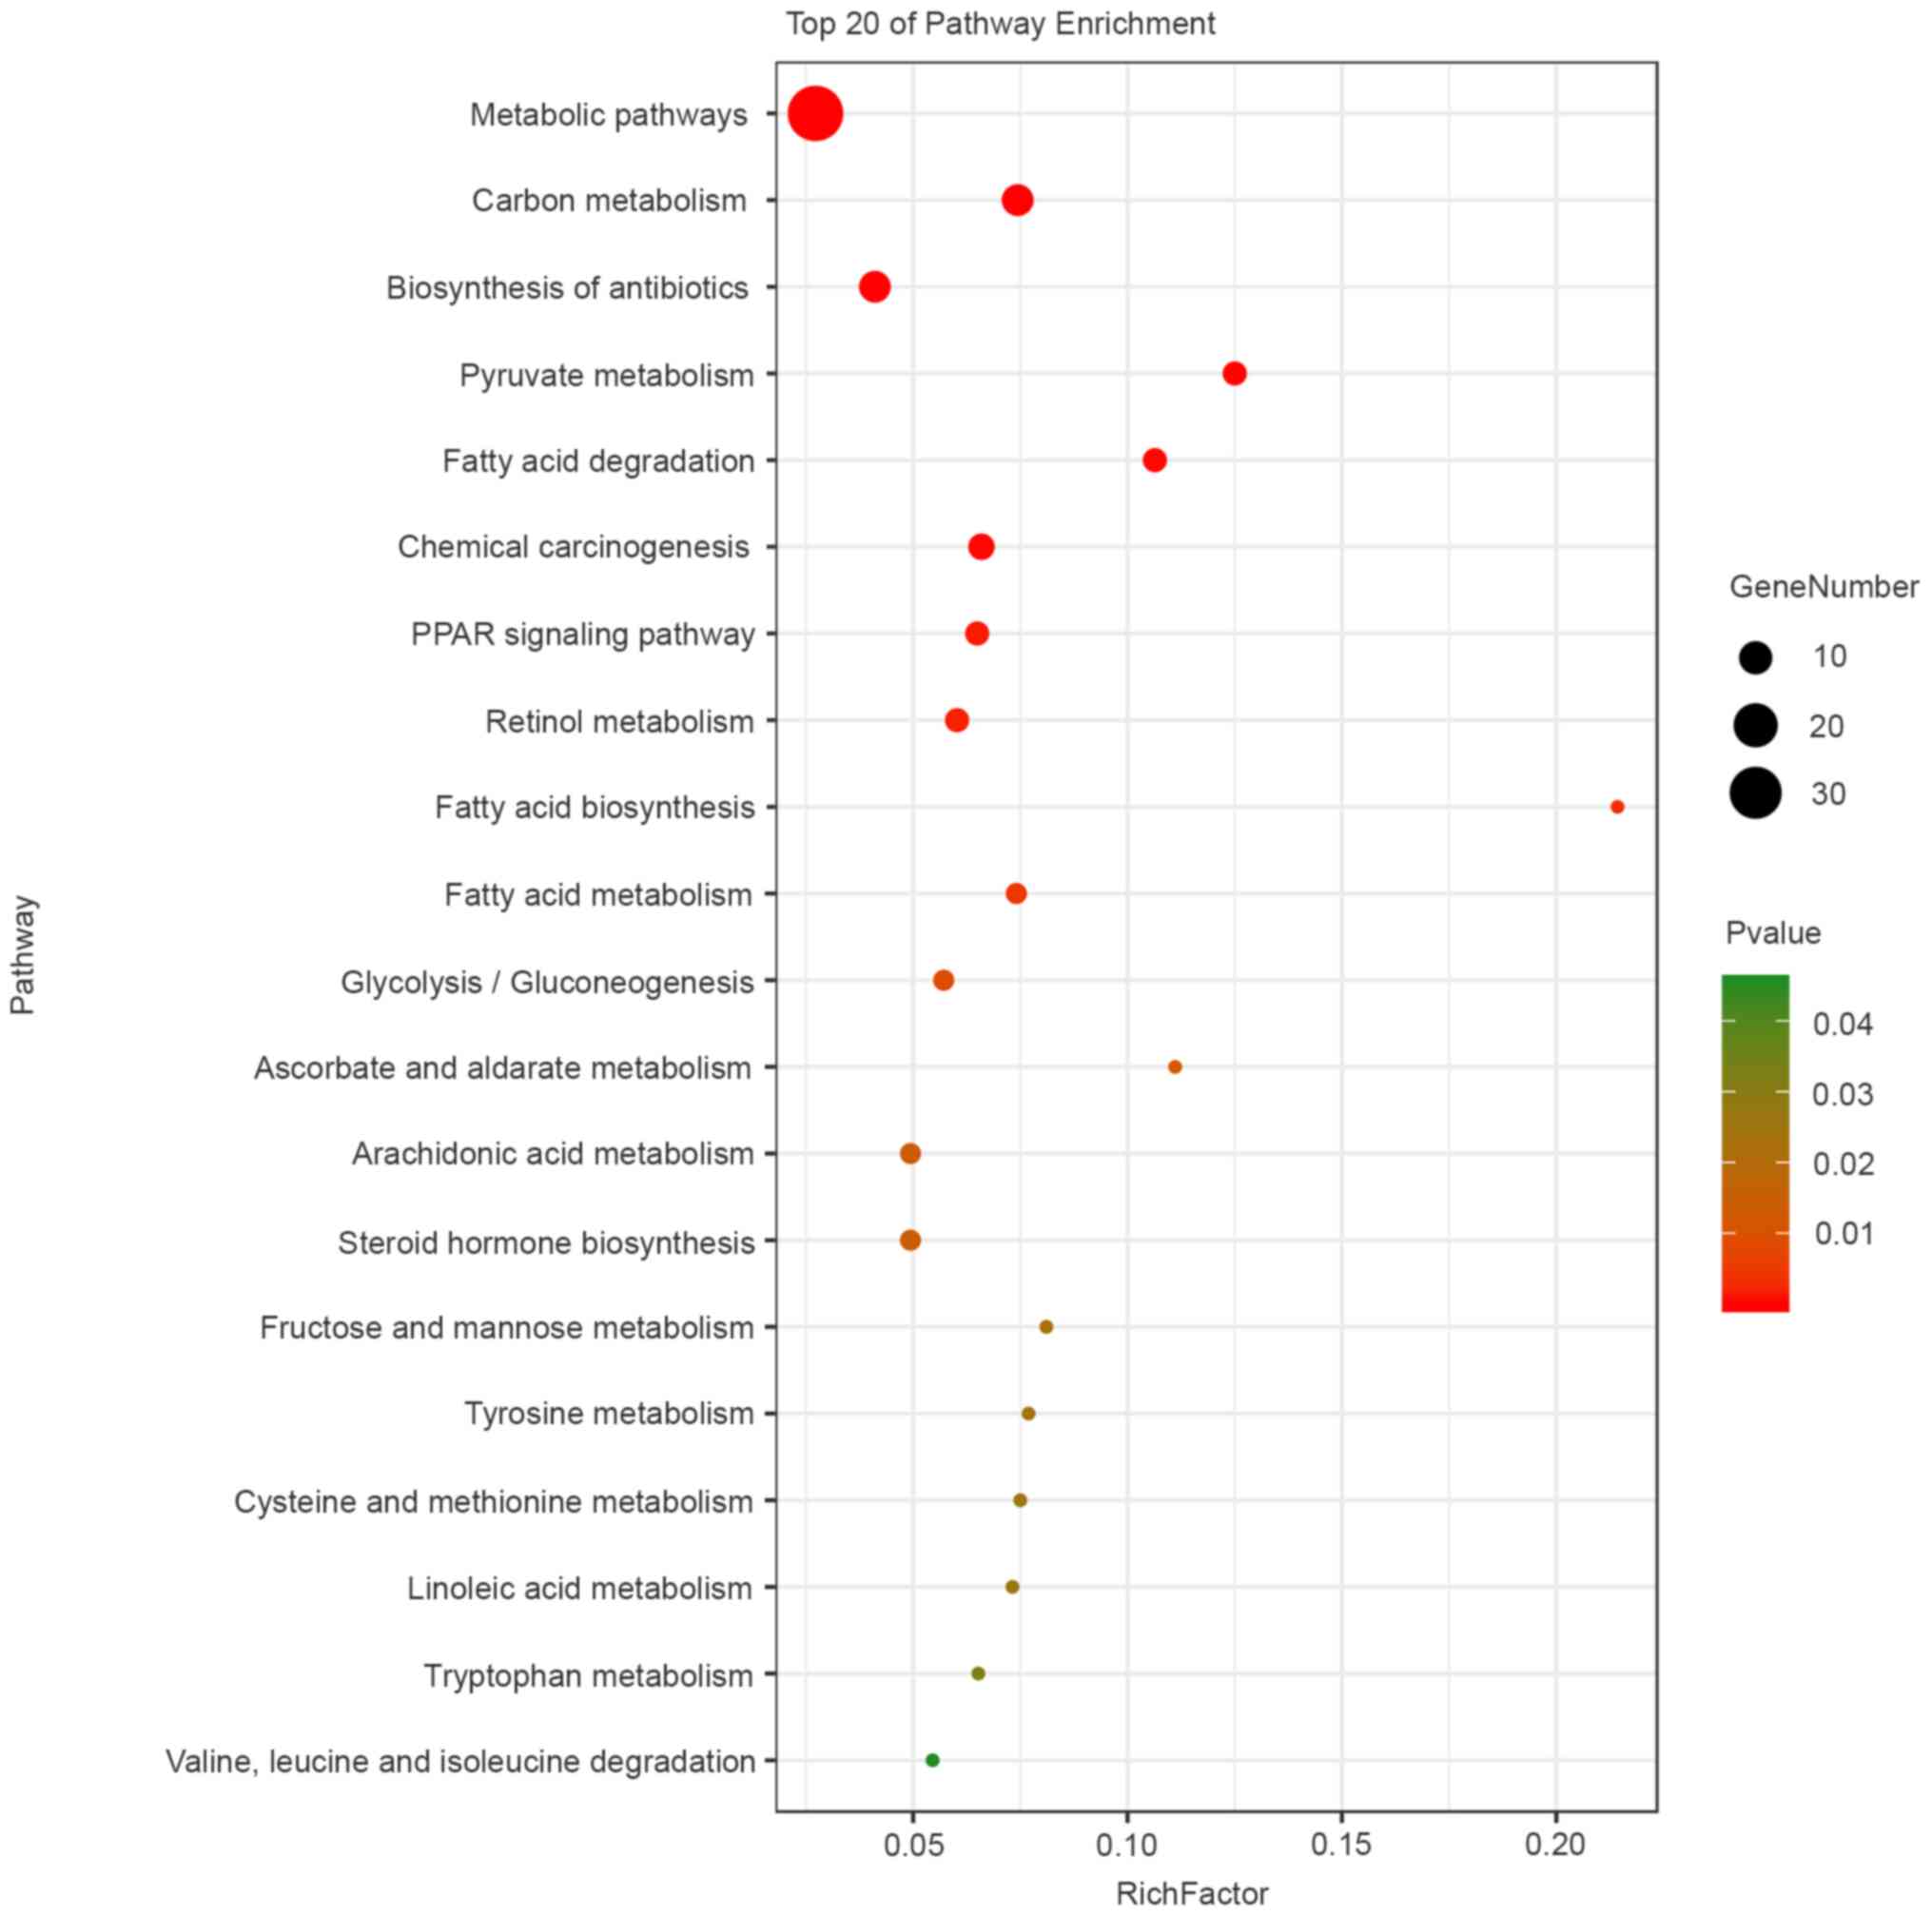
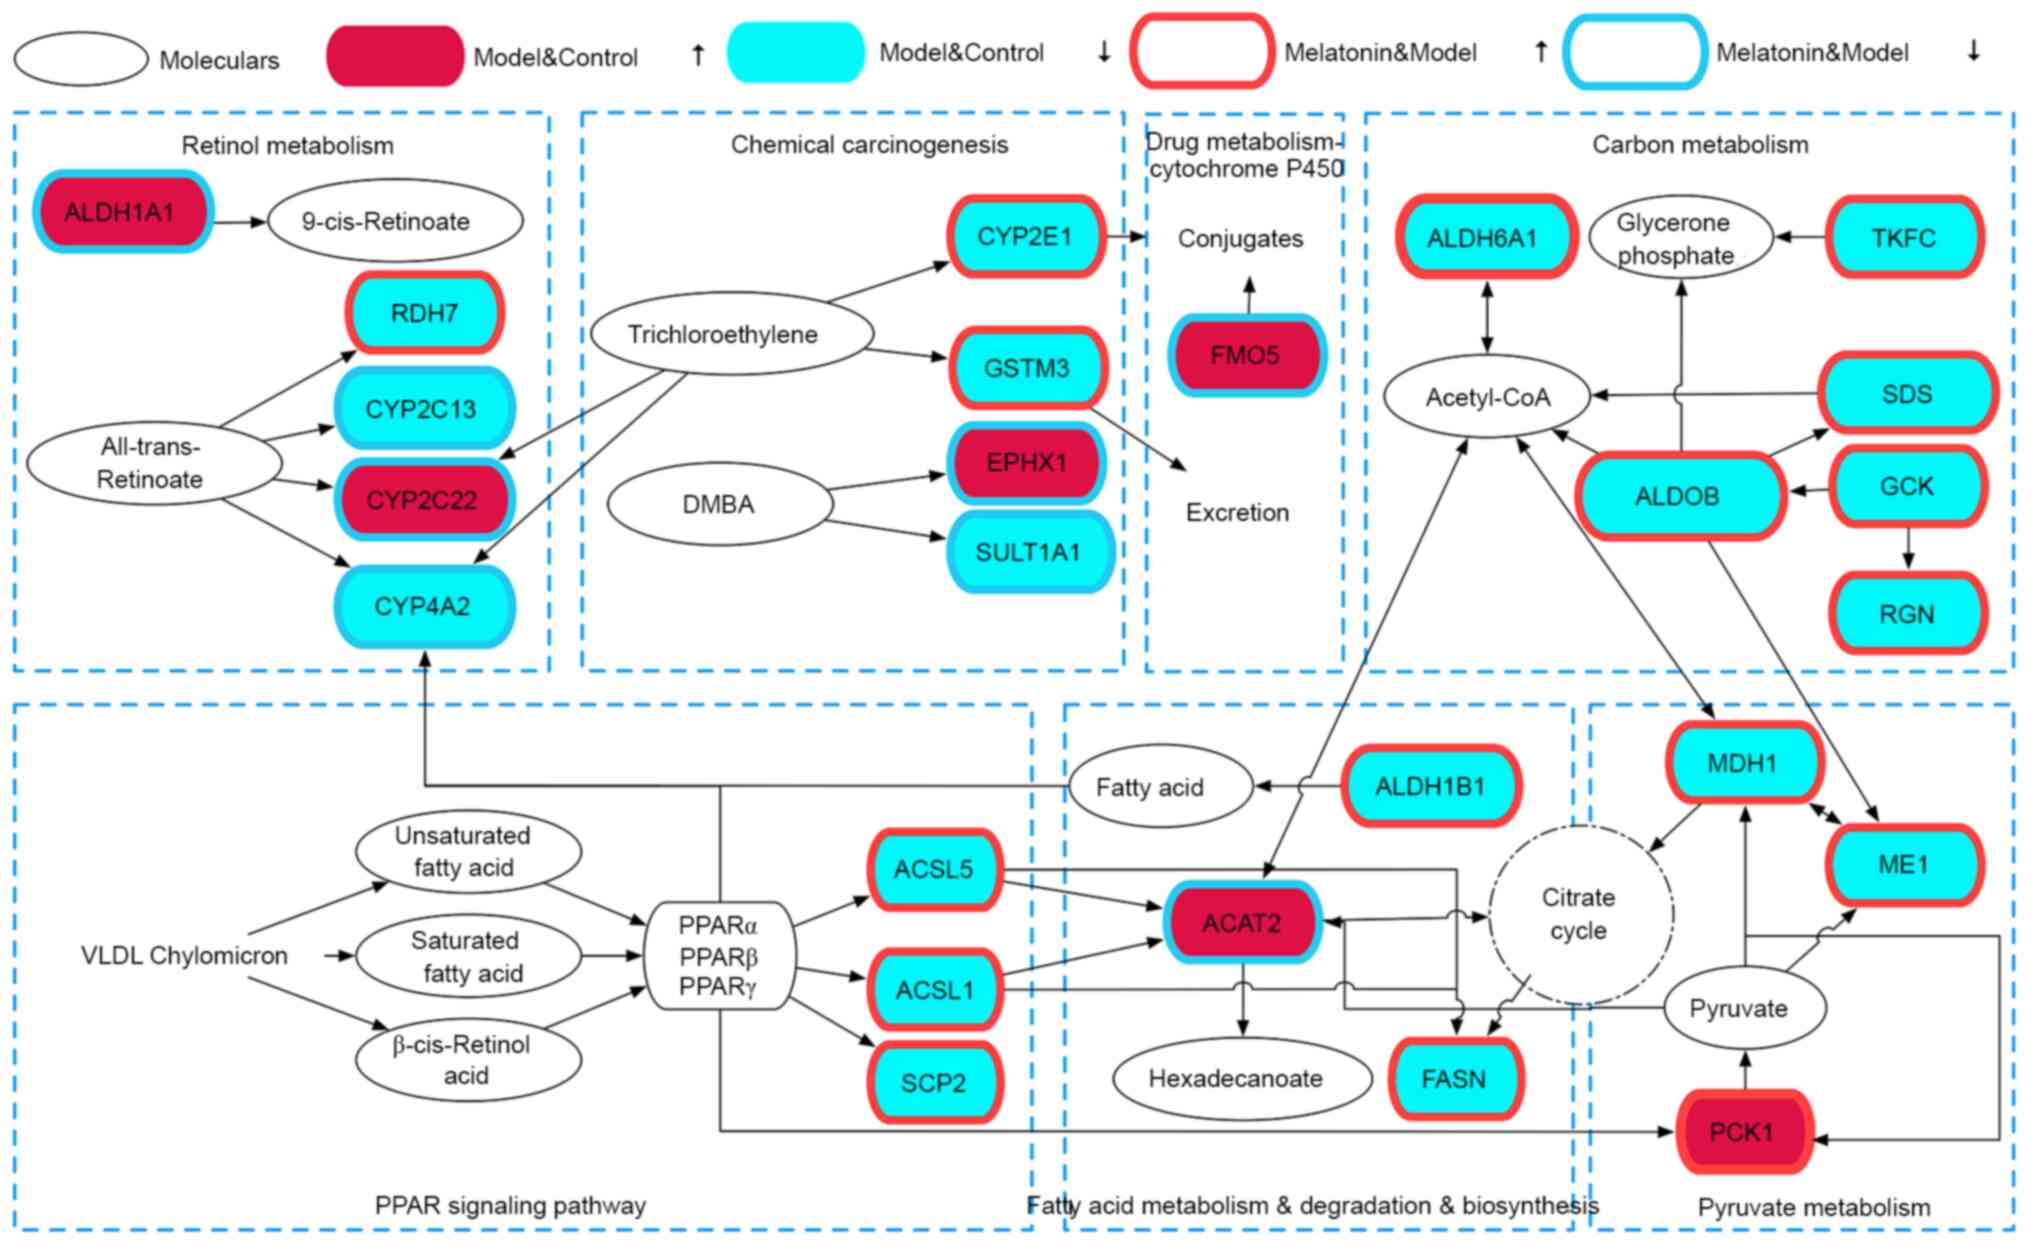
KEGG pathway analysis indicated that the main
pathways enriched by the differentially expressed proteins were
‘metabolic pathways’, ‘fatty acid degradation’, ‘PPAR signaling
pathway’, ‘fatty acid metabolism’, ‘chemical carcinogenesis’,
‘carbon metabolism’, ‘pyruvate metabolism’, ‘fatty acid
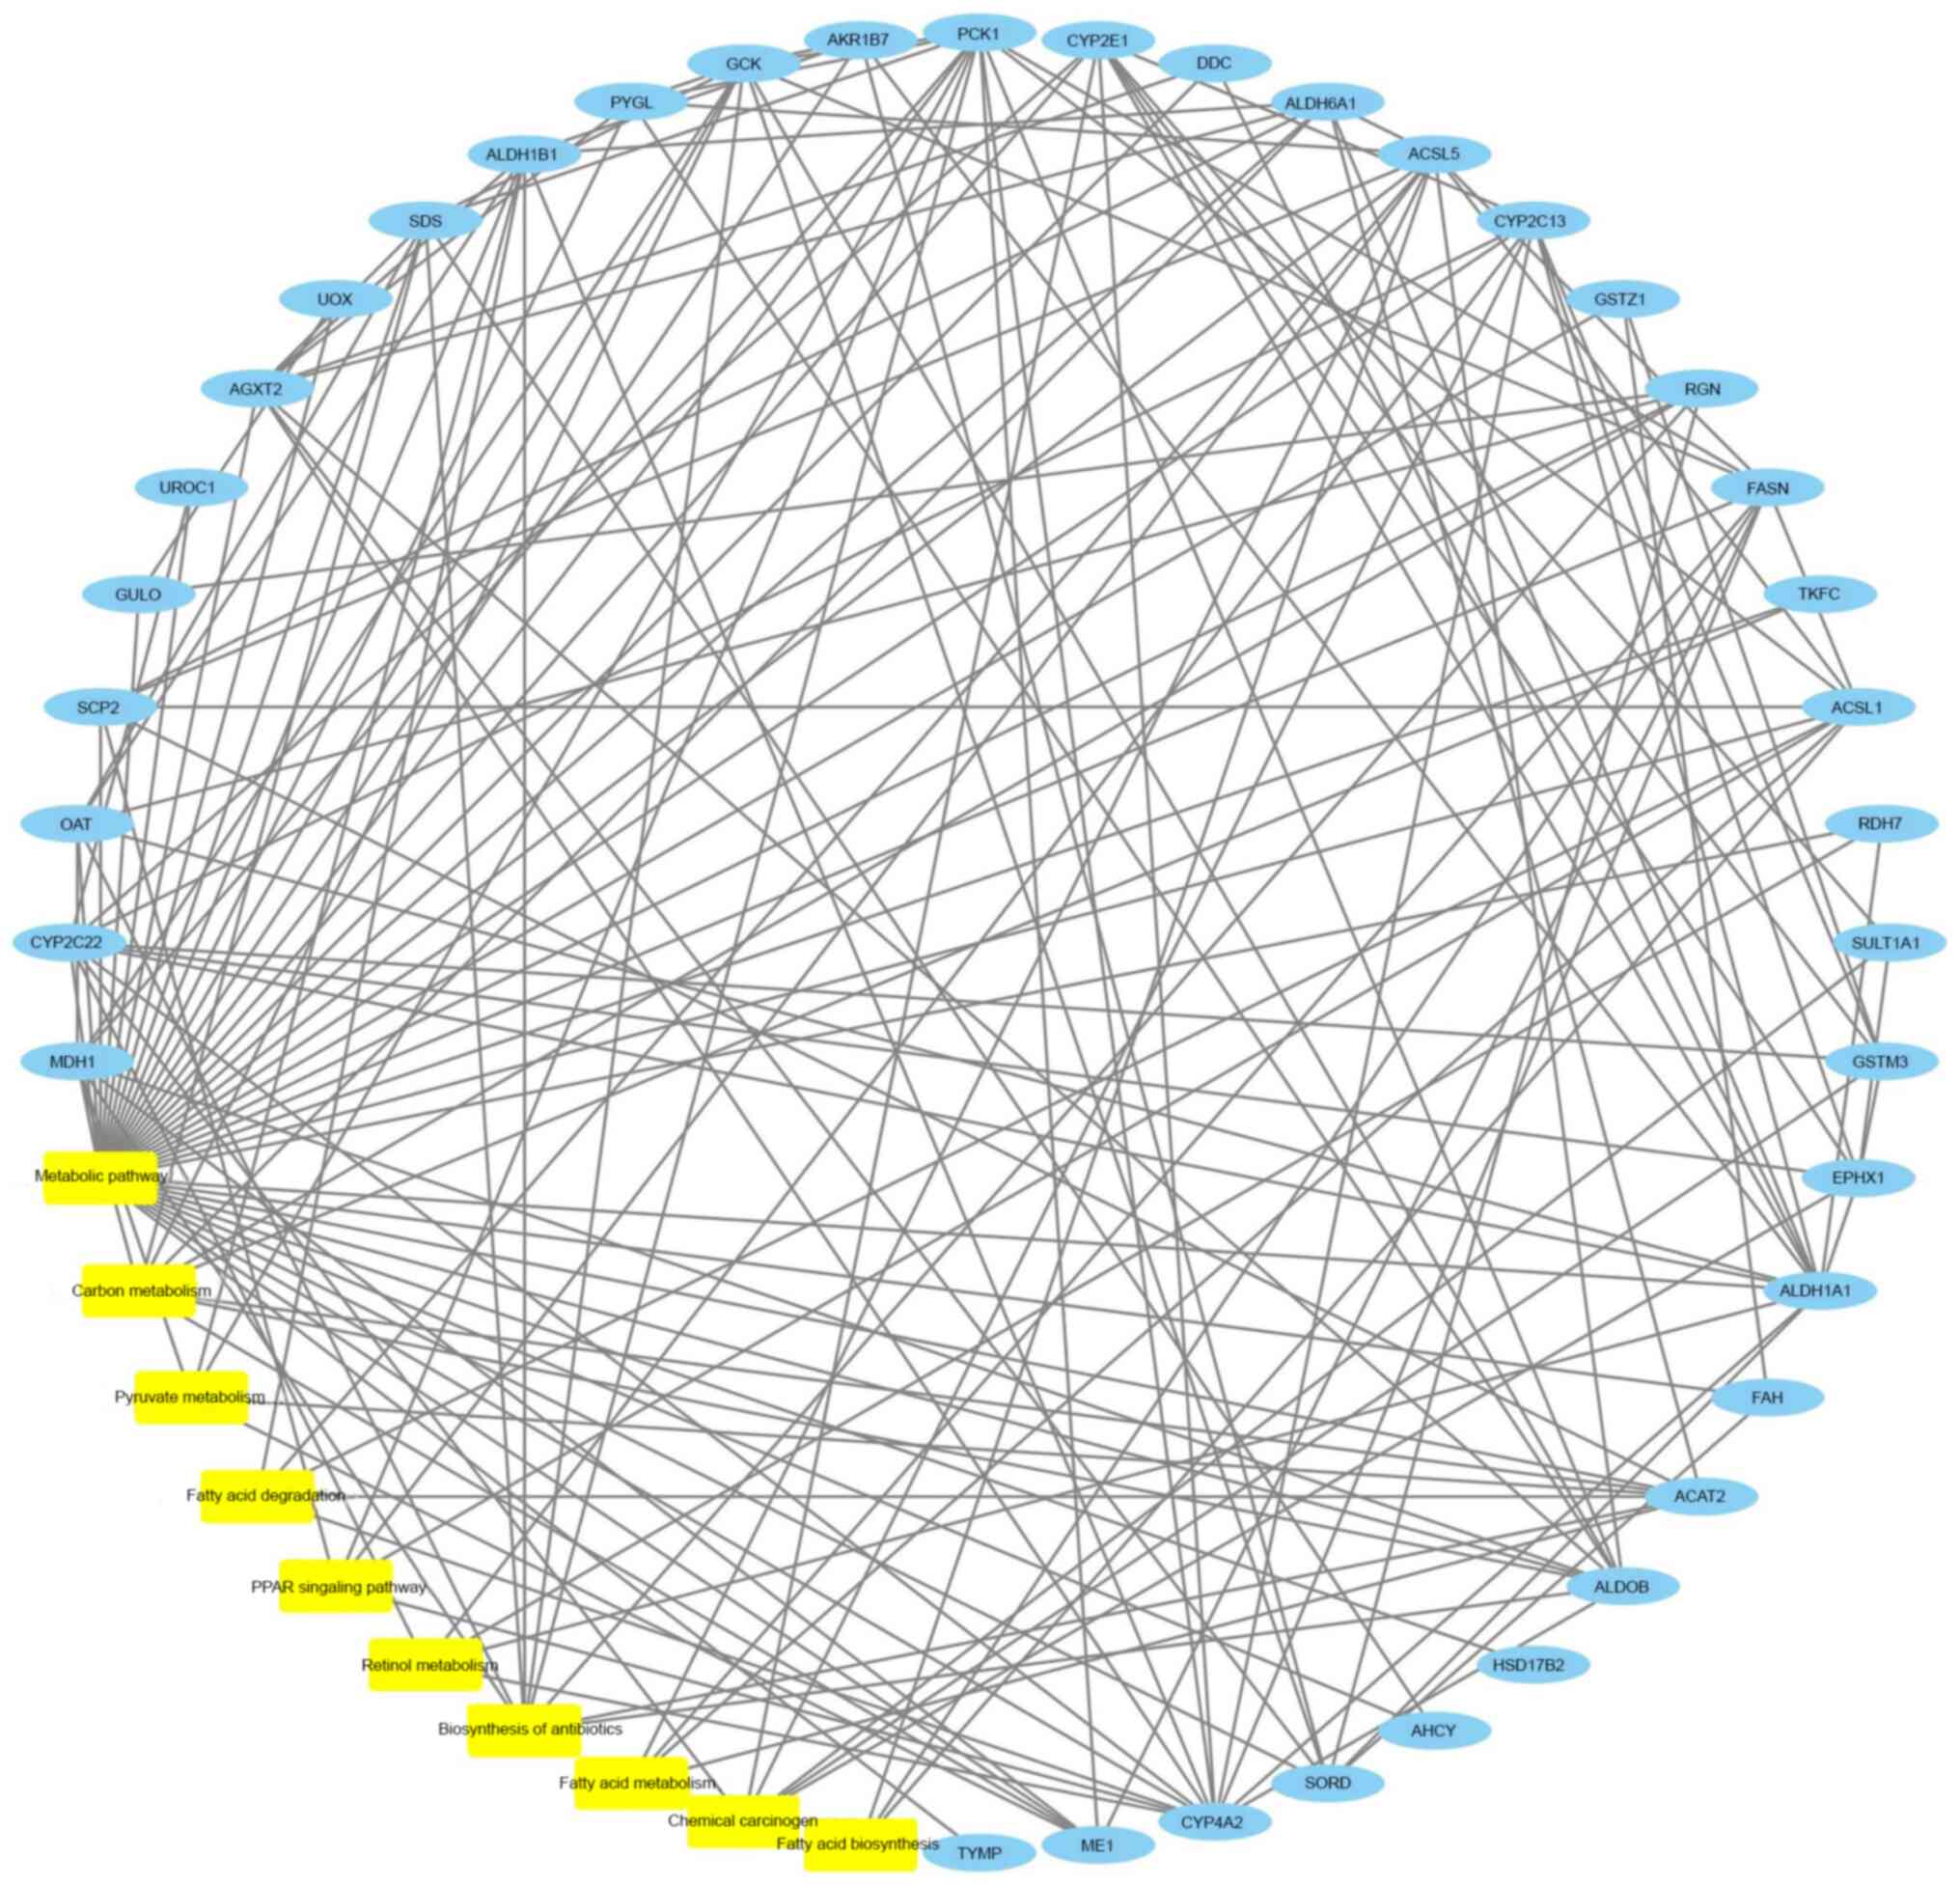
biosynthesis’ and ‘retinol metabolism’ (Fig. 6). A network of the top 10 most
significantly enriched pathways, the top 38 most significantly
enriched proteins and their interactions is provided in Fig. 7. Table
III shows the details of the 63 differentially expressed
proteins of α-naphthyl isothiocyanate-induced cholestasis rats with
or without melatonin treatment.
| Table IIIDetails of the 63 differentially
expressed proteins of α-naphthyl isothiocyanate-induced cholestasis
rats with or without melatonin treatment. |
Table III
Details of the 63 differentially
expressed proteins of α-naphthyl isothiocyanate-induced cholestasis
rats with or without melatonin treatment.
| Uniprot ID | Protein name (gene
symbol) | F-value | P-value |
|---|
| A0A0G2K151 | Apolipoprotein E
(APOE) | 0.5889 | 0.0090 |
| A0A0G2K1S6 | Malic enzyme 1
(ME1) | 1.9905 | 0.0150 |
| A0A0G2K3Z9 | N/A | - | - |
| A0A0G2K6H2 | Glutathione
S-transferase zeta 1 (GSTZ1) | 1.6831 | 0.0295 |
| A0A0G2QC06 | Transferrin
(TF) | 0.6179 | 0.0091 |
| A0A0H2UHP1 | Aldehyde
dehydrogenase 1 family, member A1 (ALDH1A1) | 0.6223 | 0.0039 |
| A0A140TAC7 | Gulonolactone (L-)
oxidase (GULO) | 1.8658 | 0.0162 |
| B0BNJ4 | ETHE1, persulfide
dioxygenase (ETHE1) | 1.5354 | 0.0857 |
| D3ZIC2 | Urocanate hydratase
1 (UROC1) | 1.7511 | 0.1896 |
| F1LMK6 | Serine dehydratase
(SDS) | 1.7656 | 0.0766 |
| F1LQ55 | Sterol carrier
protein 2 (SCP2) | 2.0842 | 0.0795 |
| G3V6I4 | Mitochondrial
amidoxime reducing component 1 (MARC1) | 1.5733 | 0.1288 |
| G3V7I5 | Aldehyde
dehydrogenase 1 family, member B1 (ALDH1A1) | 3.5411 | 0.0442 |
| G3V7J0 | Aldehyde
dehydrogenase 6 family, member A1 (ALDH6A1) | 1.5926 | 0.0348 |
| G3V836 | Clusterin
(CLU) | 0.6256 | 0.0209 |
| M0R4N4 |
Dehydrogenase/reductase (SDR family)
member 7 (DHRS7) | 1.6838 | 0.0487 |
| O35077 |
Glycerol-3-phosphate dehydrogenase 1
(GPD1) | 2.4498 | 0.1107 |
| O88813 | Acyl-CoA synthetase
long-chain family member 5 (ACSL5) | 1.6460 | 0.0447 |
| O88989 | Malate
dehydrogenase 1 (MDH1) | 4.6705 | 0.0673 |
| P04182 | Ornithine
aminotransferase (OAT) | 2.3116 | 0.0180 |
| P05182 | Cytochrome P450,
family 2, subfamily e, polypeptide 1 (CYP2E1) | 2.1076 | 0.0205 |
| P07379 | Phosphoenolpyruvate
carboxykinase 1 (PCK1) | 1.6217 | 0.0094 |
| P07687 | Epoxide hydrolase 1
(EPHX1) | 0.6197 | 0.0010 |
| P08009 | Glutathione
S-transferase, mu 3 (GSTM3) | 1.6969 | 0.0045 |
| P09118 | Urate oxidase
(UOX) | 2.1557 | 0.0020 |
| P09811 | Phosphorylase,
glycogen, liver (PYGl) | 2.1289 | 0.0647 |
| P10760 |
Adenosylhomocysteinase (AHCY) | 2.1517 | 0.0252 |
| P12785 | Fatty acid synthase
(FASN) | 1.9435 | 0.0444 |
| P14141 | Carbonic anhydrase
3 (CAR3) | 1.5513 | 0.0001 |
| P14173 | Dopa decarboxylase
(DDC) | 1.6658 | 0.0224 |
| P15083 | Polymeric
immunoglobulin receptor (PIGR) | 0.6010 | 0.0010 |
| P17712 | Glucokinase
(GCK) | 1.9240 | 0.0404 |
| P17988 | Sulfotransferase
family 1A member 1 (SULT1A1) | 0.4074 | 0.0080 |
| P18162 | Acyl-CoA synthetase
long-chain family member 1 (ACSL1) | 1.6682 | 0.0318 |
| P19225 | Cytochrome P450,
family 2, subfamily c, polypeptide 22 (CYP2C22) | 0.6401 | 0.0064 |
| P20814 | Cytochrome P450,
family 2, subfamily c, polypeptide 13 (CYP2C13) | 0.6094 | 0.2323 |
| P20816 | Cytochrome P450,
family 4, subfamily a, polypeptide 2 (CYP4A2) | 0.6297 | 0.0231 |
| P22789 | Sulfotransferase
family 2A, dehydroepiandrosterone (DHEA)-preferring, member 6
(SULT2A6) | 2.1173 | 0.0255 |
| P25093 | Fumarylacetoacetate
hydrolase (FAH) | 1.6438 | 0.0894 |
| P27867 | Sorbitol
dehydrogenase (SORD) | 1.5653 | 0.0658 |
| P36201 | Cysteine-rich
protein 2 (CRIP2) | 0.6203 | 0.0038 |
| P37397 | Calponin 3
(CNN3) | 0.5362 | 0.0339 |
| P50123 | Glutamyl
aminopeptidase (ENPEP) | 1.5400 | 0.1557 |
| P50237 | Sulfotransferase
family 1C member 3 (SULTLC3) | 1.8028 | 0.2110 |
| P55006 | Retinol
dehydrogenase 7 (RDH7) | 1.5913 | 0.0071 |
| P80254 | D-dopachrome
tautomerase (DDT) | 1.5901 | 0.2094 |
| Q03336 | Regucalcin
(RGN) | 2.4009 | 0.1904 |
| Q10758 | Keratin 8
(KRT8) | 0.6412 | 0.0021 |
| Q3MHS3 | Aldo-keto reductase
family 1, member C1 (AKR1C1) | 1.7571 | 0.0756 |
| Q4KLZ6 | Triokinase and FMN
cyclase (TKFC) | 2.2275 | 0.0849 |
| Q5BJY9 | Keratin 18
(KRT18) | 0.5850 | 0.0080 |
| Q5FVR2 | Thymidine
phosphorylase (TYMP) | 2.0643 | 0.0869 |
| Q5HZE3 | Thyroid hormone
responsive (THRSP) | 1.7476 | 0.0140 |
| Q5I0M4 | Aldo-keto reductase
family 1, member C13 (AKR1C13) | 1.5343 | 0.1205 |
| Q5RJP0 | Aldo-keto reductase
family 1, member B7 (AKR1B7) | 4.2623 | 0.0012 |
| Q5XI22 | Acetyl-CoA
acetyltransferase 2 (ACAT2) | 0.6613 | 0.0034 |
| Q62730 | Hydroxysteroid
(17-beta) dehydrogenase 2 (HSD17B2) | 0.6607 | 0.0004 |
| Q62120 | ATP binding
cassette subfamily C member 2 (ABCC2) | 1.5017 | 0.0126 |
| Q64565 | Alanine-glyoxylate
aminotransferase 2 (AGXT2) | 1.9370 | 0.0044 |
| Q66HT1 | Aldolase,
fructose-bisphosphate B (ALDOB) | 1.9087 | 0.0535 |
| Q8K4C0 | Flavin containing
monooxygenase 5 (FMO5) | 0.6264 | 0.0156 |
| Q99JC6 | TAP binding protein
(TABP) | 0.6588 | 0.0114 |
| Q9Z2Y0 |
Glycine-N-acyltransferase-like 2
(GLYATL2) | 0.6144 | 0.0026 |
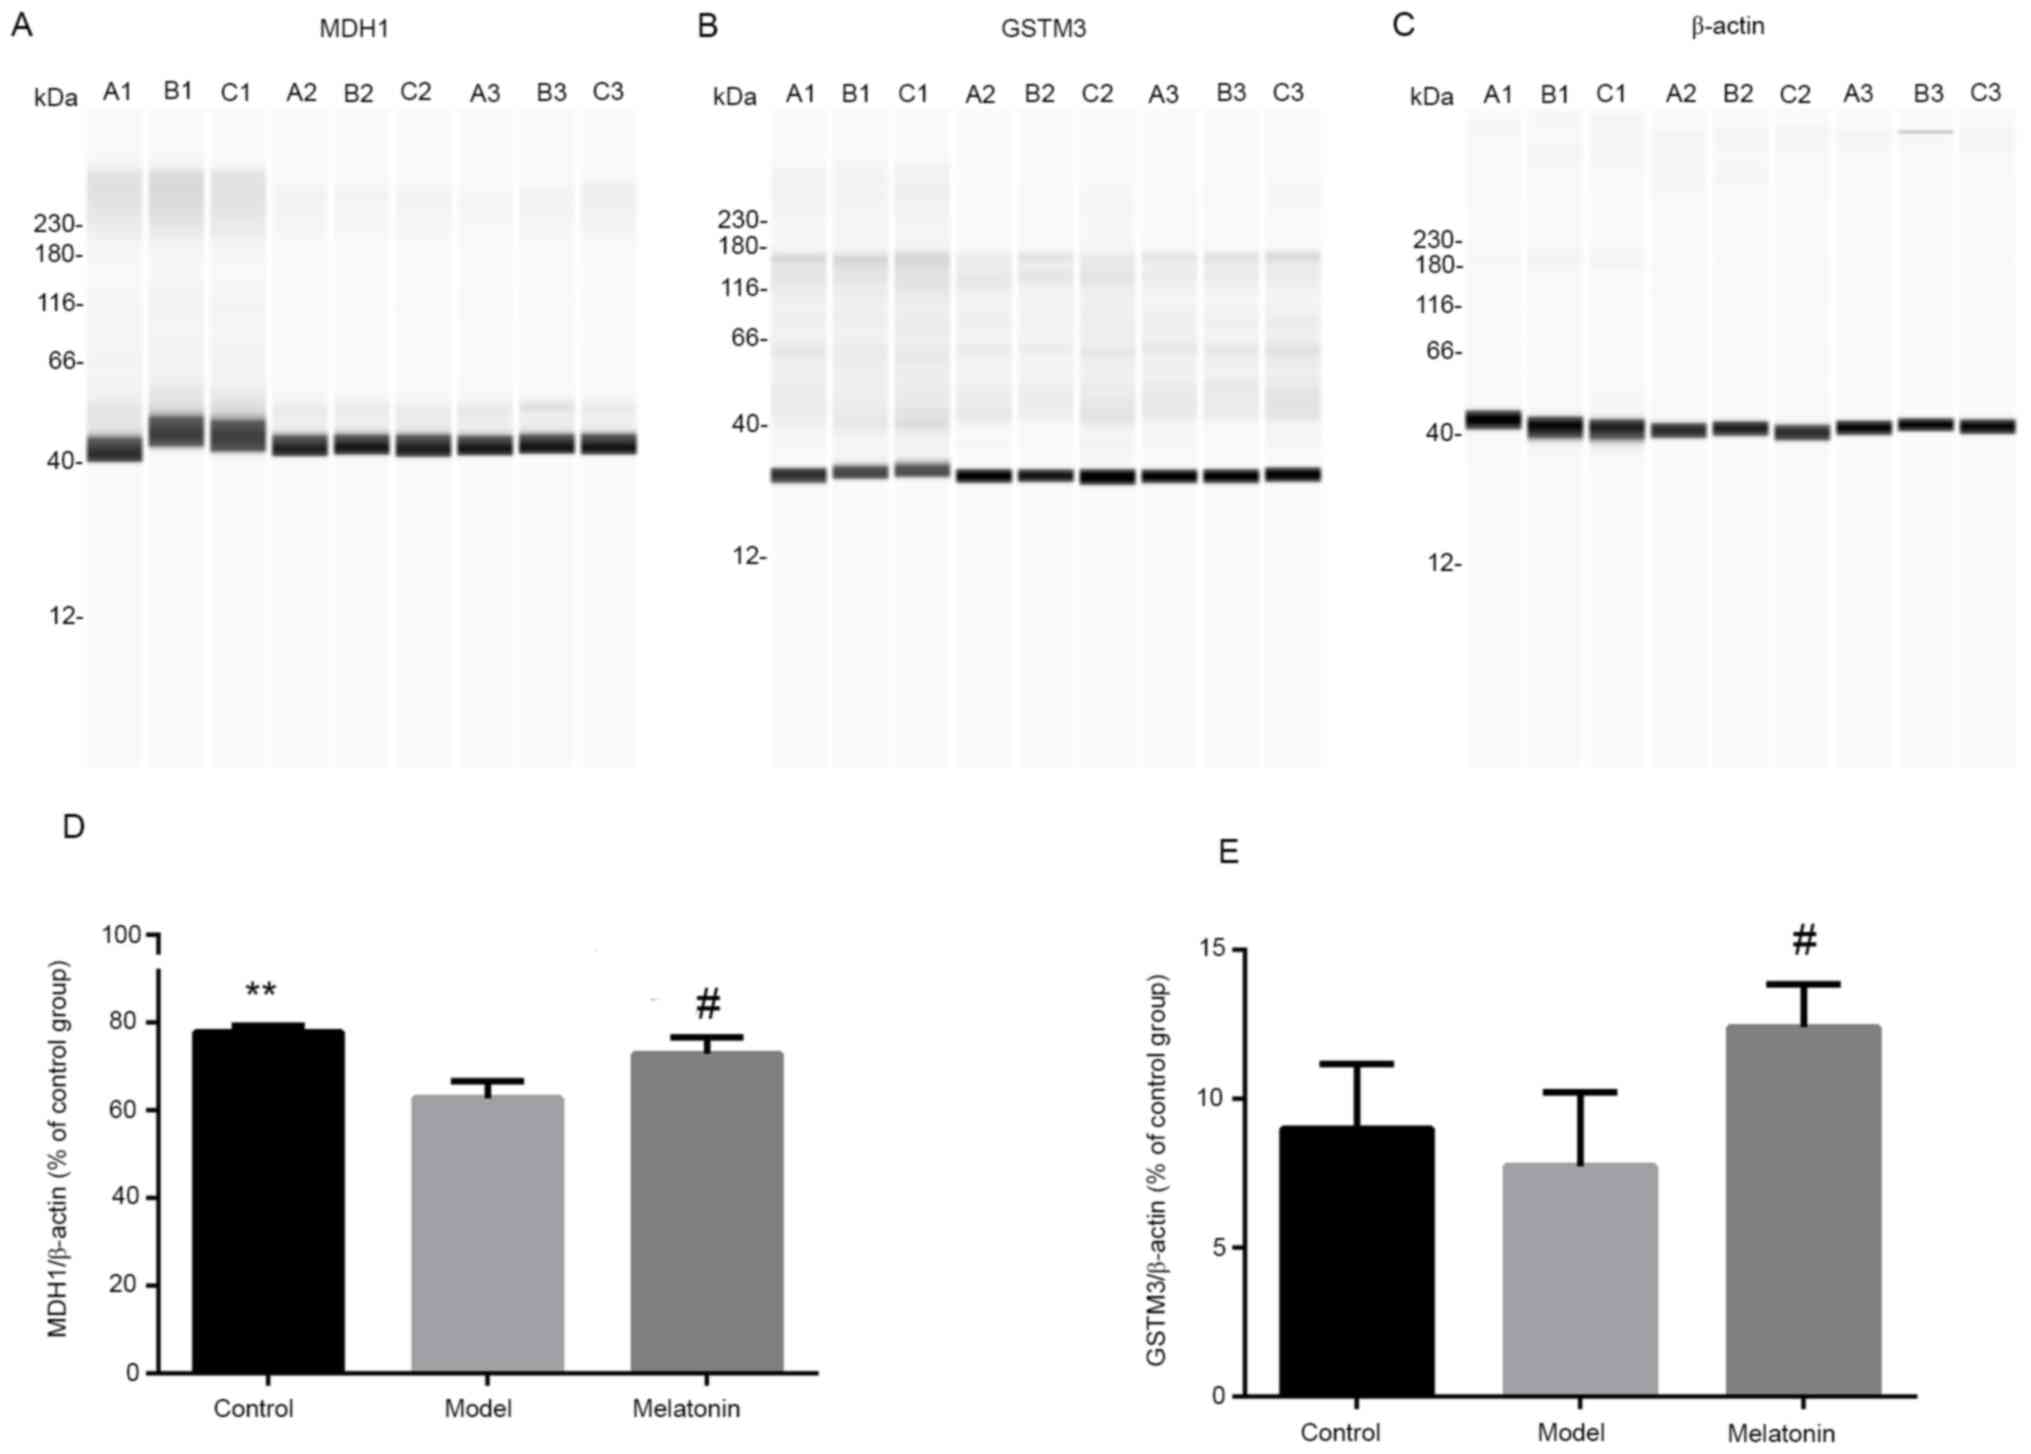
Western blot analysis
Western blot experiments were performed to validate
the results of iTRAQ combined with the LC-MS/MS analysis. The two
proteins MDH1 and GSTM3 were selected for this comparison. The
results indicated that the ratios of MDH1 and GSTM3 were decreased
following intraperitoneal injection of ANIT and increased with
melatonin treatment. These results were consistent with the
proteomics data (Fig. 8).
Discussion
The pathogenesis of acute cholestasis has remained
to be fully elucidated. Long-term biliary obstruction may cause
liver damage, even induce biliary cirrhosis or liver fibrosis and,
in severe cases, may lead to liver failure (25). In recent years, it has been
indicated that oxidative stress and abnormal fatty acid metabolism
may be involved in the pathogenesis of intrahepatic cholestasis
(11,12,24,26).
Previously, melatonin has been demonstrated to improve liver
fibrosis and liver damage caused by various diseases through
inhibiting oxidative damage (10).
In the present study, the differential expression protein profile
following melatonin treatment for ANIT-induced liver injury in rats
was determined using iTRAQ-coupled LC-MS/MS analysis. A total of 63
significantly differentially expressed proteins were identified and
two representative proteins were analyzed by western blot based on
the iTRAQ results.
The results of the KEGG pathway analysis indicated
that the PPAR signaling pathway was associated with fatty acid
degradation (Fig. 9), metabolism
and biosynthesis. In addition, the PPAR signaling pathway was
involved in pyruvate metabolism and citrate cycle, and linked to
carbon metabolism by ACAT2, MDH1 and ME1. The PPAR signaling
pathway and fatty acid degradation were also associated with
retinol metabolism via CYP4A2, and carbon metabolism via CYP2C22,
CYP4A2 and CYP2C13. In carbon metabolism, GSTM3 was linked to drug
metabolism by cytochrome P450.
It has been hypothesized that excessive accumulation
of bile acids may induce oxidative stress. This may result in an
abnormally oxidized state of the internal environment, inducing
mitochondrial generation of reactive oxygen species (ROS) by
interfering with compounds such as those involved in mitochondrial
respiratory chain complexes. These ROS are highly toxic and cause
damage to liver cells (24).
Melatonin is a mitochondrial targeting antioxidant, which is
synthesized in mitochondria, and the mitochondria are also the
sites of melatonin metabolism (27). The treatment of liver diseases is
constantly being explored and several novel drugs are based on
anti-oxidative strategies. They interfere with the pathological
mechanisms underlying mitochondrial damage, oxidative stress and
ROS production (28-30).
Oxidoreductase activity was among the top MF terms enriched by the
differentially expressed proteins was. Thus, it was speculated that
redox reactions were enhanced, and the imbalance between oxidation
and antioxidant systems was reduced following mitochondrial
synthesis enhanced by melatonin treatment. Thus, it was
hypothesized that the therapeutic mechanism underlying melatonin
treatment of acute cholestasis may be associated with the
alleviation of oxidative stress by enhancing antioxidant function
reducing ROS levels. A previous study by our group indicated that
glutathione (GSH) serves a pivotal role in the antioxidant defense
in intrahepatic cholestasis. In addition, GSH participates in
oxidative defense through its catalysis by glutathione
S-transferase (GST) and glutathione peroxidase. GSTM3, a member of
the GST family that upregulates the expression of proteins,
participates in oxidative defense to repair liver damage (31). In the present study, the expression
levels of GSTM3 were increased and the results were consistent with
those of the western blot analysis. Thus, GSTM3 may be a potential
biomarker for the treatment of intrahepatic cholestasis by
melatonin.
Mitochondrial β-oxidation, peroxisome β-oxidation,
ω-oxidation and microsome pathways are oxidized forms of fatty
acids in humans. Among these, β-oxidation of mitochondrial
long-chain fatty acids is the primary pathway of cellular
oxidation. ω-3 polyunsaturated fatty acids have been reported to be
effective in the prevention and treatment of cholestasis and n-3
polyunsaturated fatty acids may also exhibit therapeutic potential
(32). In the present study, KEGG
analysis suggested that fatty acid degradation, biosynthesis and
metabolism were significantly different prior to and after
treatment. Protein lysine acetylation is a type of
post-translational modification and acetylated proteins regulate
important metabolic processes such as fatty acid metabolism
(33). In cells, acetyl-CoA either
enters the tricarboxylic acid cycle or is used to synthesize fatty
acids. MDH1 catalyzes the conversion of malic acid to oxaloacetate
(34). Glucose is known to undergo
glycolysis (producing pyruvate), pyruvate subsequently produces
acetyl-CoA in the mitochondria and MDH1 promotes the citrate
shuttle to provide NADPH and acetyl-CoA for fat synthesis. In the
present study, MDH1 was significantly differentially expressed and
associated with carbon and pyruvate metabolism. MDH1 is
downregulated by ANIT and upregulated following melatonin
treatment. However, its function in the treatment of cholestasis
with melatonin requires further study (35).
The liver is a complex system and its nuclear
receptors have the ability to limit bile concentration and
siltation by coordinating the stabilization of bile acids and bile
secretion (36). One of these
nuclear receptors is PPAR. It affects bile balance and cholestatic
liver damage in humans (37). The
role of PPARs in the liver and fatty acid metabolism primarily
include modulation of peroxisome fatty acid oxidation and
mitochondrial function (38). The
KEGG pathway prediction of the present study suggested that the
activity of the PPAR signaling pathway changed significantly
between the model vs. control group and returned to near normal in
the melatonin group. Therefore, the role of the PPAR signaling
pathway in the treatment of cholestasis by melatonin requires
further validation.
Cytochrome P450 is a broad-spectrum biocatalyst with
catalytic activity. It primarily occurs in the liver but also in
other tissue types and is the primary enzyme involved in melatonin
metabolism (39). Cytochrome P450
was hypothesized to be relevant to the physiological production of
O2, which may result in oxidative stress under
pathological conditions (40).
Cytochrome P450 is also involved in the regulation of bile acids
and may participate in melatonin metabolism in rat livers (41). Studies have indicated that a lack of
cytochrome P450 may affect the metabolism of endogenous substances,
such as cholesterol and bile acids (42). In the present study, there was a
significant difference in metabolism of xenobiotics by cytochrome
P450 based on the KEGG pathway analysis between the melatonin group
and model group. Some of these proteins, such as CYP1A2 and CYP2E1,
are known to serve a role in the treatment of liver disease.
In conclusion, the results of the present study
suggest that the therapeutic mechanism of melatonin in the
treatment of acute cholestasis may be associated with enhancing
antioxidant function and relieving abnormal fatty acid metabolism.
The primary metabolic pathways of melatonin in the treatment of
cholestasis were fatty acid degradation, the PPAR signaling
pathway, fatty acid metabolism, chemical carcinogenesis, carbon
metabolism, pyruvate metabolism, fatty acid biosynthesis and
retinol metabolism, as well as drug metabolism mediated by
cytochrome P450. MDH1 and GSTM3 may be potential biomarkers for
melatonin treatment of intrahepatic cholestasis in the ANIT-induced
animal model. However, these proteomic results are preliminary data
and further studies are required to determine the role of these
proteins in the treatment of cholestasis with melatonin.
Acknowledgements
The authors would like to thank Professor Jian Li of
the Pathology Department of Beijing University of Chinese Medicine
(Beijing, China) and Mrs. Shujing Zhang of the Science Center
Department of Beijing University of Chinese Medicine (Beijing,
China) for their technical support.
Funding
Funding: The present study was supported by the National Natural
Science Foundation of China (grant no. 81573963).
Availability of data and materials
The mass spectrometry proteomics data have been
deposited to the ProteomeXchange Consortium (http://proteomecentral.proteomexchange.org) via the
iProX partner repository with the dataset identifier PXD023155. The
data can be accessed online at: https://www.iprox.org/page/project.html?id=IPX0002663000.
Authors' contributions
XZ and XD made substantial contributions to the
study conception. DW, HY and YL performed most of the experiments.
ZX, SS and DD performed histopathological analyses. LS, ZZ and XS
participated in data analysis and interpretation. DW and HY confirm
the authenticity of all the raw data. All authors have read and
approved the final version of this manuscript.
Ethics approval and consent to
participate
The study protocol was in strict accordance with the
recommendations of the Guidelines for the Care and Use of
Laboratory Anim als of the Ministry of Science and Technology of
China and was approved by the Medical and Experimental Animal
Ethics Committee of Beijing University of Chinese Medicine
(Beijing, China).
Patient consent for publication
Not applicable.
Competing interests
The authors declare that they have no competing
interests.
References
|
1
|
Meadows V, Kennedy L, Kundu D, Alpini G
and Francis H: Bile acid receptor therapeutics effects on chronic
liver diseases. Front Med (Lausanne). 7(15)2020.PubMed/NCBI View Article : Google Scholar
|
|
2
|
Hirschfield GM, Heathcote EJ and Gershwin
ME: Pathogenesis of cholestatic liver disease and therapeutic
approaches. Gastroenterology. 139:1481–1496. 2010.PubMed/NCBI View Article : Google Scholar
|
|
3
|
Black DD, Mack C, Kerkar N, Miloh T,
Sundaram SS, Anand R, Gupta A, Alonso E, Arnon R, Bulut P, et al: A
prospective trial of withdrawal and reinstitution of
ursodeoxycholic acid in pediatric primary sclerosing cholangitis.
Hepatol Commun. 3:1482–1495. 2019.PubMed/NCBI View Article : Google Scholar
|
|
4
|
Chen HL, Wu SH, Hsu SH, Liou BY, Chen HL
and Chang MH: Jaundice revisited: Recent advances in the diagnosis
and treatment of inherited cholestatic liver diseases. J Biomed
Sci. 25(75)2018.PubMed/NCBI View Article : Google Scholar
|
|
5
|
Mousa HS, Lleo A, Invernizzi P, Bowlus CL
and Gershwin ME: Advances in pharmacotherapy for primary biliary
cirrhosis. Expert Opin Pharmacother. 16:633–643. 2015.PubMed/NCBI View Article : Google Scholar
|
|
6
|
Lin GJ, Huang SH, Chen SJ, Wang CH, Chang
DM and Sytwu HK: Modulation by melatonin of the pathogenesis of
inflammatory autoimmune diseases. Int J Mol Sci. 14:11742–11766.
2013.PubMed/NCBI View Article : Google Scholar
|
|
7
|
Chen CQ, Fichna J, Bashashati M, Li YY and
Storr M: Distribution, function and physiological role of melatonin
in the lower gut. World J Gastroenterol. 17:3888–3898.
2011.PubMed/NCBI View Article : Google Scholar
|
|
8
|
Huang Y, Xu C, He M, Huang W and Wu K:
Saliva cortisol, melatonin levels and circadian rhythm alterations
in Chinese primary school children with dyslexia. Medicine
(Baltimore). 99(e19098)2020.PubMed/NCBI View Article : Google Scholar
|
|
9
|
Joseph D, Chong NW, Shanks ME, Rosato E,
Taub NA, Petersen SA, Symonds ME, Whitehouse WP and Wailoo M:
Getting rhythm: How do babies do it? Arch Dis Child Fetal Neonatal
Ed. 100:F50–F54. 2015.PubMed/NCBI View Article : Google Scholar
|
|
10
|
Zhang JJ, Meng X, Li Y, Zhou Y, Xu DP, Li
S and Li HB: Effects of melatonin on liver injuries and diseases.
Int J Mol Sci. 18(673)2017.PubMed/NCBI View Article : Google Scholar
|
|
11
|
Li Y, Yu H, Xu Z, Shi S, Wang D, Shi X,
Wang Y, Zeng B, Deng H, Deng X and Zhong X: Melatonin ameliorates
ANIT-induced cholestasis by activating Nrf2 through a
PI3K/Akt-dependent pathway in rats. Mol Med Rep. 19:1185–1193.
2019.PubMed/NCBI View Article : Google Scholar
|
|
12
|
Yu H, Li Y, Xu Z, Wang D, Shi S, Deng H,
Zeng B, Zheng Z, Sun L, Deng X and Zhong X: Identification of
potential biomarkers in cholestasis and the therapeutic effect of
melatonin by metabolomics, multivariate data and pathway analyses.
Int J Mol Med. 42:2515–2526. 2018.PubMed/NCBI View Article : Google Scholar
|
|
13
|
Fang ZZ, Tanaka N, Lu D, Jiang CT, Zhang
WH, Zhang C, Du Z, Fu ZW, Gao P, Cao YF, et al: Role of the
lipid-regulated NF-κB/IL-6/STAT3 axis in alpha-naphthyl
isothiocyanate-induced liver injury. Arch Toxicol. 91:2235–2244.
2017.PubMed/NCBI View Article : Google Scholar
|
|
14
|
Dahm LJ and Roth RA: Protection against
alpha-naphthylisothiocyanate-induced liver injury by decreased
hepatic non-protein sulfhydryl content. Biochem Pharmacol.
42:1181–1188. 1991.PubMed/NCBI View Article : Google Scholar
|
|
15
|
Wang BL, Zhang CW, Wang L, Tang KL, Tanaka
N, Gonzalez FJ, Xu Y and Fang ZZ: Lipidomics reveal aryl
hydrocarbon receptor (Ahr)-regulated lipid metabolic pathway in
alpha-naphthyl isothiocyanate (ANIT)-induced intrahepatic
cholestasis. Xenobiotica. 49:591–601. 2019.PubMed/NCBI View Article : Google Scholar
|
|
16
|
Tjandra K, Sharkey KA and Swain MG:
Progressive development of a Th1-type hepatic cytokine profile in
rats with experimental cholangitis. Hepatology. 31:280–290.
2000.PubMed/NCBI View Article : Google Scholar
|
|
17
|
Connolly AK, Price SC, Connelly JC and
Hinton RH: Early changes in bile duct lining cells and hepatocytes
in rats treated with alpha-naphthylisothiocyanate. Toxicol Appl
Pharmacol. 92:208–219. 1988.PubMed/NCBI View Article : Google Scholar
|
|
18
|
Mateos J, Estévez O, González-Fernández Á,
Anibarro L, Pallarés Á, Reljic R, Mussá T, Gomes-Maueia C,
Nguilichane A, Gallardo JM, et al: Serum proteomics of active
tuberculosis patients and contacts reveals unique processes
activated during Mycobacterium tuberculosis infection. Sci Rep.
10(3844)2020.PubMed/NCBI View Article : Google Scholar
|
|
19
|
Agafonov DE, Deckert J, Wolf E, Odenwälder
P, Bessonov S, Will CL, Urlaub H and Lührmann R: Semiquantitative
proteomic analysis of the human spliceosome via a novel
two-dimensional gel electrophoresis method. Mol Cell Biol.
31:2667–2682. 2011.PubMed/NCBI View Article : Google Scholar
|
|
20
|
Ylhä A, Nättinen J, Aapola U, Mikhailova
A, Nykter M, Zhou L, Beuerman R and Uusitalo H: Comparison of iTRAQ
and SWATH in a clinical study with multiple time points. Clin
Proteomics. 15(24)2018.PubMed/NCBI View Article : Google Scholar
|
|
21
|
Bantscheff M, Schirle M, Sweetman G, Rick
J and Kuster B: Quantitative mass spectrometry in proteomics: A
critical review. Anal Bioanal Chem. 389:1017–1031. 2007.PubMed/NCBI View Article : Google Scholar
|
|
22
|
Bantscheff M, Lemeer S, Savitski MM and
Kuster B: Quantitative mass spectrometry in proteomics: Critical
review update from 2007 to the present. Anal Bioanal Chem.
404:939–965. 2012.PubMed/NCBI View Article : Google Scholar
|
|
23
|
Nakamura T, Ohta Y, Ohashi K, Ikeno K,
Watanabe R, Tokunaga K and Harada N: Protective effect of brazilian
propolis against liver damage with cholestasis in rats treated with
α-Naphthylisothiocyanate. Evid Based Complement Alternat Med.
2013(302720)2013.PubMed/NCBI View Article : Google Scholar
|
|
24
|
Ohta Y, Kongo-Nishimura M, Imai Y and
Kitagawa A: Melatonin attenuates disruption of serum cholesterol
status in rats with a single alpha-naphthylisothiocyanate
treatment. J Pineal Res. 42:159–165. 2007.PubMed/NCBI View Article : Google Scholar
|
|
25
|
Chai J, Feng X, Zhang L, Chen S, Cheng Y,
He X, Yang Y, He Y, Wang H, Wang R and Chen W: Hepatic expression
of detoxification enzymes is decreased in human obstructive
cholestasis due to gallstone biliary obstruction. PLoS One.
10(e0120055)2015.PubMed/NCBI View Article : Google Scholar
|
|
26
|
Zhang Y, Li F, Patterson AD, Wang Y,
Krausz KW, Neale G, Thomas S, Nachagari D, Vogel P, Vore M, et al:
Abcb11 deficiency induces cholestasis coupled to impaired β-fatty
acid oxidation in mice. J Biol Chem. 287:24784–24794.
2012.PubMed/NCBI View Article : Google Scholar
|
|
27
|
Tan DS and Russel RJ: Mitochondria: The
birth place, battle ground and the site of melatonin metabolism in
cells. Melatonin Res. 2:44–66. 2019.
|
|
28
|
Chen HH, Chen YT, Yang CC, Chen KH, Sung
PH, Chiang HJ, Chen CH, Chua S, Chung SY, Chen YL, et al: Melatonin
pretreatment enhances the therapeutic effects of exogenous
mitochondria against hepatic ischemia-reperfusion injury in rats
through suppression of mitochondrial permeability transition. J
Pineal Res. 61:52–68. 2016.PubMed/NCBI View Article : Google Scholar
|
|
29
|
Caldwell S: NASH Therapy: Omega 3
supplementation, vitamin E, insulin sensitizers and statin drugs.
Clin Mol Hepatol. 23:103–108. 2017.PubMed/NCBI View Article : Google Scholar
|
|
30
|
Perumpail BJ, Cholankeril R, Yoo ER, Kim D
and Ahmed A: An overview of dietary interventions and strategies to
optimize the management of non-alcoholic fatty liver disease.
Diseases. 5(23)2017.PubMed/NCBI View Article : Google Scholar
|
|
31
|
Yang H, Ramani K, Xia M, Ko KS, Li TW, Oh
P, Li J and Lu SC: Dysregulation of glutathione synthesis during
cholestasis in mice: Molecular mechanisms and therapeutic
implications. Hepatology. 49:1982–1991. 2009.PubMed/NCBI View Article : Google Scholar
|
|
32
|
Burhans MS, Flowers MT, Harrington KR,
Bond LM, Guo CA, Anderson RM and Ntambi JM: Hepatic oleate
regulates adipose tissue lipogenesis and fatty acid oxidation. J
Lipid Res. 56:304–318. 2015.PubMed/NCBI View Article : Google Scholar
|
|
33
|
Tong L: Acetyl-coenzyme A carboxylase:
Crucial metabolic enzyme and attractive target for drug discovery.
Cell Mol Life Sci. 62:1784–1803. 2005.PubMed/NCBI View Article : Google Scholar
|
|
34
|
Easlon E, Tsang F, Skinner C, Wang C and
Lin SJ: The malate-aspartate NADH shuttle components are novel
metabolic longevity regulators required for calorie
restriction-mediated life span extension in yeast. Genes Dev.
22:931–944. 2008.PubMed/NCBI View Article : Google Scholar
|
|
35
|
Kim EY, Kim WK, Kang HJ, Kim JH, Chung SJ,
Seo YS, Park SG, Lee SC and Bae KH: Acetylation of malate
dehydrogenase 1 promotes adipogenic differentiation via activating
its enzymatic activity. J Lipid Res. 53:1864–1876. 2012.PubMed/NCBI View Article : Google Scholar
|
|
36
|
Rudraiah S, Zhang X and Wang L: Nuclear
receptors as therapeutic targets in liver disease: Are we there
yet? Annu Rev Pharmacol Toxicol. 56:605–626. 2016.PubMed/NCBI View Article : Google Scholar
|
|
37
|
Halilbasic E, Baghdasaryan A and Trauner
M: Nuclear receptors as drug targets in cholestatic liver diseases.
Clin Liver Dis. 17:161–189. 2013.PubMed/NCBI View Article : Google Scholar
|
|
38
|
Montagner A, Korecka A, Polizzi A, Lippi
Y, Blum Y, Canlet C, Tremblay-Franco M, Gautier-Stein A, Burcelin
R, Yen YC, et al: Hepatic circadian clock oscillators and nuclear
receptors integrate microbiome-derived signals. Sci Rep.
6(20127)2016.PubMed/NCBI View Article : Google Scholar
|
|
39
|
Tan DX, Manchester LC, Esteban-Zubero E,
Zhou Z and Reiter RJ: Melatonin as a potent and inducible
endogenous antioxidant: Synthesis and metabolism. Molecules.
20:18886–18906. 2015.PubMed/NCBI View Article : Google Scholar
|
|
40
|
Jaeschke H, Gores GJ, Cederbaum AI, Hinson
JA, Pessayre D and Lemasters JJ: Mechanisms of hepatotoxicity.
Toxicol Sci. 65:166–176. 2002.PubMed/NCBI View Article : Google Scholar
|
|
41
|
Semak I, Korik E, Antonova M, Wortsman J
and Slominski A: Metabolism of melatonin by cytochrome P450s in rat
liver mitochondria and microsomes. J Pineal Res. 45:515–523.
2008.PubMed/NCBI View Article : Google Scholar
|
|
42
|
Woolbright BL and Jaeschke H: Xenobiotic
and endobiotic mediated interactions between the Cytochrome P450
system and the inflammatory response in the liver. Adv Pharmacol.
74:131–161. 2015.PubMed/NCBI View Article : Google Scholar
|