Introduction
According to Global Cancer Statistics 2018, newly
diagnosed cases of breast cancer account for ~25% of all cancers in
females. Female breast cancer is the most frequently diagnosed
malignancy worldwide (in 154 of 185 countries) and is the primary
cause of cancer-associated death in over 100 countries (1). Marusyk and Polyak (2) revealed that breast cancer is a
heterogeneous disease on a clinicopathological, cellular and
molecular level. According to a molecular study, breast cancer may
be classified into ≥4 subtypes, including luminal, human epidermal
growth factor receptor 2 (HER2)-enriched, basal-like and
normal-like breast cancer (3).
Among these subtypes, basal-like breast cancer is the most highly
malignant type, accounting for 75% of triple-negative breast
cancers (TNBCs) that lack estrogen receptor (ER), progesterone
receptor and HER2 expression (4).
TNBC is a highly aggressive and heterogenic disease with an earlier
age of onset and greater metastatic potential than non-TNBC
(5). Evidence suggests that
patients with non-TNBC have improved survival rates compared with
those with TNBC and that these patients benefit from targeted
therapy. Due to a lack of available targeted therapies,
chemotherapy is currently the standard treatment for TNBC (6,7).
However, patients frequently experience drug resistance, which
results in tumor recurrence and disease progression (8). Therefore, it is critical to identify
novel potential therapeutic targets for breast cancer, particularly
TNBC.
Weighted gene co-expression network analysis (WGCNA)
uses systems biology to identify modules of highly related genes
and associate these modules with clinical traits. Therefore, WGCNA
is widely used to identify and screen for biomarkers (9), and has been successfully used to
discover therapeutic targets for a variety of cancer types,
including, but not limited to, laryngeal cancer (10), leiomyosarcoma (11) and advanced gastric cancer (12).
In the present study, the breast cancer microarray
dataset GSE76275 was downloaded from the Gene Expression Omnibus
(GEO) database and WGCNA was used to select target gene candidates,
which were then validated using alterative datasets and in
vitro experimentation.
Materials and methods
Data preprocessing
Gene expression data and clinical information from
patients with breast cancer were downloaded from the GEO database
(https://www.ncbi.nlm.nih.gov/geo/).
The gene expression profiles included GSE76275(13) and GSE42568(14) (platform, GPL570 (HG-U133_Plus_2);
Affymetrix Human Genome U133 Plus 2.0 Array; Thermo Fisher
Scientific, Inc.), as well as GSE25055(15) and GSE25065(15) (platform, GPL96 (HG-U133A);
Affymetrix Human Genome U133A Array; Thermo Fisher Scientific,
Inc.). The inclusion criteria were as follows: i) Patients with a
diagnosis of breast cancer; ii) in GSE76275, patients with complete
clinical data, including age, tumor stage, tumor size, lymph node
status, metastasis and tumor grade; iii) in GSE25055, patients with
complete clinical data on tumor size, lymph node status, tumor
stage, tumor grade, breast cancer subtype, status (dead or alive)
and specific follow-up time; iv) in GSE25065, patients with
complete clinical data on tumor size, lymph node status, tumor
stage, tumor grade and breast cancer subtype; and v) in GSE42568,
patients with complete clinical information on tumor size, lymph
node status, tumor grade and ER status.
Weighted gene co-expression network
construction
The top 25% most variable genes in GSE76275 were
selected for further analysis using the WGCNA package (https://horvath.genetics.ucla.edu/html/CoexpressionNetwork/Rpackages/WGCNA/;
version 1.69). First, the samples were clustered to construct the
sampleTree and detected outliers were selected based on cut height.
‘Sample dendrogram’ and ‘trait heatmap’ were used to develop each
network in order to investigate the relationship between the
corresponding sample gene expression data and clinical phenotypes.
The value of the soft-thresholding parameter used to construct the
adjacency matrix was set as β=6. Furthermore, the adjacency matrix
was transformed into the topological overlap matrix (TOM).
According to the TOM-based dissimilarity measure, genes with
absolute correlation values were clustered into the same module to
generate a cluster dendrogram (deep-split, 2; minimum cluster size,
30; cut height, 0.25). In an effort to visually represent the
relationships between modules and the clinical features of breast
cancer, Pearson's correlation coefficient was calculated and
plotted in a heatmap. Modules were determined to have a significant
correlation to clinical traits when P<0.05. The highest
correlating module was selected as the key module for further
analysis.
Identification and validation of hub
genes
In the present study, hub genes were screened out
based on the cut-off criteria of module membership (MM), gene
significance (GS) and survival analysis. MM was defined as the
Pearson's correlation coefficient between each gene in the key
module and the module eigengene, where MM reflects the module
connectivity of each gene. GS was defined as the correlation
coefficient between each gene in the key module and its
corresponding clinical trait, where GS represents the biological
significance of each gene. MM>0.7 and GS>0.2 were set as
cut-off criteria to screen genes in the key module with high
functional significance. Gene expression and clinical prognostic
information (vital status and follow-up time) from patients with
breast cancer were integrated based on GSE25055. The survival
package in R (https://github.com/therneau/survival; version 3.2-7)
was used to perform survival analysis. In order to assess the
prognostic value of these genes in patients with breast cancer, the
Kaplan-Meier plotter (http://kmplot.com/) database was used to generate
relapse-free survival (RFS) and overall survival (OS) curves. Genes
that were indicated to be associated with RFS through both methods
were designated as hub genes for deeper validation. In order to
validate their reliability, the expression of the hub genes in
relation to clinicopathological characteristics (such as
pathological T stage, pathological N stage, tumor stage, tumor
grade and breast cancer subtype) were analyzed based on the
GSE25055, GSE25065 and GSE42568 datasets. The R packages ‘ggplot’
(https://ggplot2.tidyverse.org/; version
3.3.0), ‘ggpubr’ (https://rpkgs.datanovia.com/ggpubr/; version 0.2.5)
and ‘ggsignif’ (https://github.com/const-ae/ggsignif; version 0.6.0)
were used to perform correlation analyses between gene expression
and clinical traits. To verify the protein expression levels of the
hub genes in breast cancer and normal tissues, immunohistochemistry
(IHC) data were downloaded from the Human Protein Atlas (HPA;
http://www.proteinatlas.org). The R
package ‘corrplot’ (https://github.com/taiyun/corrplot; version 0.84) was
used to assess the correlation between the expression levels of
each hub gene.
Gene set enrichment analysis
(GSEA)
GSEA was used to predict the potential function of
each hub gene. For each hub gene, a total of 267 breast cancer
samples in the GSE25055 dataset were divided into high-risk and
low-risk groups; c2.cp.kegg.v7.1.symbols.gmt was selected as the
reference gene set. The number of permutations was set at 1,000
times for each analysis. Nominal P<0.05, false discovery rate
<25% and gene size ≥50 were selected as the thresholds.
IHC
Breast cancer and adjacent normal tissues were
collected from patients (age range, 52-67 years; mean age, 60
years) undergoing mastectomy and with a postoperative pathology
diagnosis of breast cancer at Zhongnan Hospital (Wuhan, China)
between May and September 2019. Written informed consent was
obtained from each patient prior to surgery and the patient
protocols were approved by the hospital's ethics committee
(approval no. 2015073). IHC was used to detect the expression
levels of S-adenosylmethionine decarboxylase proenzyme (AMD1) in
both sets of tissues. The tissue samples were excised, fixed with
formalin, dehydrated and embedded in paraffin, and subsequently cut
into 5-mm sections. For IHC, the sections were incubated with
primary antibodies against AMD1 (1:500 dilution; cat. no. ab65820;
Abcam) at 4˚C overnight. After washing three times with PBS, the
sections were incubated with an HRP-conjugated secondary antibody
(1:400 dilution; cat. no. AS061; ABclonal Biotech Co., Ltd.) at
room temperature for 1.5 h. After further washing, the peroxidase
activity was visualized using freshly prepared diaminobenzidine
(OriGene Technologies, Inc.) and the slides were then lightly
counterstained with Harris' hematoxylin. The negative controls were
processed in the same way, but with PBS in place of the primary
antibody. Finally, the slides were observed under a light
microscope (Nikon, Inc.; x200).
Cell culture
Human breast cancer cell lines (MCF-7, MDA-MB-231,
MDA-MB-468 and MDA-MB-157) and a mammary epithelial cell line
(MCF-10A) were purchased from the Cell Bank of the Chinese Academy
of Sciences. The cells were cultured in Dulbecco's modified Eagle's
medium (DMEM; Gibco; Thermo Fisher Scientific, Inc.) supplemented
with 10% fetal bovine serum (FBS; Gibco; Thermo Fisher Scientific,
Inc.) at 37˚C with 5% CO2.
Reverse transcription-quantitative
(RT-q)PCR
Total RNA was extracted from each cell type using
TRIzol® reagent (Invitrogen; Thermo Fisher Scientific,
Inc.). The miScript Reverse Transcription kit (Qiagen GmbH) was
used according to the manufacturer's instructions for RT with 3 µg
total RNA. qPCR was performed using the SYBR-Green Master Mix
(Takara Biotechnology Co., Ltd.). The qPCR was performed on a
StepOnePlus Real-Time PCR System (Applied Biosystems; Thermo Fisher
Scientific, Inc.) and the thermocycling conditions were as follows:
95˚C for 5 min and 40 cycles of 95˚C for 10 sec and 60˚C for 30
sec. The following primer sequences were used in the present study:
GAPDH forward, 5'-TGTGGGCATCAATGGATTTGG-3' and reverse,
5'-ACACCATGTATTCCGGGTCAAT-3'; and AMD1 forward,
5'-GGCCTGTACCATACAAGCCC-3' and reverse,
5'-CCACGTAGACGAGGTAGTTGTG-3'. AMD1 expression was quantified using
the 2-ΔΔCq method (16).
Transfection
MDA-MB-231 cells were transfected with small
inhibitory RNA targeting AMD1 (si-AMD1;
5'-CGGATGGAACTTATTGGACTA-3') and negative control siRNA (si-NC,
5'-UUCUCCGAACGUGUCAGGUTT-3'), which was designed and purchased from
Shanghai GenePharma Co., Ltd. Transfection was performed using
Lipofectamine® 3000 (Invitrogen; Thermo Fisher
Scientific, Inc.) according to the manufacturer's protocol. After
transfection for 48 h, the cells were harvested for subsequent
analyses.
Cellular proliferation assay
The effects of AMD1 on breast cancer cell viability
were determined using the Cell Counting Kit-8 (CCK-8) as per the
manufacturer's protocol. MDA-MB-231 cells were seeded into 96-well
plates at a concentration of 2x10³ cells/well. After
culturing at 37˚C for 24 h, 10 µl CCK-reagent was added to each
well and the cells were incubated for a further 2 h. To estimate
cell numbers, the absorbance of each well was measured using a
microplate reader at 450 nm.
Migration and invasion assays
Cellular invasion and migration assays were
performed using Transwell inserts (Corning, Inc.) coated with or
without Matrigel, respectively. MDA-MB-231 cells (2x10⁵
cells/ml) were seeded into the upper chamber, and DMEM containing
20% FBS was added to the lower chamber. After culturing at 37˚C for
24 h, cells that had migrated to the lower chambers were fixed with
methanol, stained with 0.5% crystal violet and counted in three
randomly selected fields using ImageJ software (version 1.53;
National Institutes of Health).
Apoptosis analysis
Propidium Iodide/Annexin V-APC staining and flow
cytometric analysis were performed to estimate the apoptotic rates
of breast cancer cells. The Annexin V/PI Cell Apoptosis kit
(Sungene Biotech Co., Ltd.) was used to detect Apoptotic cells
according to the manufacturer's protocol. Flow cytometric analysis
was performed using a BD Accuri C6 flow cytometer (BD Biosciences)
and results were evaluated with FlowJo software (version 7.6.1;
FlowJo LLC).
Statistical analysis
The data were analyzed using R (version 3.6.3) and
GraphPad Prism 7 software (GraphPad Software, Inc.). All
experiments were performed in triplicate and the data are expressed
as the mean ± standard error of the mean. Differences between two
groups were assessed using unpaired Student's t-test and those
among multiple groups were assessed by one-way ANOVA and
Bonferroni's post-hoc test. A two-tailed P<0.05 was considered
to indicate a statistically significant difference.
Results
Clinicopathological characteristics of
patients with breast cancer
The present study included 120 patients with breast
cancer from the GSE76275 dataset, 260 from the GSE25055 dataset,
183 from the GSE25065 dataset and 101 from the GSE42568 dataset,
all with complete clinicopathological data for the following
analyses. Detailed clinicopathological information for each cohort
is displayed in Table I.
 | Table IClinicopathological characteristics
of breast cancer patients in the different datasets. |
Table I
Clinicopathological characteristics
of breast cancer patients in the different datasets.
| | Dataset |
|---|
| Parameter | GSE76275 | GSE25055 | GSE25065 | GSE42568 |
|---|
| Age (years) | | | | |
|
<65 | 88 (73.3) | NA | NA | NA |
|
≥65 | 32 (26.7) | NA | NA | NA |
| Tumor size
(cm) | | | | |
|
≤2 | 26 (21.7) | 19 (7.3) | 10 (5.5) | 18 (17.8) |
|
2-5 | 79 (65.8) | 145 (55.8) | 87 (47.5) | 80 (79.2) |
|
>5 | 9 (7.5) | 56 (21.5) | 67 (36.6) | 3 (3.0) |
|
Any size
with direct extension | 6 (5.0) | 40 (15.4) | 19 (10.4) | NA |
| Metastatic lymph
nodes | | | | |
|
Negative | 57 (47.5) | 76 (29.2) | 66 (36.1) | 44 (43.6) |
|
Positive | 63 (52.5) | 184 (70.1) | 117 (63.9) | 57 (56.4) |
| Distant
metastasis | | | | |
|
Negative | 118 (98.3) | NA | NA | NA |
|
Positive | 2 (1.7) | NA | NA | NA |
| Tumor stage | | | | |
|
I | 17 (14.2) | 5 (1.9) | 2 (1.1) | NA |
|
II | 72 (60.0) | 143 (55.0) | 104 (56.8) | NA |
|
III | 29 (24.1) | 112 (43.1) | 77 (42.1) | NA |
|
IV | 2 (1.7) | NA | NA | NA |
| Tumor grade | | | | |
|
Well | 2 (1.7) | 13 (5.0) | 13 (7.1) | 18 (17.8) |
|
Moderate | 43 (35.8) | 108 (41.5) | 63 (34.4) | 80 (79.2) |
|
Poor | 75 (62.5) | 139 (53.5) | 107 (58.5) | 3 (3.0) |
| Breast cancer
subtype | | | | |
|
Basal | 120(100) | 109 (41.9) | 64 (35.0) | NA |
|
Her2 | NA | 19 (7.3) | 12 (6.6) | NA |
|
Luminal | NA | 132 (50.8) | 88 (48.0) | NA |
|
Normal | NA | NA | 19 (10.4) | NA |
| Survival
status | | | | |
|
Alive | NA | 205 (78.8) | NA | NA |
|
Dead | NA | 55 (21.2) | NA | NA |
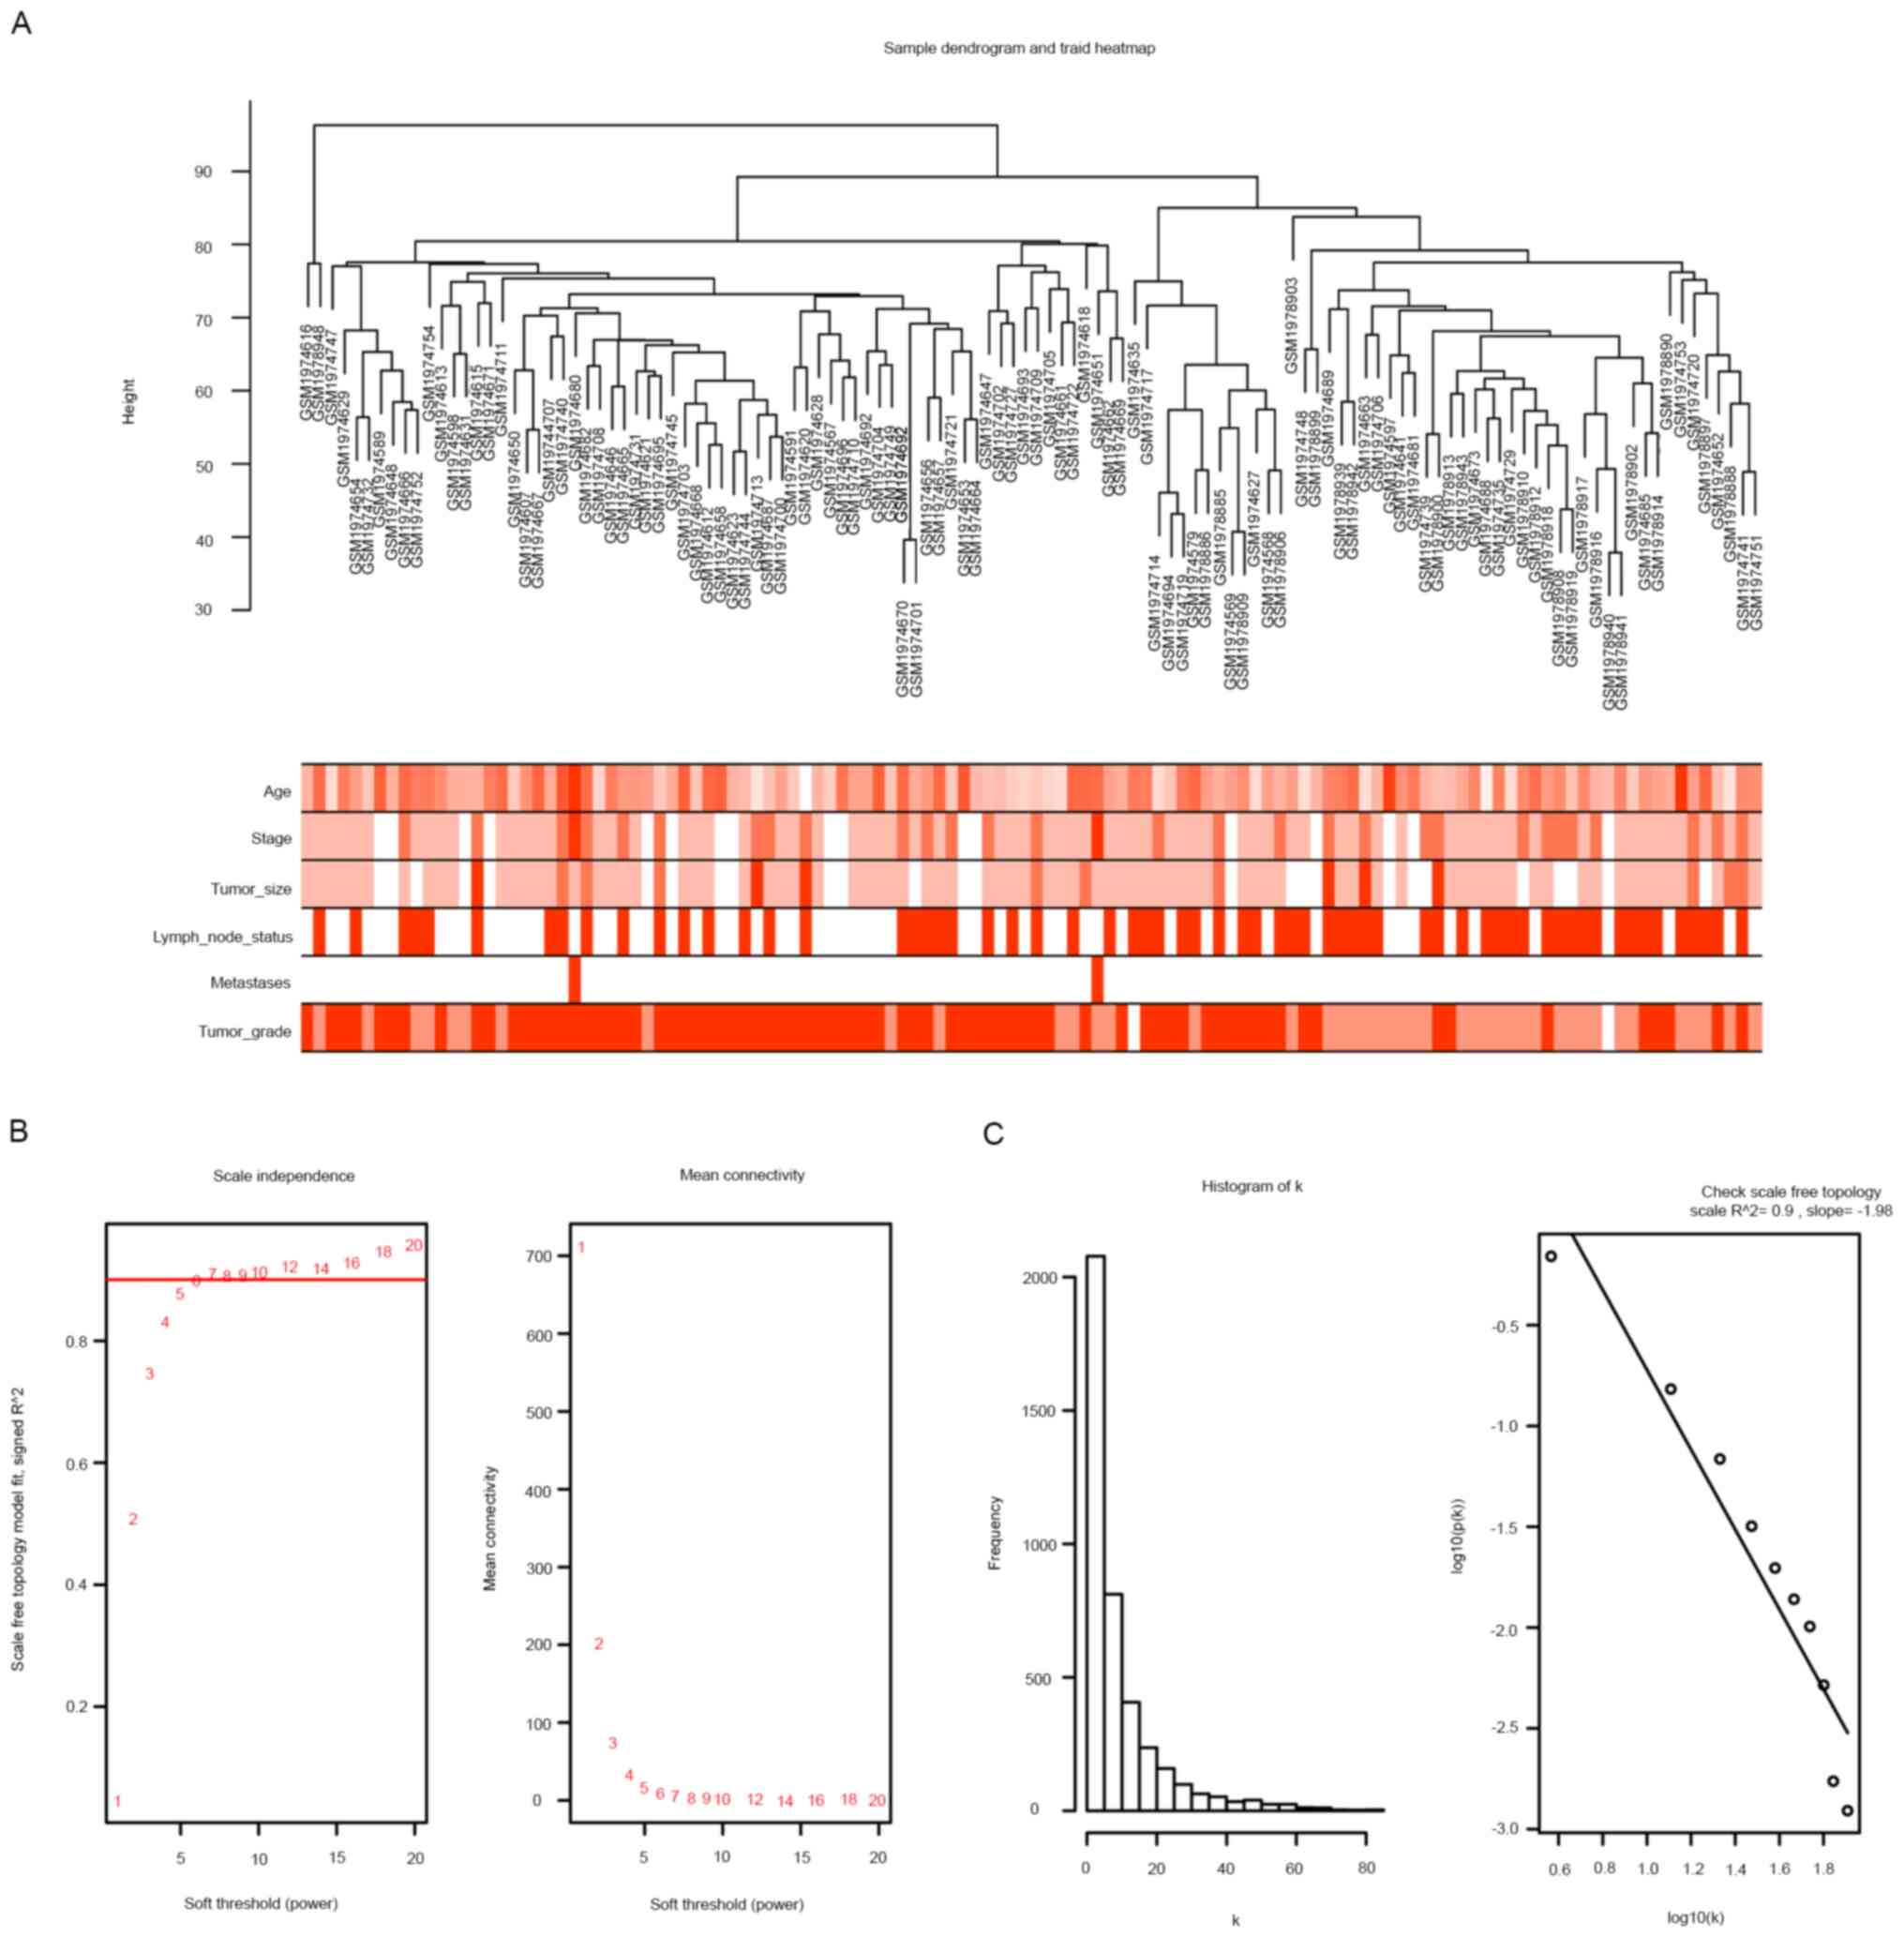
Weighted co-expression network
construction and key module identification
The top 25% most variable genes (n=4,052) were
selected for co-expression analysis using the WGCNA package. A
sample dendrogram and trait heatmap were used to split the selected
samples into the appropriate clusters; the distribution map of
clinical trait data is provided in Fig.
1A. When the power was equal to 6, the R2 scale was
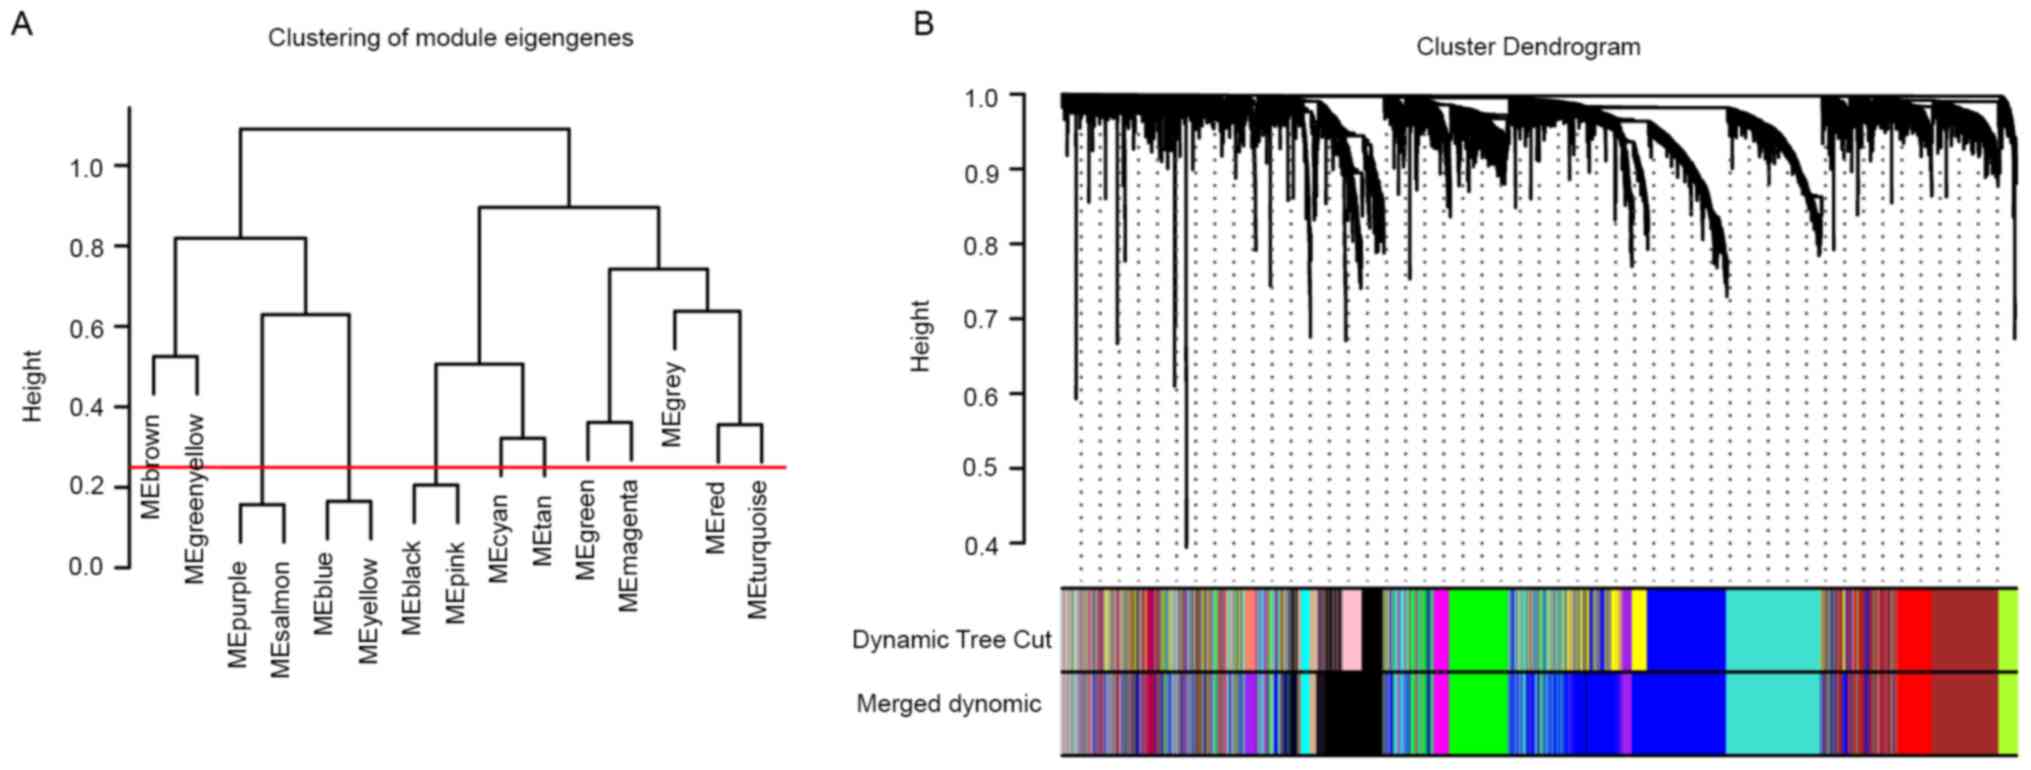
equal to 0.9 (Fig. 1B and C). Therefore, β=6 was selected as the soft
threshold for breast cancer co-expression analysis. The 15 original
co-expression modules were obtained using the dynamic tree cut
method. After setting the cut height to 0.25, thereby merging
highly similar modules (Fig. 2A),
12 modules were screened out (Fig.
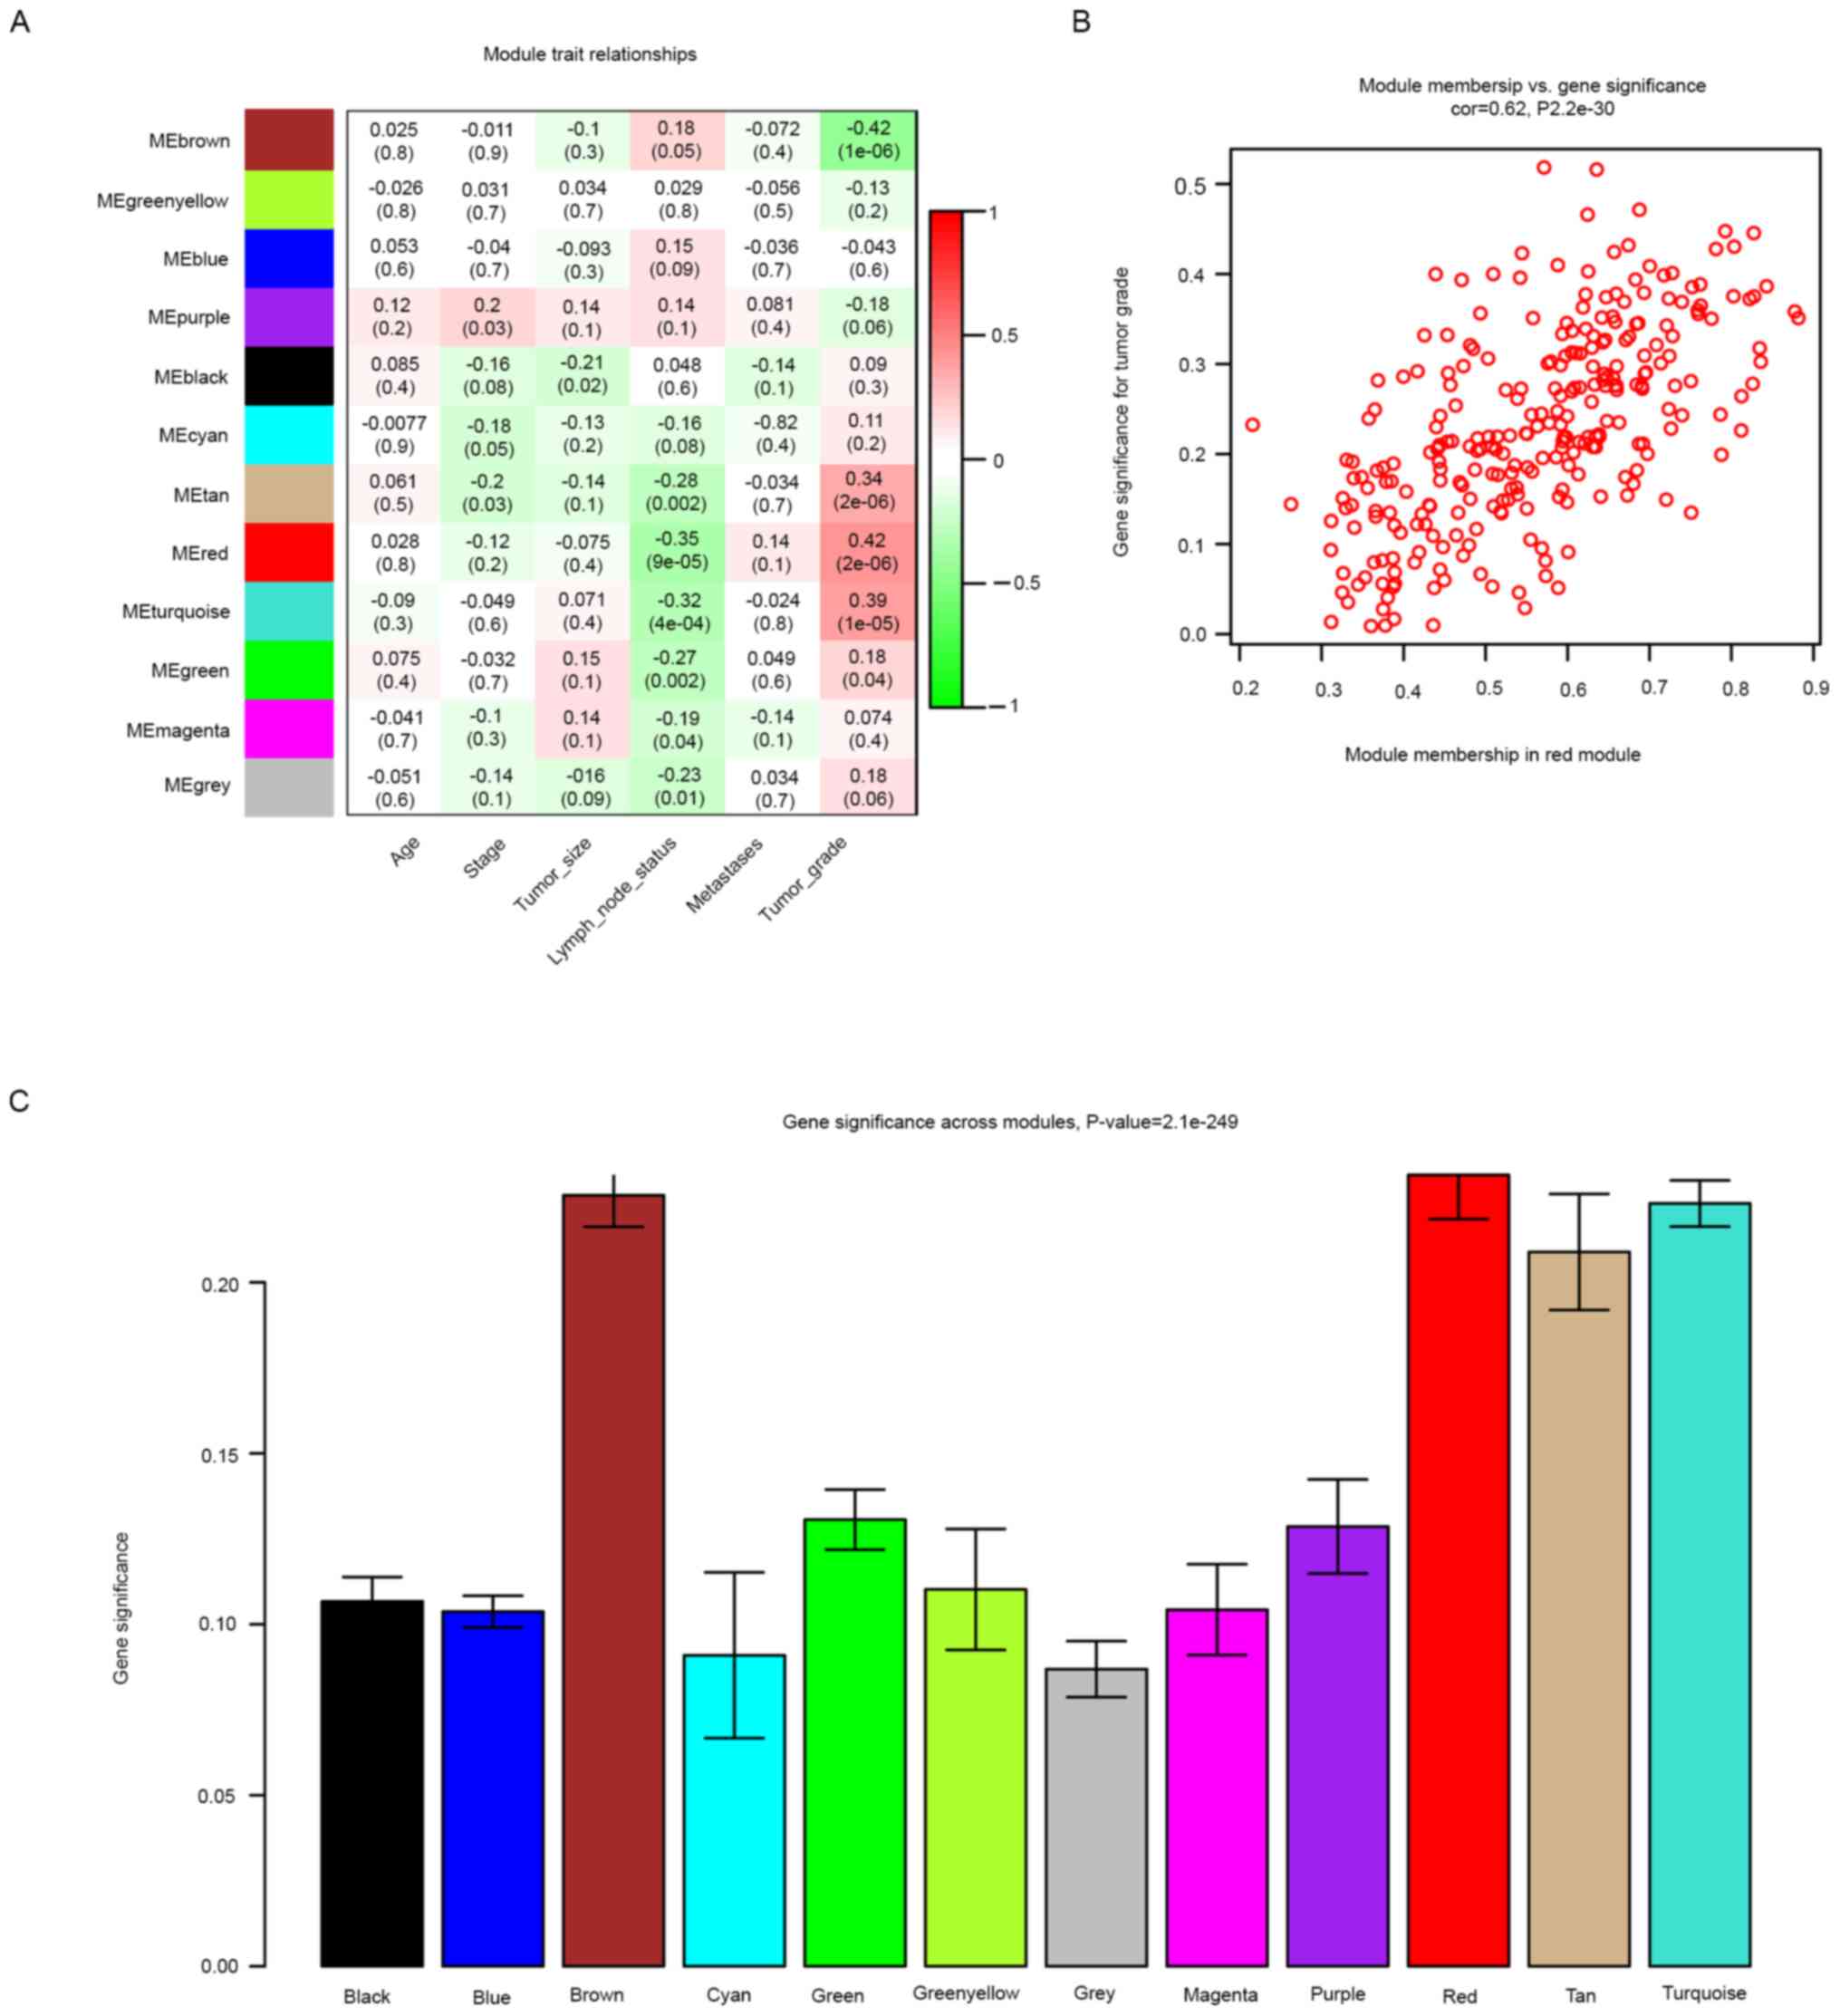
2B). The association between the modules and clinical traits
was then analyzed, allowing for the selection of key modules for
further investigation. The red module, which contained 273 genes,
was identified as the key module. The heatmap and histogram
indicated that the red module was positively correlated with the
tumor grade. In a scatter plot of GS vs. MM, a significant
correlation was evident in the red module. The plot revealed that
MM in the red module demonstrated a significant correlation with
the tumor grade (r=0.62, P=2.2x10⁻³⁰) (Fig. 3A-C).
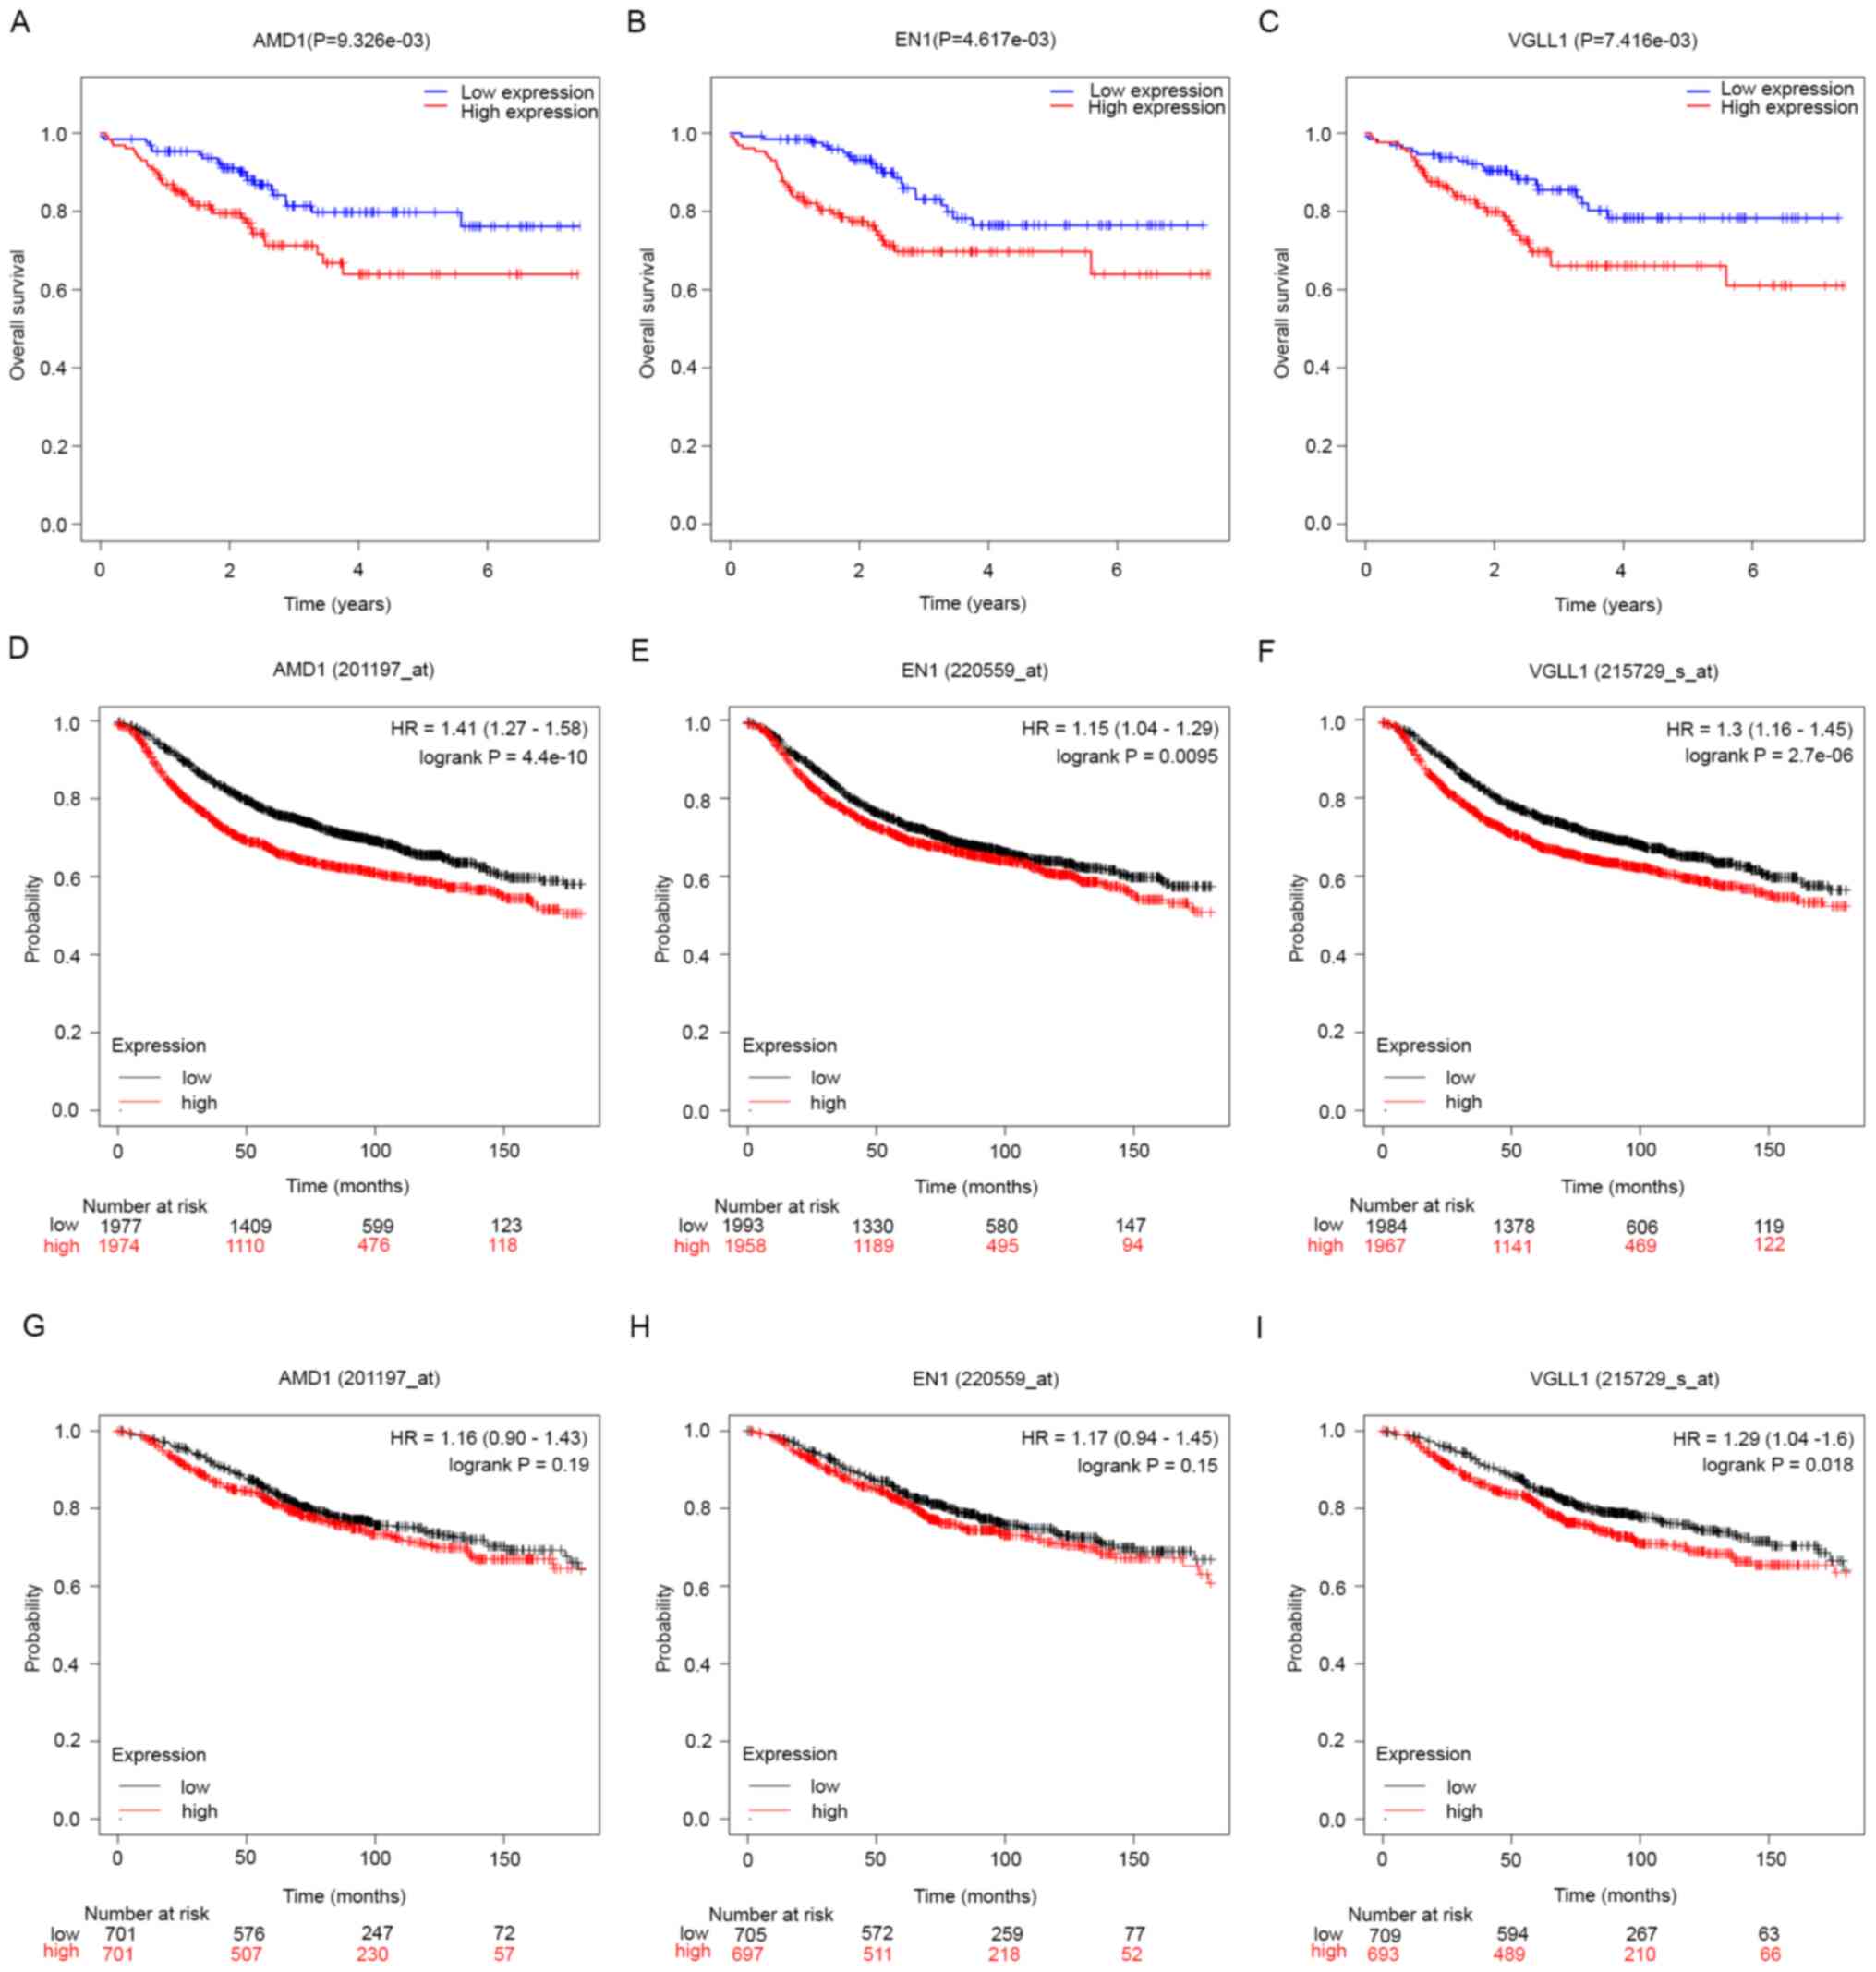
Hub gene screening and validation
Hub genes were screened out using the red module.
MM>0.7 and GS>0.2 were set as the cut-off criteria to screen
36 genes with high functional significance. Among them, 9 (prominin
1, γ-butyrobetaine hydroxylase 1, BAF chromatin remodeling complex
subunit BCL11A, AMD1, rhophilin associated tail protein 1B,
vestigial-like protein (VGLL1), tripartite motif containing 2,
homeobox protein engrailed-1 (EN1) and keratin 6B) and 6 genes
(Kruppel like factor 5, AMD1, EN1, desmocollin 2, VGLL1 and
allograft inflammatory factor 1 like) were negatively correlated
with RFS of patients with breast cancer, based on the validation
dataset GSE25055 and the Kaplan-Meier plotter tool, respectively.
AMD1, EN1 and VGLL1 were associated with poor RFS in both analyses
and only VGLL1 was associated with a worse OS prognosis (according
to Kaplan-Meier survival curves; Fig.
4A-I). Consequently, AMD1, EN1 and VGLL1 were identified as hub
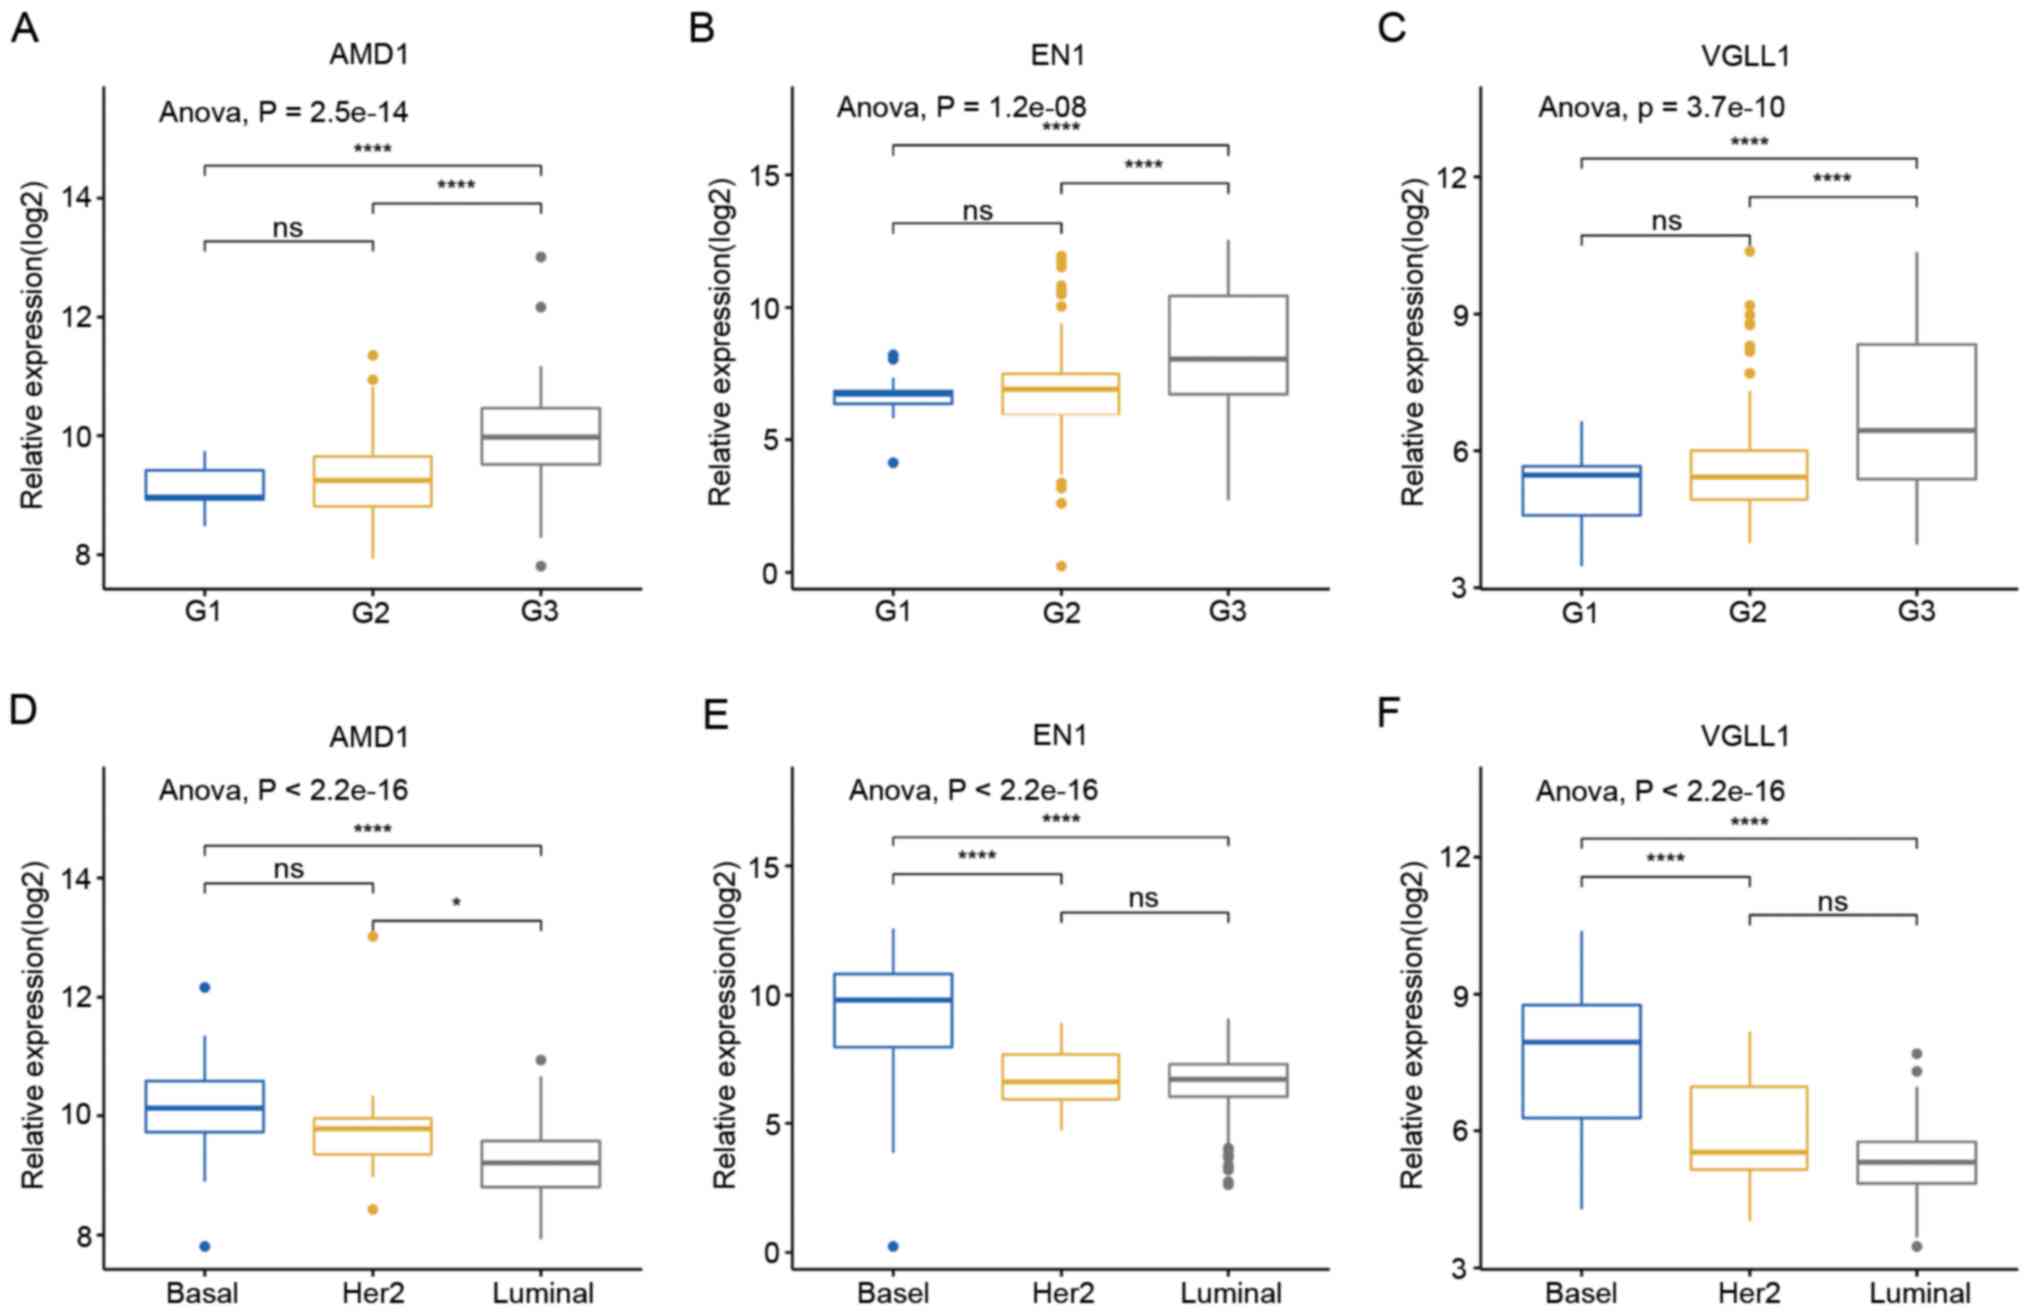
genes. Upon WGCNA of the dataset GSE76275, the red module was
determined to be highly associated with tumor grade. Subsequently,
three validation datasets were used to determine the relationship
between tumor grade and the expression levels of AMD1, EN1 and
VGLL1. The results revealed that higher hub gene expression levels
were associated with advanced tumor grade in dataset GSE25055
(Fig. 5A-C). From dataset GSE25055,
the expression levels of these genes were also determined to be
increased in basal breast tumors compared to luminal and
HER2-enriched breast tumors (Fig.
5D-F). However, with regard to tumor size, lymph node status
and tumor stage, no significant association was observed between
these clinicopathological parameters and the expression levels of
the hub genes (Fig. S1). In
datasets GSE25065 and GSE42568, hub gene upregulation also
corresponded with advanced tumor grade and a more malignant cancer
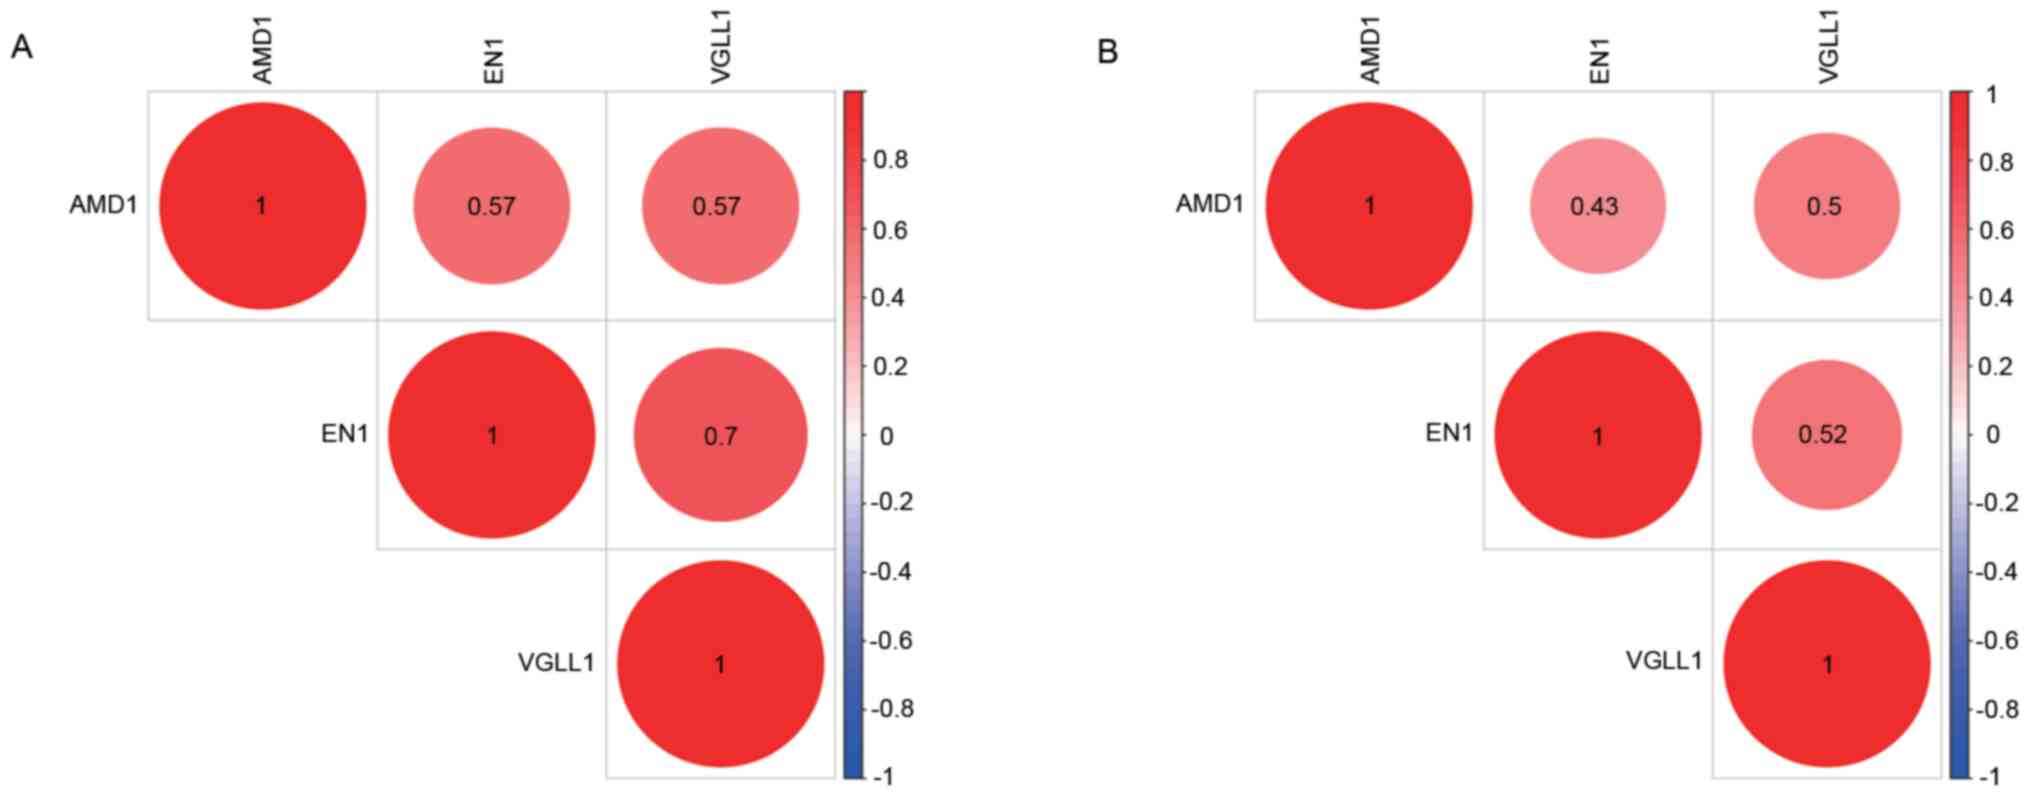
subtype (Figs. S2 and S3). IHC data from the HPA online database
also demonstrated that the protein levels of AMD1 and EN1 were
higher in tumor tissues than in normal tissues (Fig. 6A-F) and that the expression of each
individual protein was strongly correlated with that of the other
two (in both the GSE76275 and GSE25055 datasets) (Fig. 7).
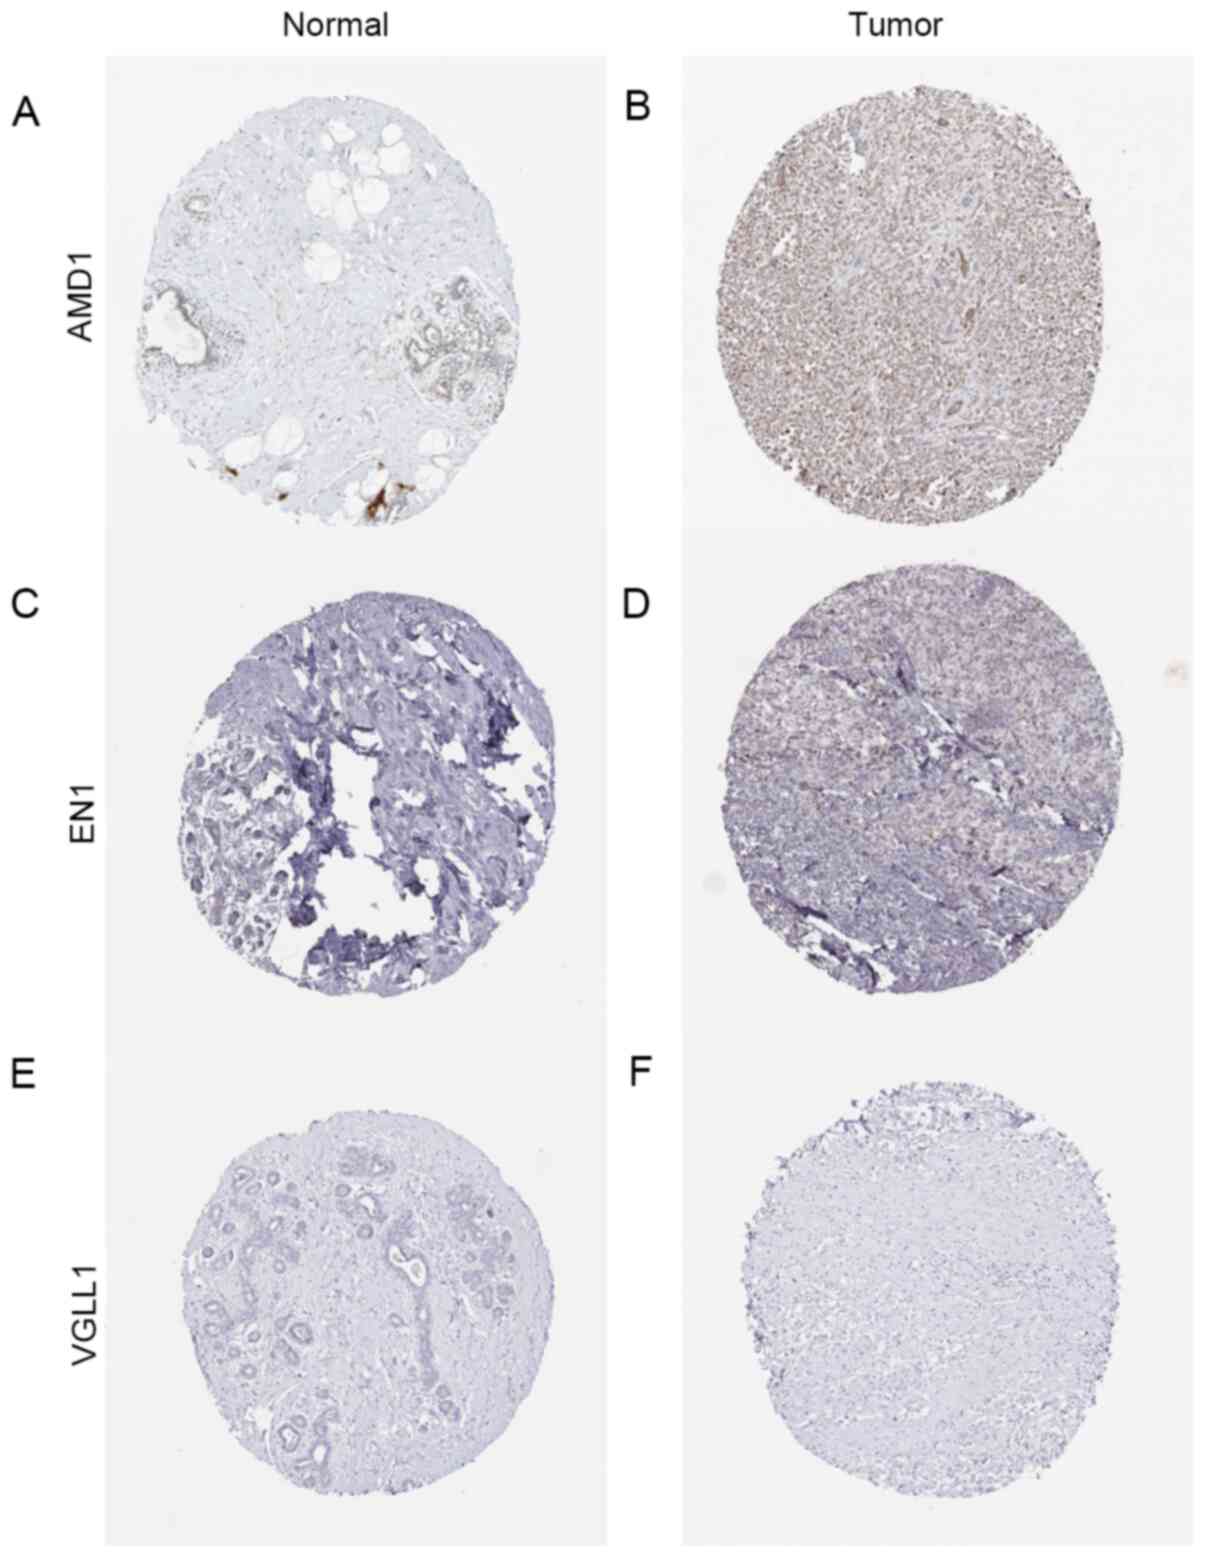 | Figure 6Immunohistochemical staining of the
three hub genes from the Human Protein Atlas. (A) Protein levels of
AMD1 in normal tissue (staining, low; intensity, weak; quantity,
75-25%). (B) Protein levels of AMD1 in tumor tissue (staining,
medium; intensity, moderate; quantity, >75%). (C) Protein levels
of EN1 in normal tissue (staining, not detected; intensity,
negative; quantity, none). (D) Protein levels of EN1 in tumor
tissue (staining, low; intensity, weak; quantity, >75%). (E)
Protein levels of VGLL1 in normal tissue (staining, not detected;
intensity, negative; quantity, none). (F) Protein levels of VGLL1
in tumor tissue (staining, not detected; intensity, negative;
quantity, none). AMD1, S-adenosylmethionine decarboxylase
proenzyme; EN1, homeobox protein engrailed-1; VGLL1, vestigial-like
protein 1. |
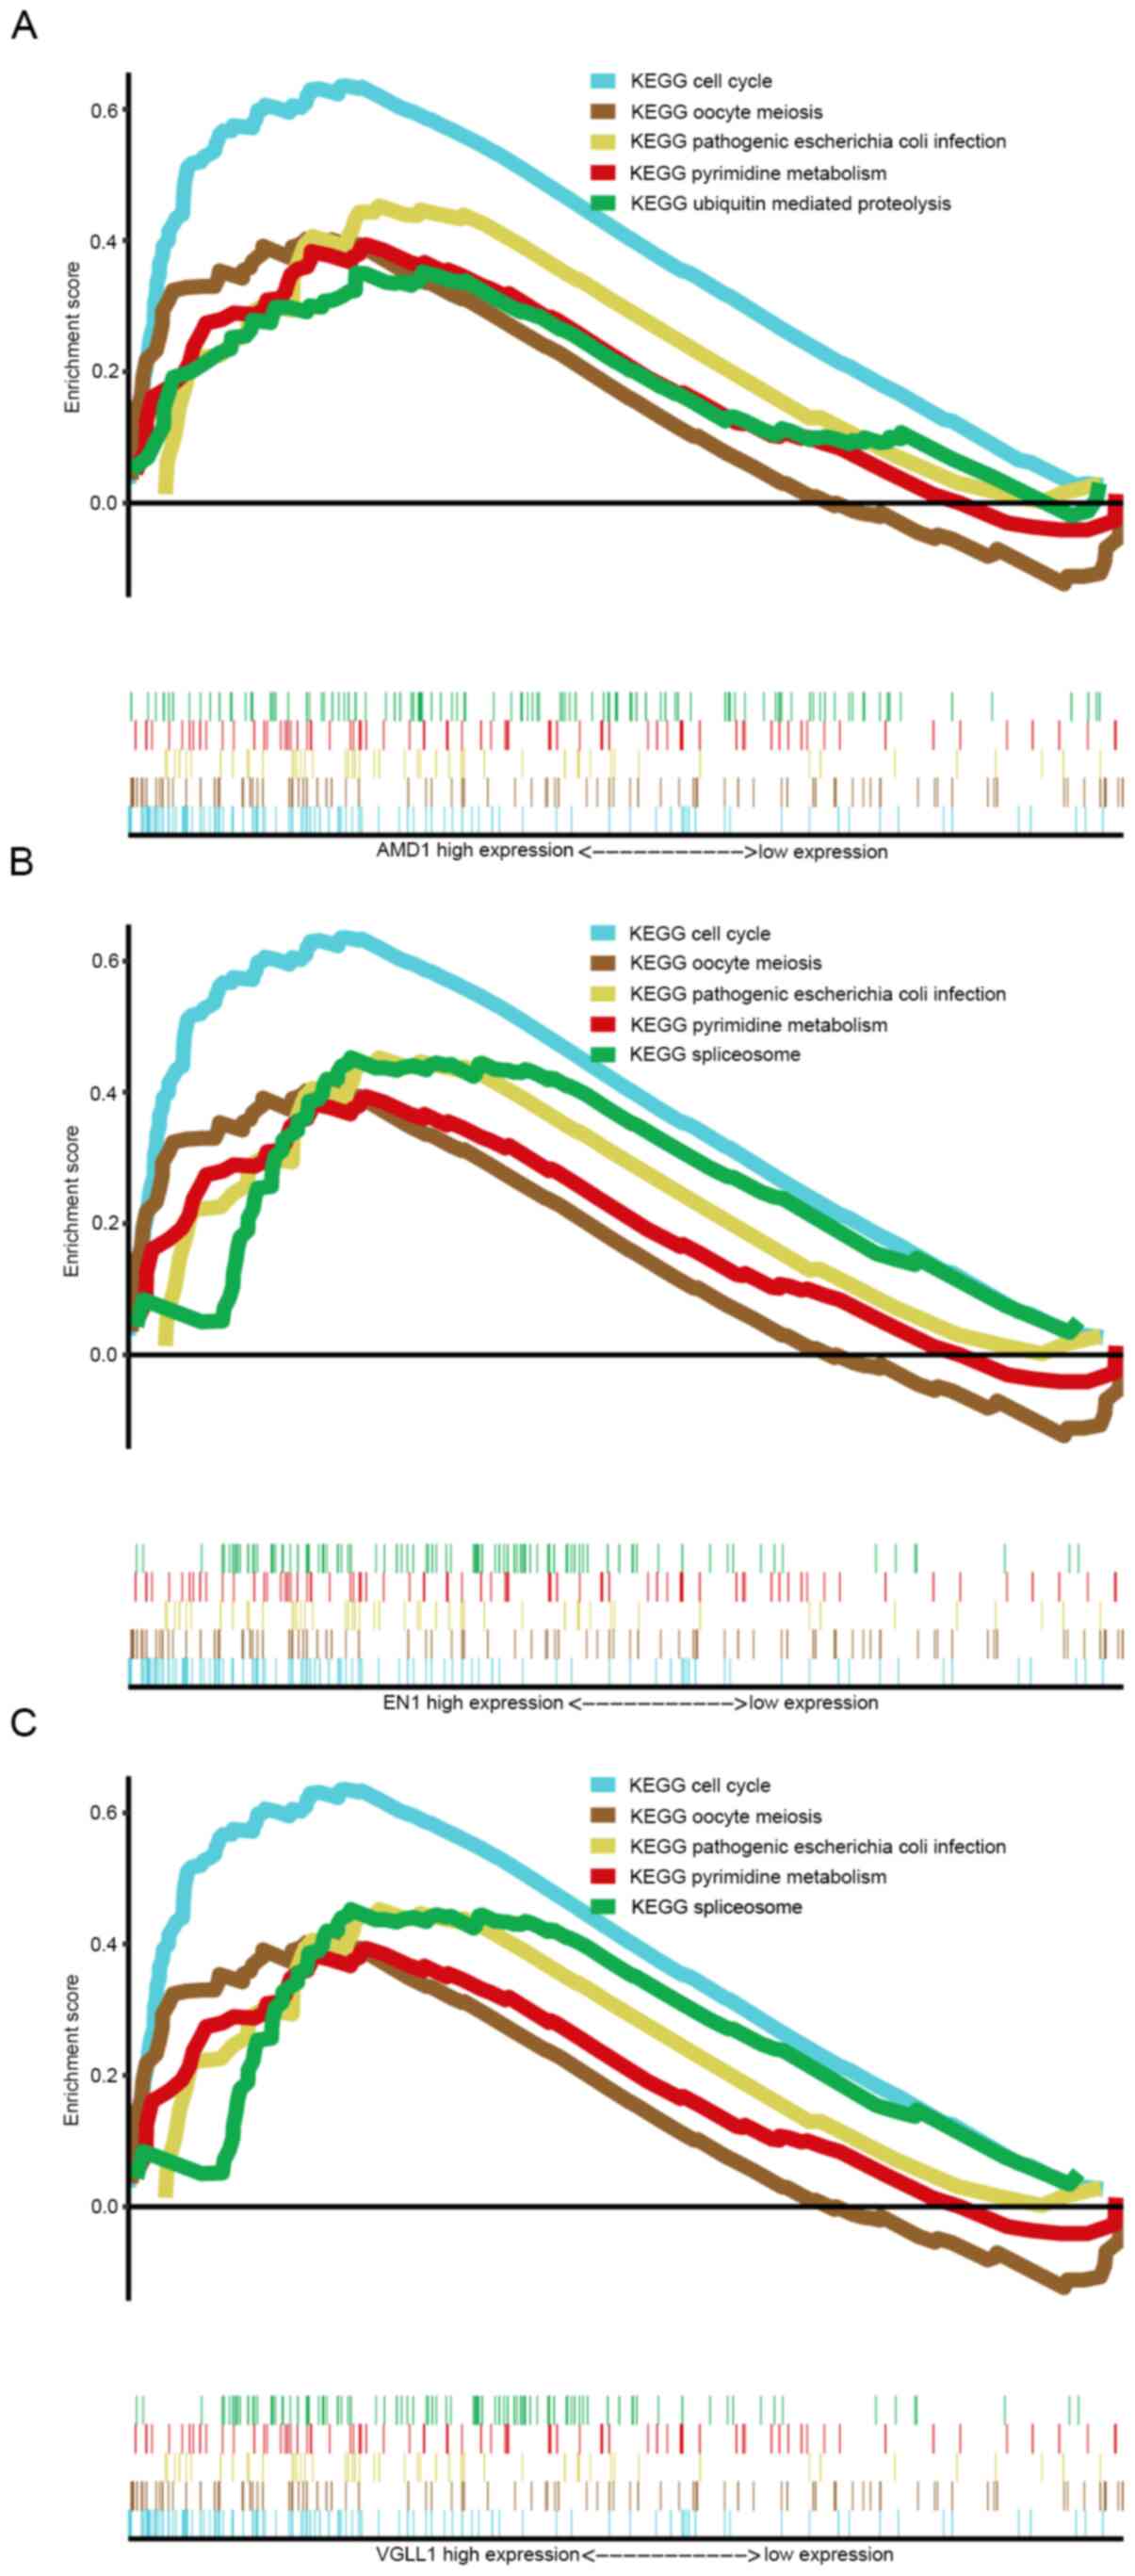
GSEA
To investigate potential signaling pathways
associated with the three hub genes, GSEA was used to identify
Kyoto Encyclopedia of Genes and Genomes (KEGG) pathways enriched in
breast cancer samples with high AMD1, EN1 and VGLL1 expression.
Based on the cut-off criteria, the top 5 KEGG pathways enriched in
the samples with high AMD1, EN1 and VGLL1 expression are displayed
in Fig. 8. These hub genes were
commonly enriched in ‘cell cycle’, ‘oocyte meiosis’, ‘pathogenic
Escherichia coli infection’ and ‘pyrimidine metabolism’.
AMD1 knockdown inhibits proliferation
and metastatic capacity, while promoting apoptosis in breast cancer
cells
A series of additional experiments were performed to
further investigate the expression levels and functions of AMD1 in
breast cancer. Based on the IHC results, AMD1 was indicated to be
upregulated in breast cancer tissues (Fig. 9A), which was also consistent with
the results from the HPA. Compared with that in MCF-10A cells, AMD1
expression was significantly upregulated in all breast cancer cell
lines, but most notably in MDA-MB-231 cells (Fig. 9B). Therefore, the MDA-MB-231 cell
line was selected for further analyses. The results of the CCK-8
assay indicated that AMD1-knockdown significantly inhibited the
proliferation of MDA-MB-231 cells (Fig.
9C). The number of migratory and invasive MDA-MB-231 cells
transfected with si-AMD1 was also significantly reduced compared
with those of the NC-transfected group (Fig. 9D and E). Furthermore, flow cytometric analysis
demonstrated that the apoptotic rate of MDA-MB-231 cells was
significantly increased in the si-AMD1 group as compared with that
in the si-NC group (Fig. 9F).
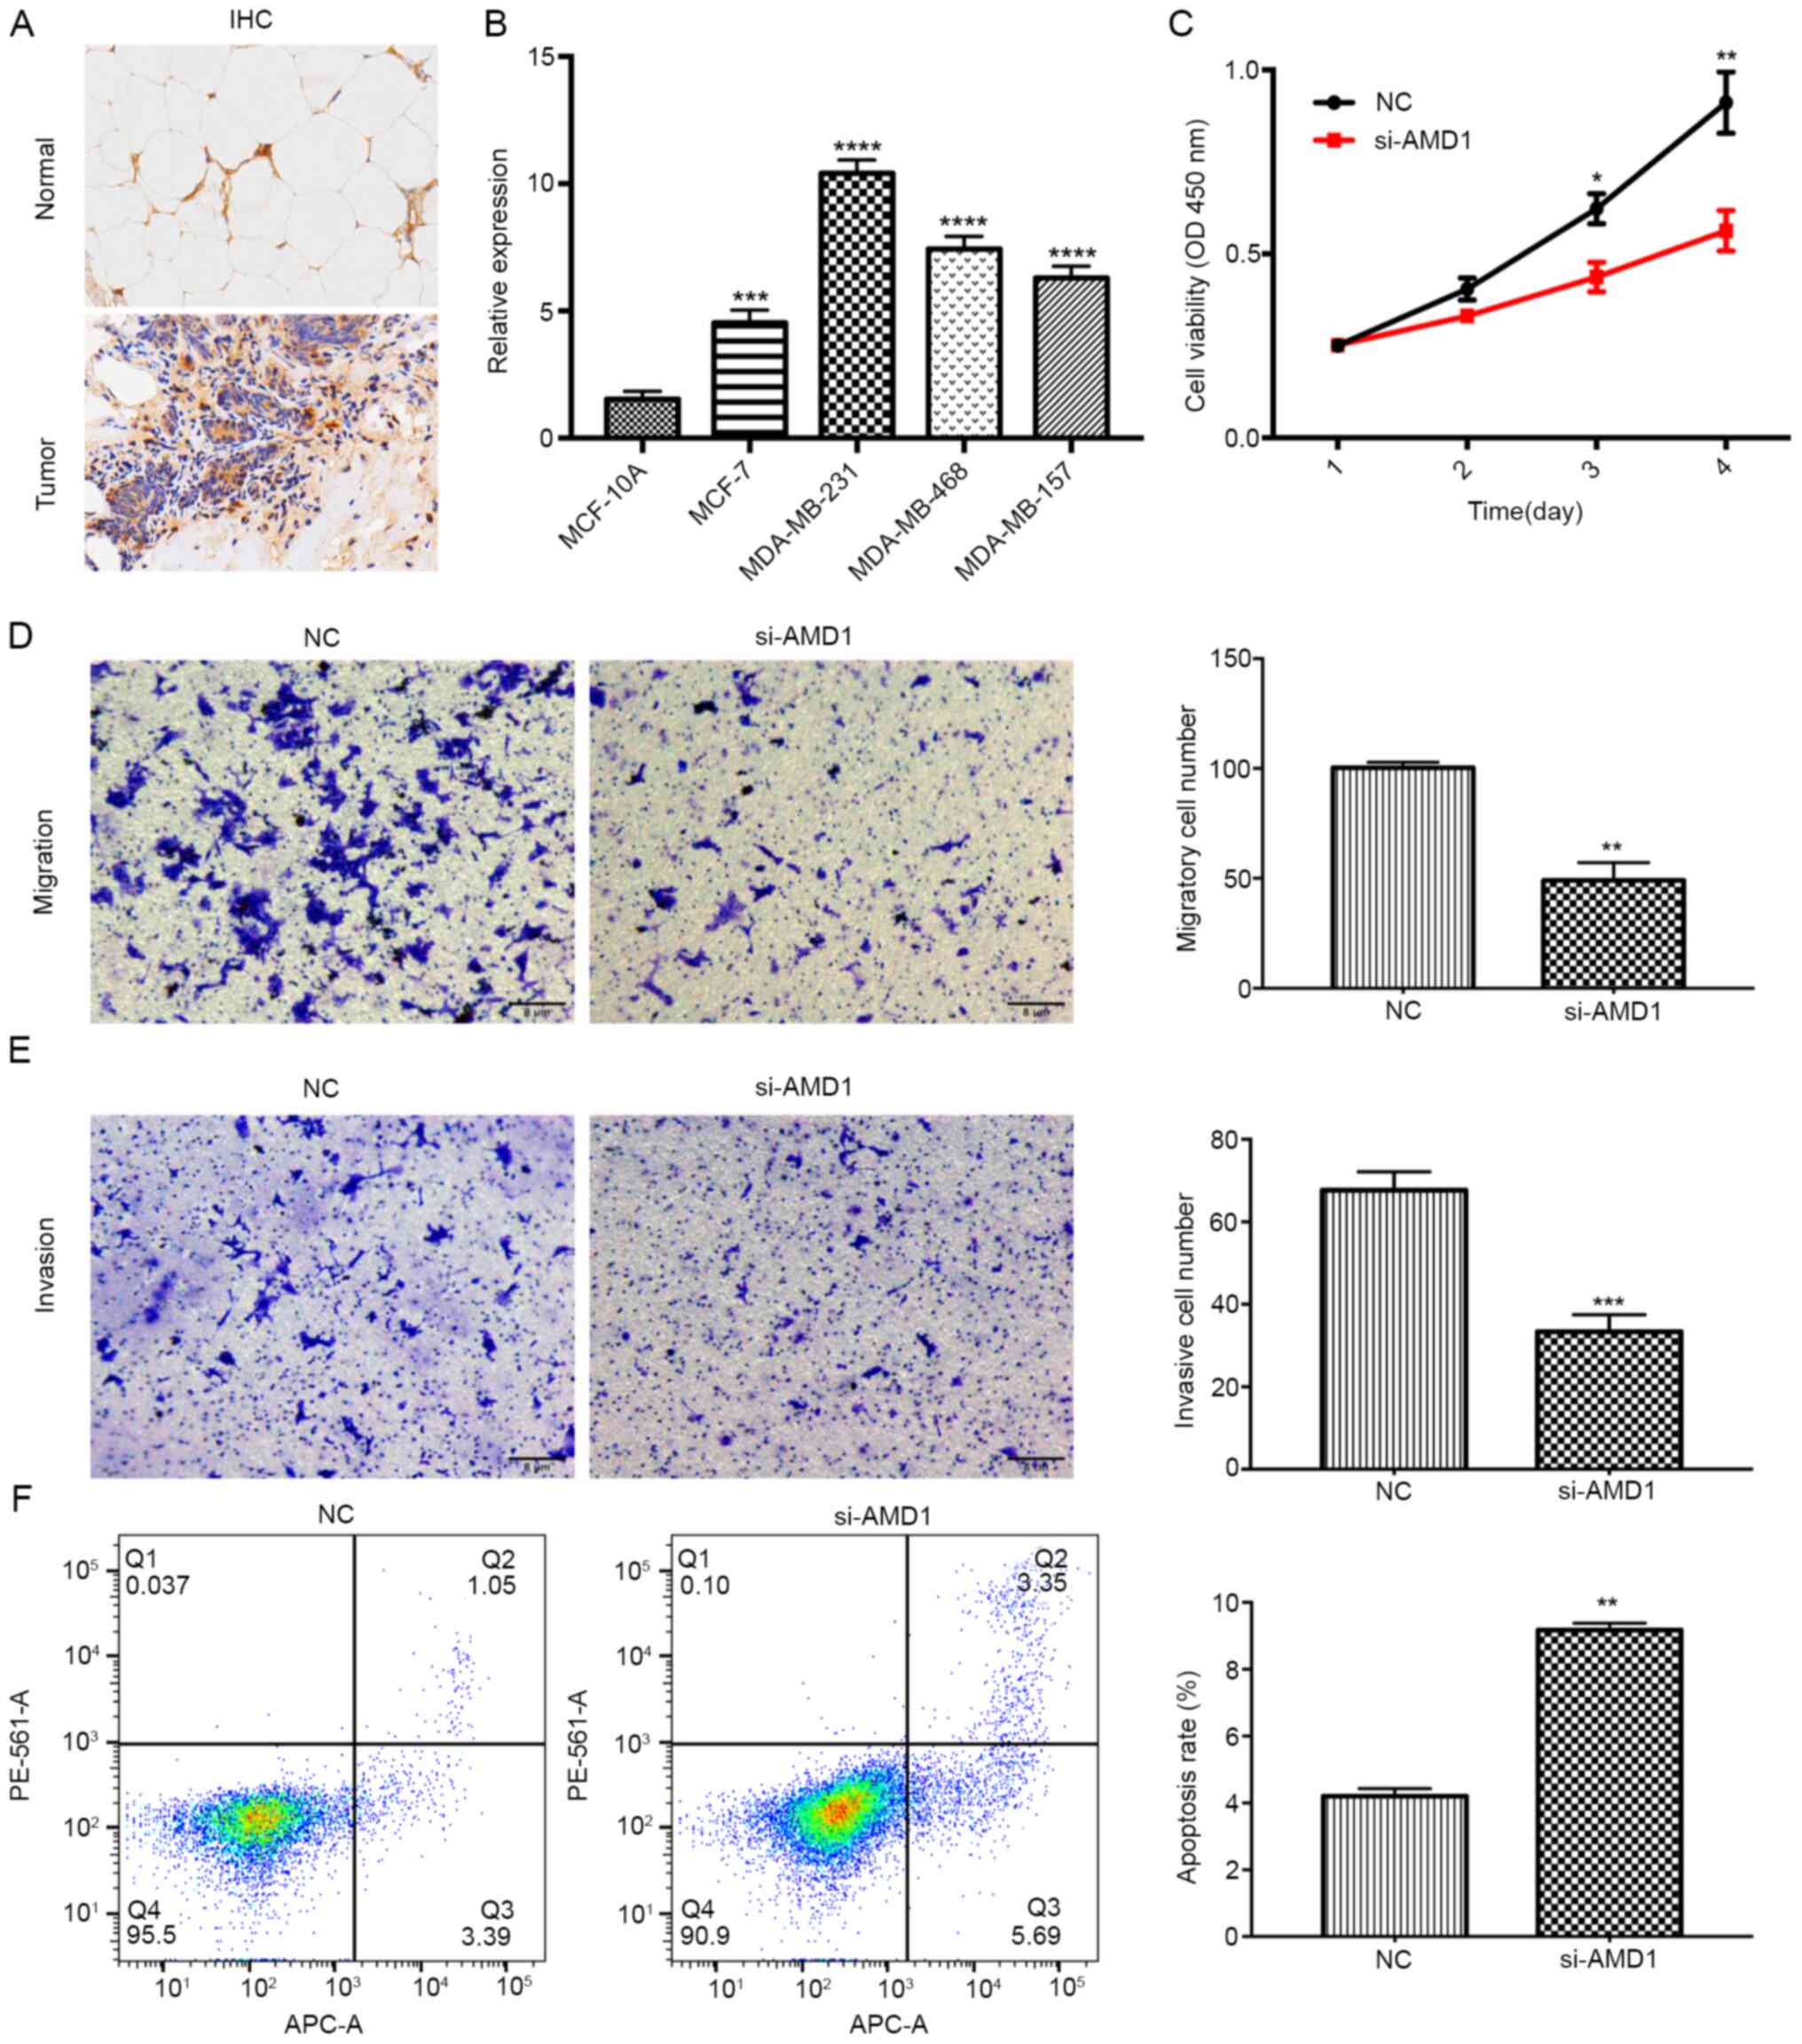 | Figure 9AMD1 knockdown inhibits proliferation
and metastasis and promotes apoptosis in breast cancer cells. (A)
IHC analysis of AMD1 in breast cancer and normal tissues
(magnification, x200). (B) Reverse transcription-quantitative PCR
analysis of AMD1 expression in four breast cancer cell lines
(MCF-7, MDA-MB-231, MDA-MB-468 and MDA-MB-157) and a human mammary
epithelial cell line (MCF-10A). (C) A Cell Counting Kit-8 assay was
used to determine the viability of MDA-MB-231 cells following
transfection. (D and E) Transwell assays were used to assess the
(D) migration and (E) invasion capacities of MDA-MB-231 cells
following transfection (magnification, x100). (F) Apoptosis
analysis was performed by flow cytometry following transfection.
All data are presented as the mean ± standard deviation of three
independent experiments. *P<0.05,
**P<0.01, ***P<0.001 and
****P<0.0001 vs. NC/normal. NC, negative control;
si-AMD1, small interfering RNA targeting S-adenosylmethionine
decarboxylase proenzyme; OD450, optical density at 450 nm; IHC,
immunohistochemistry; Q, quadrant. |
Discussion
In the present study, the top 25% most variable
genes in the GSE76275 dataset were used for co-expression analysis,
from which 12 modules were identified. Among these modules, the red
module was highly correlated with tumor grade. Using survival
analysis, AMD1, EN1 and VGLL1 were subsequently identified as hub
genes within the red module and their upregulation was associated
with a poorer prognosis in patients with breast cancer in both the
validation dataset GSE25055 and Kaplan-Meier plotter. The
expression levels of hub genes were further validated and were
indicated to be highly expressed in samples with advanced tumor
grade and basal-like breast cancer. IHC staining demonstrated that
the protein levels of AMD1 and EN1 were higher in breast cancer
tissues than in normal tissues. In addition, the expression levels
of these genes were strongly correlated with each other. According
to the GSEA, the hub genes were confirmed to be commonly enriched
in ‘cell cycle’, ‘oocyte meiosis’, ‘pathogenic Escherichia
coli infection’ and ‘pyrimidine metabolism’. Finally, in
vitro experiments were used to validate the expression and
function of AMD1. As relevant experimental studies of the effect of
EN1 and VGLL1 on breast cancer progression have previously been
published (17,18), in vitro experimentation was
not performed for these genes. The present results suggested that
AMD1 is upregulated in breast cancer tissues and cells, and that
AMD1 knockdown decreased the proliferation, invasion and migration
abilities, whilst increasing apoptosis in breast cancer cells.
AMD1 encodes an important enzyme involved in
polyamine biosynthesis, in which various aliphatic amine-associated
polyamines are essential for promoting cellular proliferation and
tumorigenesis. AMD1 has been demonstrated to promote epidermal
wound healing by regulating cellular migration (19), and has been reported to have a
significant role in the pathogenesis of multiple tumor types, such
as prostate (20,21), non-small cell lung (22) and gastric cancer (23). A study revealed that mammalian
target of rapamycin complex 1 regulates AMD1 to sustain polyamine
metabolism in prostate cancer (20). AMD1 was also indicated to be
upregulated in gastric cancer samples and patients with high AMD1
expression levels exhibited poorer OS rates; furthermore,
inhibiting AMD1 suppressed cellular proliferation and migration
in vitro, as well as tumor growth in vivo (23). The results of the present study
provided results on the carcinogenic effects of AMD1 in breast
cancer, which are consistent with its effect on the progression of
gastric cancer.
The EN1 gene encodes a homeodomain-containing
protein that regulates pattern formation during central nervous
system development. EN1 expression was reported to be significantly
higher in TNBC than in other breast cancer subtypes (17). Studies have indicated that
upregulation of EN1 is correlated with significantly shorter OS
times and increased risk of brain metastases in patients with TNBC
(24), and that EN1 protein
expression is increased in adenoid cystic carcinoma, with the
higher expression of EN1 being associated with a lower survival
rate (25). EN1 was also
specifically expressed in normal eccrine glands and focally
expressed in skin tumors and sweat gland neoplasms (26). The results of the present study are
consistent with those of previous studies on the carcinogenicity of
EN1.
The VGLL1 gene encodes a transcriptional
co-activator involved in regulating the Hippo pathway in
Drosophila (27). A study
revealed that VGLL1 is predominantly expressed in BRCA1-associated
TNBC and serves an oncogenic role in breast cancer (18). VGLL1 is also reportedly involved in
human papillomavirus (HPV) gene expression via transcriptional
enhancer factor 1, and thus, is crucial to the growth of
HPV-associated malignancies such as cervical cancer (28). In gastric cancer, VGLL1 promoted
cancer cell proliferation and metastasis, which was regulated by
PI3K/AKT/β-catenin signaling (29).
Furthermore, VGLL1 has been indicated to possess oncogenic
functions in pediatric neuroepithelial neoplasms (30).
In conclusion, the present study aimed to identify
hub genes involved in the pathogenesis of breast cancer using
WGCNA. The results indicated that the upregulation of AMD1, EN1 and
VGLL1 are correlated, and potentially detrimentally associated,
with progression and prognosis in breast cancer. Therefore,
inhibiting the expression of AMD1, EN1 and VGLL1 may be a potential
therapeutic strategy for breast cancer.
Supplementary Material
Associations between the expression
levels of hub genes and clinicopathological parameters. Association
between (A) AMD1, (B) EN1 and (C) VGLL1 expression and tumor size.
Association between (D) AMD1, (E) EN1 and (F) VGLL1 expression and
lymph node status. Association between (G) AMD1, (H) EN1 and (I)
VGLL1 expression and tumor stage. AMD1, S-adenosylmethionine
decarboxylase proenzyme; EN1, homeobox protein engrailed-1; VGLL1,
vestigial-like protein 1.
Associations between the expression
levels of hub genes and clinicopathological parameters in dataset
GSE25065. Association between (A) AMD1, (B) EN1 and (C) VGLL1
expression and tumor grade. Association between (D) AMD1, (E) EN1
and (F) VGLL1 expression and tumor subtype. Luminal means Lumina A
and B, normal means normal-like breast cancer. Association between
(G) AMD1, (H) EN1 and (I) VGLL1 expression and tumor size.
Association between (J) AMD1, (K) EN1 and (L) VGLL1 expression and
lymph node status. Association between (M) AMD1, (N) EN1 and (O)
VGLL1 expression and tumor stage. *P<0.05,
**P<0.01, ***P<0.001 and
****P<0.0001. ns, no significance; AMD1,
S-adenosylmethionine decarboxylase proenzyme; EN1, homeobox protein
engrailed-1; VGLL1, vestigial-like protein 1; Her2, human epidermal
growth factor receptor 2.
Associations between the expression
levels of hub genes and clinicopathological parameters in dataset
GSE42568. Association between (A) AMD1, (B) EN1 and (C) VGLL1
expression and tumor grade. Association between (D) AMD1, (E) EN1
and (F) VGLL1 expression and estrogen receptor status. Association
between (G) AMD1, (H) EN1 and (I) VGLL1 expression and tumor size.
Association between (J) AMD1, (K) EN1 and (L) VGLL1 expression and
lymph node status. **P<0.01, ***P<0.001
and ****P<0.0001. ns, no significance; AMD1,
S-adenosylmethionine decarboxylase proenzyme; EN1, homeobox protein
engrailed-1; VGLL1, vestigial-like protein 1.
Acknowledgements
Not applicable.
Funding
Funding: The present study was supported by the National Natural
Science Foundation of China (grant nos. 81770283 and 82070302) and
the Clinical Medical Research Center of Peritoneal Cancer of Wuhan
(grant no. 2015060911020462). The funding agencies did not
participate in the design of the study, the collection, analysis
and interpretation of data or manuscript writing.
Availability of data and materials
The datasets used and/or analyzed during the current
study are available from the corresponding author on reasonable
request.
Authors' contributions
LY and WX conceived the study. XL, TY and HW
performed data mining, acquisition and analysis. LS collected
tissue samples. MF and YL performed the experiments. YL and XL
drafted the manuscript and confirm the authenticity of all the raw
data. WX and MF revised the manuscript critically for important
intellectual content. All authors read and approved the final
manuscript.
Ethics approval and consent to
participate
Written informed consent was obtained from each
patient prior to surgery and the patient protocols were approved by
the ethics committee of the Zhongnan Hospital of Wuhan University
(approval no. 2015073).
Patient consent for publication
Not applicable.
Competing interests
The authors declare that they have no competing
interests.
References
|
1
|
Bray F, Ferlay J, Soerjomataram I, Siegel
RL, Torre LA and Jemal A: Global cancer statistics 2018: GLOBOCAN
estimates of incidence and mortality worldwide for 36 cancers in
185 countries. CA Cancer J Clin. 68:394–424. 2018.PubMed/NCBI View Article : Google Scholar
|
|
2
|
Marusyk A and Polyak K: Tumor
heterogeneity: Causes and consequences. Biochim Biophys Acta.
1805:105–117. 2010.PubMed/NCBI View Article : Google Scholar
|
|
3
|
Reis-Filho JS and Pusztai L: Gene
expression profiling in breast cancer: Classification,
prognostication, and prediction. Lancet. 378:1812–1823.
2011.PubMed/NCBI View Article : Google Scholar
|
|
4
|
Bahnassy A, Mohanad M, Ismail MF, Shaarawy
S, El-Bastawisy A and Zekri AR: Molecular biomarkers for prediction
of response to treatment and survival in triple negative breast
cancer patients from Egypt. Exp Mol Pathol. 99:303–311.
2015.PubMed/NCBI View Article : Google Scholar
|
|
5
|
Garrido-Castro AC, Lin NU and Polyak K:
Insights into molecular classifications of triple-negative breast
cancer: Improving patient selection for treatment. Cancer Discov.
9:176–198. 2019.PubMed/NCBI View Article : Google Scholar
|
|
6
|
Abramson VG, Lehmann BD, Ballinger TJ and
Pietenpol JA: Subtyping of triple-negative breast cancer:
Implications for therapy. Cancer. 121:8–16. 2015.PubMed/NCBI View Article : Google Scholar
|
|
7
|
Jhan JR and Andrechek ER: Triple-negative
breast cancer and the potential for targeted therapy.
Pharmacogenomics. 18:1595–1609. 2017.PubMed/NCBI View Article : Google Scholar
|
|
8
|
Damaskos C, Garmpi A, Nikolettos K,
Vavourakis M, Diamantis E, Patsouras A, Farmaki P, Nonni A,
Dimitroulis D, Mantas D, et al: Triple-negative breast cancer: The
progress of targeted therapies and future tendencies. Anticancer
Res. 39:5285–5296. 2019.PubMed/NCBI View Article : Google Scholar
|
|
9
|
Langfelder P and Horvath S: WGCNA: An R
package for weighted correlation network analysis. BMC
Bioinformatics. 9(559)2008.PubMed/NCBI View Article : Google Scholar
|
|
10
|
Liu H, Sun Y, Tian H, Xiao X, Zhang J,
Wang Y and Yu F: Characterization of long non-coding RNA and
messenger RNA profiles in laryngeal cancer by weighted gene
co-expression network analysis. Aging (Albany NY). 11:10074–10099.
2019.PubMed/NCBI View Article : Google Scholar
|
|
11
|
Yang J, Li C, Zhou J, Liu X and Wang S:
Identification of prognostic genes in leiomyosarcoma by gene
co-expression network analysis. Front Genet.
10(1408)2019.PubMed/NCBI View Article : Google Scholar
|
|
12
|
Wang WJ, Guo CA, Li R, Xu ZP, Yu JP, Ye Y,
Zhao J, Wang J, Wang WA, Zhang A, et al: Long non-coding RNA CASC19
is associated with the progression and prognosis of advanced
gastric cancer. Aging (Albany NY). 11:5829–5847. 2019.PubMed/NCBI View Article : Google Scholar
|
|
13
|
Burstein MD, Tsimelzon A, Poage GM,
Covington KR, Contreras A, Fuqua SA, Savage MI, Osborne CK,
Hilsenbeck SG, Chang JC, et al: Comprehensive genomic analysis
identifies novel subtypes and targets of triple-negative breast
cancer. Clin Cancer Res. 21:1688–1698. 2015.PubMed/NCBI View Article : Google Scholar
|
|
14
|
Clarke C, Madden SF, Doolan P, Aherne ST,
Joyce H, O'Driscoll L, Gallagher WM, Hennessy BT, Moriarty M, Crown
J, et al: Correlating transcriptional networks to breast cancer
survival: A large-scale coexpression analysis. Carcinogenesis.
34:2300–2308. 2013.PubMed/NCBI View Article : Google Scholar
|
|
15
|
Hatzis C, Pusztai L, Valero V, Booser DJ,
Esserman L, Lluch A, Vidaurre T, Holmes F, Souchon E, Wang H, et
al: A genomic predictor of response and survival following
taxane-anthracycline chemotherapy for invasive breast cancer. JAMA.
305:1873–1881. 2011.PubMed/NCBI View Article : Google Scholar
|
|
16
|
Livak KJ and Schmittgen TD: Analysis of
relative gene expression data using real-time quantitative PCR and
the 2(-Delta Delta C(T)) method. Methods. 25:402–408.
2001.PubMed/NCBI View Article : Google Scholar
|
|
17
|
Kim YJ, Sung M, Oh E, Vrancken MV, Song
JY, Jung K and Choi YL: Engrailed 1 overexpression as a potential
prognostic marker in quintuple-negative breast cancer. Cancer Biol
Ther. 19:335–345. 2018.PubMed/NCBI View Article : Google Scholar
|
|
18
|
Castilla M, López-García MA, Atienza MR,
Rosa-Rosa JM, Díaz-Martín J, Pecero ML, Vieites B, Romero-Pérez L,
Benítez J, Calcabrini A and Palacios J: VGLL1 expression is
associated with a triple-negative basal-like phenotype in breast
cancer. Endocr Relat Cancer. 21:587–599. 2014.PubMed/NCBI View Article : Google Scholar
|
|
19
|
Lim HK, Rahim AB, Leo VI, Das S, Lim TC,
Uemura T, Igarashi K, Common J and Vardy LA: Polyamine regulator
AMD1 promotes cell migration in epidermal wound healing. J Invest
Dermatol. 138:2653–2665. 2018.PubMed/NCBI View Article : Google Scholar
|
|
20
|
Zabala-Letona A, Arruabarrena-Aristorena
A, Martín-Martín N, Fernandez-Ruiz S, Sutherland JD, Clasquin M,
Tomas-Cortazar J, Jimenez J, Torres I, Quang P, et al:
mTORC1-dependent AMD1 regulation sustains polyamine metabolism in
prostate cancer. Nature. 547:109–113. 2017.PubMed/NCBI View Article : Google Scholar
|
|
21
|
Stone L: Prostate cancer: Mechanisms of
cancer metabolism: mTORC1 mediates AMD1. Nat Rev Urol.
14(454)2017.PubMed/NCBI View Article : Google Scholar
|
|
22
|
Chen K, Liu H, Liu Z, Luo S, Patz EF Jr,
Moorman PG, Su L, Shen S, Christiani DC and Wei Q: Genetic variants
in RUNX3, AMD1 and MSRA in the methionine metabolic pathway and
survival in nonsmall cell lung cancer patients. Int J Cancer.
145:621–631. 2019.PubMed/NCBI View Article : Google Scholar
|
|
23
|
Xu L, You X, Cao Q, Huang M, Hong LL, Chen
XL, Lei L, Ling ZQ and Chen Y: Polyamine synthesis enzyme AMD1 is
closely associated with tumorigenesis and prognosis of human
gastric cancers. Carcinogenesis. 41:214–222. 2020.PubMed/NCBI View Article : Google Scholar
|
|
24
|
Peluffo G, Subedee A, Harper NW, Kingston
N, Jovanović B, Flores F, Stevens LE, Beca F, Trinh A, Chilamakuri
CS, et al: EN1 is a transcriptional dependency in triple-negative
breast cancer associated with brain metastasis. Cancer Res.
79:4173–4183. 2019.PubMed/NCBI View Article : Google Scholar
|
|
25
|
Bell D, Bell A, Roberts D, Weber RS and
El-Naggar AK: Developmental transcription factor EN1-a novel
biomarker in human salivary gland adenoid cystic carcinoma. Cancer.
118:1288–1292. 2012.PubMed/NCBI View Article : Google Scholar
|
|
26
|
Miura K, Akashi T, Ando N, Ayabe S,
Kayamori K, Namiki T and Eishi Y: Homeobox transcriptional factor
engrailed homeobox 1 is expressed specifically in normal and
neoplastic sweat gland cells. Histopathology. 72:1199–1208.
2018.PubMed/NCBI View Article : Google Scholar
|
|
27
|
Zecca M and Struhl G: A feed-forward
circuit linking wingless, fat-dachsous signaling, and the
warts-hippo pathway to drosophila wing growth. PLoS Biol.
8(e1000386)2010.PubMed/NCBI View Article : Google Scholar
|
|
28
|
Mori S, Takeuchi T, Ishii Y and Kukimoto
I: The transcriptional cofactor VGLL1 drives transcription of human
papillomavirus early genes via TEAD1. J Virol. 94:e01945–e01919.
2020.PubMed/NCBI View Article : Google Scholar
|
|
29
|
Kim BK, Cheong JH, Im JY, Ban HS, Kim SK,
Kang MJ, Lee J, Kim SY, Park KC, Paik S and Won M:
PI3K/AKT/β-catenin signaling regulates vestigial-like 1 which
predicts poor prognosis and enhances malignant phenotype in gastric
cancer. Cancers (Basel). 11(1923)2019.PubMed/NCBI View Article : Google Scholar
|
|
30
|
Kundishora AJ, Reeves BC, Nelson-Williams
C, Hong CS, Gopal PP, Snuderl M, Kahle KT and Erson-Omay EZ: Novel
EWSR1-VGLL1 fusion in a pediatric neuroepithelial neoplasm. Clin
Genet. 97:791–792. 2020.PubMed/NCBI View Article : Google Scholar
|