Introduction
Breast cancer is the most commonly diagnosed
malignant neoplasm and is the second most common cause of
cancer-related death among females worldwide (1). Breast invasive carcinoma (BRCA)
accounts for the largest proportion of breast cancer cases,
exhibits high metastatic capacity and is associated with poor
prognosis (2). Although notable
improvements have been made in its diagnosis and treatment in
recent years, several serious challenges remain, such as high
heterogeneity, dormant micro-metastases and resistance to
chemotherapy, which result in a high rate of morbidity and
mortality (3-6).
Therefore, novel prognostic markers and therapeutic targets for
breast cancer treatment are urgently required. Owing to the
development of sequencing technologies and free access to curated
databases, such as The Cancer Genome Atlas (TCGA), novel biomarkers
for tumor diagnosis, prognosis and therapeutic assessment are more
readily identifiable (7).
Keratin 15 (KRT15), also known as cytokeratin 15, is
located on chromosome 17q21.2 and is a member of the KRT gene
family. KRT15 has previously been reported to be a marker for skin
stem cells in the hair follicle bulge (8) and serves a critical role in epidermal
homeostasis (9). KRT15 has recently
been demonstrated to be closely associated with tumorigenesis.
KRT15 overexpression was observed in squamous-cell carcinoma
samples (10) and is related to a
poor prognosis in colorectal cancer (11). In addition, stem cells with
KRT15-positive surface markers may give rise to certain types of
cancer under certain conditions (12,13).
However, the roles of KRT15 in BRCA have remained largely
elusive.
In the present study, to elucidate the potential
prognostic value of KRT15, RNA-sequencing (RNA-seq) data for BRCA
and clinical patient data were downloaded from TCGA. These data
were used for differential gene expression and functional
enrichment analyses to identify the genes and functional pathways
highly associated with KRT15 expression. Tumor immune infiltration
analysis was then performed to explore the relevance of KRT15
expression regarding immune-cell infiltration. Furthermore, the
association of KRT15 with demographic and clinicopathological
parameters was assessed and survival and clinical subgroup
prognostic analyses were performed to evaluate the prognostic value
of KRT15 in BRCA. Finally, further biological verification was
performed using microarray analysis of BRCA tissues. Through
integrative bioinformatics and statistical analyses, it was
demonstrated that KRT15 may serve as a novel biomarker for
predicting the prognosis of patients with BRCA.
Materials and methods
Data sourcing and preprocessing
RNA-seq datasets from BRCA projects [level 3 HTSeq
fragments per kilobase per million (FPKM)] were downloaded from
TCGA (portal.gdc.cancer.gov) on April 12th,
2020. Samples without corresponding clinical information were
excluded. The format of the RNA-seq data was converted from level 3
HTSeq-FPKM to transcripts per million reads (TPM). Individual
unavailable or unknown clinical information was regarded as missing
values. In addition, processed by the TOIL pipeline (14), TCGA and GTEx RNA-seq data in the TPM
format were collected from the University of California Santa Cruz
XENA browser (xenabrowser.net/datapages) to compare KRT15 expression
between normal tissues and BRCA tissues, as well as to perform a
pan-cancer analysis. Furthermore, receiver operating characteristic
(ROC) curve analysis was performed to evaluate the efficiency of
using KRT15 to distinguish tumor tissues from non-tumor tissues by
using the pROC package (15).
Tumor samples were classified into the
low-expression or high-expression group according to the median
expression levels of KRT15. The clinical features included age, TNM
stage, pathological stage, progesterone receptor (PR)/estrogen
receptor (ER)/human epidermal growth factor receptor 2 (HER2)
status and Prediction Analysis of Microarray 50 (PAM50) subtype. As
the data sources and processes included in the present study did
not involve human participants or animals, no ethical approval or
informed consent was required.
Differentially expressed gene (DEG)
analysis
To determine DEGs, the DESeq2 package (16) was used to compare expression
profiles (HTSeq-counts) between high and low KRT15 expression
groups, as aforementioned. Log2 fold change
(|log2FC|)>1 and an adjusted P-value of <0.05 were
used as the threshold for determining whether a gene was
differentially expressed. The results of the DEG analysis were
represented as a volcano plot and a heat map.
Functional enrichment analysis
In the present study, the R package clusterProfiler
(17) was utilized to perform Gene
Ontology (GO) term and Kyoto Encyclopedia of Genes and Genomes
(KEGG) pathway enrichment analysis of DEGs between high and low
KRT15 gene expression groups. GO terms in the three categories of
biological process (BP), cellular component (CC) and molecular
function (MF) were determined. An adjusted P-value of <0.05 was
regarded as indicative of statistical significance.
Gene set enrichment analysis
(GSEA)
GSEA is a computational method using a gene
expression matrix and different enriched signaling pathways to
predict pathways and/or phenotypes related to genes (18). GSEA was performed using the gseKEGG
function of the R ClusterProfiler package (version 3.6.0) (17). Genome permutations were performed
1,000 times for each analysis. C2: Curated gene sets
(c2.cp.v7.0.symbols.gmt) in MSigDB Collections were selected as the
reference for gene sets. A pathway term with P<0.05 and false
discovery rate (FDR) value <0.25 (or set normalized enrichment
score >1) was considered to exhibit statistically significant
enrichment.
Immune infiltration analysis by
single-sample (ss)GSEA
ssGSEA was used to evaluate 24 types of immune cells
that may infiltrate into the tumor immune microenvironment
(19). ssGSEA scores were
calculated using the GSVA Bioconductor package (20). The correlation between KRT15 and the
relative abundance of 24 types of immune cells was analyzed using
Spearman's rank correlation coefficient analysis. The immune
infiltration scores were compared between the low and high KRT15
expression groups using the Wilcoxon rank-sum test.
Clinical association analysis of KRT15
expression in BRCA
All statistical analyses were performed in R version
3.6.2. The Wilcoxon rank-sum test and Wilcoxon signed-rank test
were used to compare KRT15 expression between unpaired and paired
groups, respectively. The Wilcoxon signed-rank test, Kruskal-Wallis
test, χ2 test and logistic regression analysis were
performed to determine relationships between clinicopathological
features and KRT15 expression. Kaplan-Meier (KM) curves were
generated using the ‘survminer’ R package (CRAN.R-project.org/package=survminer) to evaluate
the prognostic value of various clinical features. Multivariate Cox
regression models were used to compare the effects of KRT15
expression on patient outcomes together with other
clinicopathological features. P<0.05 (two-tailed) was considered
to indicate statistical significance in all tests. The hazard ratio
(HR) with 95% confidence intervals (CI) was estimated to assess
risk factors.
Construction and evaluation of the
nomogram
Multivariate survival analysis was performed using
Cox regression analysis to determine independent prognostic
factors. To demonstrate the survival probability of patients with
BRCA, a nomogram was constructed using the rms R package
(rdrr.io/cran/rms), followed by generating calibration plots to
examine the prediction efficiency of this model. The primary
endpoints were overall survival (OS) and disease-specific survival
(DSS) and P<0.05 was considered to indicate statistical
significance.
Subgroup prognostic analysis
Subgroup analyses were performed to investigate the
associations between different clinicopathological characteristics
and prognosis. Separate Cox proportional hazards models were used
for individual subgroups during subgroup analysis and visualized
using forest plots. KM analysis of different subgroups was
performed using the package ‘survminer’. P<0.05 (two-tailed) was
considered to indicate statistical significance.
Immunohistochemistry (IHC)
BRCA tissue microarrays were purchased from Shanghai
Outdo Biotech. Co., Ltd. The paraffin-embedded tissue chip
contained 45 BRCA tissues and 45 paired paracancerous tissues. For
IHC analysis, paraffin sections were dewaxed and hydrated.
Following 0.01M citric acid repair liquid (pH 6.0) being added to
repair antigen at 100˚C under high pressure, the sections were
washed and submerged in H2O2 (3%) for 30 min
to block endogenous peroxidase, followed by the addition of 10%
goat serum (Wuhan Boster Biological Technology, Ltd.) to block
nonspecific binding for 30 min at room temperature. The primary
antibody, rabbit anti-KRT15 monoclonal antibody (cat. no. ab52816;
1:300 dilution; Abcam) was subsequently added, followed by
incubation at 4˚C overnight. The sections were then warmed to room
temperature, washed three times with TBST and then incubated with
the secondary goat anti-rabbit antibody (cat. no. ab205718;
1:20,000 dilution; Abcam) for 45 min at 37˚C. After three washes
with TBST, the antibodies were visualized with diaminobenzidine and
the sections were examined under a light microscope to observe any
brown stain indicative of positivity. Finally, the sections were
sealed with neutral balsam, dried and analyzed using a light
microscope. KRT15 staining was assessed independently by two
pathologists who were blinded to all clinical information. Staining
intensity and the percentage of stained cells were used as
indicators for semiquantitative evaluation, as described previously
(21). These two scores were
multiplied to obtain an IHC score for each case. A score of <3
was defined as low KRT15 expression and a score ≥3 was defined as
high KRT15 expression.
Results
KRT15 expression is low in patients
with BRCA
In the present study, 1,065 samples were screened
for subsequent analysis, including 111 matched cancer and
paracancerous samples (Table I).
The Wilcoxon rank-sum test was used to assess differential KRT15
expression between tumor samples and normal samples, as well as
between tumor samples and paracancerous samples. As indicated in
Fig. 1A, tumor samples exhibited
lower KRT15 expression compared with normal samples (P<0.001).
Similarly, KRT15 expression in paracancerous samples was higher
than in tumor samples (P<0.001; Fig.
1B). According to the results of the Wilcoxon signed-rank test,
KRT15 was expressed at a lower level in tumor samples compared with
that in the matched paracancerous samples (P<0.001; Fig. S1A). In addition, KRT15 expression
was compared between normal tissues from the GTEx plus TCGA
databases and 33 types of cancer from TCGA using the Wilcoxon
rank-sum test. KRT15 expression levels were significantly lower in
the BRCA tissues compared with those in the normal tissues
(P<0.001; Fig. 1D). Similar
results were obtained from the comparison between paracancerous
samples and BRCA samples in the TCGA pan-cancer cohort. Likewise,
compared with normal tissues, KRT15 expression was significantly
decreased in adrenocortical carcinoma, diffuse Large B-cell
Lymphoma, glioblastoma multiforme, head and neck squamous cell
carcinoma, kidney chromophobe, acute myeloid leukemia, lower grade
glioma, liver hepatocellular carcinoma, prostate adenocarcinoma,
skin cutaneous melanoma and testicular germ cell tumors
(P<0.001; Fig. S1B).
Furthermore, as presented in Fig.
1C, the area under the curve was 0.800 with a CI of
0.749-0.850, indicating that KRT15 was able to efficiently
distinguish BRCA from paracancerous tissues.
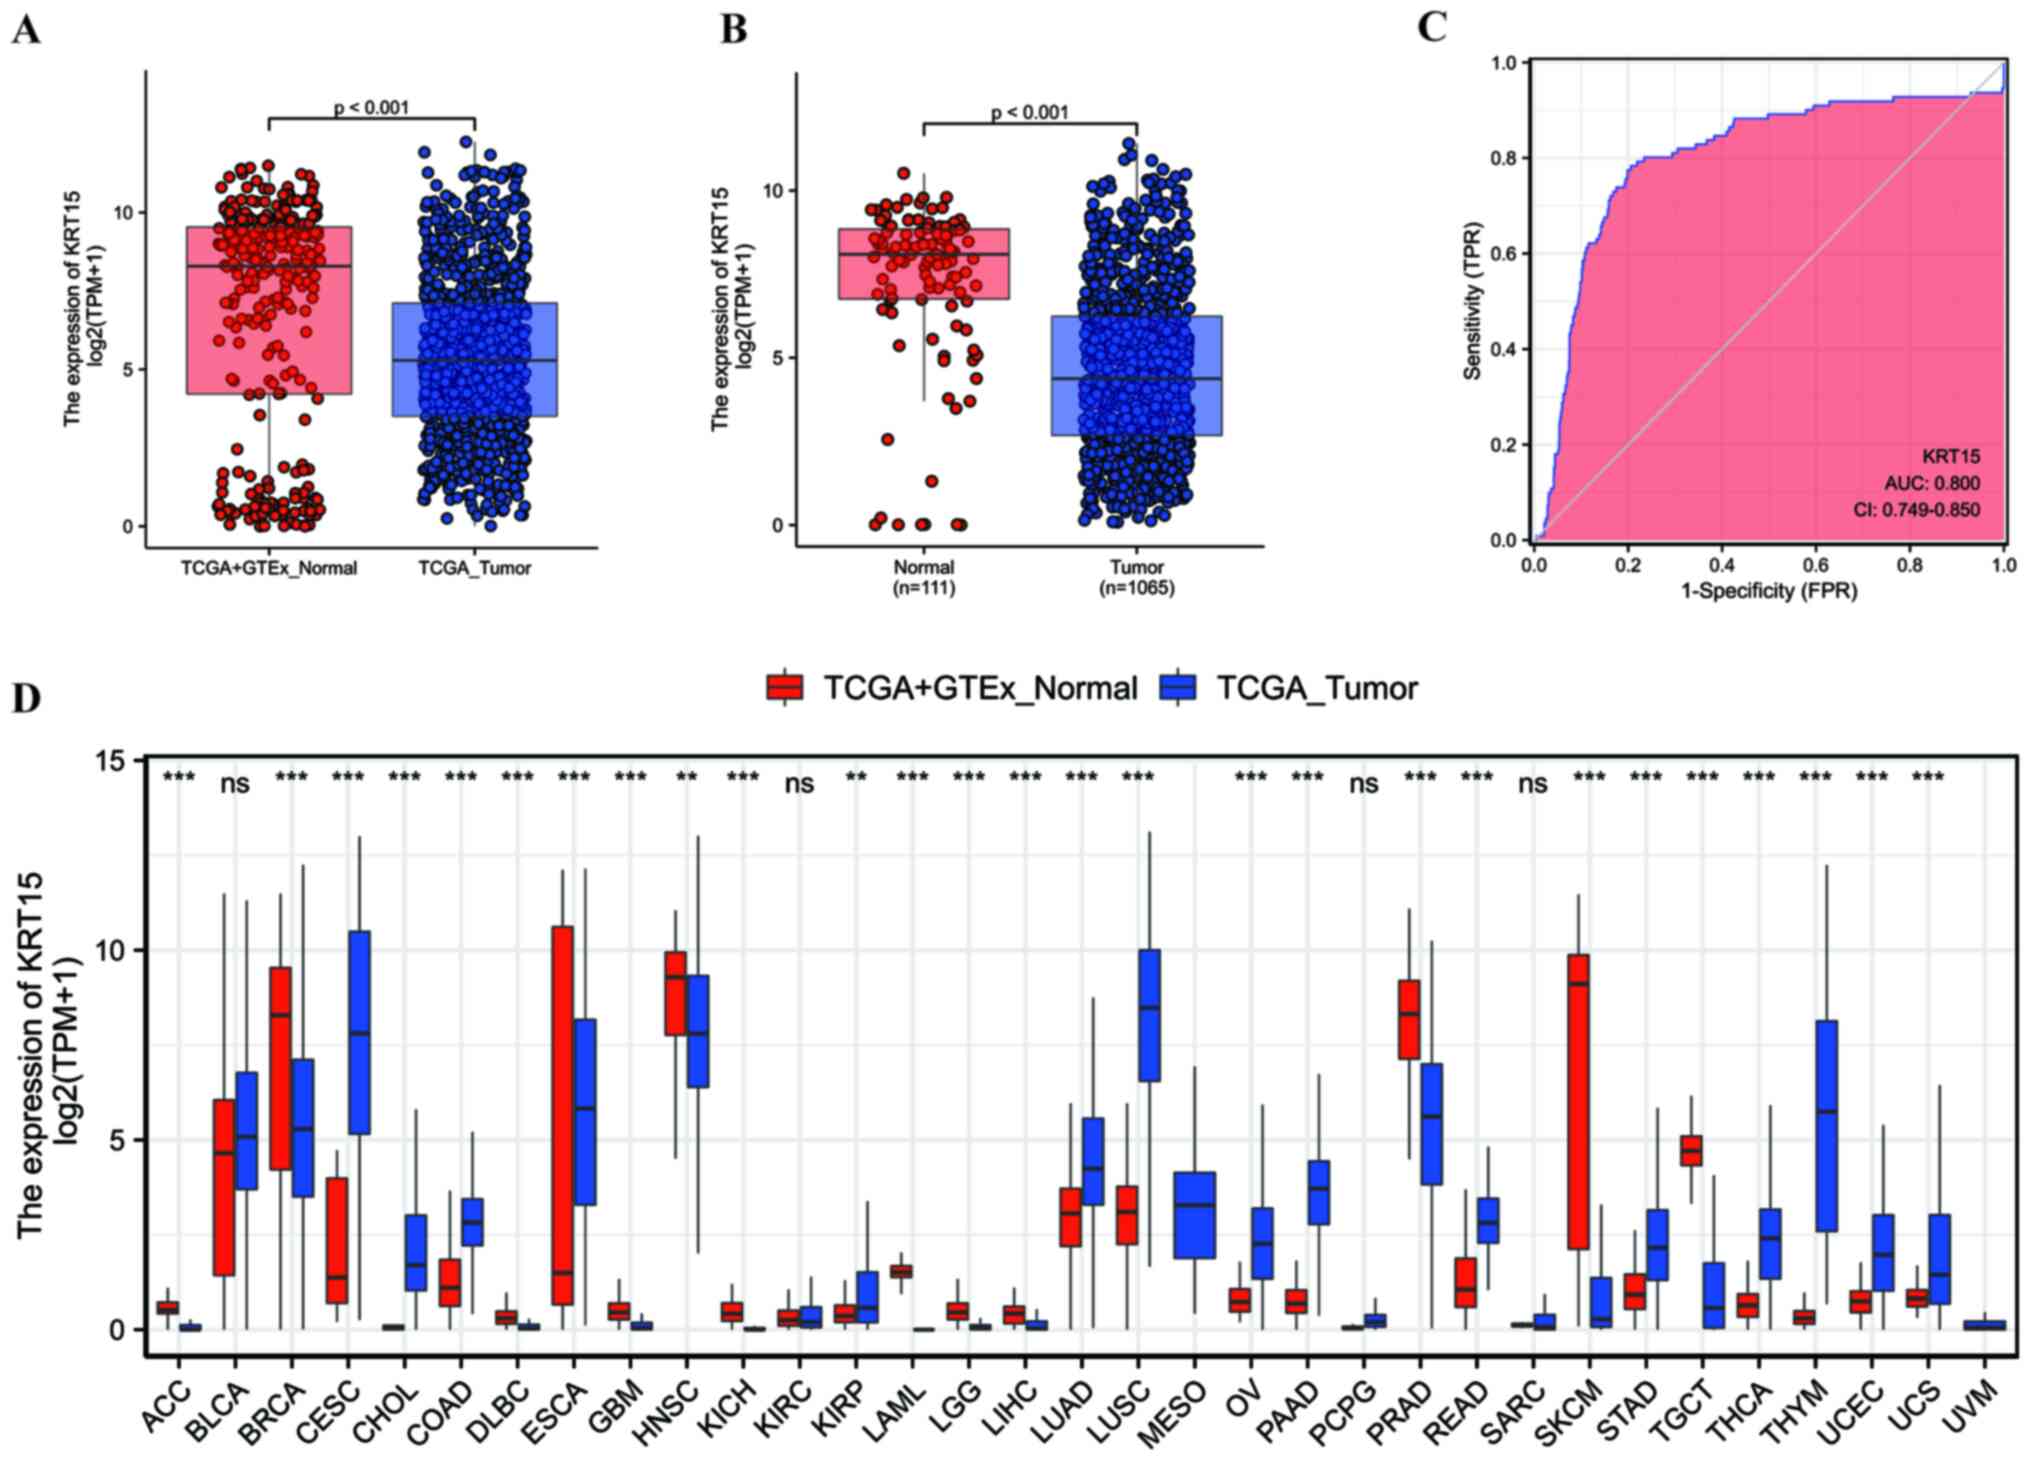 | Figure 1KRT15 expression in normal and BRCA
tissues. (A) Comparison of KRT15 expression [log2(TPM+1)] between
tumor and normal samples and (B) between tumor and paracancerous
samples was analyzed. (C) ROC curve analysis of KRT15 expression.
KRT15 expression exhibited good discriminative efficacy between
tumor and non-tumor samples. (D) Pan-cancer analysis of the
difference in KRT15 expression across 33 types of cancer between
tumor and normal samples. ***P<0.001; ns,
**P≥0.05. The abscissa presents the FPR and the ordinate
the TPR. ACC, adrenocortical carcinoma; BLCA, bladder urothelial
carcinoma; BRCA, breast invasive carcinoma; CESC, cervical squamous
cell carcinoma and endocervical adenocarcinoma; CHOL,
cholangiocarcinoma; COAD, colon adenocarcinoma; DLBC, lymphoid
neoplasm diffuse large B-cell lymphoma; ESCA, esophageal carcinoma;
GBM, glioblastoma multiforme; HNSC, head and neck squamous cell
carcinoma; KICH, kidney chromophobe; KIRC, kidney renal clear cell
carcinoma; KIRP, kidney renal papillary cell carcinoma; LAML, acute
myeloid leukemia; LGG, brain lower grade glioma; LIHC, liver
hepatocellular carcinoma; LUAD, lung adenocarcinoma; LUSC, lung
squamous cell carcinoma; MESO, mesothelioma; OV, ovarian serous
cystadenocarcinoma; PAAD, pancreatic adenocarcinoma; PCPG,
pheochromocytoma and paraganglioma; PRAD, prostate adenocarcinoma;
READ, rectum adenocarcinoma; SARC, sarcoma; SKCM, skin cutaneous
melanoma; STAD, stomach adenocarcinoma; TGCT, testicular germ cell
tumors; THCA, thyroid carcinoma; THYM, thymoma; UCEC, uterine
corpus endometrial carcinoma; UCS, uterine carcinosarcoma; UVM,
uveal melanoma; KRT15, keratin 15; ROC, receiver operating
characteristic; AUC, area under the ROC curve; TCGA, The Cancer
Genome Atlas; TPM, transcripts per million reads; FPR,
false-positive rate; TPR, true-positive rate; GTEx, genotype-tissue
expression. |
 | Table IAssociation between KRT15 expression
and clinicopathological characteristics. |
Table I
Association between KRT15 expression
and clinicopathological characteristics.
| Item | Low expression of
KRT15, n=533 | High expression of
KRT15, n=532 | P-value |
|---|
| T stage | | | 0.096 |
|
T1 | 124 (23.4) | 151 (28.4) | |
|
T2 | 320 (60.3) | 295 (55.6) | |
|
T3 | 65 (12.2) | 72 (13.6) | |
|
T4 | 22 (4.1) | 13 (2.4) | |
| N stage | | | 0.794 |
|
N0 | 248 (47.5) | 259 (49.4) | |
|
N1 | 173 (33.1) | 176 (33.6) | |
|
N2 | 62 (11.9) | 54 (10.3) | |
|
N3 | 39 (7.5) | 35 (6.7) | |
| M stage | | | 0.470 |
|
M0 | 438 (97.3) | 451 (98.3) | |
|
M1 | 12 (2.7) | 8 (1.7) | |
| Pathologic
stage | | | 0.652 |
|
I | 88 (16.9) | 92 (17.6) | |
|
II | 297 (57.1) | 309 (59.2) | |
|
III | 124 (23.8) | 114 (21.8) | |
|
IV | 11 (2.1) | 7 (1.3) | |
| PR status | | | 0.004 |
|
Negative | 145 (28.9) | 193 (37.8) | |
|
Positive | 356 (71.1) | 318 (62.2) | |
| ER status | | | <0.001 |
|
Negative | 80 (15.9) | 157 (30.7) | |
|
Positive | 423 (84.1) | 355 (69.3) | |
| HER2 status | | | 0.005 |
|
Negative | 259 (73.2) | 289 (82.3) | |
|
Positive | 95 (26.8) | 62 (17.7) | |
| PAM50 | | | <0.001 |
|
Basal | 45 (8.4) | 145 (27.3) | |
|
HER2 | 60 (11.3) | 22 (4.1) | |
|
LumA | 261 (49.0) | 290 (54.5) | |
|
LumB | 163 (30.6) | 39 (7.3) | |
|
Normal | 4 (0.8) | 36 (6.8) | |
| Histological
type | | | 0.002 |
|
Infiltrating
ductal carcinoma | 393 (83.3) | 364 (74.7) | |
|
Infiltrating
lobular carcinoma | 79 (16.7) | 123 (25.3) | |
| Ethnicity | | | 0.198 |
|
Asian | 34 (7.3) | 26 (5.1) | |
|
Black or
African American | 78 (16.7) | 101 (19.9) | |
|
White | 356 (76.1) | 381 (75.0) | |
| Anatomic neoplasm
subdivision | | | 0.928 |
|
Left | 278 (52.2) | 275 (51.7) | |
|
Right | 255 (47.8) | 257 (48.3) | |
| TP53 status | | | 0.693 |
|
Mut | 169 (34.3) | 166 (35.8) | |
|
WT | 323 (65.7) | 298 (64.2) | |
| PIK3CA status | | | 0.482 |
|
Mut | 156 (31.7) | 158 (34.1) | |
|
WT | 336 (68.3) | 306 (65.9) | |
| Age, years | 59.00
(48.00,69.00) | 58.00
(49.00,66.00) |
0.377a |
Functional enrichment of KRT15 in
patients with BRCA
To determine whether KRT15 may serve a critical role
in BRCA, differential expression analysis was performed by
comparing gene expression profiles between low and high gene
expression groups. Using the DESeq2 R package (adjusted P<0.05
and |logFC|>1.5), 942 DEGs were identified (231 upregulated and
711 downregulated). The outcome of the differential expression
analysis is presented as a volcano plot (Fig. 2A) and heatmap (Fig. 2B).
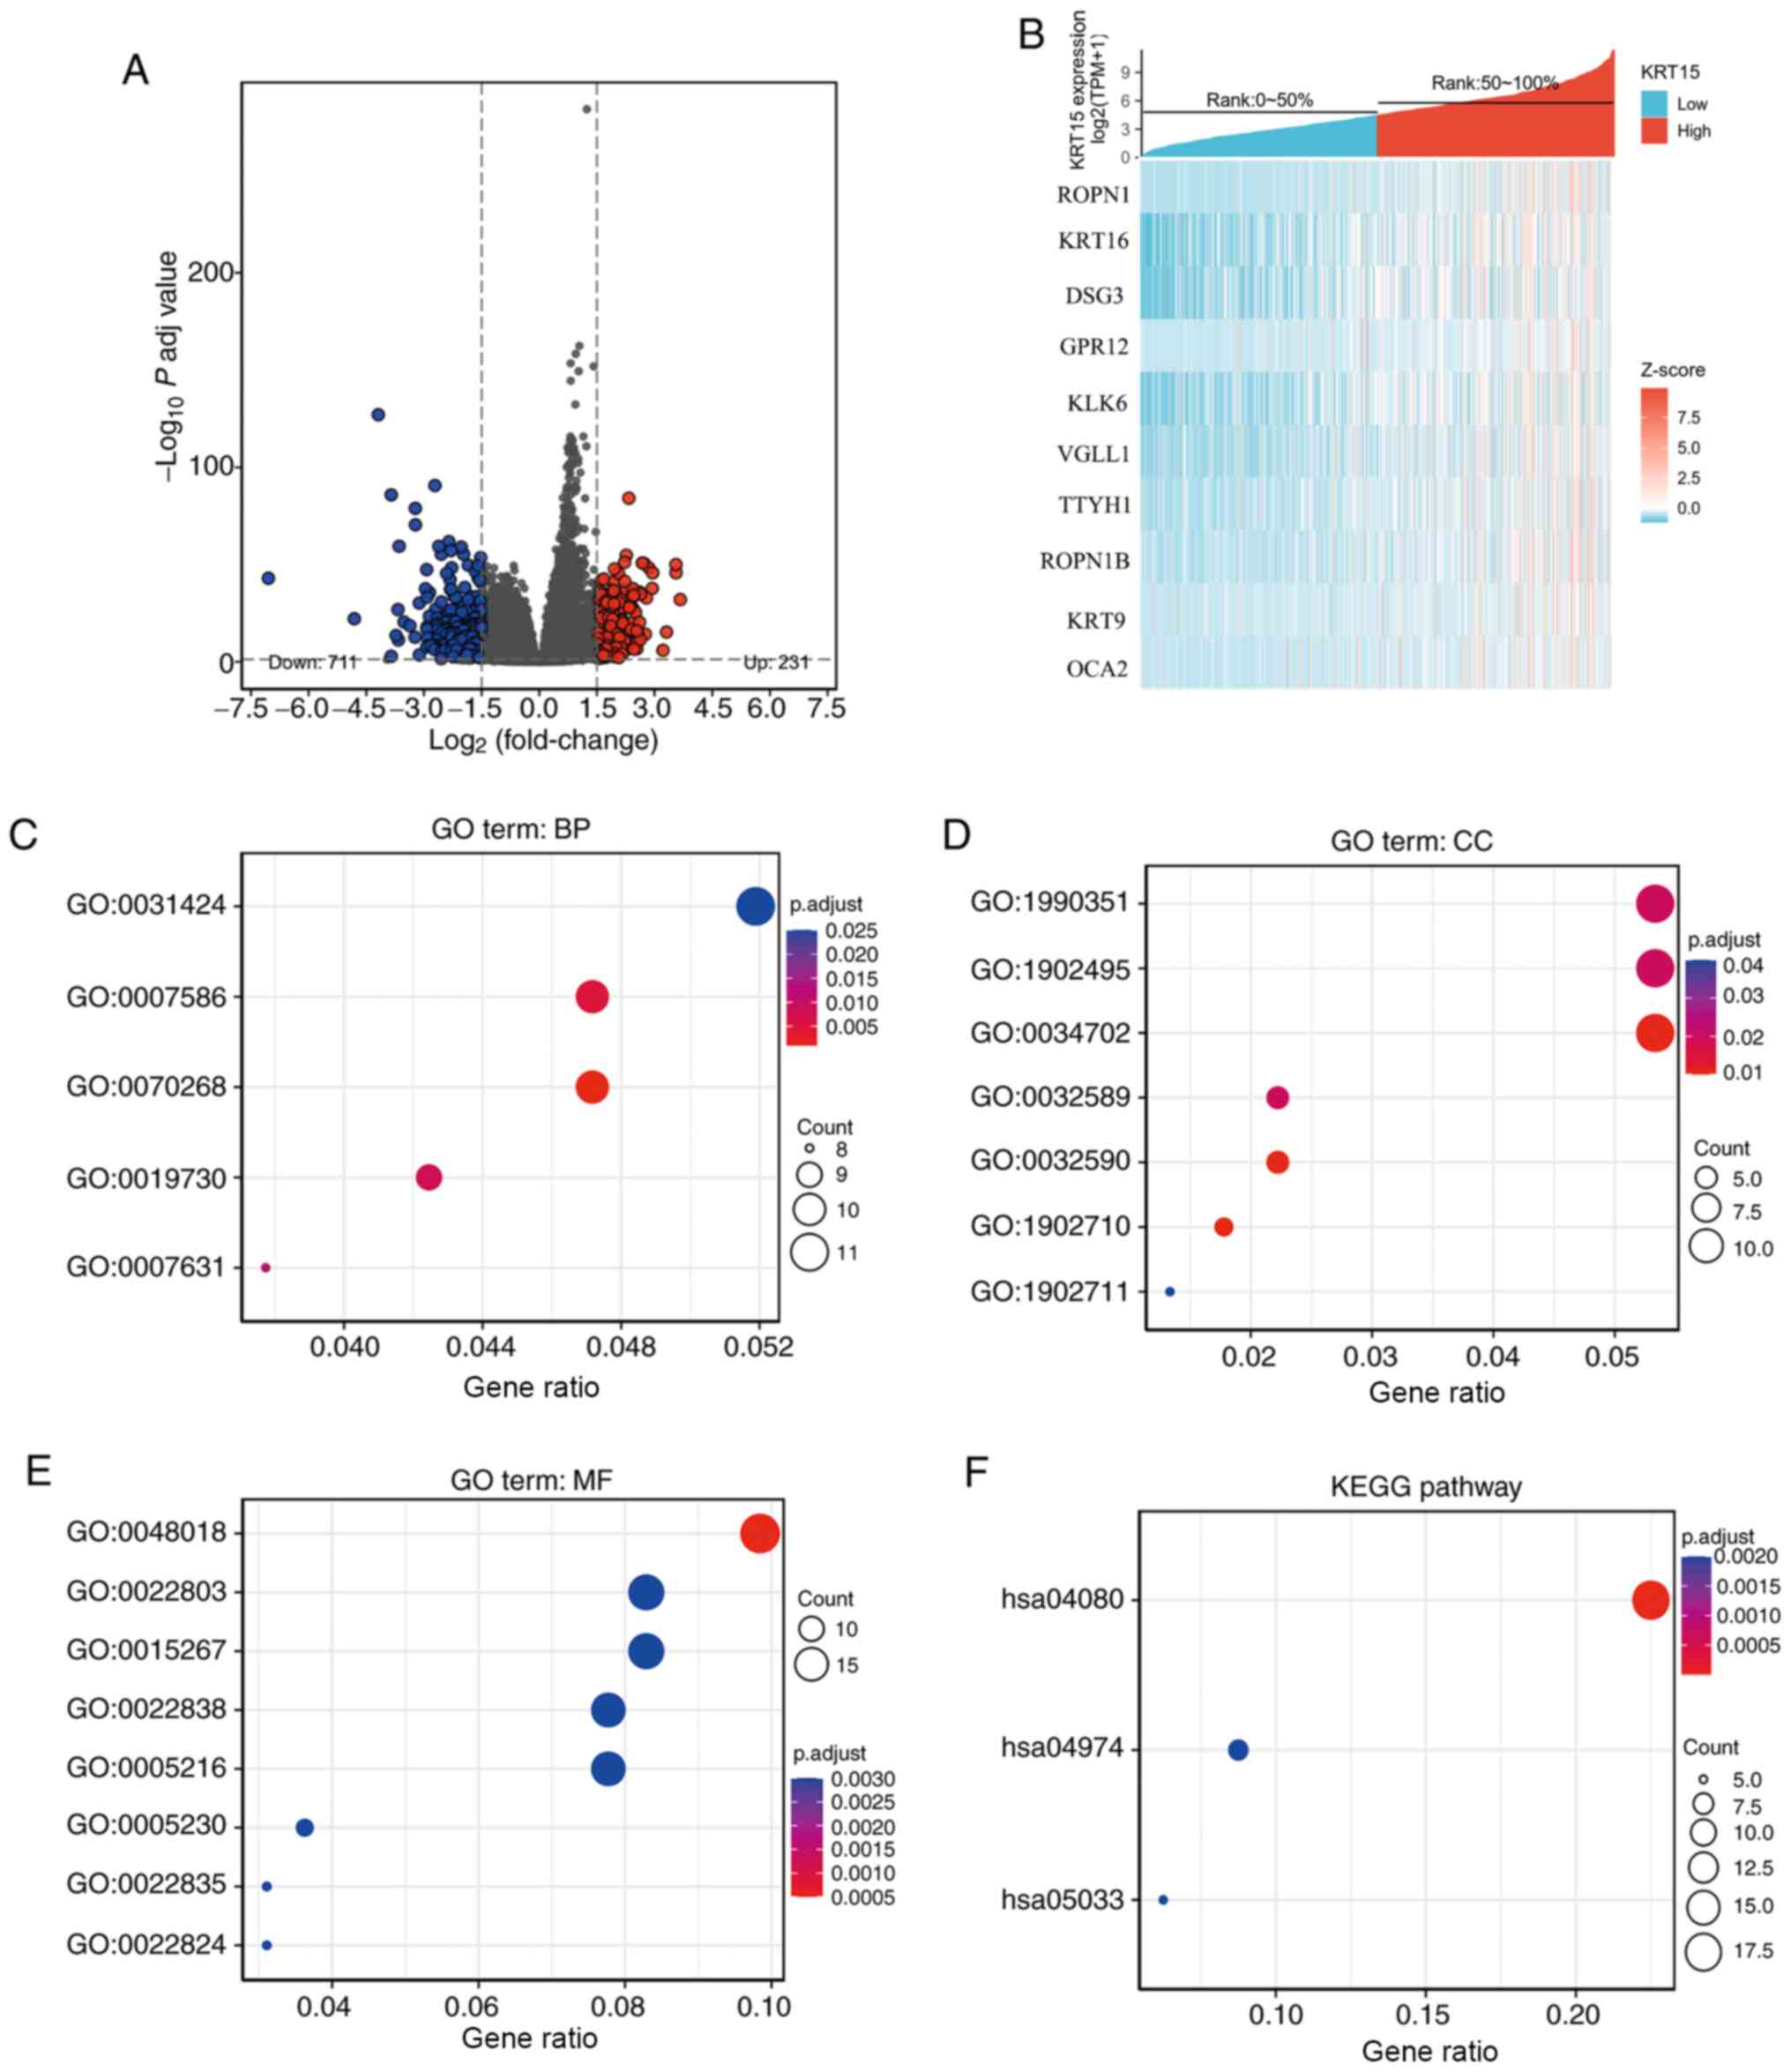 | Figure 2Functional enrichment analysis for
KRT15-associated genes in BRCA. (A) Volcano plot depicting the
differentially expressed genes (|log fold change|>1.5;
P<0.05) between the high and low gene expression groups. Blue
represents downregulation and red upregulation. (B) Heatmap of the
top differentially expressed genes in the BRCA dataset. The x-axis
represents the samples and the y-axis represents the DEGs. (C-F)
Bubble charts presenting significantly enriched terms of the DEGs
in the GO categories (C) BP, (D) CC and (E) MF and (F) KEGG
pathways. Enrichment analysis was performed based on a P adj
<0.05. BRCA, breast invasive carcinoma; KRT15, keratin 15; FC,
fold change; P adj, adjusted P-value; DEG, differentially expressed
gene; TPM, transcripts per million reads; ROPN1, ropporin-1; KRT16,
keratin16; DSG3, desmoglein-3; GPR12, G-protein coupled receptor
12; KLK6, kallikrein-6; VGLL1, vestigial-like protein 1; TTYH1,
tweety homolog 1; KRT9, keratin 9; OCA2, oculocutaneous albinism
II; GO, Gene Ontology; KEGG, Kyoto Encyclopedia of Genes and
Genomes; BP, biological process; CC, cellular component; MF,
molecular function. |
ClusterProfiler was used to perform GO functional
enrichment analysis of KRT15-associated DEGs. The results of the GO
analysis indicated that the BP and MF terms of KRT15-related genes
included cornification, digestion, antimicrobial humoral response,
feeding behavior, keratinization, receptor ligand activity, channel
activity, transmembrane transporter activity and transmitter-gated
ion channel activity (Fig. 2C and
D). In terms of the CC category,
the genes were primarily localized on the cell surface and were
also present in components of the cellular membrane, such as in the
gamma-aminobutyric acid receptor complex, dendrite membrane, ion
channel complex, transmembrane transporter complex, transporter
complex and neuron projection membrane (Fig. 2E). KEGG enrichment analysis
suggested that neuroactive ligand-receptor interaction, protein
digestion and absorption and nicotine addiction were significantly
enriched (Fig. 2F).
Gene-related signaling pathways
determined by GSEA
To identify the differential activation of signaling
pathways in BRCA, GSEA was performed to uncover significant
differences between the low and high KRT15 expression groups
(FDR<0.25, P<0.05) in an enrichment analysis of the MsigDB
collection (set c2.cp). Amongst these, a total of 640 datasets met
the aforementioned FDR criteria. As presented in Fig. 3A-G, seven pathways, including
regulation of tumor protein (TP)53 expression and degradation, the
forkhead box (FOX)O pathway, ΔNP63 pathway, vitamin D receptor
(VDR) pathways, the alternative reading frame (ARF) pathway, the
caspase pathway and the IL27 pathway were significantly enriched in
the KRT15 high expression group. Of note, two pathways, including
the angiotensin converting enzyme 2 (ACE2) pathway and ghrelin
pathway, were significantly enriched in the KRT15 low expression
group (Fig. 3H-I), indicating KRT15
may be closely associated with these signaling pathways (Table SI).
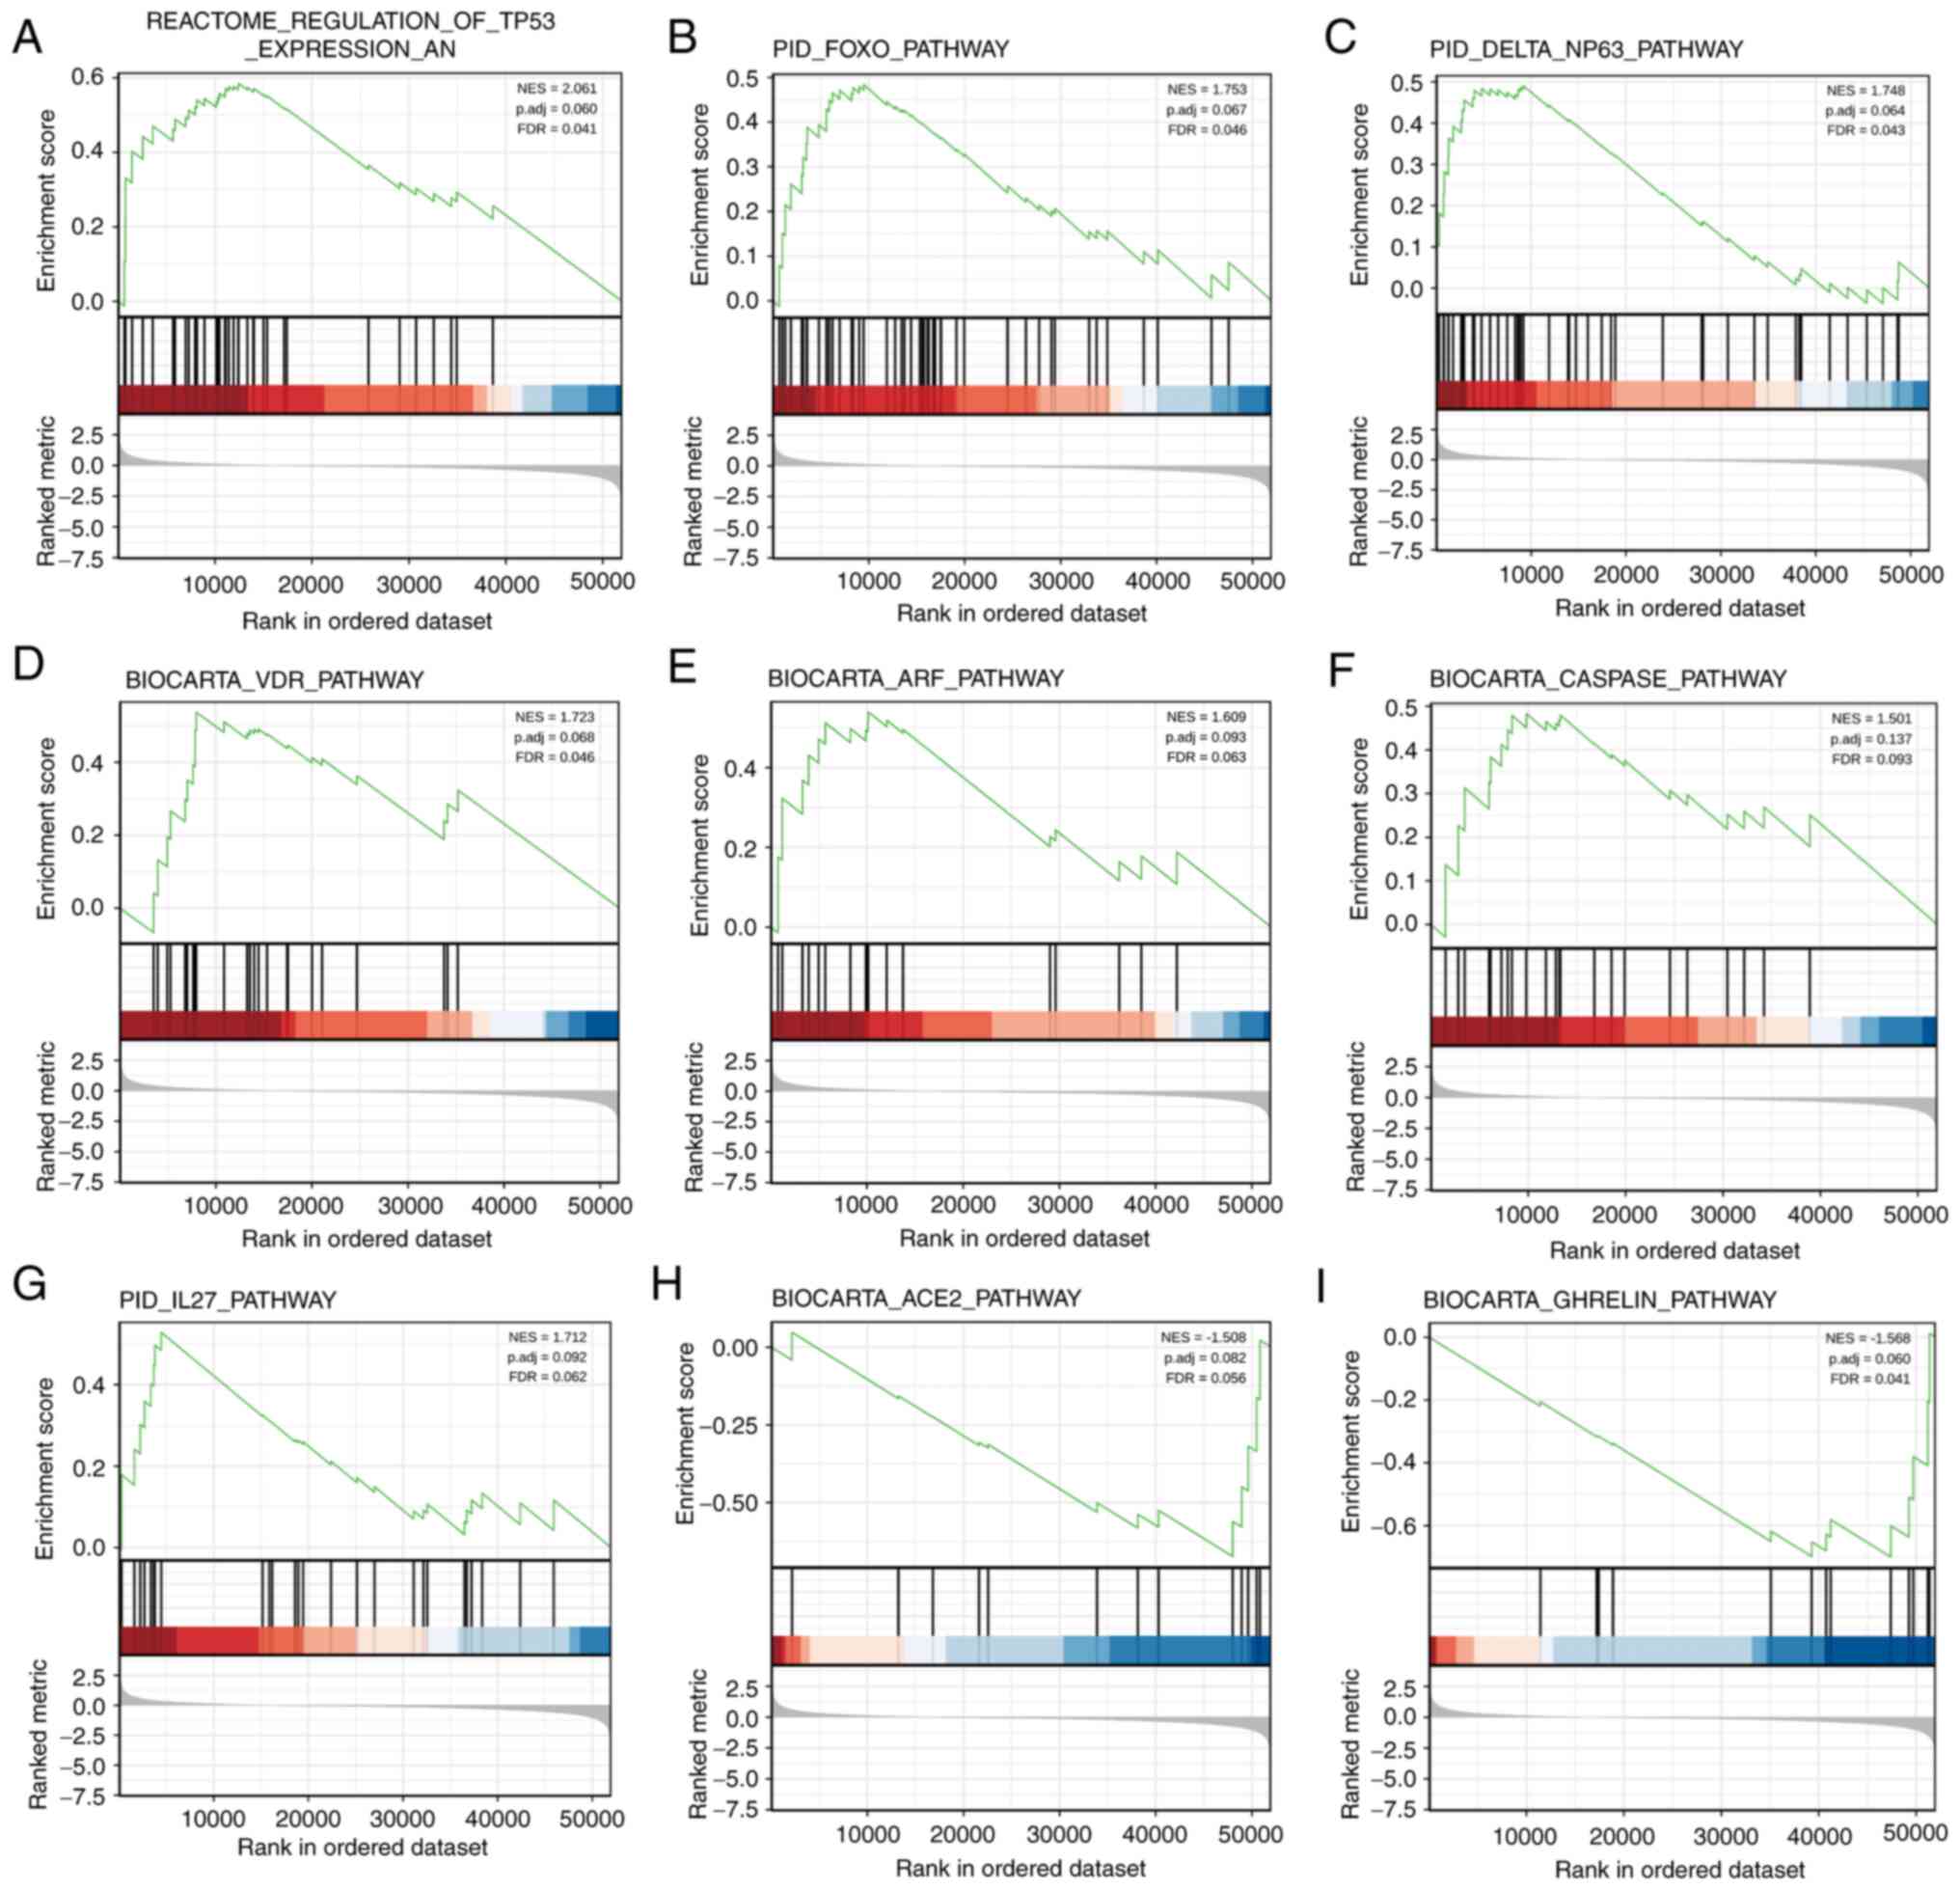 | Figure 3Enrichment map of GSEA for
KRT15-related genes in BRCA. GSEA results showed datasets (A)
‘REACTOME_REGULATION_OF_TP53_EXPRESSION_AND_DEGRADATION’, (B)
PID_FOXO_PATHWAY, (C) ‘PID_DELTA_NP63_PATHWAY’, (D)
BIOCARTA_VDR_PATHWAY, (E) BIOCARTA_ARF_PATHWAY, (F)
BIOCARTA_CASPASE_PATHWAY and (G) PID_IL27_PATHWAY were
significantly enriched in the KRT15 high group, indicating a
potential role of KRT15 in BRCA. Datasets (H)
‘BIOCARTA_ACE2_PATHWAY’ and (I) BIOCARTA_GHRELIN_PATHWAY were
significantly enriched in the KRT15 low group. NES, normalized
enrichment score; FDR, false discovery rate; P adj, adjusted
P-value; BRCA, breast invasive carcinoma; KRT15, keratin 15; FOXO,
forkhead box O; VDR, vitamin D receptor; ARF, alternative reading
frame; ACE2, angiotensin converting enzyme 2. |
KRT15 expression is correlated with
immune-cell infiltration levels in BRCA
In the subsequent analyses, Spearman correlation
analysis was performed to reveal the correlation between KRT15
expression and immune-cell infiltration levels, as calculated using
ssGSEA. As presented in Fig. 4A,
natural killer (NK) cells, B cells and mast cells were
significantly positively correlated with KRT15 expression. Other
immune cell subsets, such as eosinophils, T-helper (Th) cells and T
regulatory (Treg) cells were significantly negatively correlated
with KRT15. In addition, the Wilcoxon rank-sum test was performed
to compare the immune infiltration score between the high and low
KRT15 expression groups. The results presented in Fig. 4B-D respectively indicate that the
levels of B-cell (P<0.001), NK-cell (P<0.001) and mast-cell
(P<0.001) infiltration were significantly higher in the high
KRT15 expression group compared with those in the low KRT15
expression group. Conversely, as presented in Fig. 4E-G, respectively, the low KRT15
expression group had significantly higher levels of Th2-cell
(P<0.001), eosinophil (P<0.001) and Th cell (P=0.003)
infiltration compared with those in the high KRT15 expression
group.
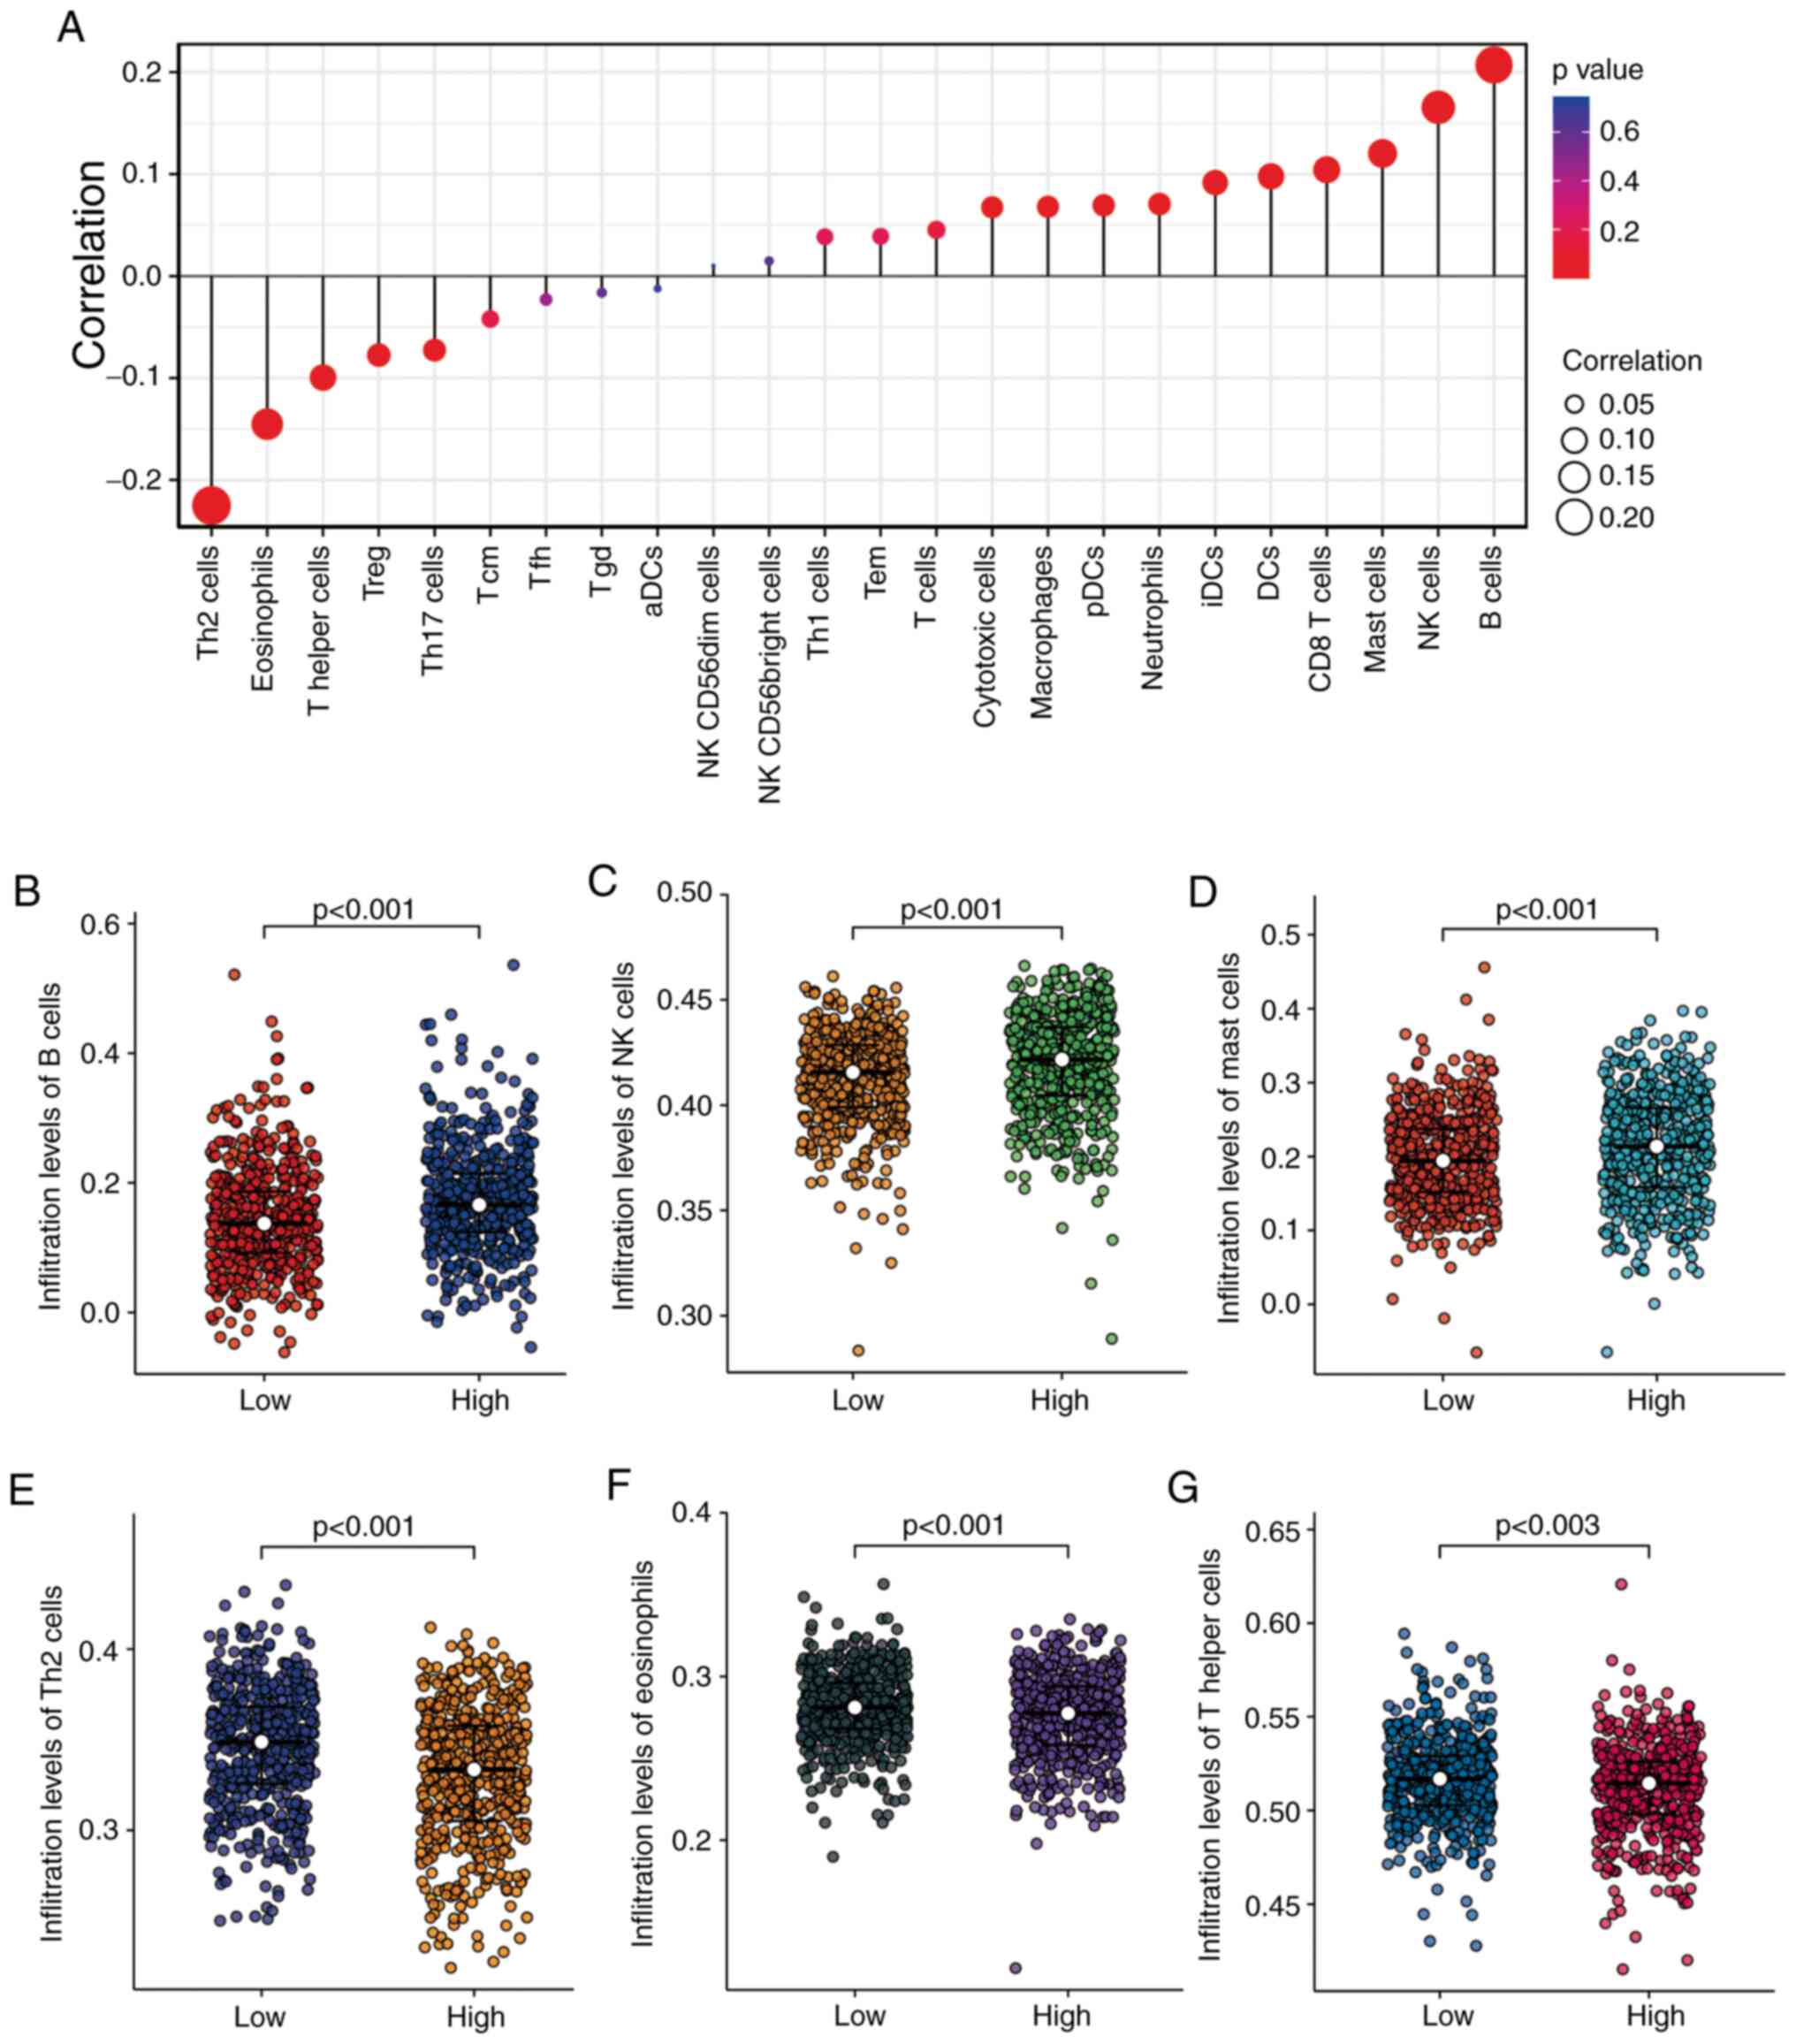 | Figure 4Correlation analyses between KRT15
expression and immune-cell infiltration levels determined by ssGSEA
in BRCA. (A) Correlation between the relative abundance of 24
immune cell types and gene expression levels. The dot size
represents the correlation coefficients and the color represents
the P-value. (B-G) Comparison of infiltration levels of different
immune cell types between high and low KRT15 expression groups. The
results are presented in scatter plots: (B) B cells, (C) NK cells,
(D) mast cells, (E) Th2 cells, (F) eosinophils and (G) Th cells.
BRCA, breast invasive carcinoma; KRT15, keratin 15; ssGSEA,
single-sample gene set enrichment analysis; NK, natural killer;
Th2, type 2 T-helper; Treg, T-regulatory cells; Tcm, central memory
T cell; Tfh, follicular helper T cell; Tgd, T γδ cell; DCs,
dendritic cells; aDCs, activated dendritic cells; pDCs,
plasmacytoid dendritic cells; iDCs, immature dendritic cells; Tem,
T effector memory. |
Association between KRT15 expression
and clinical characteristics
The baseline patient characteristics assessed
included age, ethnicity, TNM stage, PR/ER/HER2 status, PAM50
subtype, histological type, anatomic neoplasm subdivisions, TP53
status and phosphotidylinositol-4,5-bisphosphate 3-kinase catalytic
subunit alpha (PIK3CA) status. The Wilcoxon rank-sum test indicated
that KRT15 was significantly associated with the PR status
(P=0.001), ER status (P<0.001), HER2 status (P<0.001),
histological type (P<0.001) and N stage (P=0.026; Fig. 5A-E). The Kruskal-Wallis rank-sum
test also suggested that ethnicity (P=0.013), PAM50 subtype
(P<0.001) and T stage (P=0.021) were significantly associated
with KRT15 expression (Fig. 5F-H).
The χ2 test indicated there was a significant difference
between the low and high KRT15 expression groups in terms of PR
status (P=0.004), ER status (P<0.001), HER2 status (P=0.005),
PAM50 (P<0.001) and histological type (P=0.002). However, there
was no significant difference between the low and high KRT15
expression groups in terms of N stage (N1, N2 and N3 vs. N0) and T
stage (T3 and T4 vs. T1 and T2) (Table
I). Similar results were observed using univariate logistic
regression analysis (Table II).
These results suggested that although the expression levels of
KRT15 may not serve as an effective predictive index for
determining N and T stage, it may serve as an index for the
PR/ER/HER2 status and histological type in patients with BRCA.
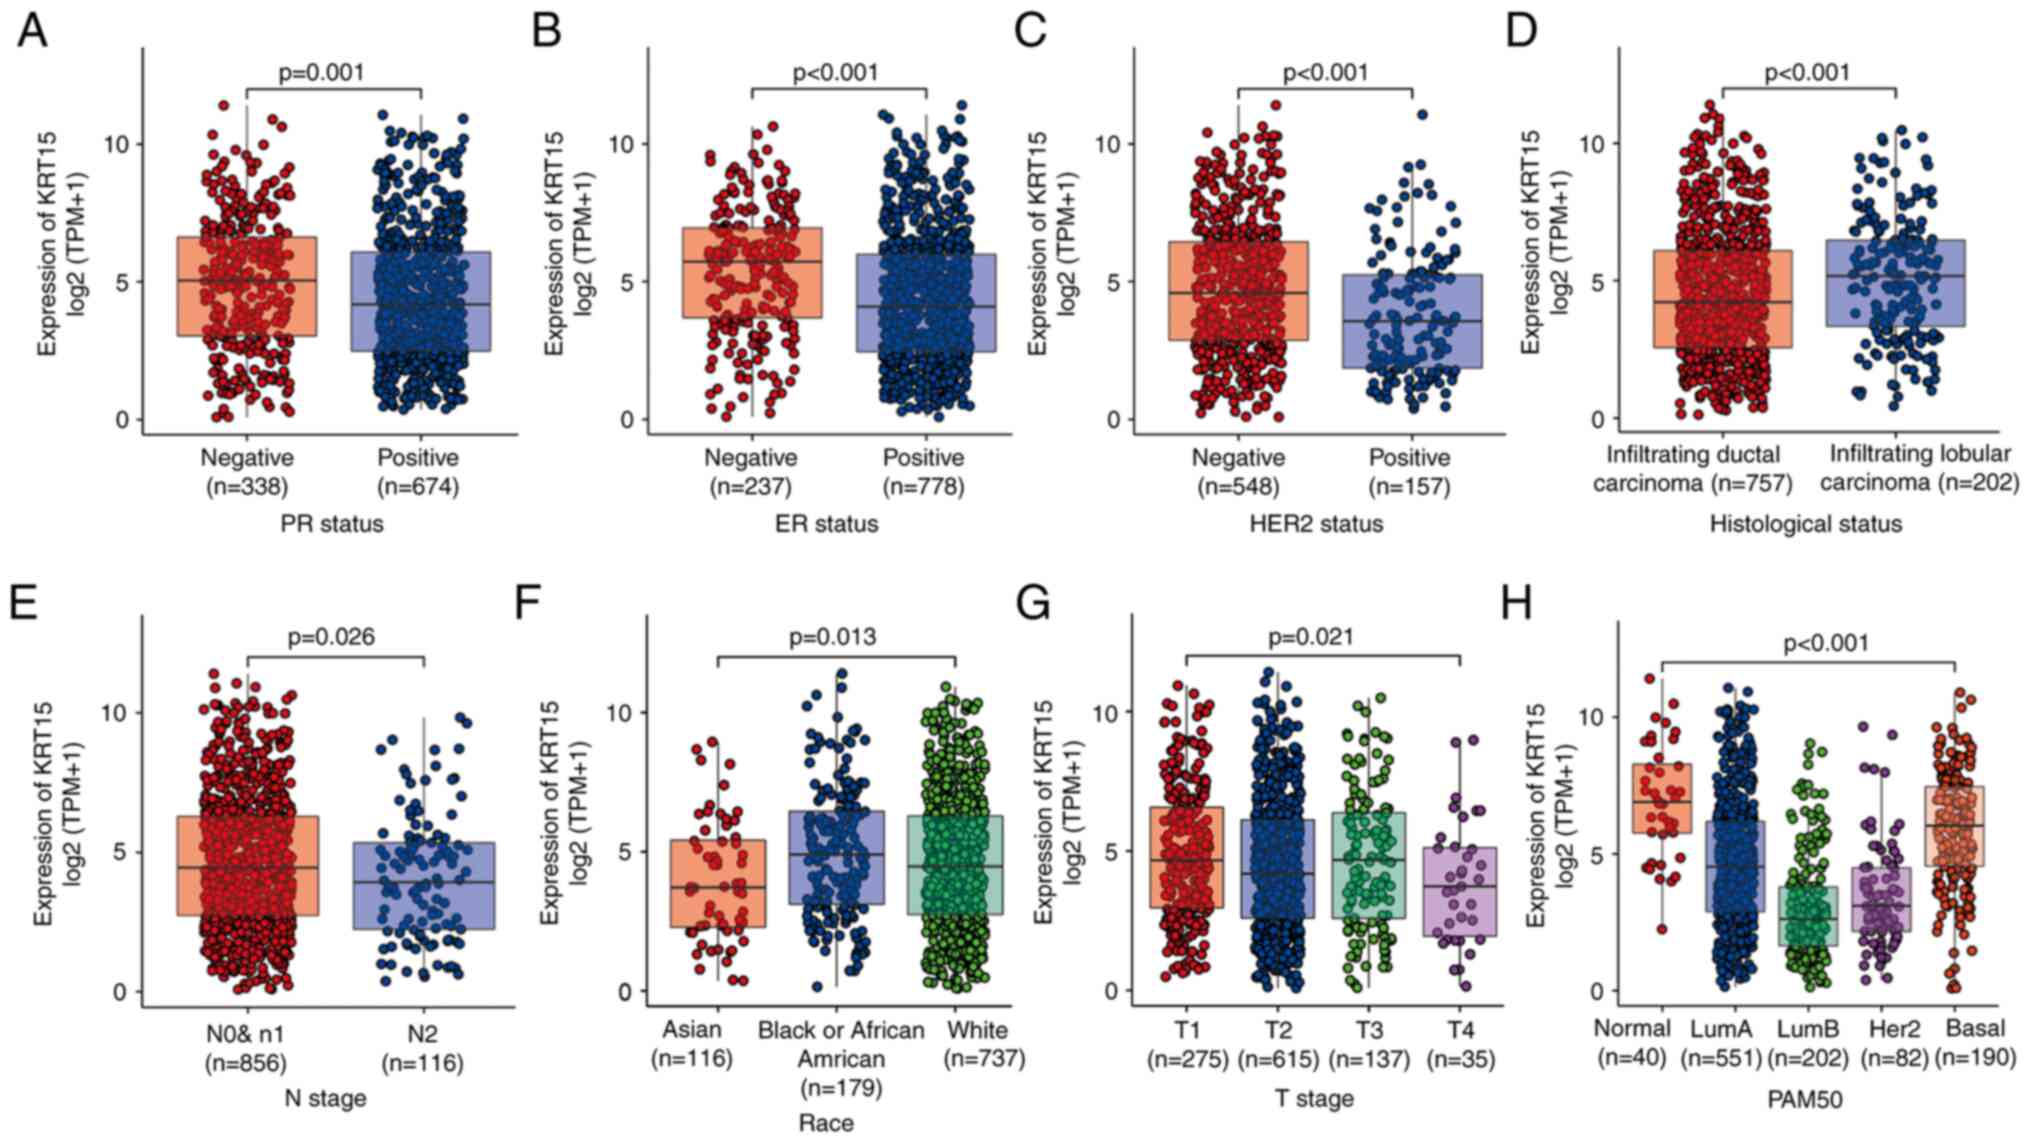 | Figure 5Association between KRT15 expression
and clinicopathological features. (A) PR status, (B) ER status, (C)
HER2 status, (D) histological type, (E) N stage, (F) race, (G) T
stage and (H) PAM50 subtypes. KRT15, keratin 15; TPM, transcripts
per million reads; PR, progesterone receptor; ER, estrogen
receptor; HER2, human epidermal growth factor receptor 2; PAM50,
prediction analysis of microarray 50. |
| Table IIUnivariate logistic regression
analysis of gene expression and clinicopathologic
characteristics. |
Table II
Univariate logistic regression
analysis of gene expression and clinicopathologic
characteristics.
|
Characteristics | N | Odds ratio (95%
CI) | P-value |
|---|
| T stage, T3/T4 vs.
T1/T2 | 1,062 | 0.97
(0.70-1.35) | 0.868 |
| N stage, N1/N2/N3
vs. N0 | 1,046 | 0.93
(0.73-1.18) | 0.535 |
| M stage, M1 vs.
M0 | 909 | 0.65
(0.25-1.58) | 0.346 |
| Pathologic stage,
III/IV vs. I/II | 1,042 | 0.86
(0.65-1.14) | 0.297 |
| PR status, positive
vs. negative | 1,012 | 0.67
(0.52-0.87) | 0.003 |
| ER status, positive
vs. negative | 1,015 | 0.43
(0.31-0.58) | <0.001 |
| HER2 status,
positive vs. negative | 705 | 0.58
(0.41-0.84) | 0.004 |
| Histological type,
infiltrating lobular carcinoma vs. infiltrating ductal
carcinoma | 959 | 1.68
(1.23-2.31) | 0.001 |
| TP53 status, Mut
vs. WT | 956 | 1.06
(0.82-1.39) | 0.644 |
| PIK3CA status, Mut
vs. WT | 956 | 1.11
(0.85-1.46) | 0.441 |
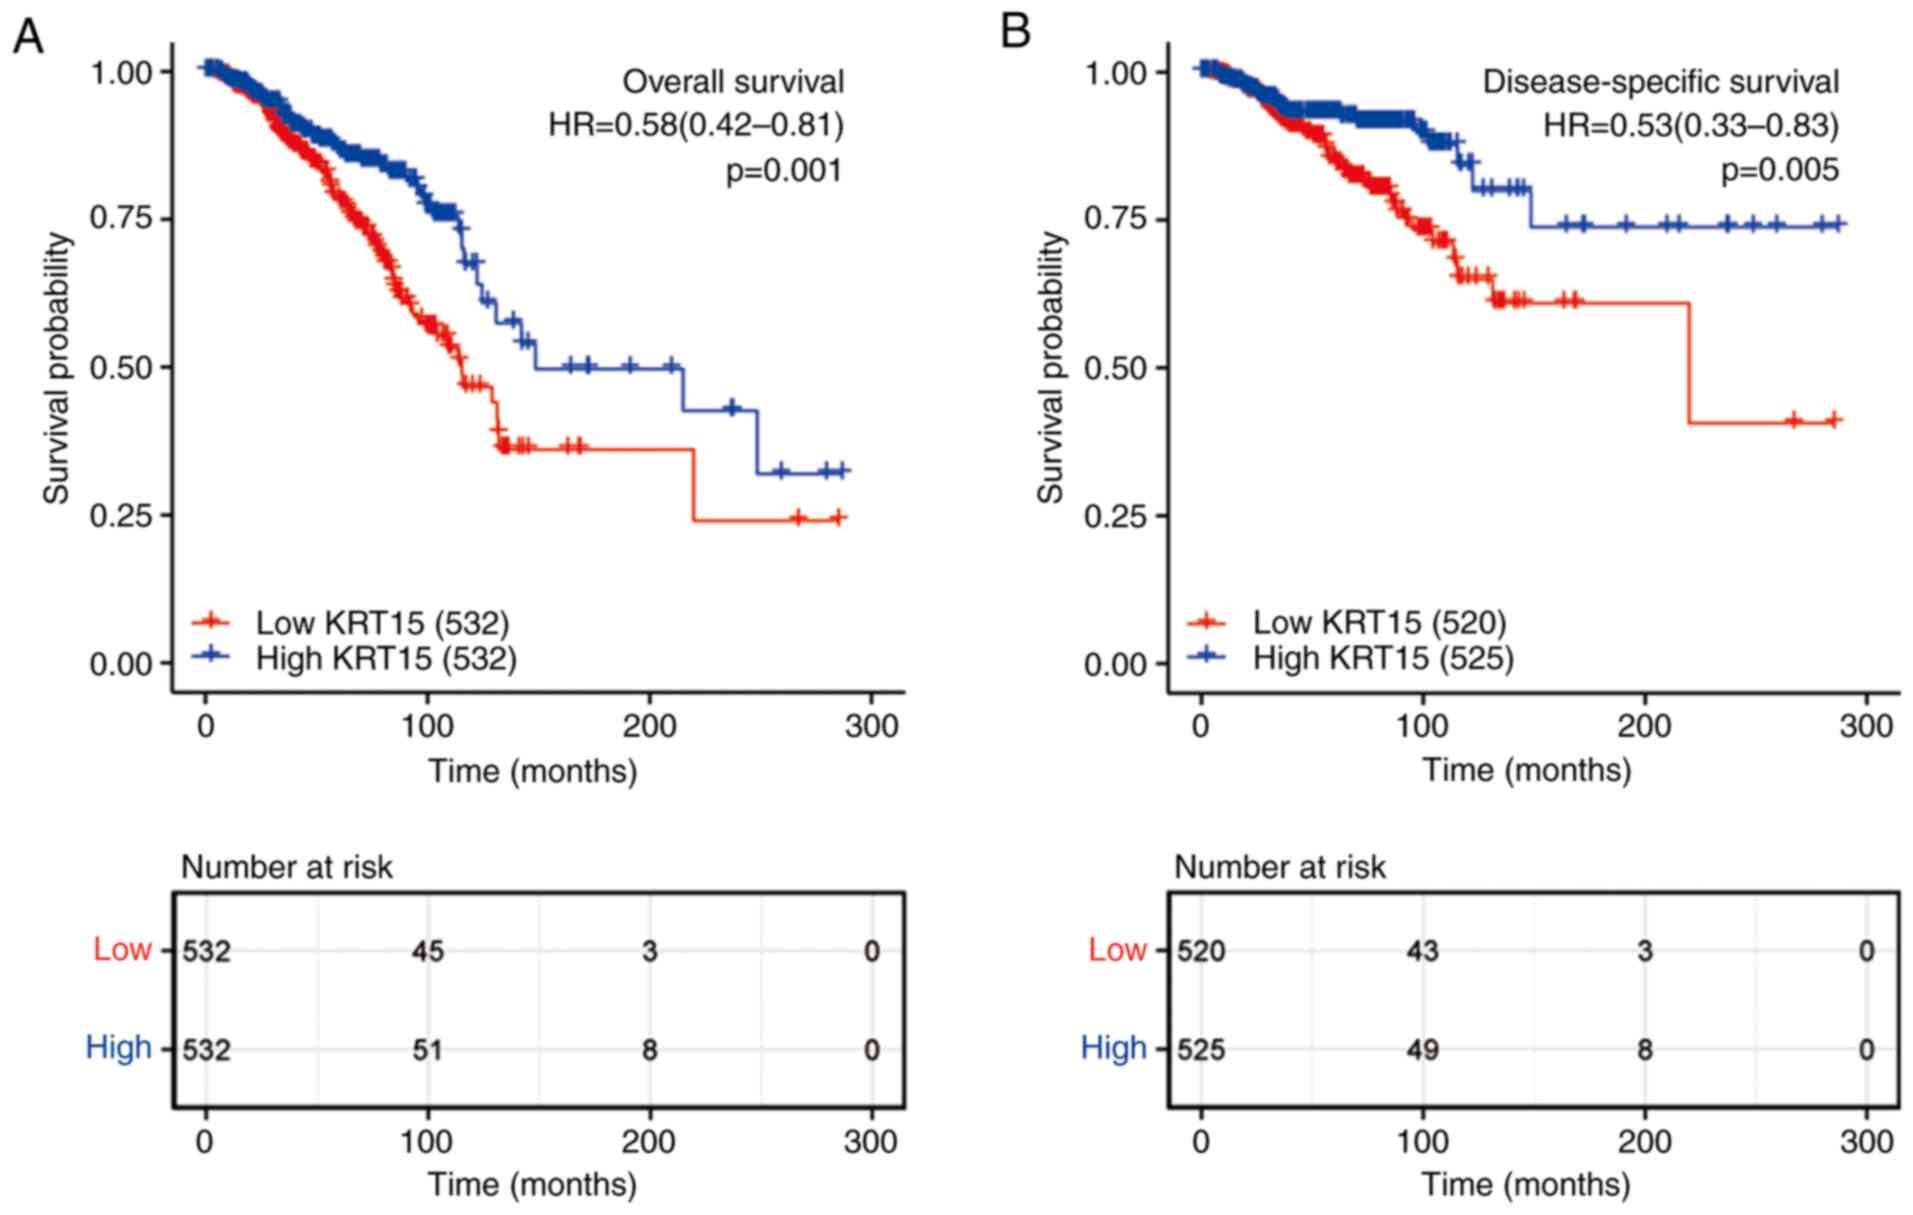
Low KRT15 expression is associated
with adverse outcomes in patients with BRCA
As presented in Fig.
6, KM survival analysis was used to determine the prognostic
role of KRT15 in patients with BRCA. The high KRT15 expression
group had significantly better OS (P=0.001; Fig. 6A) and DSS (P=0.005; Fig. 6B) than the low expression group.
Subsequently, the factors associated with BRCA prognosis were
analyzed using a univariate Cox regression model. High KRT15
expression was significantly positively associated with favorable
OS (P=0.001, HR=0.581, 95% CI=0.417-0.89). In addition, to identify
independent factors affecting OS, a multivariate Cox regression
model was utilized, incorporating the TNM stage, pathological
stage, ER/HER2 status and age. Patients with high KRT15 expression
had significantly better OS (P<0.039, HR=0.590, 95%
CI=0.358-0.974) compared to patients with low KRT15 expression. The
above results demonstrated that KRT15 is an independent prognostic
factor for OS (Table III).
| Table IIIAssociation between
clinicopathological characteristics and overall survival determined
by univariate and multivariate Cox regression analysis. |
Table III
Association between
clinicopathological characteristics and overall survival determined
by univariate and multivariate Cox regression analysis.
| | Univariate | Multivariate |
|---|
|
Characteristics | N | HR (95% CI) | P-value | HR (95% CI) | P-value |
|---|
| T stage, T1/T2 vs.
T3/T4 | 1,061 | 0.598
(0.412-0.868) | 0.007 | 0.413
(0.212-0.806) | 0.01 |
| N stage, N1/N2/N3
vs. N0 | 1,045 | 2.145
(1.497-3.073) | <0.001 | 1.342
(0.719-2.505) | 0.355 |
| M stage, M1 vs.
M0 | 909 | 4.327
(2.508-7.465) | <0.001 | 2.677
(1.045-6.858) | 0.04 |
| Pathologic stage,
III/IV vs. I/II | 1,041 | 2.519
(1.787-3.549) | <0.001 | 2.041
(0.968-4.302) | 0.061 |
| PR status, positive
vs. negative | 1,011 | 0.762
(0.541-1.074) | 0.120 | | |
| ER status, positive
vs. negative | 1,014 | 0.704
(0.487-1.017) | 0.062 | 0.402
(0.240-0.674) | <0.001 |
| HER2 status,
positive vs. negative | 705 | 1.611
(0.981-2.644) | 0.059 | 0.910
(0.509-1.628) | 0.751 |
| Age, >60 vs. ≤60
years | 1,064 | 2.036
(1.468-2.822) | <0.001 | 3.267
(1.974-5.407) | <0.001 |
| Ethnicity, white
vs. Asian/black or African American | 975 | 0.880
(0.593-1.306) | 0.526 | | |
| Histological type,
infiltrating ductal carcinoma vs. infiltrating lobular
carcinoma | 959 | 1.162
(0.738-1.830) | 0.516 | | |
| Anatomic neoplasm
subdivisions, right vs. left | 1,064 | 0.776
(0.559-1.077) | 0.13 | | |
| TP53 status, Mut
vs. WT | 955 | 1.218
(0.858-1.730) | 0.269 | | |
| PIK3CA status, Mut
vs. WT | 955 | 1.015
(0.696-1.479) | 0.938 | | |
| KRT15, high vs.
low | 1,064 | 0.581
(0.417-0.809) | 0.001 | 0.590
(0.358-0.974) | 0.039 |
Furthermore, a nomogram prognostic model was
constructed to predict OS and DSS. Based on multivariate analysis,
independent prognostic factors including KRT15, T stage, M stage,
ER status and age were analyzed in combination. The discriminatory
efficiency of the prognostic factors was evaluated using the
C-index. The C-index of the nomogram for OS (Fig. S2A) and DSS (Fig. S2C) was 0.717 (95% CI=0.692-0.742)
and 0.775 (95% CI=0.745-0.805), respectively. A calibration plot
demonstrated the predicted values and real values of the model. The
corrected line is close to the reference line, indicating a
satisfactory match between the predictions and observations. In
summary, these results suggested that the nomogram was a suitable
discriminatory model for predicting OS (Fig. S2B) and DSS (Fig. S2D) in BRCA.
KRT15 expression affects BRCA
prognosis in patients with different demographics and in
pathological subgroups
To further delineate the potential relevance and
possible mechanisms of KRT15 expression in BRCA, the association of
the KRT15 expression levels with the outcomes of different
clinicopathological subgroups was assessed using Cox regression
analysis. High KRT15 expression was associated with better OS
compared with low KRT15 expression, in the following stages: T2
(HR=0.620, 95% CI=0.390-0.985, P=0.043), T3 and T4 (HR=0.345, 95%
CI=0.173-0.691, P=0.003), N1-3 (HR=0.594, 95% CI=0.390-0.904,
P=0.015) and M0 (HR=0.599, 95% CI=0.416-0.864, P=0.006; Fig. 7A). Among all comparisons performed,
high KRT15 expression had the lowest HR value for OS in patients at
stage T3 and T4. Similar to the above analysis on OS, high KRT15
expression was associated with improved DSS (Fig. S3A).
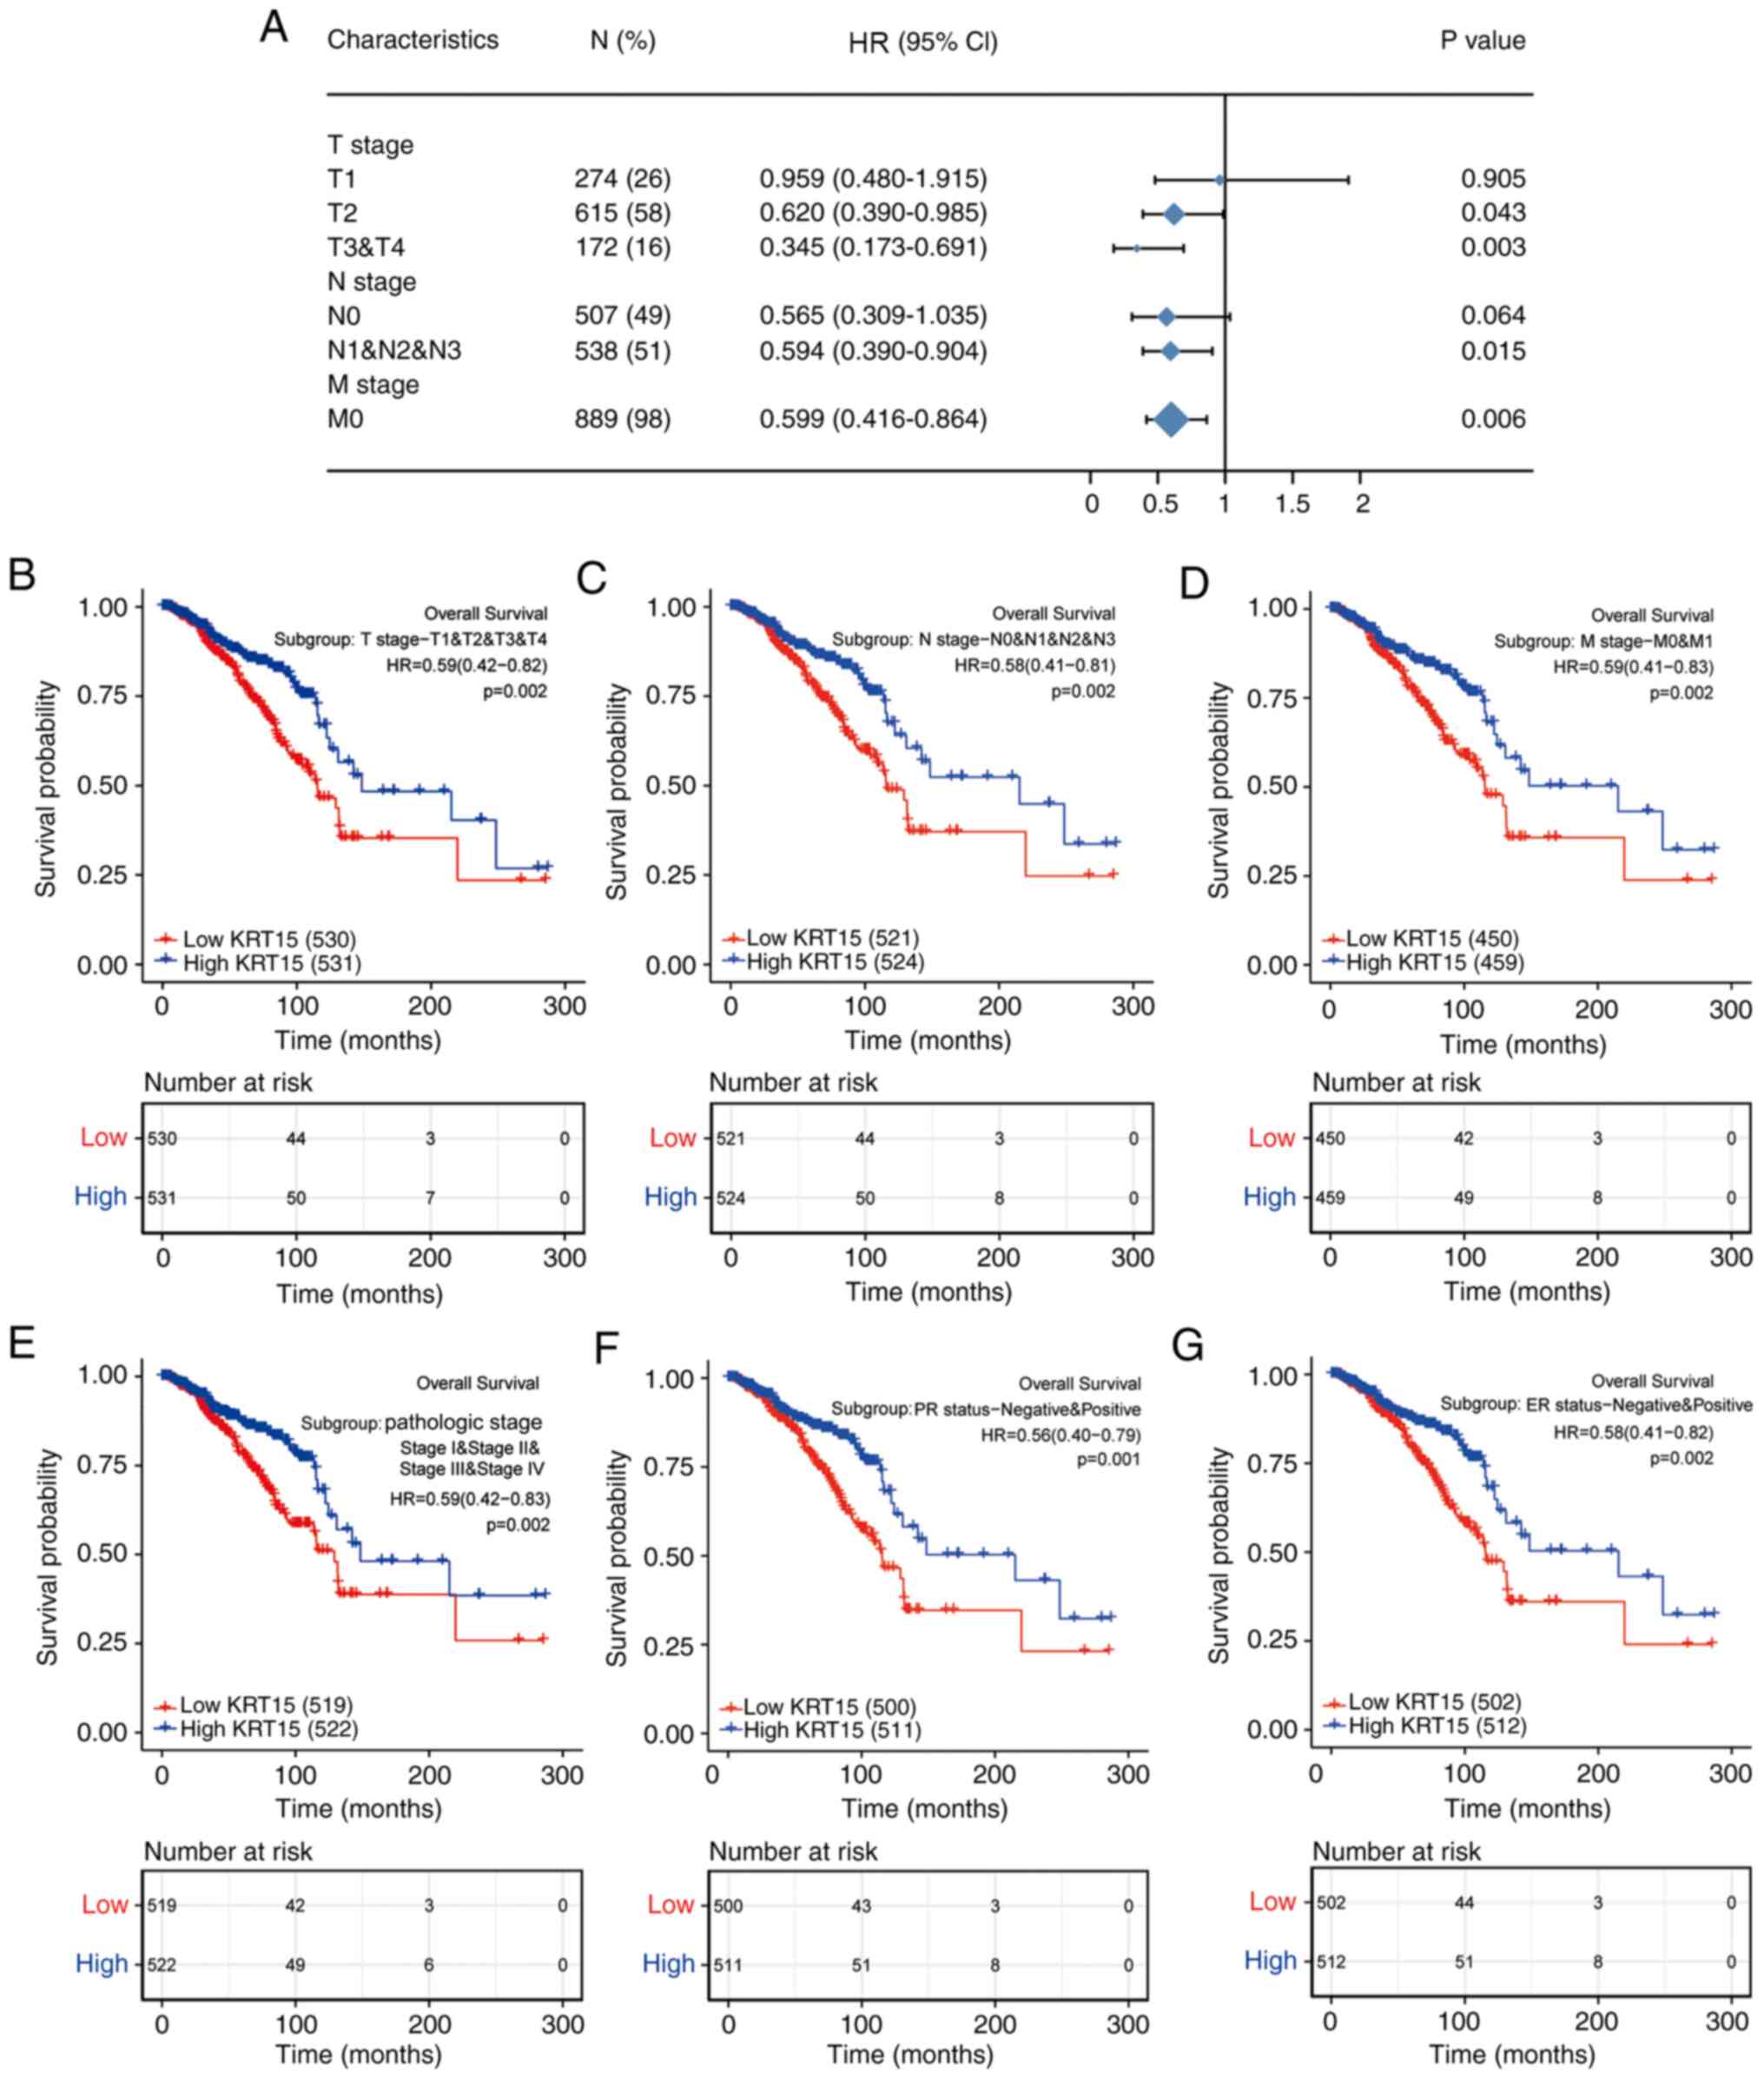 | Figure 7Forest and KM plots for OS based on
KRT15 expression in the different clinicopathological subgroups.
(A) Forest plot of univariate Cox analysis on OS for different
clinicopathological subgroups based on KRT15 expression in BRCA.
(B-G) KM survival plots based on KRT15 expression in
clinicopathological subgroups of patients with BRCA. (B) T1-4, (C)
N0-3, (D) M0 and M1, (E) pathologic stages I-IV, (F) PR-negative
and PR-positive and (G) ER-negative and ER-positive. HRs are
presented with the 95% CI. KM, Kaplan-Meier; KRT15, keratin 15; OS,
overall survival; BRCA, breast invasive carcinoma; PR, progesterone
receptor; ER, estrogen receptor; HR, hazard ratio; CI, confidence
interval. |
The prognostic value of KRT15 for OS in various
subgroups of BRCA was further determined using KM analysis. Low
KRT15 expression was highly associated with unfavorable prognosis
in the following stages/classifications: T1-4 (P=0.002; Fig. 7B), N0-3 (P=0.002; Fig. 7C), M0 and M1 (P=0.002; Fig. 7D), pathological stage I-IV (P=0.002;
Fig. 7E), PR-negative and
PR-positive (P=0.001; Fig. 7F) and
ER-negative and ER-positive (P=0.002; Fig. 7G). As presented in Fig. S3B-I, low KRT15 expression was
associated with the following characteristics: Asian and black or
African American and white ethnicity (P=0.003), age ≤60 and >60
years (P=0.001), histological types of infiltrating ductal
carcinoma and infiltrating lobular carcinoma (P=0.014),
HER2-negative and HER2-positive (P=0.028), the PAM50 normal and
luminal (Lum)A and LumB and HER2 and basal subtypes (P=0.001),
anatomic neoplasm subdivisions left and right (P=0.001), TP53
status wild-type (WT) and mutated (Mut) (P<0.001) and PIK3CA
status WT and Mut (P<0.001). These results indicated that KRT15
expression may affect the prognosis of patients with BRCA in
different demographic and pathological subgroups.
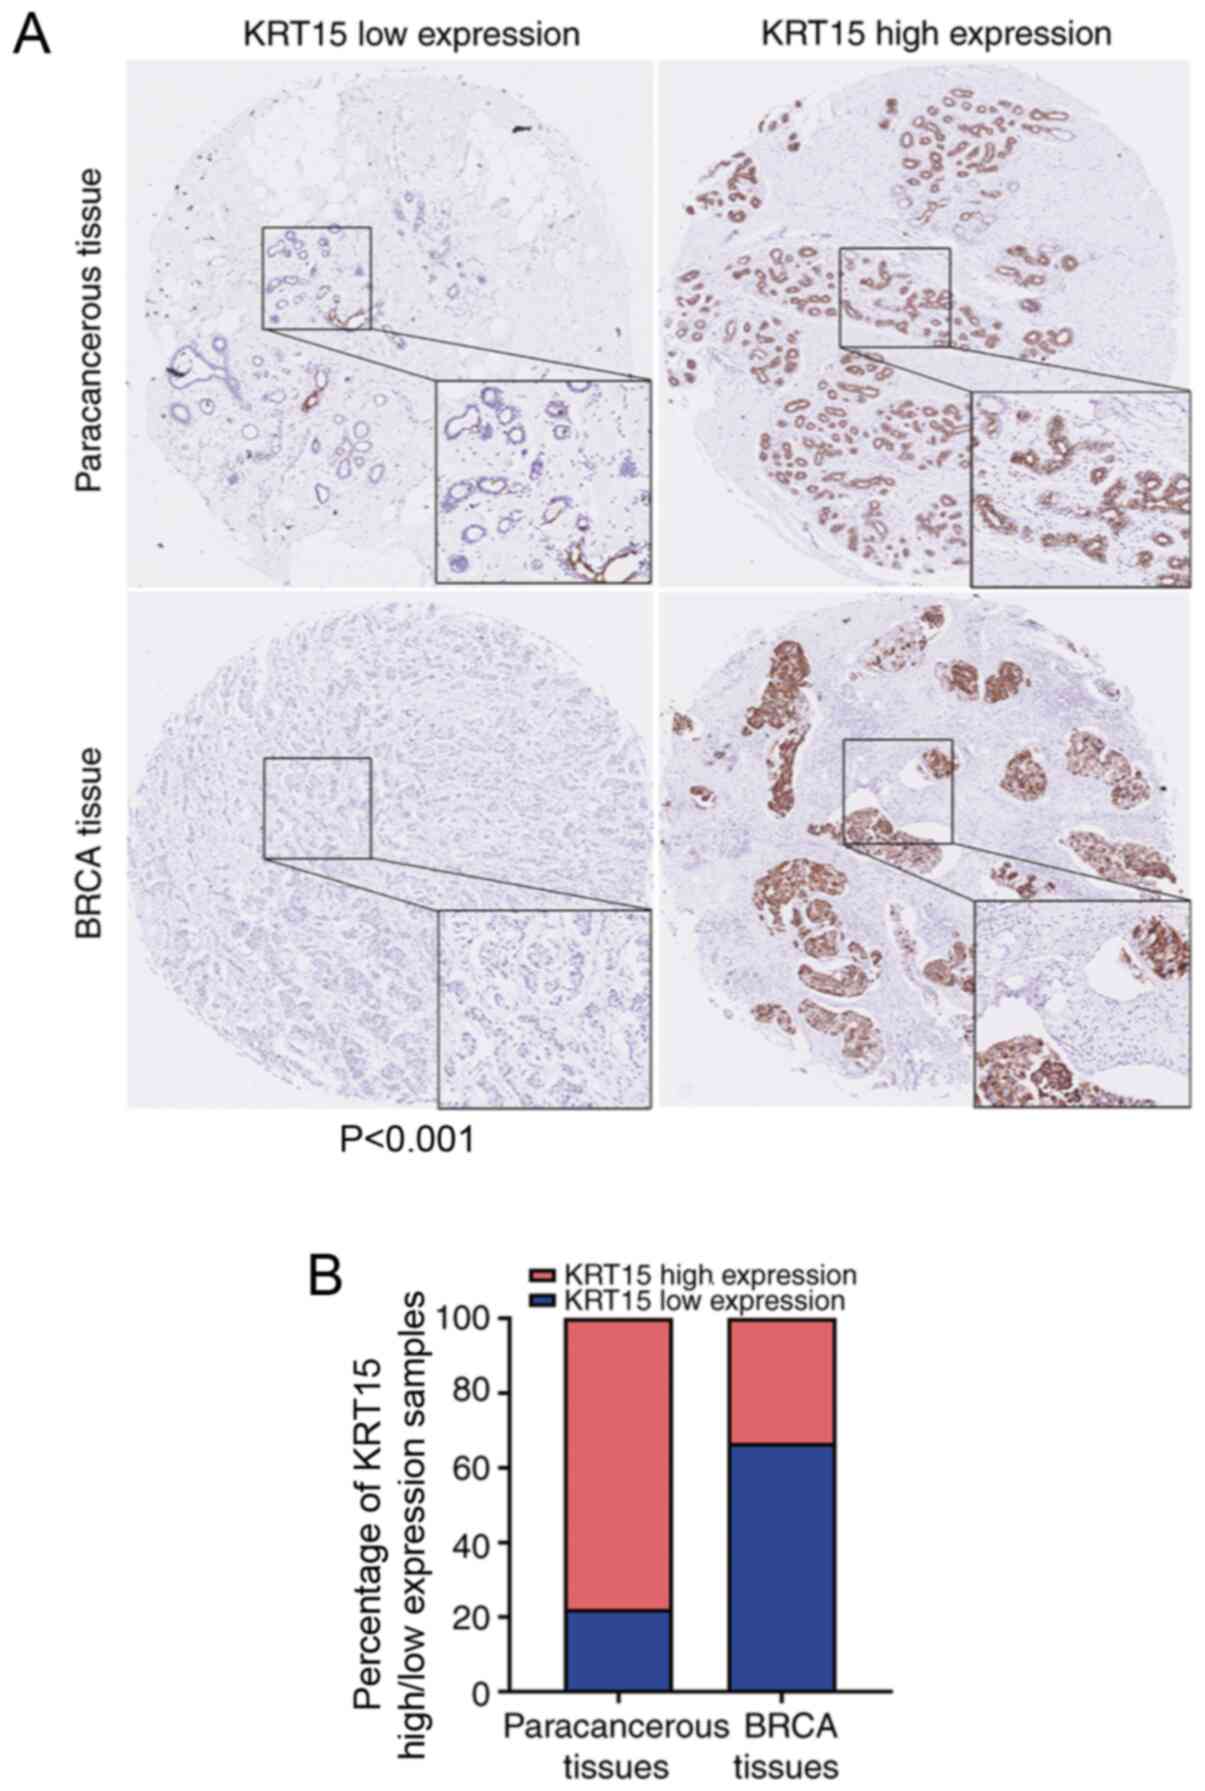
KRT15 expression in tissue microarrays
is consistent with that based on data obtained from TCGA
To further evaluate the clinical significance of
KRT15 expression, IHC staining for KRT15 was performed in a tissue
microarray containing BRCA and paracancerous tissues from 90 cases.
All patients were female with an average age 54.8±12.5 years.
Amongst the BRCA tissue samples, 66.7% (30/45) did not exhibit any
marked KRT15 expression. By contrast, high KRT15 expression was
observed in 77.8% (35/45) of the paracancerous tissues. Compared
with that among the BRCA tissue samples, the ratio of tissues with
high KRT15 expression was significantly higher among the
paracancerous tissue samples (P<0.001). The results and
representative images are provided in Fig. 8.
Discussion
KRT, an intermediate filament protein, serves an
important role in maintaining the structural integrity of
epithelial cells. KRT has at least 20 subtypes, termed KRT1-20, and
the expression patterns of each KRT filament are frequently
distinctive (22). KRT15 belongs to
the complex epithelial KRT family of proteins and is involved in
epithelial lineage differentiation, tissue regeneration (23) and wound repair (24,25).
It has also been reported that KRT15 has different expression
characteristics across different types of cancer. KRT15-expressing
cells in the hair follicle bulge promote the development of
squamous papilloma (26) and basal
cell carcinomas (27). KRT15
expression is increased in squamous cell lung carcinoma (28), colorectal cancer (11) and a subset of urothelial cell
carcinomas (29). In addition, the
expression of KRT15 is positively associated with the OS time of
patients with gastric cancer (30)
and greater positivity for KRT15 generally favors benign lesions
(31). However, the expression
levels and prognostic significance of KRT15 in BRCA have remained
largely elusive. Therefore, the aim of the present study was to
assess the clinical significance of KRT15 in BRCA. Through a series
of analyses, it was determined whether KRT15 may be used as a
candidate prognostic marker for BRCA.
Cornification (also known as keratinization) is the
final form of epithelial cell differentiation and is regarded as a
special type of squamous epithelial cell apoptosis in the upper
layer of the epithelial tissue (32-34).
Cornification serves an important role in maintaining normal
epithelial cell differentiation/maturation. Therefore, abnormal or
absent cornification promotes malignant cell transformation
(35,36). In the present study, GO enrichment
analysis suggested that KRT15-associated DEGs were significantly
enriched in cornification (keratinization). This result is
consistent with the Reactome pathway database (reactome.org) regarding KRT15-related pathways
(Table SII). Thus, KRT15 was
indicated to be involved in cornification to maintain epidermal
homeostasis in BRCA.
Furthermore, analysis of data obtained from TCGA for
GSEA indicated a significantly positive association between high
expression of KRT15 and tumor-suppressive pathways, such as
regulation of TP53 expression and degradation, the FOXO pathway,
the ΔNP63 pathway, the VDR pathway, the ARF pathway, the caspase
pathway and the IL27 pathway. TP53 has been extensively
demonstrated to function as a tumor suppressor gene and loss of
TP53 function is a characteristic feature of numerous types of
cancer (37,38). FOXO is a member of the subfamily of
the forkhead transcription factor family with important functions
in cell fate determination and this subfamily also serves a
critical role as tumor suppressors in several types of cancer
(39). ΔNP63 is a P53 family member
and regulates the expression of various genes crucial for
inhibiting tumorigenesis (40-42).
Numerous studies have demonstrated that expression of the VDR
pathway is associated with favorable prognosis of patients with
cancer, particularly colorectal cancer (43,44).
The ARF pathway may attenuate cell DNA damage and this
characteristic is known to be responsible for its anti-tumor
response (45). The caspase pathway
is essential for the normal development and function of
multicellular organisms, as abnormal cell death control may lead to
a variety of diseases, including cancer (46). IL-27 enhances the functions of Th1
and CD8+ T cells; promotes the development of follicular
helper T cell and T regulatory 1, which could activate B cells to
proliferate and secrete antibodies; and inhibits the functions of
Th2, Treg and Th17 cells. Therefore, IL-27 has a tumor suppressor
role in cancer (47). This
illustrates the functional interdependence between upregulated
KRT15 expression and the normal tumor suppressor function of these
pathways in BRCA. Of note, the ACE2 pathway and the ghrelin pathway
were significantly enriched in the low KRT15 expression group
according to the GSEA analysis. A pan-cancer analysis of TCGA
datasets demonstrated that ACE2 was expressed at a significantly
higher level in BRCA compared to normal samples (48). Studies have reported that ghrelin
may promote the expression of oncogene and also induce tumor
resistance (49,50). GO enrichment analysis suggested that
KRT15 is associated with the receptor-ligand complex and
transmembrane transporter complex. This suggests that KRT15 may
influence the expression of ACE2 and ghrelin by interacting with
the cell membrane complex.
Of note, KRT15 significantly influences immune-cell
infiltration in BRCA. In the present study, ssGSEA and Spearman's
rank correlation analysis revealed significant connections between
the KRT15 expression levels and immune-cell infiltration. In
particular, KRT15 expression was positively correlated with NK
cells, mast cells and B cells, and negatively correlated with
eosinophils, Th cells and Treg cells. Previous studies have
indicated that the absence of NK cells increases the incidence of
all types of cancer (51) and may
also significantly accelerate tumor growth (52,53).
It is known that cytotoxicity and the release of cytokines are the
two major functions of NK cells and cytokine production can lead to
the activation of NK cells, promoting their antitumor effects
(54). IFN-γ and TNF-α secreted
from NK cells contribute to the suppression of tumor proliferation
and angiogenesis (55). In
addition, through the production of chemokines C-C motif ligand 1
and lymphotactin α/β NK cells recruit more dendritic cells into
solid tumors, which improves the prognosis of patients (56). Mast cells are also considered to be
unfavorable for tumor growth due to their ability to secrete IL-4,
TNF-α and other cytokines to elicit tumor-cell apoptosis (57,58). A
series of studies have indicated that B cells and B cell-derived
tertiary lymphoid structures serve an important role in cancer
immunity and contribute to improved immunotherapy (59-61).
Thus, it may be hypothesized that KRT15 overexpression promotes
efficient NK-cell and mast-cell immune infiltration and initiates
an antitumor immune response.
Th cell subsets (Th1, Th2, Th17 and Treg cells)
serve a critical role in cancer immunity (62). Th2 cells produce and secrete IL-4
and IL-10, which have been indicated to stimulate tumor-cell
proliferation and promote tumor-cell resistance to apoptosis
(63,64). Treg cells are able to induce a tumor
suppressive microenvironment and foster tumor growth and recurrence
by suppressing tumor-reactive T cells and NK cells (65,66).
IL-17 derived from Th17 cells is able to activate the STAT3 pathway
in tumors and mediate a myeloid-derived suppressor cell-induced,
tumor-promoting microenvironment (67). In the present study, GO and KEGG
enrichment analysis indicated that KRT15 is closely correlated with
various cell-membrane complexes, including the receptor-ligand
complex. Taken together, these results suggest that KRT15 may
affect the binding of immune-cell ligands to their receptors and
serve a distinct role in regulating immune-cell infiltration.
Therefore, elevated KRT15 may ultimately influence the prognosis of
patients with BRCA.
In the present study, it was demonstrated that the
expression levels of KRT15 in BRCA tissues were significantly lower
compared with those in normal tissues and may serve as a predictive
index for determining the PR/ER/HER2 status and histological type
in patients with BRCA. Furthermore, lower KRT15 expression was
associated with poor OS or DSS. In addition, univariate and
multivariate Cox regression analyses indicated that KRT15 may be
used as an independent prognostic factor for patients with BRCA
after adjustment for conventional clinical characteristics.
Furthermore, a nomogram was constructed by combining KRT15
expression with other important clinical factors (T/M stage, ER
status and age), which exhibited relatively accurate prediction
efficiency for BRCA. The calibration curve had a satisfactory fit
for predicting the 1-, 3- and 5-year survival of patients with
BRCA. Furthermore, a subgroup analysis of the association between
KRT15 expression and clinicopathological factors was performed. Low
KRT15 expression exhibited a significant association with the T4
stage, N2 stage, infiltrating ductal carcinoma and positive
PR/ER/HER2 status. These results demonstrated that low KRT15
expression was not only positively associated with BRCA, but also
positively associated with an advanced tumor stage and more
aggressive BRCA subtype. To further assess the relationship between
KRT15 expression and OS in patients with BRCA, KM survival analysis
was performed on subgroups of patients with BRCA stratified
according to KRT15 expression levels and by clinicopathological
factors. The results revealed a significant association between low
KRT15 expression and poor OS in all of the selected clinical
subgroups. In short, these results indicated that KRT15 may be
considered a strong predictor of OS within these subgroups.
Patients with BRCA were able to be classified into low-risk and
high-risk groups according to their KRT15 expression levels.
Finally, to further validate the results from TCGA, IHC analysis
was used to determine KRT15 protein expression in BRCA. These
results also indicated that the positive KRT15 expression rate was
lower in BRCA tissues compared with that in normal tissues,
consistent with the results of the TCGA analysis.
Although the present study has provided a deeper
understanding of the relationship between KRT15 and BRCA, there are
several limitations. First, the present study was performed based
on RNA sequences obtained from one database and the
comprehensiveness of the data is not guaranteed; therefore,
controlled and multi-center trials are required. Furthermore, the
precise mechanism by which KRT15 affects the prognosis of patients
with BRCA requires further study. Finally, the diagnostic role and
therapeutic utility of KRT15 in BRCA remain to be determined and
further exploration is required to determine the potential clinical
applications of KRT15.
In conclusion, KRT15 may be an independent predictor
of favorable prognosis for patients with BRCA. It has a role in the
regulation of tumor suppressor pathways and anti-tumoral
immune-cell infiltration in BRCA. Additional research is necessary
to elucidate the underlying direct mechanisms involved in these
processes. Furthermore, follow-up studies are required to
comprehensively assess the association between KRT15 and clinical
factors of BRCA using other large databases or more than one
database. The present results suggest that KRT15 may be used as a
novel biomarker to predict the tumor stage and prognosis of
patients with BRCA, to improve treatment outcomes and as a novel
drug target.
Supplementary Material
KRT15 expression in matched
paracancerous tissues and BRCA tissues. (A) Expression levels of
KRT15 compared between matched paracancerous and BRCA samples. (B)
Pan-cancer analysis of differences in KRT15 expression across 33
cancer types between tumor and normal samples.
*P<0.05, **P<0.01,
***P*0.001; ns, P≥0.05. ACC, adrenocortical carcinoma;
BLCA, bladder urothelial carcinoma; BRCA, breast invasive
carcinoma; CESC, cervical squamous cell carcinoma and endo-cervical
adenocarcinoma; CHOL, cholangiocarcinoma; COAD, colon
adenocarcinoma; DLBC, lymphoid neoplasm diffuse large B-cell
lymphoma; ESCA, esophageal carcinoma; GBM, glioblastoma multiforme;
HNSC, head and neck squamous cell carcinoma; KICH, kidney
chromophobe; KIRC, kidney renal clear cell carcinoma; KIRP, kidney
renal papillary cell carcinoma; LAML, acute myeloid leukemia; LGG,
brain lower grade glioma; LIHC, liver hepatocellular carcinoma;
LUAD, lung adeno-carcinoma; LUSC, lung squamous cell carcinoma;
MESO, mesothelioma; OV, ovarian serous cystadenocarcinoma; PAAD,
pancreatic adenocarcinoma; PCPG, pheochromocytoma and
paraganglioma; PRAD, prostate adenocarcinoma; READ, rectum
adenocarcinoma; SARC, sarcoma; SKCM, skin cutaneous melanoma; STAD,
stomach adenocarcinoma; TGCT, testicular germ cell tumors; THCA,
thyroid carcinoma; THYM, thymoma; UCEC, uterine corpus endometrial
carcinoma; UCS, uterine carci-nosarcoma; UVM, uveal melanoma;
KRT15, keratin 15; TCGA, The Cancer Genome Atlas; TPM, transcripts
per million reads.
Nomogram and calibration plots of
KRT15. (A) Nomogram to predict the 1-, 3- and 5-year OS of patients
with breast invasive carcinoma. (B) Calibration plots of the
nomogram to predict the 1-, 3- and 5-year OS. (C) Nomogram to
predict the 1-, 3- and 5-year DSS. (D) Calibration plots of the
nomogram to predict the 1-, 3- and 5-year DSS. KRT15, keratin 15;
OS, overall survival; DSS, disease-specific survival.
Forest and KM plots of OS based on
KRT15 expression in the clinicopathological subgroups. (A) Forest
plot of the univariate Cox regression analysis on DSS for different
clinicopathological subgroups of patients with BRCA based on KRT15
expression. (B-I) KM survival plots based on KRT15 expression in
clinicopathological subgroups of patients with BRCA. (B) Age (≤60
and >60 years); (C) race (Asian, black or African American and
white); (D) histological type (infiltrating ductal carcinoma and
infiltrating lobular carcinoma); (E) anatomic neoplasm subdivisions
(left and right); (F) HER2 status (negative and positive); (G)
PAM50 subtypes (normal, LumA, LumB, HER2 and basal subtype); (H)
TP53 status (WT and Mut); and (I) PIK3CA status (WT and Mut). HRs
are presented with the 95% CI. CI, confidence interval; KM,
Kaplan-Meier; OS, overall survival; KRT15, keratin 15; DSS,
disease-specific survival; BRCA, breast invasive carcinoma; HR,
hazard ratio; TP, tumor protein; WT, wild-type; Mut, mutated; Lum,
luminal; HER2, human epidermal growth factor receptor 2; PAM50,
prediction analysis of microarray 50; PIK3CA,
phosphotidylinositol-4,5-bisphosphate 3-kinase catalytic subunit
alpha.
Signaling pathways enriched in high-
and low-keratin 15 expression groups determined by gene set
enrichment analysis.
Top three most relevant pathways
modulated by keratin 15 based on the Reactome database.
Acknowledgements
Not applicable.
Funding
The present study was financially supported by the
funds from Science and Technology Projects of Guangdong Province
(grant no. 2016A020217015), the Department of Education of
Guangdong Province (grant no. 2015KCXTD023) and the Guangzhou
University of Chinese Medicine (grant no. A3-0402-008), China.
Availability of data and materials
The datasets used and/or analyzed during the current
study are available from the corresponding author on reasonable
request.
Authors' contribution
YH and PZ designed the study. RS and HW performed a
database search with data retrieval and cleaning. PZ and ZL
performed data analysis and interpretation. XS contributed to the
supervision of the study and was involved in generating figures and
tables. PZ performed the IHC analysis of the tissue microarray and
wrote the manuscript. All authors read and approved the final
manuscript.
Ethical approval and consent to
participate
Not applicable.
Patient consent for publication
Not applicable.
Competing interest
The authors declare that they have no competing
interests.
References
|
1
|
Siegel RL, Miller KD and Jemal A: Cancer
statistics, 2019. CA Cancer J Clin. 69:7–34. 2019.PubMed/NCBI View Article : Google Scholar
|
|
2
|
Malvezzi M, Bertuccio P, Levi F, La
Vecchia C and Negri E: European cancer mortality predictions for
the year 2013. Ann Oncol. 24:792–800. 2013.PubMed/NCBI View Article : Google Scholar
|
|
3
|
Polyak K: Heterogeneity in breast cancer.
J Clin Invest. 121:3786–3788. 2011.PubMed/NCBI View
Article : Google Scholar
|
|
4
|
Klimczak M, Biecek P, Zylicz A and Zylicz
M: Heat shock proteins create a signature to predict the clinical
outcome in breast cancer. Sci Rep. 9(7507)2019.PubMed/NCBI View Article : Google Scholar
|
|
5
|
Azizi M, Ghourchian H, Yazdian F,
Bagherifam S, Bekhradnia S and Nyström B: Anti-cancerous effect of
albumin coated silver nanoparticles on MDA-MB 231 human breast
cancer cell line. Sci Rep. 7(5178)2017.PubMed/NCBI View Article : Google Scholar
|
|
6
|
Wang J, Yin H, Panandikar A, Gandhi V and
Sen S: Elevated cyclin A associated kinase activity promotes
sensitivity of metastatic human cancer cells to DNA antimetabolite
drug. Int J Oncol. 47:782–790. 2015.PubMed/NCBI View Article : Google Scholar
|
|
7
|
Masica DL and Karchin R: Correlation of
somatic mutation and expression identifies genes important in human
glioblastoma progression and survival. Cancer Res. 71:4550–4561.
2011.PubMed/NCBI View Article : Google Scholar
|
|
8
|
Liu Y, Lyle S, Yang Z and Cotsarelis G:
Keratin 15 promoter targets putative epithelial stem cells in the
hair follicle bulge. J Invest Dermatol. 121:963–968.
2003.PubMed/NCBI View Article : Google Scholar
|
|
9
|
Nagosa S, Leesch F, Putin D, Bhattacharya
S, Altshuler A, Serror L, Amitai-Lange A, Nasser W, Aberdam E,
Rouleau M, et al: microRNA-184 induces a commitment switch to
epidermal differentiation. Stem Cell Reports. 9:1991–2004.
2017.PubMed/NCBI View Article : Google Scholar
|
|
10
|
Sanchez-Palencia A, Gomez-Morales M,
Gomez-Capilla JA, Pedraza V, Boyero L, Rosell R and Fárez-Vidal ME:
Gene expression profiling reveals novel biomarkers in nonsmall cell
lung cancer. Int J Cancer. 129:355–364. 2011.PubMed/NCBI View Article : Google Scholar
|
|
11
|
Rao X, Wang J, Song HM, Deng B and Li JG:
KRT15 overexpression predicts poor prognosis in colorectal cancer.
Neoplasma. 67:410–414. 2020.PubMed/NCBI View Article : Google Scholar
|
|
12
|
Seykora JT and Cotsarelis G: Keratin
15-positive stem cells give rise to basal cell carcinomas in
irradiated Ptch1+/- mice. Cancer Cell. 19:5–6.
2011.PubMed/NCBI View Article : Google Scholar
|
|
13
|
Moon H, Zhu J, Donahue LR, Choi E and
White AC: Krt5+/Krt15+ foregut basal
progenitors give rise to cyclooxygenase-2-dependent tumours in
response to gastric acid stress. Nat Commun.
10(2225)2019.PubMed/NCBI View Article : Google Scholar
|
|
14
|
Vivian J, Rao AA, Nothaft FA, Ketchum C,
Armstrong J, Novak A, Pfeil J, Narkizian J, Deran AD,
Musselman-Brown A, et al: Toil enables reproducible, open source,
big biomedical data analyses. Nat Biotechnol. 35:314–316.
2017.PubMed/NCBI View
Article : Google Scholar
|
|
15
|
Robin X, Turck N, Hainard A, Tiberti N,
Lisacek F, Sanchez JC and Müller M: pROC: An open-source package
for R and S+ to analyze and compare ROC curves. BMC Bioinformatics.
12(77)2011.PubMed/NCBI View Article : Google Scholar
|
|
16
|
Love MI, Huber W and Anders S: Moderated
estimation of fold change and dispersion for RNA-seq data with
DESeq2. Genome Biol. 15(550)2014.PubMed/NCBI View Article : Google Scholar
|
|
17
|
Yu G, Wang LG, Han Y and He QY:
clusterProfiler: An R package for comparing biological themes among
gene clusters. OMICS. 16:284–287. 2012.PubMed/NCBI View Article : Google Scholar
|
|
18
|
Subramanian A, Tamayo P, Mootha VK,
Mukherjee S, Ebert BL, Gillette MA, Paulovich A, Pomeroy SL, Golub
TR, Lander ES and Mesirov JP: Gene set enrichment analysis: A
knowledge-based approach for interpreting genome-wide expression
profiles. Proc Natl Acad Sci USA. 102:15545–15550. 2005.PubMed/NCBI View Article : Google Scholar
|
|
19
|
Bindea G, Mlecnik B, Tosolini M,
Kirilovsky A, Waldner M, Obenauf AC, Angell H, Fredriksen T,
Lafontaine L, Berger A, et al: Spatiotemporal dynamics of
intratumoral immune cells reveal the immune landscape in human
cancer. Immunity. 39:782–795. 2013.PubMed/NCBI View Article : Google Scholar
|
|
20
|
Hänzelmann S, Castelo R and Guinney J:
GSVA: Gene set variation analysis for microarray and RNA-seq data.
BMC Bioinformatics. 14(7)2013.PubMed/NCBI View Article : Google Scholar
|
|
21
|
Sinicrope FA, Ruan SB, Cleary KR, Stephens
LC, Lee JJ and Levin B: bcl-2 and p53 oncoprotein expression during
colorectal tumorigenesis. Cancer Res. 55:237–241. 1995.PubMed/NCBI
|
|
22
|
Chu PG and Weiss LM: Keratin expression in
human tissues and neoplasms. Histopathology. 40:403–439.
2002.PubMed/NCBI View Article : Google Scholar
|
|
23
|
Giroux V, Stephan J, Chatterji P, Rhoades
B, Wileyto EP, Klein-Szanto AJ, Lengner CJ, Hamilton KE and Rustgi
AK: Mouse intestinal Krt15+ crypt cells are radio-resistant
and tumor initiating. Stem Cell Reports. 10:1947–1958.
2018.PubMed/NCBI View Article : Google Scholar
|
|
24
|
Morris RJ, Liu Y, Marles L, Yang Z,
Trempus C, Li S, Lin JS, Sawicki JA and Cotsarelis G: Capturing and
profiling adult hair follicle stem cells. Nat Biotechnol.
22:411–417. 2004.PubMed/NCBI View
Article : Google Scholar
|
|
25
|
Depianto D, Kerns ML, Dlugosz AA and
Coulombe PA: Keratin 17 promotes epithelial proliferation and tumor
growth by polarizing the immune response in skin. Nat Genet.
42:910–914. 2010.PubMed/NCBI View
Article : Google Scholar
|
|
26
|
Li S, Park H, Trempus CS, Gordon D, Liu Y,
Cotsarelis G and Morris RJ: A keratin 15 containing stem cell
population from the hair follicle contributes to squamous papilloma
development in the mouse. Mol Carcinog. 52:751–759. 2013.PubMed/NCBI View Article : Google Scholar
|
|
27
|
Wang GY, Wang J, Mancianti ML and Epstein
EH Jr: Basal cell carcinomas arise from hair follicle stem cells in
Ptch1+/- mice. Cancer Cell. 19:114–124.
2011.PubMed/NCBI View Article : Google Scholar
|
|
28
|
Sadraei NH, Shi I, Duan ZH and Shi T:
Aberrant signaling pathways in squamous cell lung carcinoma. Clin
Cancer Res. 18 (3 Suppl)(A16)2012.
|
|
29
|
Tai G, Ranjzad P, Marriage F, Rehman S,
Denley H, Dixon J, Mitchell K, Day PJ and Woolf AS: Cytokeratin 15
marks basal epithelia in developing ureters and is upregulated in a
subset of urothelial cell carcinomas. PLoS One.
8(e81167)2013.PubMed/NCBI View Article : Google Scholar
|
|
30
|
Zhang C, Liang Y, Ma MH, Wu KZ and Dai DQ:
KRT15, INHBA, MATN3, and AGT are aberrantly methylated and
differentially expressed in gastric cancer and associated with
prognosis. Pathol Res Pract. 215:893–899. 2019.PubMed/NCBI View Article : Google Scholar
|
|
31
|
Evangelista MT and North JP: Comparative
analysis of cytokeratin 15, TDAG51, cytokeratin 20 and androgen
receptor in sclerosing adnexal neoplasms and variants of basal cell
carcinoma. J Cutan Pathol. 42:824–831. 2015.PubMed/NCBI View Article : Google Scholar
|
|
32
|
Weisfelner ME and Gottlieb AB: The role of
apoptosis in human epidermal keratinocytes. J Drugs Dermatol.
2:385–391. 2003.PubMed/NCBI
|
|
33
|
Elias PM: Stratum corneum defensive
functions: An integrated view. J Invest Dermatol. 125:183–200.
2005.PubMed/NCBI View Article : Google Scholar
|
|
34
|
Lippens S, Denecker G, Ovaere P,
Vandenabeele P and Declercq W: Death penalty for keratinocytes:
Apoptosis versus cornification. Cell Death Differ. 12 (Suppl
2):S1497–S1508. 2005.PubMed/NCBI View Article : Google Scholar
|
|
35
|
Moody CA and Laimins LA: Human
papillomavirus oncoproteins: Pathways to transformation. Nat Rev
Cancer. 10:550–560. 2010.PubMed/NCBI View Article : Google Scholar
|
|
36
|
Yi R, Poy MN, Stoffel M and Fuchs E: A
skin microRNA promotes differentiation by repressing ‘stemness’.
Nature. 452:225–229. 2008.PubMed/NCBI View Article : Google Scholar
|
|
37
|
Lane DP: Cancer p53, guardian of the
genome. Nature. 358:15–16. 1992.PubMed/NCBI View Article : Google Scholar
|
|
38
|
Kandoth C, McLellan MD, Vandin F, Ye K,
Niu B, Lu C, Xie M, Zhang Q, McMichael JF, Wyczalkowski MA, et al:
Mutational landscape and significance across 12 major cancer types.
Nature. 502:333–339. 2013.PubMed/NCBI View Article : Google Scholar
|
|
39
|
Farhan M, Wang H, Gaur U, Little PJ, Xu J
and Zheng W: FOXO signaling pathways as therapeutic targets in
cancer. Int J Biol Sci. 13:815–827. 2017.PubMed/NCBI View Article : Google Scholar
|
|
40
|
Napoli M and Flores ER: The family that
eats together stays together: New p53 family transcriptional
targets in autophagy. Genes Dev. 27:971–974. 2013.PubMed/NCBI View Article : Google Scholar
|
|
41
|
Napoli M and Flores ER: The p53 family
orchestrates the regulation of metabolism: Physiological regulation
and implications for cancer therapy. Br J Cancer. 116:149–155.
2017.PubMed/NCBI View Article : Google Scholar
|
|
42
|
Prokhorova EA, Zamaraev AV, Kopeina GS,
Zhivotovsky B and Lavrik IN: Role of the nucleus in apoptosis:
Signaling and execution. Cell Mol Life Sci. 72:4593–4612.
2015.PubMed/NCBI View Article : Google Scholar
|
|
43
|
Vaughan-Shaw PG, O'Sullivan F, Farrington
SM, Theodoratou E, Campbell H, Dunlop MG and Zgaga L: The impact of
vitamin D pathway genetic variation and circulating
25-hydroxyvitamin D on cancer outcome: Systematic review and
meta-analysis. Br J Cancer. 116:1092–1110. 2017.PubMed/NCBI View Article : Google Scholar
|
|
44
|
Ferrer-Mayorga G, Gómez-López G,
Barbáchano A, Fernández-Barral A, Peña C, Pisano DG, Cantero R,
Rojo F, Muñoz A and Larriba MJ: Vitamin D receptor expression and
associated gene signature in tumour stromal fibroblasts predict
clinical outcome in colorectal cancer. Gut. 66:1449–1462.
2017.PubMed/NCBI View Article : Google Scholar
|
|
45
|
Carrasco-Garcia E, Moreno M, Moreno-Cugnon
L and Matheu A: Increased Arf/p53 activity in stem cells, aging and
cancer. Aging Cell. 16:219–225. 2017.PubMed/NCBI View Article : Google Scholar
|
|
46
|
Strasser A, O'Connor L and Dixit VM:
Apoptosis signaling. Annu Rev Biochem. 69:217–245. 2000.PubMed/NCBI View Article : Google Scholar
|
|
47
|
Wang Q and Liu J: Regulation and immune
function of IL-27. Adv Exp Med Biol. 941:191–211. 2016.PubMed/NCBI View Article : Google Scholar
|
|
48
|
Dai YJ, Hu F, Li H, Huang HY, Wang DW and
Liang Y: A profiling analysis on the receptor ACE2 expression
reveals the potential risk of different type of cancers vulnerable
to SARS-CoV-2 infection. Ann Transl Med. 8(481)2020.PubMed/NCBI View Article : Google Scholar
|
|
49
|
Lin TC, Yeh YM, Fan WL, Chang YC, Lin WM,
Yang TY and Hsiao M: Ghrelin upregulates oncogenic Aurora A to
promote renal cell carcinoma invasion. Cancers (Basel).
11(303)2019.PubMed/NCBI View Article : Google Scholar
|
|
50
|
Zhang J and Xie T: Ghrelin inhibits
cisplatin-induced MDA-MB-231 breast cancer cell apoptosis via
PI3K/Akt/mTOR signaling. Exp Ther Med. 19:1633–1640.
2020.PubMed/NCBI View Article : Google Scholar
|
|
51
|
Orange JS: Natural killer cell deficiency.
J Allergy Clin Immunol. 132:515–525. 2013.PubMed/NCBI View Article : Google Scholar
|
|
52
|
Smyth MJ, Crowe NY and Godfrey DI: NK
cells and NKT cells collaborate in host protection from
methylcholanthrene-induced fibrosarcoma. Int Immunol. 13:459–463.
2001.PubMed/NCBI View Article : Google Scholar
|
|
53
|
Smyth MJ, Thia KY, Street SE, Cretney E,
Trapani JA, Taniguchi M, Kawano T, Pelikan SB, Crowe NY and Godfrey
DI: Differential tumor surveillance by natural killer (NK) and NKT
cells. J Exp Med. 191:661–668. 2000.PubMed/NCBI View Article : Google Scholar
|
|
54
|
Caligiuri MA: Human natural killer cells.
Blood. 112:461–469. 2008.PubMed/NCBI View Article : Google Scholar
|
|
55
|
Müller-Hermelink N, Braumüller H, Pichler
B, Wieder T, Mailhammer R, Schaak K, Ghoreschi K, Yazdi A, Haubner
R, Sander CA, et al: TNFR1 signaling and IFN-gamma signaling
determine whether T cells induce tumor dormancy or promote
multistage carcinogenesis. Cancer Cell. 13:507–518. 2008.PubMed/NCBI View Article : Google Scholar
|
|
56
|
Böttcher JP, Bonavita E, Chakravarty P,
Blees H, Cabeza-Cabrerizo M, Sammicheli S, Rogers NC, Sahai E,
Zelenay S, Reis E and Sousa C: NK cells stimulate recruitment of
cDC1 into the tumor microenvironment promoting cancer immune
control. Cell. 172:1022–1037.e14. 2018.PubMed/NCBI View Article : Google Scholar
|
|
57
|
Fannon M, Forsten-Williams K, Dowd CJ,
Freedman DA, Folkman J and Nugent MA: Binding inhibition of
angiogenic factors by heparan sulfate proteoglycans in aqueous
humor: Potential mechanism for maintenance of an avascular
environment. FASEB J. 17:902–904. 2003.PubMed/NCBI View Article : Google Scholar
|
|
58
|
Gooch JL, Lee AV and Yee D: Interleukin 4
inhibits growth and induces apoptosis in human breast cancer cells.
Cancer Res. 58:4199–4205. 1998.PubMed/NCBI
|
|
59
|
Bruno TC: New predictors for immunotherapy
responses sharpen our view of the tumour microenvironment. Nature.
577:474–476. 2020.PubMed/NCBI View Article : Google Scholar
|
|
60
|
Petitprez F, de Reyniès A, Keung EZ, Chen
TW, Sun CM, Calderaro J, Jeng YM, Hsiao LP, Lacroix L, Bougoüin A,
et al: B cells are associated with survival and immunotherapy
response in sarcoma. Nature. 577:556–560. 2020.PubMed/NCBI View Article : Google Scholar
|
|
61
|
Helmink BA, Reddy SM, Gao J, Zhang S,
Basar R, Thakur R, Yizhak K, Sade-Feldman M, Blando J, Han G, et
al: B cells and tertiary lymphoid structures promote immunotherapy
response. Nature. 577:549–555. 2020.PubMed/NCBI View Article : Google Scholar
|
|
62
|
Zhu J, Yamane H and Paul WE:
Differentiation of effector CD4 T cell populations (*). Annu Rev
Immunol. 28:445–489. 2010.PubMed/NCBI View Article : Google Scholar
|
|
63
|
Aspord C, Pedroza-Gonzalez A, Gallegos M,
Tindle S, Burton EC, Su D, Marches F, Banchereau J and Palucka AK:
Breast cancer instructs dendritic cells to prime interleukin
13-secreting CD4+ T cells that facilitate tumor
development. J Exp Med. 204:1037–1047. 2007.PubMed/NCBI View Article : Google Scholar
|
|
64
|
He D, Li H, Yusuf N, Elmets CA, Li J,
Mountz JD and Xu H: IL-17 promotes tumor development through the
induction of tumor promoting microenvironments at tumor sites and
myeloid-derived suppressor cells. J Immunol. 184:2281–2288.
2010.PubMed/NCBI View Article : Google Scholar
|
|
65
|
Todaro M, Lombardo Y, Francipane MG, Alea
MP, Cammareri P, Iovino F, Di Stefano AB, Di Bernardo C, Agrusa A,
Condorelli G, et al: Apoptosis resistance in epithelial tumors is
mediated by tumor-cell-derived interleukin-4. Cell Death Differ.
15:762–772. 2008.PubMed/NCBI View Article : Google Scholar
|
|
66
|
Liu X, Mo W, Ye J, Li L, Zhang Y, Hsueh
EC, Hoft DF and Peng G: Regulatory T cells trigger effector T cell
DNA damage and senescence caused by metabolic competition. Nat
Commun. 9(249)2018.PubMed/NCBI View Article : Google Scholar
|
|
67
|
Wang L, Yi T, Kortylewski M, Pardoll DM,
Zeng D and Yu H: IL-17 can promote tumor growth through an
IL-6-Stat3 signaling pathway. J Exp Med. 206:1457–1464.
2009.PubMed/NCBI View Article : Google Scholar
|