Introduction
Over the past decade, the incidence of type 2
diabetes has been increasing rapidly (1). Studies have shown that the number of
adults suffering from diabetes worldwide in 2015 was ~425 million.
If this trend continues, by 2040, the number will reach 629 million
(2). Although a wide variety
factors can influence the onset of this disease, insulin resistance
is wide accepted to be the leading cause (3). Long non-coding RNAs (lncRNAs) are a
type of non-coding RNAs that are >200 nucleotides in length and
account for 80% of all non-coding RNAs (4). The majority of lncRNAs are conserved
and expressed at lower levels than mRNAs (5). Previous studies have reported that
lncRNAs in combination with microRNAs (miR or miRNA), mRNAs or
proteins can coordinate to regulate gene expression and serve an
important role in insulin resistance in humans (6,7). In
addition, lncRNAs have been shown to be potential novel biomarkers
and therapeutic targets. LncRNA maternally expressed gene 3 (MEG3)
is involved in gluconeogenesis. However, lncRNA metastasis
associated lung adenocarcinoma transcript 1 (MALAT1) can even
affect the insulin signaling pathway and correlate with hepatic
de novo lipogenesis (8).
Metformin (MET) is a first-line therapeutic option
for newly diagnosed patients with type 2 diabetes (9). It functions by suppressing liver
gluconeogenesis, which in turn decreases blood glucose levels
(10). Studies have previously
documented that in rats and cells insulin resistance models, MET
can effectively improve insulin resistance via the p53/RAP2A
pathway (11). In addition, MET
can also alleviate lipid composition in adipose tissues of
diet-induced insulin resistant rats (12). In addition, Wang et al
revealed that MET can inhibit gluconeogenesis of primary mouse
hepatocytes by upregulating lncRNA NR_027710 and downregulating
lncRNA ENSMUST00000138573(13).
However, the potential mechanism of lncRNAs in the effects of MET
on hepatic insulin resistance remains poorly understood. In
addition, it remains unknown if MET can exert changes in the
expression of lncRNAs on hepatic insulin resistance. Therefore, in
the present study, C57BL/6J mice were fed with high-fat diet to
establish insulin resistance model and treatment with MET. A
high-throughput sequencing analysis was conducted and AML12 cells
were treated with PA to establish insulin resistance model in
vitro. Subsequently, the effects of MET on lncRNA expression
and the mechanism of MET in improving hepatic insulin resistance by
regulating lncRNA were investigated.
Materials and methods
In vivo animal models
A total of 42 6-week-old (weight, 22.4±0.6 g) male
C57BL/6J mice from Beijing Vital River Laboratory Animal Technology
Co., Ltd. [license no. SCXK(Jing)2016-0011]. They were kept in the
Clinical Research Center of Hebei General Hospital (Shijiazhuang,
China) at a temperature of 23-25˚C and relative humidity of ~60%
with a 12-h light/dark cycle. All mice had free access to food and
water. This experiment was approved by the Ethics Committee of
Hebei General Hospital and complied with the Animal (Scientific
Procedures) Act 1986 and associated guidelines (14).
After 1 week of adaptive feeding, the 42 C57BL/6J
mice were randomly divided into two groups. In total, 14 mice were
assigned into the control group (CON), which were fed with a
regular diet (D12450J formula, consisting of 20% protein, 70%
carbohydrate, 10% fat and 3.85 kcal/g). By contrast, 28 mice were
assigned into the high-fat diet (HFD) group (D12492 formula,
consisting of 20% protein, 20% carbohydrate, 60% fat and 5.24
kcal/g) (15). All feed was
purchased from Beijing Huafukang Biotechnology Co, Ltd. Body weight
and food intake were recorded weekly [food intake (kcal/day)=the
total food intake of mice in each group weekly (g) x food calories
(kcal/g)/(the number of mice in each group x7 days)]. After 8 weeks
of feeding, blood was collected from the tail vein at 0, 15, 30, 60
and 120 min after intraperitoneal glucose injection for the
intraperitoneal glucose tolerance test (IPGTT). Area under the
curve (AUC) was calculated to compare glucose tolerance between the
two groups, which was the sum of the four trapezoidal areas under
the curve (the side length is the blood glucose value at different
time points, the height is the time of IPGTT and the AUC value is
the sum of the four trapezoidal areas under the curve). The insulin
sensitivity method developed by Katz et al (16) was used, which defined the
quantitative insulin sensitivity check index (QUICKI) as 1/[log
(I0) + log(G0)], where I0 is the
fasting insulin level and G0 is the fasting glucose
level.
Among the 28 mice in the HFD group, 14 mice were
randomly assigned into the HFD + MET group. A MET (Sangon Biotech
Co., Ltd.) stock solution was prepared by first mixing 200 mg MET
with 1 ml of triple-distilled water, which was then diluted with
0.9% NaCl. Mice in the HFD + MET group were given 200 mg/kg MET
daily by oral gavage for 6 weeks (17), whereas mice in the CON and HFD
groups were given the same volume of 0.9% NaCl for 6 weeks.
Collection of serum and tissue
specimens
After 6 weeks of MET intervention, three mice in
each group were randomly selected before an intraperitoneal
injection of 1.5 U/40 g insulin (Sigma-Aldrich; Merck KGaA). The
mice were then anesthetized by an intraperitoneal injection of 2%
sodium pentobarbital (45 mg/kg). After the eyeballs were removed
and blood samples were collected, the animals were sacrificed by
dislocating the cervical vertebrae under anesthesia. The liver was
then quickly removed, snap frozen in liquid nitrogen and stored at
-80˚C. The blood samples were centrifuged at 5,000 x g for 15 min
at 4˚C before the serum was stored at -80˚C.
Determination of blood indicators
Detection kits for triglyceride (TG; cat. no.
A110-1-1), total cholesterol (TC; cat. no. A111-1-1),
high-density-lipoprotein cholesterol (HDL-C; cat. no. A112-1-1),
free fatty acid (FFA; cat. no. A042-2-1) and
low-density-lipoprotein cholesterol (LDL-C; cat. no. A113-1-1) were
purchased from Nanjing Jiancheng Bioengineering Institute. An
insulin chemiluminescence ELISA kit (cat. no. H203-1-2; ALPCO) was
used to measure the levels of serum insulin. All procedures were
performed in accordance with the manufacturers' protocols.
Establishment of in vitro models and
transfections Preparation of the transfection complex
In total, three siRNA sequences
(NONMMUT031874.2-1368 sense, 5'-CCUGUAGACCACUUGGAAATT-3', and
antisense, 5'UUUCCAAGUGGUCUACAGGTT-3'; NONMMUT031874.2-1502 sense,
5'-GCAGUGUGUCUACUGUAUUTT-3', and antisense
5'-AAUACAGUAGACACACUGCTT-3'; NONMMUT031874.2-1739 sense,
5'-GCAGGAGCUUUGCAGCAUATT-3', and antisense
5'-UAUGCUGCAAAGCUCCUGCTT-3') and siRNA-NONMMUT031874.2 negative
control sequence (sense, 5'-UUCUCCGAACGUGUCACGUTT-3', and
antisense, 5'-ACGUGACACGUUCGGAGAATT-3') were purchased from Suzhou
GenePharma Co., Ltd. Transfection was performed when the cells were
at ~60% confluency. DEPC water (125 µl) was added to each siRNA to
prepare a RNA oligo stock solution of 20 µM, which was stored at
-20˚C. In total, 200 µl Opti-MEM (Thermo Fisher Scientific, Inc.),
5 µl RNA oligo stock solution and 10 µl siRNA-Mate transfection
reagent (Suzhou GenePharma Co., Ltd.) were used to prepare the
transfection complex at room temperature. Once the transfection
complex was formed, it was added to the cells immediately.
Establishment of cell model and cell
viability assay
A mouse hepatic cell line AML12 was purchased from
The Cell Bank of Type Culture Collection of the Chinese Academy of
Sciences. These cells were cultured at 37˚C under 5% CO2
with DMEM/F-12 medium (Gibco; Thermo Fisher Scientific, Inc.)
supplemented with 10% FBS (Gibco; Thermo Fisher Scientific, Inc.),
1X insulin-transferrin-selenium (Sigma-Aldrich; Merck KGaA) and 40
ng/ml dexamethasone (Sigma-Aldrich; Merck KGaA).
To establish the insulin resistance model, 0.25 mM
palmitic acid (PA; Sigma-Aldrich; Merck KGaA) at room temperature
was added to the DMEM/F-12 medium (18), before the glucose concentration in
the medium was determined at 0, 8, 16 and 24 h using a glucose
oxidase assay kit (Applygen Technologies, Inc.) to assess
establishment of the insulin resistance model. After cells were
~80% confluent, MET at concentrations of 0.1, 0.5, 1 and 2 mM at
room temperature was added to the culture medium for 24 h (19). Subsequently, 10 µl Cell Counting
Kit (CCK)-8 was added into each well. The culture plates were put
into the 37˚C incubator for 30 min to 4 h and OD value was measured
at 450 nm with a microplate reader. The cell survival rate was
calculated using a CCK (Dojindo Molecular Technologies, Inc.) in
accordance with the manufacturer's instructions. Cell survival
rate=[(As-Ab)/(Ac-Ab)]x100% (where As=the OD value of culture
medium contained cells treated with different concentrations of
metformin and CCK-8; Ac=the OD value of culture medium contained
cells treated without metformin but with CCK-8; and Ab=the OD value
of culture medium contained without cells but with CCK-8).
Transfection efficiency
To determine the transfection efficiency of the
three different siRNAs, AML12 cells were cultured in 12-well plates
and divided into control (the cells without siRNA), siRNA1, siRNA2
and siRNA3 groups. The three different siRNA transfection complexes
at a concentration of 50 nM were added to the medium. Transfection
efficiency of the different siRNAs was tested by reverse
transcription-quantitative PCR after transfection for 24 h to
determine the optimal siRNA for use in subsequent experiments.
Transfection and treatment
The AML12 cells were seeded into six-well plates
when reached ~40% confluency at 37˚C and divided into CON, PA, PA +
siRNA-NONMMUT031874.2 negative control (PA + siRNA-NC), PA +
siRNA-NONMMUT031874.2 knockdown (PA + siRNA-NONMMUT031874.2) and PA
+ MET 1 mM groups (PA + MET). Transfection was performed when cells
reached ~60% confluency. A total of 24 h after transfection, PA and
MET were added to the corresponding groups for an additional 24 h
at 37˚C before glucose concentration was measured using the glucose
oxidase assay kit. RNA was also extracted for RT-qPCR and the cells
were stimulated with insulin for 40 min at 37˚C in order to
stimulate the expression of phosphorylation indicators of the
insulin signaling pathway. Protein was extracted for western blot
analysis.
Western blotting
Total protein was extracted from the liver tissues
using RIPA buffer (Wuhan Servicebio Technology Co., Ltd.) and the
protein concentration was determined using a BCA kit (Thermo Fisher
Scientific, Inc.) Different concentrations of SDS-PAGE separation
gel (8,10 and 12%) were prepared according to different molecular
weights of the target proteins. After electrophoresis, proteins
(amount of liver tissue protein loaded per lane was 40 µg; amount
of cell protein loaded per lane was 30 µg) were transferred onto
PVDF membranes. The membranes were blocked with 5% skimmed milk at
room temperature for 2 h and incubated with primary antibodies
overnight at 4˚C. The membranes were then washed three times with
Tris-buffered saline Tween-20 (20%) solution and incubated with
secondary antibodies [HRP-labeled goat anti-rabbit IgG antibody
(1:8,000; cat. no. L3012-2) or goat anti-mouse IgG antibody
(1:3,000; cat. no. L3032-2), all purchased from Signalway Antibody
LLC] at room temperature for ~50 min. The membranes were washed and
immersed in chemiluminescence solution (cat. no. G2014; Beijing
Solarbio Science & Technology Co., Ltd.) for about 2 min before
images were acquired. Image J software 1.8.0 (National Institutes
of Health) was used to calculate the grayscale value of the
developed images. The primary antibodies used were diluted as
follows: β-actin (mouse antibody; 1:1,000; cat. no. 3700S); AKT
(rabbit antibody; 1:2,000; cat. no. 9272S); phosphorylated (p-)AKT
(Ser473) (rabbit antibody; 1:1,000; cat. no. 4060S); PI3K (rabbit
antibody; 1:1,000; cat. no. 4249S); p-PI3K (rabbit antibody,
1:2,000; cat. no. 4228S); phosphoenolpyruvate carboxykinase (PEPCK;
rabbit antibody; 1:2,000; cat. no. 6924S) and suppressor of
cytokine signaling 3 (SOCS3; rabbit antibody; 1:1,000; cat. no.
52113S). All primary antibodies were purchased from Cell Signaling
Technology, Inc.
Total RNA, miRNA and lncRNA extraction
and RT-qPCR
Total RNA was extracted from the mouse liver tissues
(from CON group, HFD group and HFD + MET group) using the RNAsimple
Total RNA Kit (Tiangen Biotech Co., Ltd.), before RNA concentration
was determined using the NanoDrop® 2000 (Thermo Fisher
Scientific, Inc.). RNA was reverse transcribed into cDNA using a
PrimeScript™ RT reagent kit with gDNA Eraser (cat. no.
RR047A). Amplification was performed using a SYBR®
Premix Ex Taq™ II kit (cat. no. RR820A) with an Applied
Biosystems 7500 Real-Time PCR System (Thermo Fisher Scientific,
Inc.). The PCR conditions were: 95˚C for 10 min, followed by 40
cycles at 95˚C for 15 sec, 95˚C for 15 sec and 60˚C for 30 sec.
miRNA was extracted from the mouse liver tissues (from CON group,
HFD group and HFD + MET group) using the miRNA extraction and
isolation kit (Tiangen Biotech Co., Ltd.). RNA concentration was
determined using NanoDrop® 2000 and cDNA was generated
from total RNA using a miRcute Plus miRNA First-Strand cDNA Kit
from Tiangen Biotech Co., Ltd. Reactions were performed and
assessed by qPCR in the Applied Biosystems 7500 Real-Time PCR
System using the miRcute Plus miRNA qPCR Kit (Tiangen Biotech Co.,
Ltd.). The PCR conditions were: 95˚C for 15 min, followed by 40
cycles at 94˚C for 20 sec, 94˚C for 20 sec and 60˚C for 34 sec.
lncRNA was extracted and RNA concentration was determined as total
RNA and cDNA was generated from total RNA using a lnRcute lncRNA
First-Strand cDNA Synthesis Kit (With gDNase) from Tiangen Biotech
Co., Ltd. Reactions were performed and assessed by qPCR in the
Applied Biosystems 7500 Real-Time PCR System using the lnRcute
lncRNA qPCR kit (Tiangen Biotech Co., Ltd.). The PCR conditions
were: 95˚C for 3 min, followed by 40 cycles at 95˚C for 5 sec, 60˚C
for 10 sec and 72˚C for 15 sec. Target gene expression levels were
normalized to those of β-actin mRNA using the 2-ΔΔCq
method (20). The sequences of the
primers used for qPCR in the present study are listed in Table I.
 | Table IReverse transcription-quantitative
PCR primers used in the present study. |
Table I
Reverse transcription-quantitative
PCR primers used in the present study.
| Gene | Forward primer
(5'-3') | Reverse primer
(5'-3') |
|---|
| β-actin |
GTGACGTTGACATCCGTAAAGA |
GTAACAGTCCGCCTAGAAGCAC |
|
NONMMUT031874.2 |
ATTTGCGTGGGACTTATCTTCAG |
GAGTTAGGCTGGGTGAAGGAGA |
|
NONMMUT149180.1 |
TTTATGGGCTGAAACAGGTGC |
GGGCAAGAAGTCACCTGGAGT |
|
NONMMUT153838.1 |
CGTGTAAATGCCTGTTGAGTGG |
ATAGGGACTGAACACCTGATGCC |
|
NONMMUT119418.1 |
CATTCTAAGGCTGTCTAAGGGTGA |
CTCAGGTTAGCAGGAGGTTGG |
|
NONMMUT051032.2 |
CAGAATGGTAATGTGGACAGGAAG |
AGGATAGGGATGGTGGCAAAGT |
|
NONMMUT153848.1 |
TGATGAAAGAGGTCAACGGGAT |
TCATAACAGGTCCCTTGGCAGT |
|
NONMMUT026710.2 |
CCCAGTAATCACTCAGGCACAA |
CGTTTATCTTTCTCCTGTTCCCTC |
|
microRNA-7054-5p |
ACACTCCAGCTGGGTAGG |
CTCAACTGGTGTCGTGGAGTCG |
| |
AAGGTGGTTGGGCTG |
GCAATTCAGTTGAGAGTACTCA |
| U6 |
CTCGCTTCGGCAGCACA |
AACGCTTCACGAATTTGCGT |
| AKT |
AAGGAGGTCATCGTCGCCAA |
ACAGCCCGAAGTCCGTTATC |
| PI3K |
AAACTCCGAGACACTGCTGATG |
GCTGGTATTTGGACACTGGGTAG |
|
Glucose-6-phosphatase
catalytic-subunit |
ATCTTGTGGTTGGGATTCTGGG |
CTGACAAGACTCCAGCCACGAC |
| Suppressor of
cytokine signaling 3 |
CGCCCCCAGAATAGATGTAGTA |
GACCAAGAACCTACGCATCCA |
| Phosphoenolpyruvate
carboxykinase |
GTGTTTACTGGGAAGGCATCG |
ACACCTTCAGGTCTACGGCCA |
High-throughput sequencing
To obtain the hepatic gene expression profile after
metformin treatment, four mice were randomly selected from each
group for high-throughput sequencing. Total RNA from liver tissue
was extracted in accordance with the RNeasy Mini kit protocol
(Qiagen GmbH). The extracted total RNA was quality inspected using
the Agilent Bioanalyzer 2100 (Agilent Technologies, Inc.) and
quantified using a Qubit® 3.0 Fluorometer and
NanoDrop® One spectrophotometer. TruSeq™ RNA
Sample Preparation Kit (Illumina, Inc.) was used to construct a
sequencing library. In accordance with the instructions of Illumina
NovaSeq 6000 (Illumina, Inc.), reagents for sequencing (NovaSeq
5000/6000, S4 300 Cycle; cat. no. 20012866; Illumina, Inc.) were
prepared. Paired-end sequencing was performed (lncRNA ≥200 nt).
Clusters were generated by cBot after the library was diluted to 10
pM and then were sequenced on the Illumina NovaSeq 6000 platform
(Illumina, Inc.). The fragments of each gene segment were counted
after comparison using the Stringtie software (version: 1.3.0;
Johns Hopkins University, Baltimore, MD, USA) and normalized by
using TMM (trimmed mean of M values) algorithm (http://www.kegg.jp/), before the fragments per
kilobase million (FPKM) value of each gene was calculated.
High-throughput sequencing results were uploaded onto the GEO
database under the accession number GSE137840.
Analysis of differential lncRNA and
mRNA expression
Differentially-expressed genes in each group were
determined using the edge package for R (21) (version R-3.4.3) based on the FPKM
value. The threshold values of the P-values were then adjusted by
controlling for the false discovery rate. LncRNAs and mRNAs were
considered to be differentially expressed at P<0.05 and the
absolute value of Log2(fold-change) was >1.
Functional group analysis
The Gene Ontology (GO) (22) and the Kyoto Encyclopedia of Genes
and Genomes (KEGG) (23) pathways
determined the potential role of the lncRNAs that were co-expressed
with the differentially expressed mRNAs. The GO analysis was
conducted to establish significant annotations of genes and gene
products in diversified organisms using the DAVID database
(http://david.abcc.ncifcrf.gov). In
addition, the KEGG pathway analysis was used to identify
differentially expressed mRNAs in enriched pathways. After the
calculated P-value was corrected by multiple hypothesis testing, a
Q-value ≤0.05 was used as the threshold. Meeting this condition was
defined as the GO and KEGG results that were significantly enriched
for differentially expressed genes.
Clustering heat map
Heatmap was plotted by http://www.bioinformatics.com.cn, a free online
platform for data analysis and visualization.
Venn diagrams
Venny (2.1.0; https://bioinfogp.cnb.csic.es/tools/venny/index.html)
was used to make the Venn diagrams.
Construction of LncRNA-miRNA-mRNA
co-expression network
The present study used Cytoscape (version 3.8.2) is
a network visualization software with multiple applications for
network analysis. It can be downloaded for free from http://www.cytoscape.org/.
Statistical analysis
SPSS v26.0 software (IBM Corp.) was used for
statistical analyzes. The results were expressed as the mean ±
standard deviation. An independent samples t-test (Student's
t-test) was used for two-sample comparisons and one-way analysis of
variance (ANOVA) followed by Bonferroni's multiple comparison test
or Tamhane's multiple comparison test for multiple-sample analysis
if the data was normally distributed. One-Sample K-S Test to test
the normality of this data. Differences were considered to be
statistically significant at P<0.05.
Results
Differential expression of lncRNAs and
mRNAs
The expression levels of lncRNAs and mRNAs in the
livers of mice were determined using high-throughput sequencing and
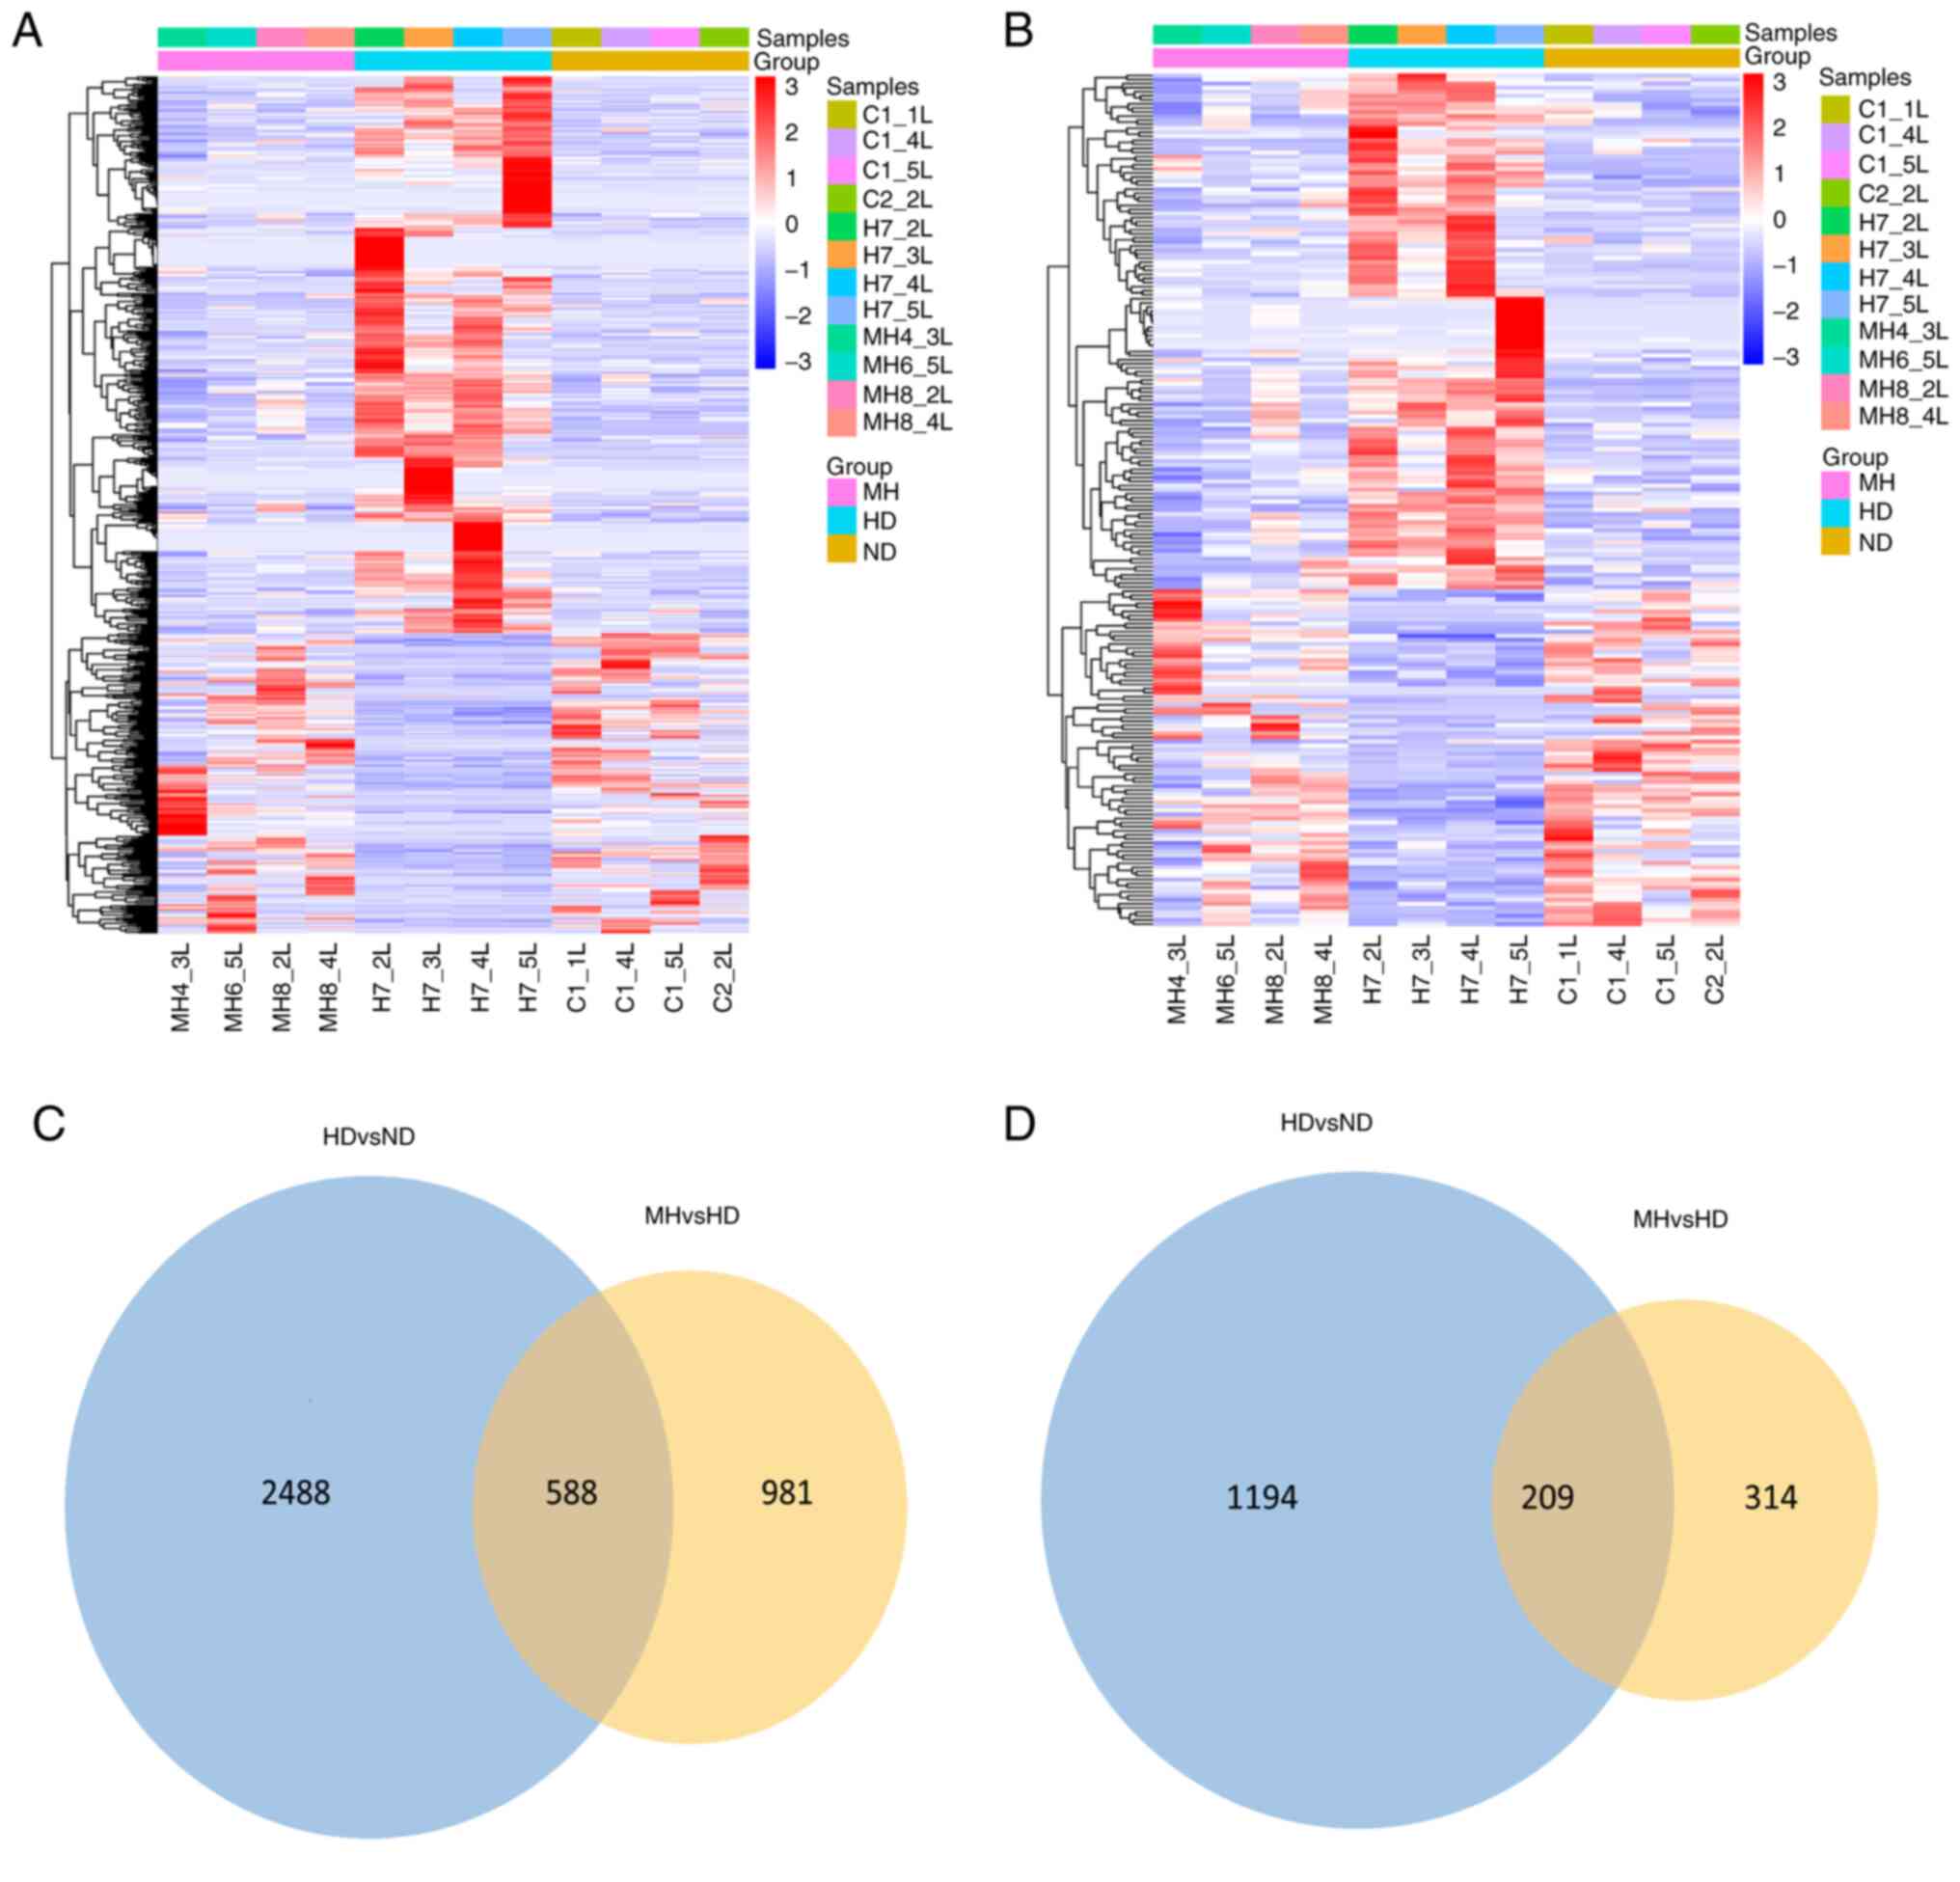
comparisons were made between the groups. Compared with the CON
group, the HFD group had 3,076 differentially-expressed lncRNAs
(1,823 upregulated and 1,253 downregulated) and 1,403
differentially-expressed mRNAs (892 upregulated and 511
downregulated). Compared with the HFD group, the HFD + MET group
had 1,569 differentially-expressed lncRNAs (702 upregulated and 867
downregulated) and 523 differentially-expressed mRNAs (216
upregulated and 307 downregulated). Clustering heat map (Fig. 1A and B) was used to reveal the trend
distribution of lncRNAs and mRNAs with a differential expression
[red area contains upregulated lncRNA or mRNA with P<0.05 and
Log2(fold-change)>1; blue area contains downregulated lncRNA or
mRNA with P<0.05 and Log2(fold-change)<-1]. Among the 3,076
differentially-expressed lncRNAs and 1,403 differentially-expressed
mRNAs in the HFD group compared with the CON group, there were 588
lncRNAs and 209 mRNAs reversed by MET (Fig. 1C and D). Moreover, among the upregulated
lncRNAs and mRNAs in the HFD group compared with those in the CON
group, 386 lncRNAs and 127 mRNAs were downregulated in the HFD +
MET group. Among the lncRNAs and mRNAs found to be downregulated in
the HFD group compared with those in the CON group, 202 lncRNAs and
82 mRNAs were upregulated in the HFD + MET group (Tables SI and SII). The top 30 differentially expressed
lncRNAs and mRNAs are listed in Tables II and III.
| Table IITop 30 differentially-expressed
lncRNAs found in mice fed with ND, HD or MH.a |
Table II
Top 30 differentially-expressed
lncRNAs found in mice fed with ND, HD or MH.a
| A, HD vs. ND |
|---|
| LncRNA_ID |
Log2FC | P-value | Up- or
downregulated |
|---|
|
NONMMUT149179.1 | 4.587344 |
4.11x10⁻¹⁶ | Up |
|
NONMMUT031874.2 | 4.412077 |
3.40x10⁻¹⁵ | Up |
|
NONMMUT153837.1 | 3.509002 |
6.13x10⁻¹⁵ | Up |
|
NONMMUT139818.1 | 4.700016 |
2.20x10⁻¹⁴ | Up |
|
NONMMUT031873.2 | 4.846336 |
8.05x10⁻¹⁴ | Up |
|
ENSMUST00000199788 | 7.080694 |
1.14x10⁻¹³ | Up |
|
ENSMUST00000212322 | 6.351815 |
1.97x10⁻¹² | Up |
|
NONMMUT149177.1 | 4.814471 |
2.01x10⁻¹¹ | Up |
|
NONMMUT152909.1 | 3.385954 |
2.45x10⁻¹⁰ | Up |
|
NONMMUT149180.1 | 3.426143 |
3.69x10⁻¹⁰ | Up |
|
ENSMUST00000118437 | 4.989526 |
6.86x10⁻¹⁰ | Up |
|
NONMMUT153838.1 | 2.507940 |
9.24x10⁻¹⁰ | Up |
|
NONMMUT119417.1 | 4.483789 |
1.03x10⁻⁹ | Up |
|
NONMMUT008655.2 | 2.726889 |
5.37x10⁻⁹ | Up |
|
NONMMUT140831.1 | 4.278518 |
8.18x10⁻⁹ | Up |
|
NONMMUT067810.2 | 2.177739 |
1.45x10⁻⁸ | Up |
|
NONMMUT119419.1 | 4.715676 |
2.90x10⁻⁸ | Up |
|
NONMMUT011659.2 | 4.924532 |
3.28x10⁻⁸ | Up |
|
NONMMUT119418.1 | 3.196553 |
3.98x10⁻⁸ | Up |
|
NONMMUT058749.2 | 2.983326 |
1.03x10⁻⁷ | Up |
|
NONMMUT029338.2 | 3.507321 |
1.07x10⁻⁷ | Up |
|
NONMMUT152911.1 | 3.175219 |
1.20x10⁻⁷ | Up |
|
NONMMUT153839.1 | 2.507771 |
1.27x10⁻⁷ | Up |
|
NONMMUT146050.1 | 4.117007 |
1.56x10⁻⁷ | Up |
|
NONMMUT145134.1 | 3.648683 |
2.30x10⁻⁷ | Up |
|
NONMMUT003116.2 | 3.639365 |
2.67x10⁻⁷ | Up |
|
NONMMUT149178.1 | 4.336275 |
3.12x10⁻⁷ | Up |
|
NONMMUT153832.1 | 2.498095 |
4.72x10⁻⁷ | Up |
|
ENSMUST00000217474 | 2.698023 |
5.98x10⁻⁷ | Up |
|
NONMMUT067813.2 | 2.012964 |
7.68x10⁻⁷ | Up |
|
NONMMUT112513.1 | -3.870333 |
4.92x10⁻² | Down |
|
NONMMUT028525.2 | -2.981792 |
4.84x10⁻² | Down |
|
NONMMUT051032.2 | -2.139169 |
4.80x10⁻² | Down |
|
ENSMUST00000100370 | -1.840982 |
4.60x10⁻² | Down |
|
NONMMUT030701.2 | -1.475667 |
4.55x10⁻² | Down |
|
NONMMUT004734.2 | -3.706570 |
4.54x10⁻² | Down |
|
NONMMUT030717.2 | -1.010771 |
4.53x10⁻² | Down |
|
NONMMUT143378.1 | -2.187454 |
4.49x10⁻² | Down |
|
NONMMUT068103.2 | -1.590217 |
4.19x10⁻² | Down |
|
NONMMUT142701.1 | -2.476156 |
3.96x10⁻² | Down |
|
NONMMUT010586.2 | -1.404184 |
3.94x10⁻² | Down |
|
NONMMUT054418.2 | -2.816135 |
3.86x10⁻² | Down |
|
NONMMUT081177.1 | -2.398323 |
3.77x10⁻² | Down |
|
NONMMUT058016.2 | -1.526678 |
3.73x10⁻² | Down |
|
NONMMUT144899.1 | -2.719617 |
3.72x10⁻² | Down |
|
NONMMUT149434.1 | -2.230984 |
3.61x10⁻² | Down |
|
NONMMUT068736.2 | -2.360147 |
3.60x10⁻² | Down |
|
NONMMUT153848.1 | -1.547462 |
3.50x10⁻² | Down |
|
NONMMUT146925.1 | -3.885423 |
3.46x10⁻² | Down |
|
NONMMUT153657.1 | -2.718099 |
3.02x10⁻² | Down |
|
NONMMUT144202.1 | -3.054976 |
2.94x10⁻² | Down |
|
NONMMUT003662.2 | -2.457903 |
2.84x10⁻² | Down |
|
NONMMUT026710.2 | -2.077911 |
2.83x10⁻² | Down |
|
NONMMUT115606.1 | -1.594442 |
2.72x10⁻² | Down |
|
NONMMUT140756.1 | -3.890834 |
2.59x10⁻² | Down |
|
NONMMUT063934.2 | -1.889852 |
2.58x10⁻² | Down |
|
NONMMUT050116.2 | -1.909026 |
2.53x10⁻² | Down |
|
NONMMUT153405.1 | -3.774999 |
2.50x10⁻² | Down |
|
NONMMUT144630.1 | -2.966431 |
2.43x10⁻² | Down |
|
NONMMUT145825.1 | -4.114756 |
2.36x10⁻² | Down |
| B, MH vs. HD |
| LncRNA_ID | Log2FC
(MH vs. HD) | P-value (MH vs.
HD) | Up- or
downregulated |
|
NONMMUT149179.1 | -2.251507 |
2.87x10⁻⁶ | Down |
|
NONMMUT031874.2 | -3.052484 |
1.41x10⁻⁶ | Down |
|
NONMMUT153837.1 | -2.189606 |
9.70x10⁻⁴ | Down |
|
NONMMUT139818.1 | -2.807093 |
2.99x10⁻⁴ | Down |
|
NONMMUT031873.2 | -3.461724 |
4.32x10⁻⁵ | Down |
|
ENSMUST00000199788 | -1.754833 |
6.01x10⁻³ | Down |
|
ENSMUST00000212322 | -6.487836 |
1.43x10⁻⁹ | Down |
|
NONMMUT149177.1 | -1.514689 |
9.06x10⁻³ | Down |
|
NONMMUT152909.1 | -1.698336 |
1.57x10⁻⁴ | Down |
|
NONMMUT149180.1 | -2.498220 |
2.31x10⁻⁵ | Down |
|
ENSMUST00000118437 | -1.649720 |
2.96x10⁻³ | Down |
|
NONMMUT153838.1 | -2.157470 |
1.36x10⁻⁴ | Down |
|
NONMMUT119417.1 | -1.919131 |
7.18x10⁻⁴ | Down |
|
NONMMUT008655.2 | -1.152254 |
1.60x10⁻² | Down |
|
NONMMUT140831.1 | -2.064121 |
3.91x10⁻⁴ | Down |
|
NONMMUT067810.2 | -1.548822 |
8.12x10⁻⁵ | Down |
|
NONMMUT119419.1 | -1.646476 |
3.06x10⁻³ | Down |
|
NONMMUT011659.2 | -3.617385 |
1.81x10⁻⁵ | Down |
|
NONMMUT119418.1 | -2.804343 |
5.90x10⁻⁶ | Down |
|
NONMMUT058749.2 | -1.571707 |
3.17x10⁻³ | Down |
|
NONMMUT029338.2 | -1.302473 |
5.84x10⁻³ | Down |
|
NONMMUT152911.1 | -1.501832 |
1.39x10⁻³ | Down |
|
NONMMUT153839.1 | -1.853127 |
1.52x10⁻³ | Down |
|
NONMMUT146050.1 | -1.336522 |
9.06x10⁻³ | Down |
|
NONMMUT145134.1 | -2.500624 |
1.43x10⁻⁴ | Down |
|
NONMMUT003116.2 | -1.457044 |
1.46x10⁻² | Down |
|
NONMMUT149178.1 | -3.414379 |
3.50x10⁻⁵ | Down |
|
NONMMUT153832.1 | -1.646988 |
2.16x10⁻² | Down |
|
ENSMUST00000217474 | -1.658877 |
8.94x10⁻³ | Down |
|
NONMMUT067813.2 | -1.210335 |
3.46x10⁻³ | Down |
|
NONMMUT112513.1 | 4.866435 |
1.76x10⁻³ | Up |
|
NONMMUT028525.2 | 4.352477 |
9.57x10⁻³ | Up |
|
NONMMUT051032.2 | 2.254394 |
8.68x10⁻³ | Up |
|
ENSMUST00000100370 | 2.885722 |
3.38x10⁻³ | Up |
|
NONMMUT030701.2 | 1.926416 |
1.04x10⁻² | Up |
|
NONMMUT004734.2 | 4.319358 |
8.70x10⁻³ | Up |
|
NONMMUT030717.2 | 1.290012 |
3.90x10⁻² | Up |
|
NONMMUT143378.1 | 2.891794 |
4.09x10⁻² | Up |
|
NONMMUT068103.2 | 2.658230 |
2.62x10⁻² | Up |
|
NONMMUT142701.1 | 2.940979 |
3.16x10⁻² | Up |
|
NONMMUT010586.2 | 1.702768 |
3.09x10⁻² | Up |
|
NONMMUT054418.2 | 3.888229 |
4.97x10⁻³ | Up |
|
NONMMUT081177.1 | 2.441776 |
2.94x10⁻² | Up |
|
NONMMUT058016.2 | 2.520639 |
1.87x10⁻³ | Up |
|
NONMMUT144899.1 | 2.590428 |
1.55x10⁻² | Up |
|
NONMMUT149434.1 | 2.255812 |
3.47x10⁻² | Up |
|
NONMMUT068736.2 | 3.192271 |
1.90x10⁻³ | Up |
|
NONMMUT153848.1 | 2.249656 |
2.62x10⁻² | Up |
|
NONMMUT146925.1 | 4.319742 |
3.87x10⁻² | Up |
|
NONMMUT153657.1 | 2.948339 |
5.64x10⁻³ | Up |
|
NONMMUT144202.1 | 4.091950 |
1.24x10⁻² | Up |
|
NONMMUT003662.2 | 2.517240 |
1.38x10⁻² | Up |
|
NONMMUT026710.2 | 3.141129 |
2.48x10⁻² | Up |
|
NONMMUT115606.1 | 2.539770 |
1.29x10⁻² | Up |
|
NONMMUT140756.1 | 5.412773 |
3.42x10⁻² | Up |
|
NONMMUT063934.2 | 2.092702 |
1.11x10⁻² | Up |
|
NONMMUT050116.2 | 2.127048 |
2.57x10⁻² | Up |
|
NONMMUT153405.1 | 4.558180 |
1.47x10⁻² | Up |
|
NONMMUT144630.1 | 2.789511 |
4.01x10⁻² | Up |
|
NONMMUT145825.1 | 4.499107 |
1.85x10⁻⁴ | Up |
| Table IIITop 30 differentially-expressed mRNAs
found in mice fed with ND, HD or MH.a |
Table III
Top 30 differentially-expressed mRNAs
found in mice fed with ND, HD or MH.a
| A, HD vs. ND |
|---|
| Gene name | Log2FC
(HD vs. ND) | P-value (HD vs.
ND) | Up- or
downregulated |
|---|
| Cfd | 7.102398 |
1.24x10-50 | Up |
| Aacs | 3.578468 |
1.97x10-37 | Up |
| Foxq1 | 3.572630 |
3.28x10⁻³² | Up |
| Phlda1 | 2.502932 |
5.15x10⁻³⁰ | Up |
| Chac1 | 3.581907 |
8.30x10⁻²⁶ | Up |
| Cish | 2.878978 |
8.77x10⁻²⁵ | Up |
| Themis | 4.129499 |
1.23x10⁻²⁰ | Up |
| Gm43756 | 7.064607 |
1.60x10⁻¹⁸ | Up |
| Gm28592 | 3.115101 |
2.17x10⁻¹⁸ | Up |
| Gm28182 | 2.584522 |
2.47x10⁻¹⁶ | Up |
| 3110082I17Rik | 2.015142 |
4.18x10⁻¹⁶ | Up |
| Nrep | 2.163696 |
1.94x10⁻¹⁴ | Up |
| Gadd45a | 2.633552 |
1.29x10⁻¹³ | Up |
| Mup-ps14 | 4.979470 |
1.24x10⁻¹² | Up |
| Cidea | 7.449365 |
2.74x10⁻¹² | Up |
| Aqp8 | 1.734631 |
7.79x10⁻¹² | Up |
| Socs3 | 2.417039 |
1.30x10⁻¹¹ | Up |
| Lgals1 | 2.525710 |
1.81x10⁻¹¹ | Up |
| Mas1 | 5.097515 |
2.27x10⁻¹¹ | Up |
| Gm26876 | 4.776975 |
8.33x10⁻¹¹ | Up |
| Gbp11 | 2.976467 |
1.21x10⁻¹⁰ | Up |
| Adgrv1 | 3.122875 |
1.71x10⁻¹⁰ | Up |
| A530084C06Rik | 2.308730 |
4.86x10⁻¹⁰ | Up |
| Rnf186 | 1.994529 |
8.10x10⁻¹⁰ | Up |
| Myc | 2.508489 |
1.58x10⁻⁹ | Up |
| Mogat1 | 2.514068 |
1.66x10⁻⁹ | Up |
| Sptlc3 | Inf |
1.80x10⁻⁹ | Up |
| Gm11967 | 1.820830 |
2.48x10⁻⁹ | Up |
| Gm27551 | 5.118398 |
4.13x10⁻⁹ | Up |
| Clec2h | 3.253263 |
1.07x10⁻⁸ | Up |
| Ebf3 | -2.044633 |
4.93x10⁻² | Down |
| Mir3068 | -1.242104 |
4.77x10⁻² | Down |
| Sidt1 | -1.284115 |
3.74x10⁻² | Down |
| Slc4a5 | -2.799238 |
3.66x10⁻² | Down |
| Gm45753 | -3.035576 |
3.57x10⁻² | Down |
| 1810013D15Rik | -1.021073 |
2.50x10⁻² | Down |
| Gm23445 | -1.382136 |
2.29x10⁻² | Down |
| Hdx | -1.163874 |
2.27x10⁻² | Down |
| Mir8097 | -2.901827 |
2.15x10⁻² | Down |
| Gm9025 | -2.463844 |
2.14x10⁻² | Down |
| Gm44224 | -1.537712 |
1.96x10⁻² | Down |
| Adat3 | -2.345512 |
1.94x10⁻² | Down |
| Zfp422 | -1.039810 |
1.69x10⁻² | Down |
| Cabyr | -1.302456 |
1.64x10⁻² | Down |
| Gm9916 | -1.473988 |
1.42x10⁻² | Down |
| Zfp804b | -2.264639 |
1.31x10⁻² | Down |
| Psma8 | -1.107980 |
1.26x10⁻² | Down |
| Gm37660 | -1.417403 |
1.24x10⁻² | Down |
| Gm10728 | -1.418026 |
1.02x10⁻² | Down |
| Usf3 | -2.087752 |
8.18x10⁻³ | Down |
| Gm26871 | -1.281593 |
6.45x10⁻³ | Down |
| Rnase10 | -3.779923 |
5.58x10⁻³ | Down |
| Snora73a | -1.659874 |
3.81x10⁻³ | Down |
| Gm15842 | -1.072109 |
3.65x10⁻³ | Down |
| Ppp1r3g | -3.305166 |
3.31x10⁻³ | Down |
| Gm17108 | -1.469128 |
3.04x10⁻³ | Down |
| Fkbp5 | -1.052135 |
3.04x10⁻³ | Down |
| Abca14 | -1.618418 |
2.98x10⁻³ | Down |
| Adgrf1 | -1.341829 |
2.45x10⁻³ | Down |
| Gm32540 | -1.422205 |
2.00x10⁻³ | Down |
| B, MH vs. HD |
| Gene name | Log2FC
(MH vs. HD) | P-value (MH vs.
HD) | Up- or
downregulated |
| Cfd | -2.051145 |
1.41x10⁻⁶ | Down |
| Aacs | -1.280914 |
1.31x10⁻⁵ | Down |
| Foxq1 | -1.247545 |
1.73x10⁻⁵ | Down |
| Phlda1 | -1.803304 |
3.82x10⁻⁸ | Down |
| Chac1 | -1.104198 |
2.48x10⁻³ | Down |
| Cish | -1.621644 |
6.85x10⁻³ | Down |
| Themis | -1.322426 |
6.50x10⁻⁴ | Down |
| Gm43756 | -1.743903 |
4.41x10⁻³ | Down |
| Gm28592 | -2.114167 |
1.51x10⁻⁶ | Down |
| Gm28182 | -2.393627 |
3.18x10⁻⁷ | Down |
| 3110082I17Rik | -1.305596 |
6.21x10⁻⁸ | Down |
| Nrep | -1.336429 |
5.13x10⁻⁹ | Down |
| Gadd45a | -1.319588 |
1.49x10⁻⁵ | Down |
| Mup-ps14 | -1.647291 |
1.27x10⁻³ | Down |
| Cidea | -2.794620 |
3.40x10⁻³ | Down |
| Aqp8 | -1.406878 |
7.08x10⁻⁸ | Down |
| Socs3 | -1.205874 |
3.08x10⁻³ | Down |
| Lgals1 | -1.517038 |
2.25x10⁻⁵ | Down |
| Mas1 | -2.845129 |
1.08x10⁻⁵ | Down |
| Gm26876 | -2.916657 |
9.81x10⁻⁵ | Down |
| Gbp11 | -1.385258 |
2.00x10⁻⁴ | Down |
| Adgrv1 | -1.508109 |
1.35x10⁻³ | Down |
| A530084C06Rik | -1.067840 |
3.91x10⁻³ | Down |
| Rnf186 | -1.238196 |
1.24x10⁻⁵ | Down |
| Myc | -2.093431 |
7.47x10⁻⁶ | Down |
| Mogat1 | -1.468955 |
1.19x10⁻⁴ | Down |
| Sptlc3 | -1.207829 |
4.77x10⁻² | Down |
| Gm11967 | -1.098758 |
1.86x10⁻⁴ | Down |
| Gm27551 | -1.249623 |
1.23x10⁻² | Down |
| Clec2h | -1.359496 |
3.48x10⁻³ | Down |
| Ebf3 | 2.890585 |
9.42x10⁻³ | Up |
| Mir3068 | 1.482346 |
4.88x10⁻² | Up |
| Sidt1 | 1.676417 |
1.47x10⁻² | Up |
| Slc4a5 | 3.203330 |
1.43x10⁻² | Up |
| Gm45753 | 4.141122 |
1.21x10⁻⁶ | Up |
| 1810013D15Rik | 1.251620 |
3.89x10⁻² | Up |
| Gm23445 | 1.588164 |
2.10x10⁻² | Up |
| Hdx | 1.344117 |
1.83x10⁻² | Up |
| Mir8097 | 3.678148 |
6.22x10⁻³ | Up |
| Gm9025 | 3.684024 |
4.36x10⁻³ | Up |
| Gm44224 | 1.637062 |
1.01x10⁻² | Up |
| Adat3 | 2.330407 |
1.92x10⁻² | Up |
| Zfp422 | 1.049609 |
2.75x10⁻² | Up |
| Cabyr | 1.323208 |
1.51x10⁻⁴ | Up |
| Gm9916 | 1.350597 |
2.45x10⁻² | Up |
| Zfp804b | 2.430546 |
3.73x10⁻² | Up |
| Psma8 | 1.499127 |
3.45x10⁻⁴ | Up |
| Gm37660 | 1.756026 |
1.43x10⁻² | Up |
| Gm10728 | 2.111559 |
6.16x10⁻³ | Up |
| Usf3 | 2.199649 |
6.10x10⁻⁵ | Up |
| Gm26871 | 1.201270 |
6.46x10⁻³ | Up |
| Rnase10 | 3.843550 |
8.34x10⁻³ | Up |
| Snora73a | 1.662650 |
2.33x10⁻² | Up |
| Gm15842 | 1.222220 |
7.11x10⁻³ | Up |
| Ppp1r3g | 2.804066 |
1.86x10⁻⁴ | Up |
| Gm17108 | 1.627575 |
9.72x10⁻³ | Up |
| Fkbp5 | 1.373474 |
3.92x10⁻³ | Up |
| Abca14 | 1.280070 |
3.85x10⁻² | Up |
| Adgrf1 | 1.164962 |
1.51x10⁻² | Up |
| Gm32540 | 1.100892 |
4.52x10⁻² | Up |
GO and KEGG analysis
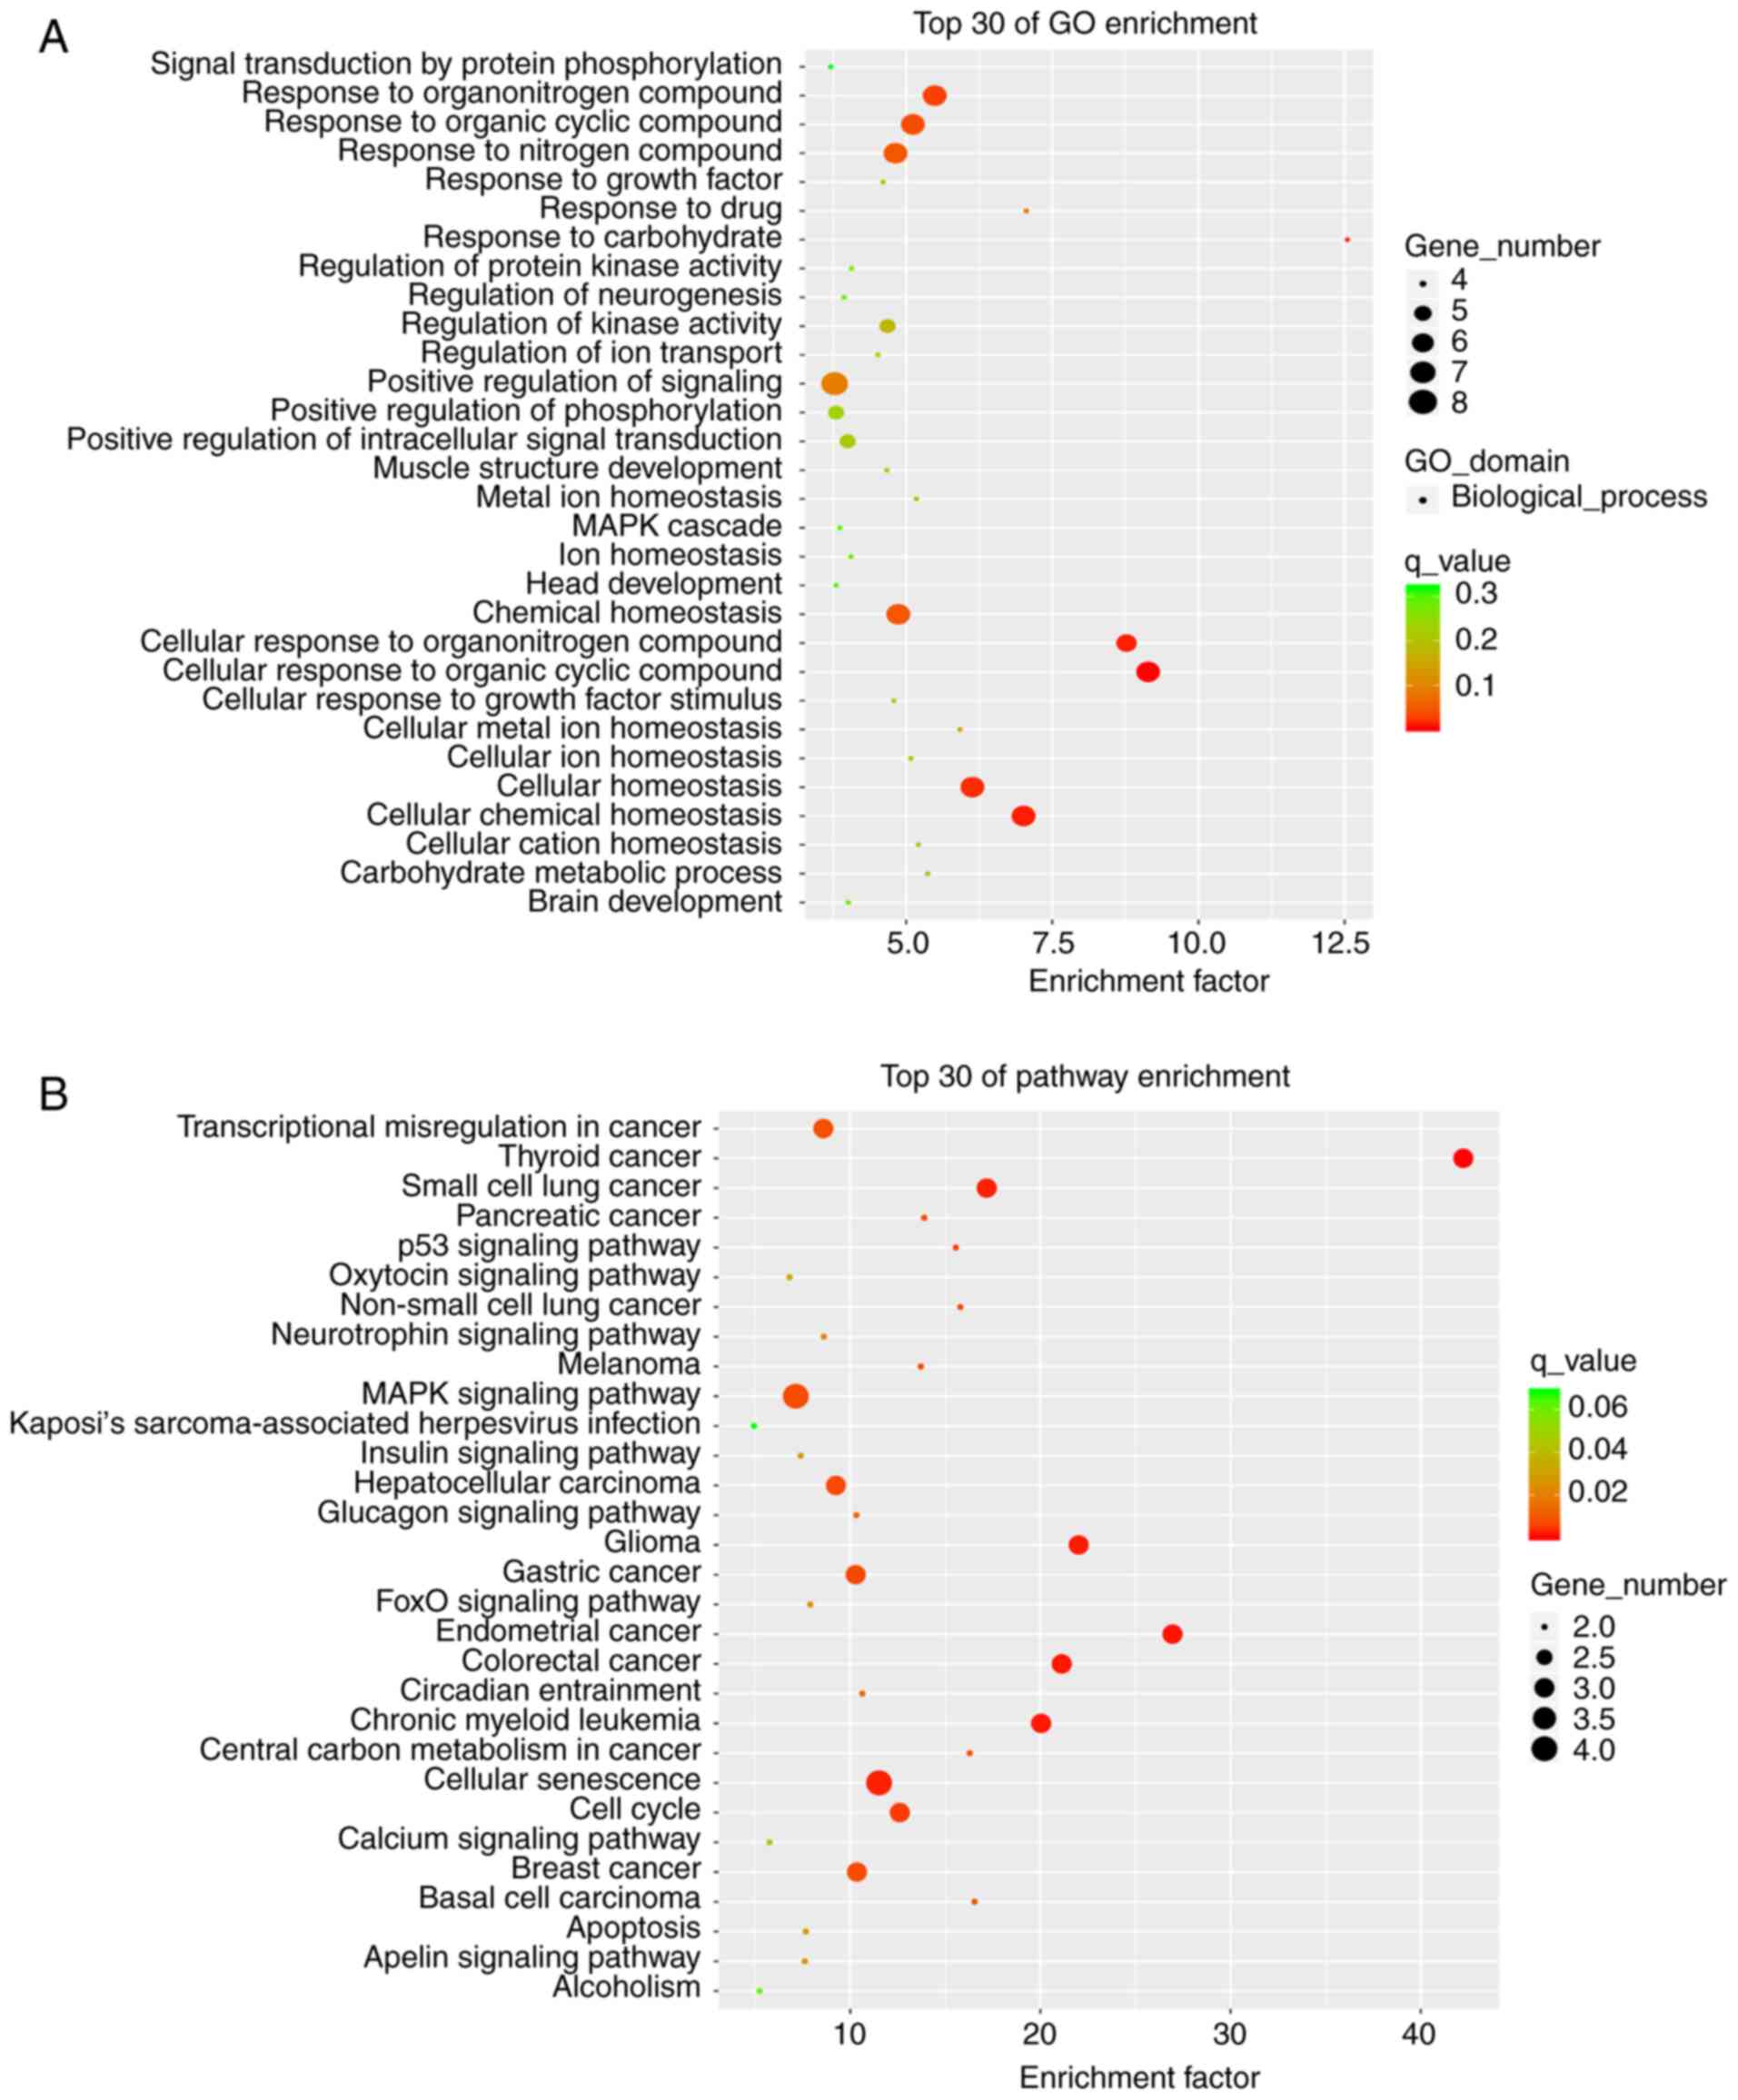
To investigate the biological functions and pathways
of the differentially-expressed genes, GO enrichment and KEGG
pathway analyses were performed. The top 30 enriched target genes
in the GO analysis included ‘response to nitrogen compound’,
‘positive regulation of signaling’, ‘chemical homeostasis’,
‘cellular homeostasis’ and so on. Differentially-expressed mRNAs
were mainly involved in the ‘small cell lung cancer’, ‘MAPK
signaling pathway’, ‘cellular senescence’ and ‘insulin signaling
pathway’ (Fig. 2A and B). The KEGG analysis in the GEO database
indicated that the differentially-expressed mRNAs can enrich in
hundreds of pathways. Although the insulin signaling pathway were
enriched by a small gene number, it was also listed as a top 30
pathway. In addition, the insulin signaling pathway was
statistically significant (q-values ≤0.05. Moreover, it is
associated with the liver insulin resistance model of the HFD-fed
mice. So the insulin signaling pathway was selected.
Establishment of an insulin-resistant
mouse model induced by high-fat diet
Before HFD intervention (at baseline), there was no
difference in body weight between the HFD and CON groups. After 8
weeks of high-fat diet intervention, from week 2 onwards, the
weight of the mice in the HFD group was significantly higher
compared with that in the CON group (Fig. 3A). There was no difference in the
average daily caloric intake between the two groups (Fig. 3B).
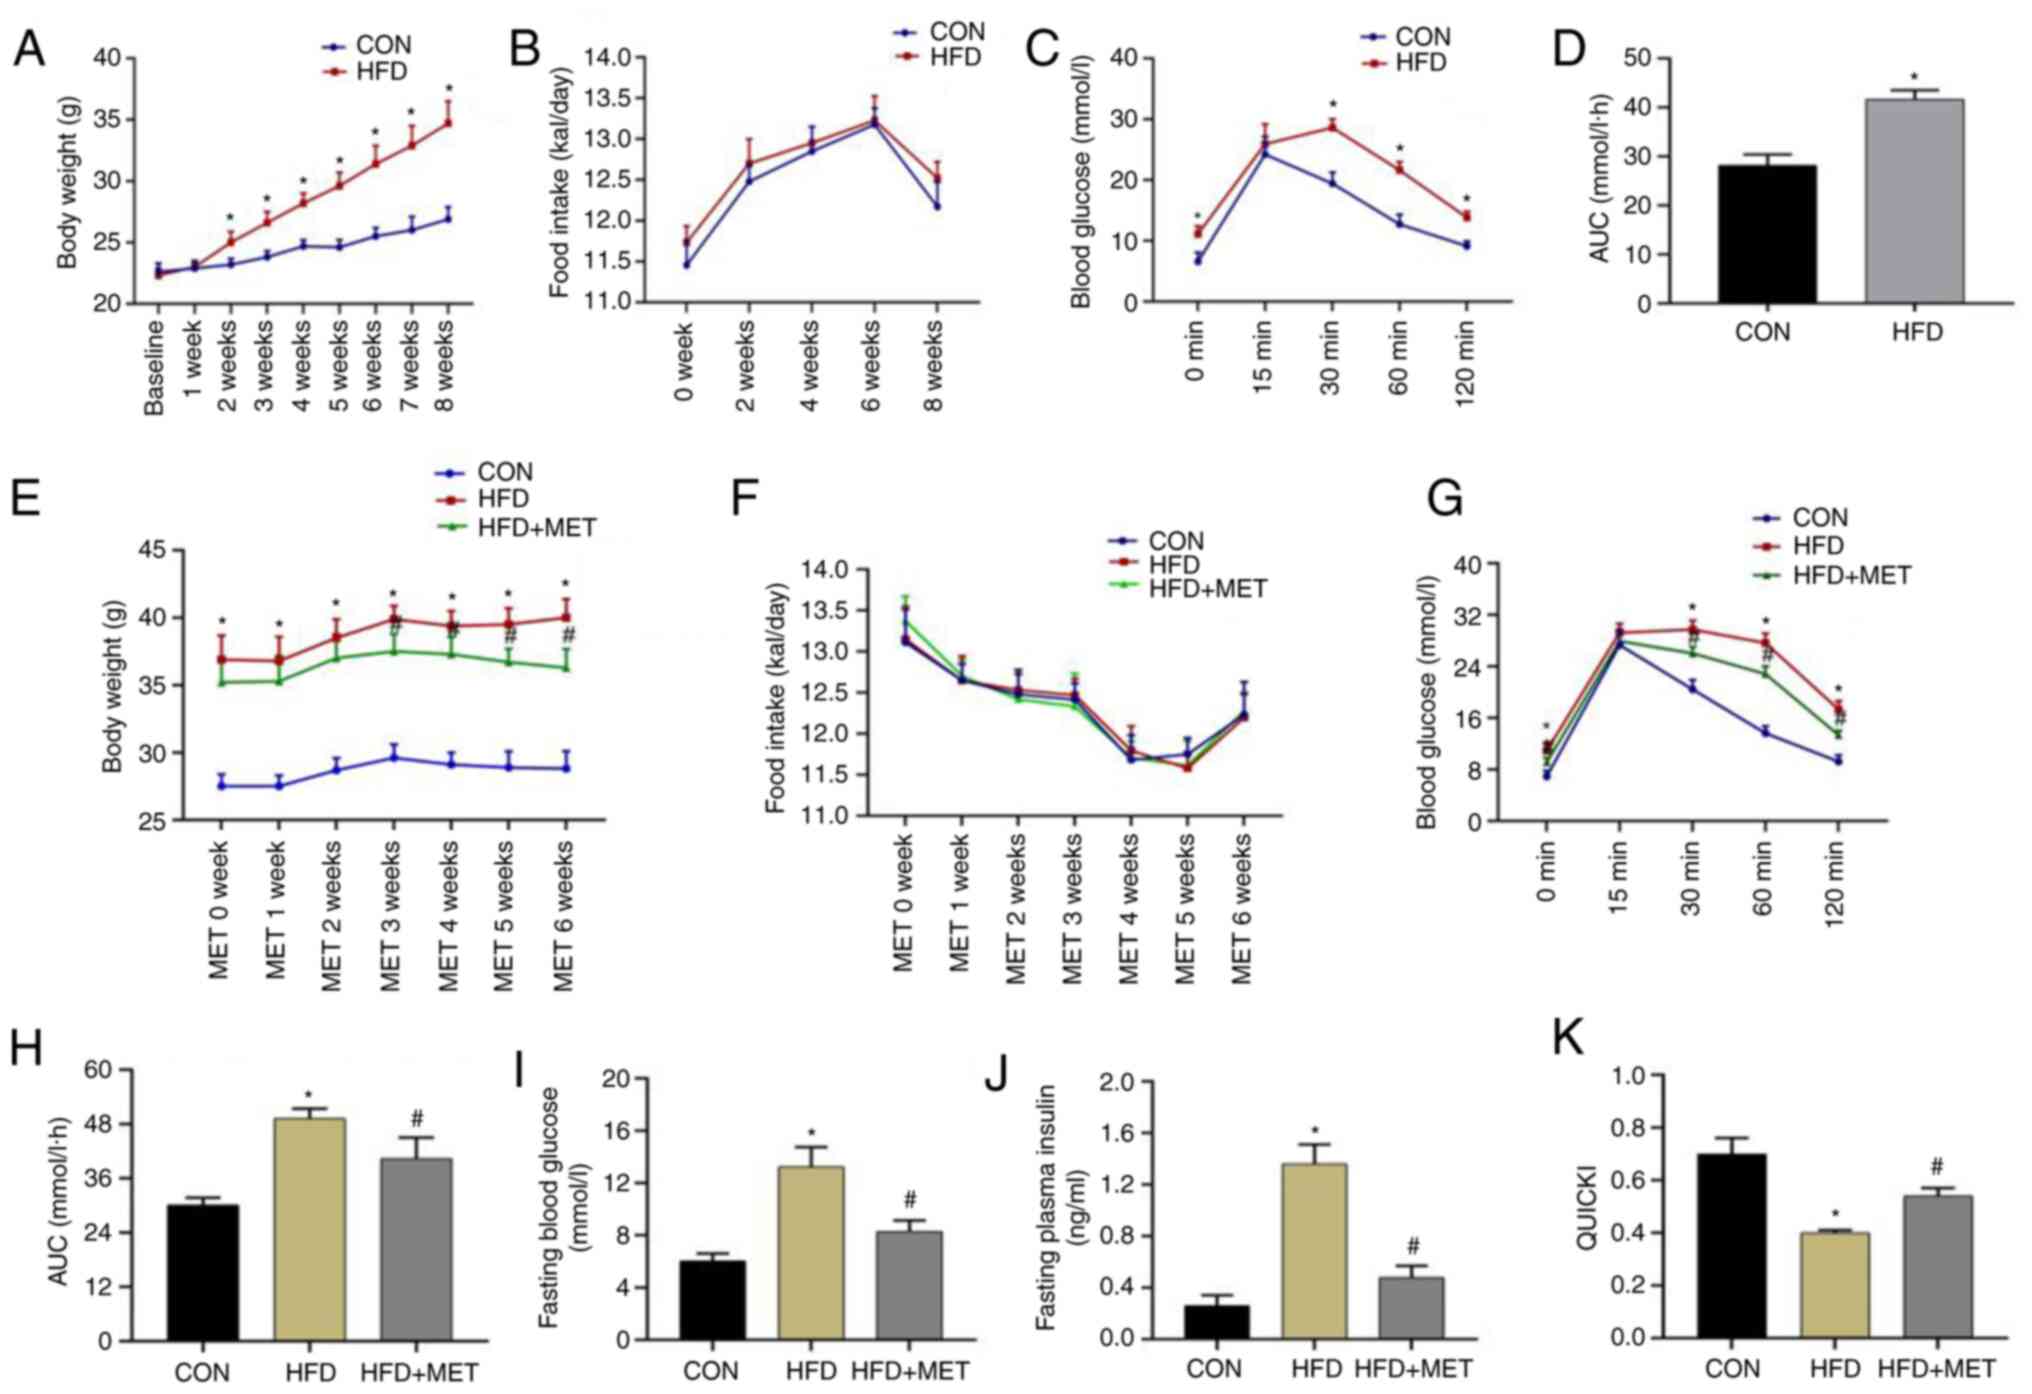 | Figure 3Establishment of the insulin
resistance model in mice and changes in insulin resistance after
MET intervention for 6 weeks. (A-D) Body weight, food intake, IPGTT
and AUC results of mice before and after feeding on a HFD for 8
weeks. (A) Body weight. (B) Food intake. (C) Blood glucose levels
were measured at 0, 15, 30, 60 and 120 min after intraperitoneal
glucose injection. (D) AUC of blood glucose from Fig. 2C. Data are presented as the mean ±
SD (CON n=14; HFD n=28). *P<0.05 vs. CON. (E-H) Body
weight, food intake, IPGTT and AUC results of mice after MET
treatment for 6 weeks. (E) Body weight. (F) Food intake. (G) Blood
glucose levels were measured at 0, 15, 30, 60 and 120 min after
intraperitoneal glucose injection. (H) AUC of blood glucose from
Fig. 2G. Data are presented as the
mean ± SD (n=14). *P<0.05 vs. CON and
#P<0.05 vs. HFD. (I-K) Fasting blood glucose, fasting
plasma insulin and QUICKI after MET treatment for 6 weeks. (I)
Fasting blood glucose levels. (J) Fasting plasma insulin levels.
(K) QUICKI calculations. Data are presented as the mean ± SD
(n=10). *P<0.05 vs. CON and #P<0.05 vs.
HFD. IPGTT, intraperitoneal glucose tolerance test; HFD, high-fat
diet; QUICKI, quantitative insulin sensitivity check index; AUC,
area under the curve; MET, metformin. |
IPGTT experiment was performed after feeding on a
HFD for 8 weeks. Compared with that in the CON group, the blood
glucose levels in the HFD group were significantly increased at 0,
30, 60 and 120 min (Fig. 3C).
However, there was no difference at 15 min (Fig. 3C). Compared with that in the CON
group, the AUC in the HFD group was significantly increased
(Fig. 3D), suggesting that the
insulin-resistant mouse model had been successfully
established.
Changes in body weight and insulin
resistance of mice in each group after MET intervention for 6
weeks
The body weight in the HFD group was significantly
higher compared with that in the CON group for 8 weeks. After MET
intervention for 3 weeks onwards, the body weight of mice in the
HFD + MET group was significantly decreased compared with that in
the HFD group (Fig. 3E). There was
no difference in the daily food intake among the three groups
(Fig. 3F).
IPGTT results after MET intervention
for 6 weeks
IPGTT assay was performed after MET intervention for
6 weeks. Compared with that in the CON group, blood glucose levels
in the HFD group were significantly higher at 0, 30, 60 and 120 min
(Fig. 3G). In addition, blood
glucose levels in the HFD + MET group were significantly lower
compared with those in the HFD group (Fig. 3G). There was no difference in blood
glucose levels among the three groups at 15 min (Fig. 3G). The AUC in the HFD group was
significantly higher compared with that in the CON group, but was
significantly lower in the HFD + MET group compared with that in
the HFD group (Fig. 3H).
Blood glucose, insulin and QUICKI of
mice in the three groups
Compared with those in the CON group, the fasting
blood glucose and insulin levels in the HFD group were
significantly increased, whilst the QUICKI value was significantly
decreased (Fig. 3I-K). Compared
with those in the HFD group, the fasting blood glucose and insulin
levels in the HFD + MET group were significantly decreased, but the
QUICKI value was increased significantly (Fig. 3I-K). These results suggest that MET
can improve insulin sensitivity in insulin-resistant mice.
Blood lipid levels in the three
groups
Compared with those in the CON group, the levels of
TC, TG, LDL-C and FFA in the HFD group were significantly higher,
whilst those of HDL-C were significantly lower (Fig. 4A-E). Compared with those in the HFD
group, the levels of TC, TG and FFA in the HFD + MET group were
significantly decreased whereas the levels of HDL-C were
significantly increased. There was no change in the levels of LDL-C
between the HFD and HFD + MET groups (Fig. 4A-E).
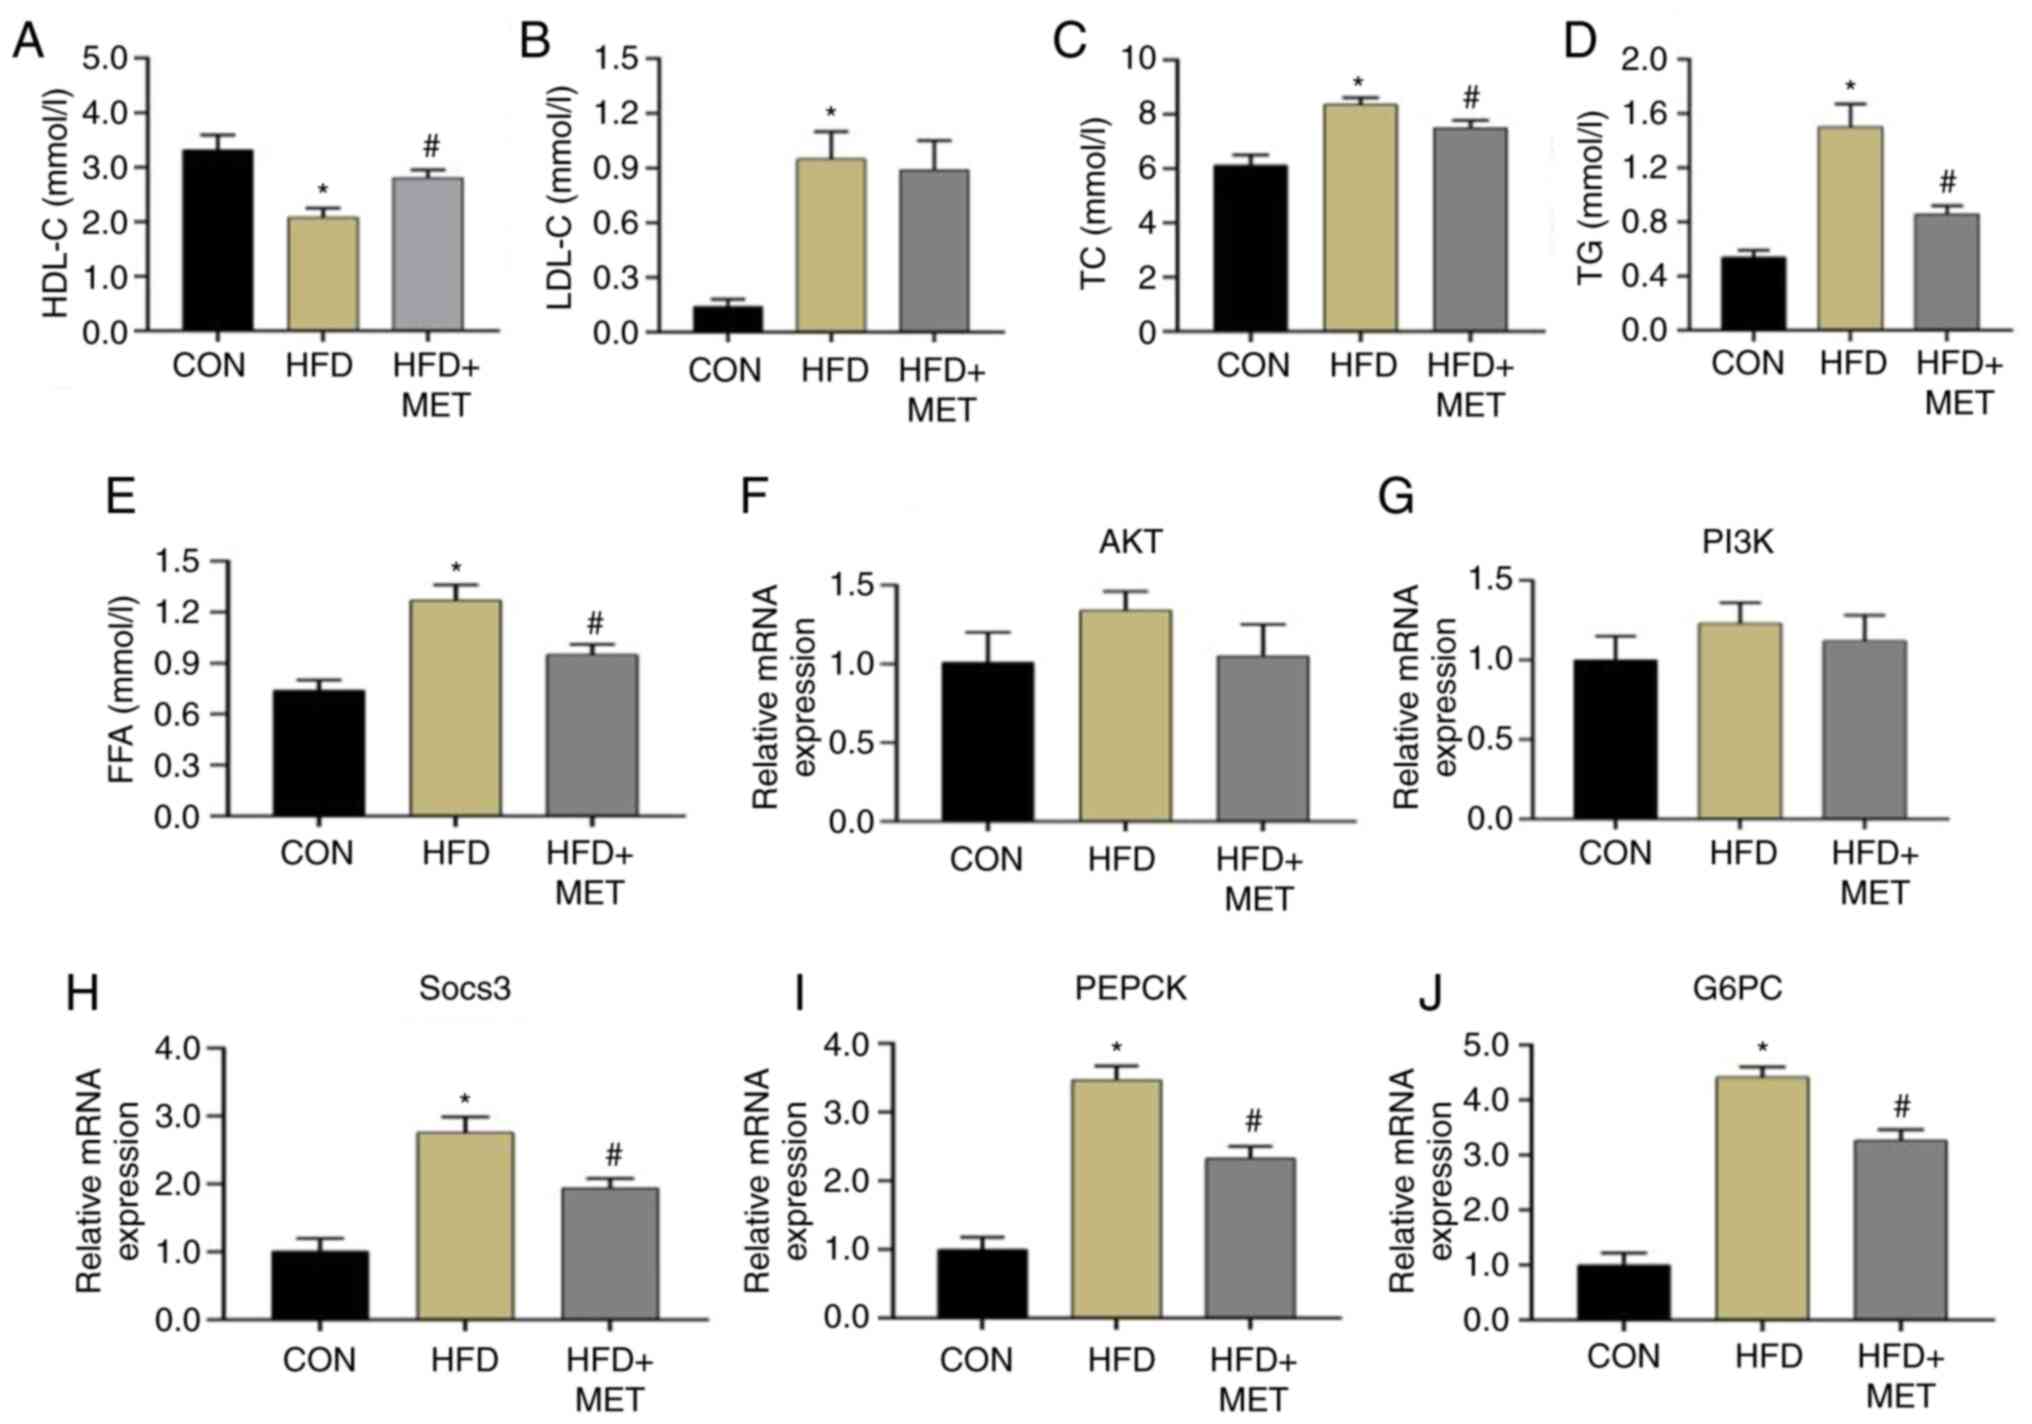 | Figure 4Blood lipid levels and mRNA
expression of components in the insulin signaling pathway in mice
from different groups. (A-E) Blood lipid parameters were measured
after MET intervention. (A) HDL-C, (B) LDL-C, (C) TC, (D) TG and
(E) FFA. Data are presented as the mean ± SD (n=10).
*P<0.05 vs. CON and #P<0.05 vs. HFD.
(F-J) Relative mRNA expression of components in the insulin
signaling pathway in liver tissues. (F) AKT, (G) PI3K, (H) Socs3,
(I) PEPCK and (J) G6PC. Data are presented as the mean ± SD (n=6).
*P<0.05 vs. CON and #P<0.05 vs. HFD.
CON, control; HFD, high-fat diet; MET, metformin; HDL-C,
high-density-lipoprotein cholesterol; LDL-C,
low-density-lipoprotein cholesterol; TC, total cholesterol; TG,
triglyceride; FFA, free fatty acid; Socs3, suppressor of cytokine
signaling 3; PEPCK, phosphoenolpyruvate carboxykinase; G6PC,
glucose-6-phosphatase catalytic-subunit. |
Expression of mRNAs and proteins
related to the insulin signaling pathway
RT-qPCR results showed that compared with those in
the CON group, the mRNA expression levels of SOCS3, PEPCK and
glucose-6-phosphatase catalytic subunit (G6PC) in the liver tissues
of the HFD group mice were significantly increased, which were
significantly reversed by MET treatment (Fig. 4H-J). However, the mRNA expression
levels of PI3K and AKT had no significant difference in the three
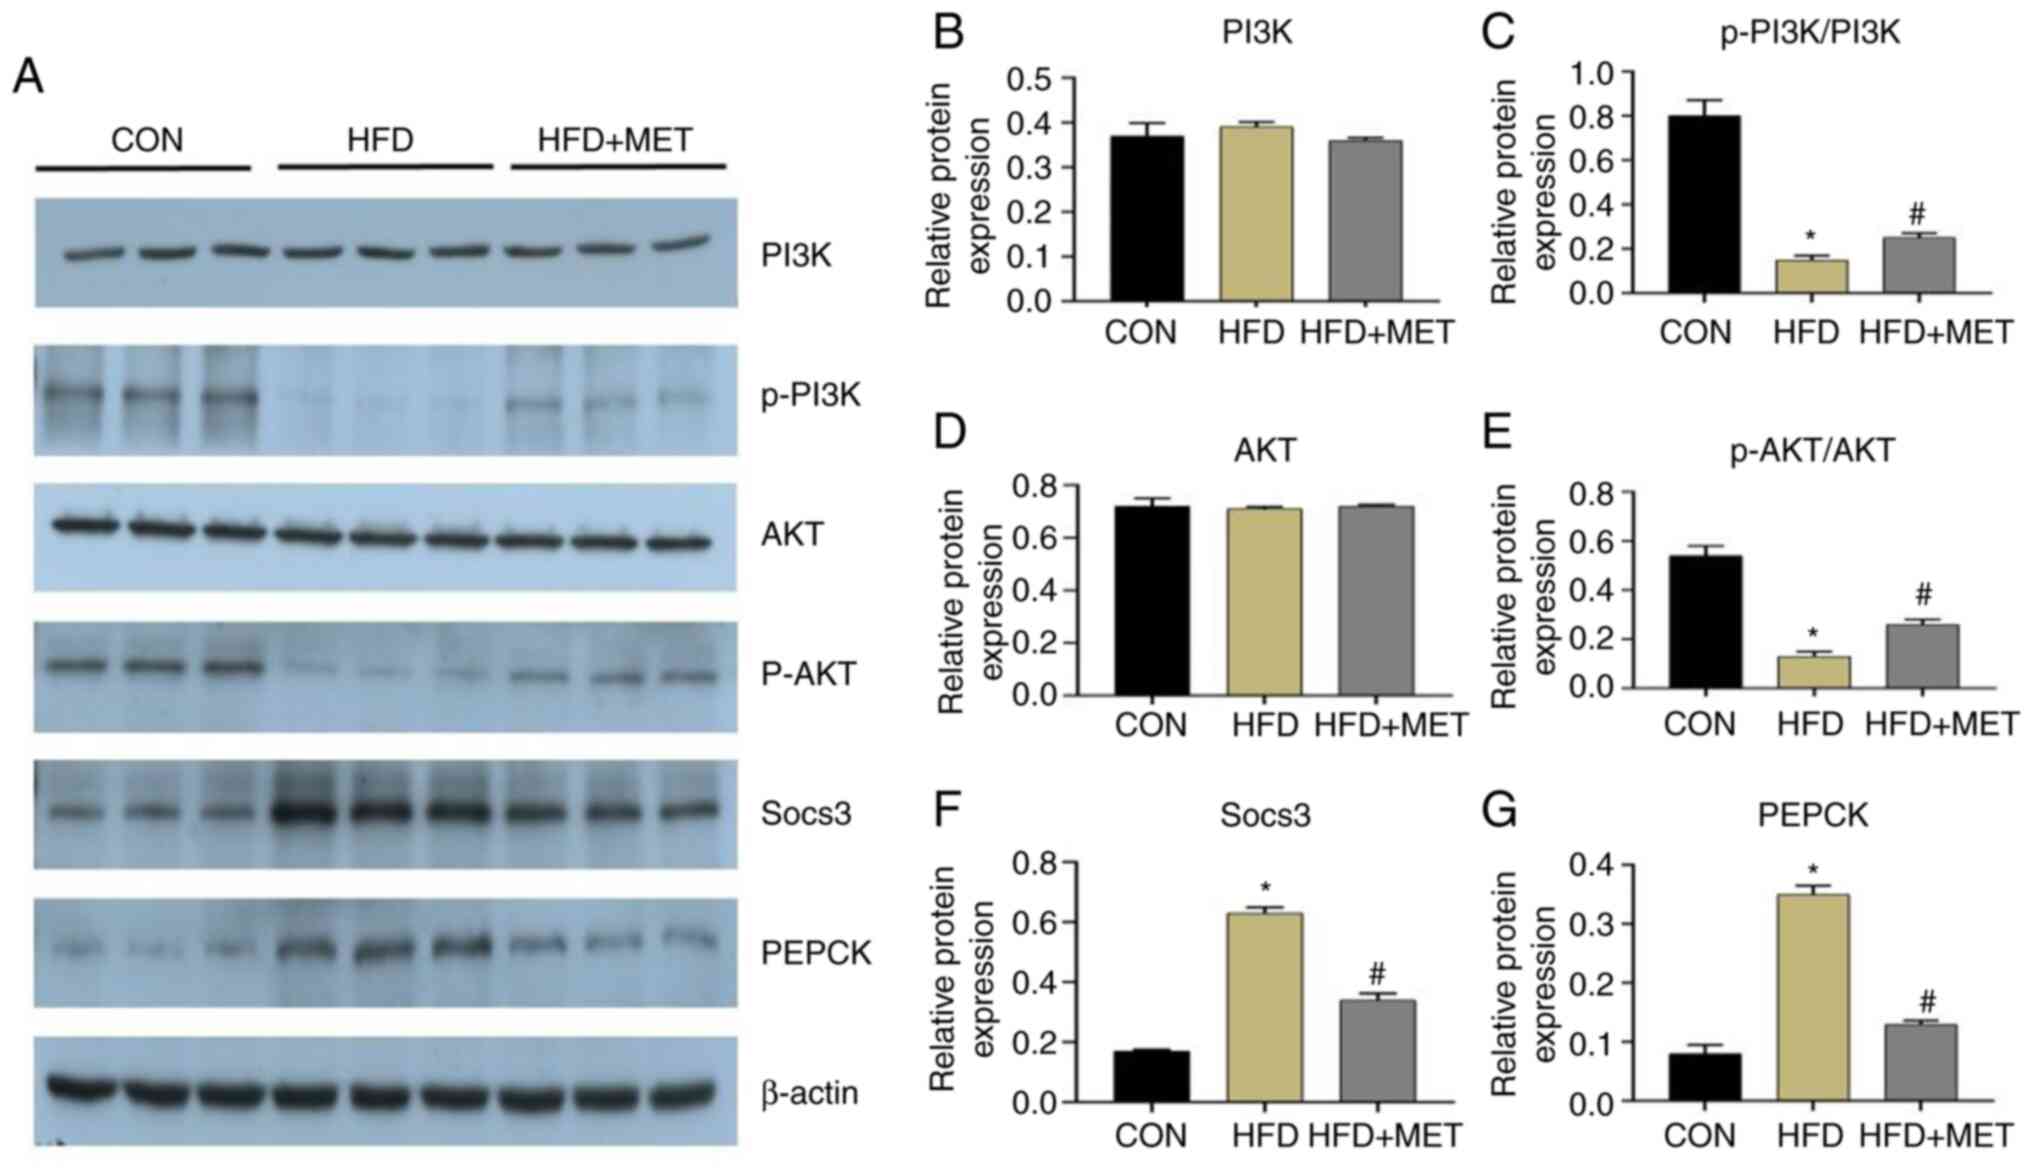
groups (Fig. 4F and G). Western blot analysis showed that
compared with those in the CON group, the expression levels of
SOCS3 and PEPCK were significantly increased in the HFD group,
which were significantly reversed by MET treatment (Fig. 5). Analysis of PI3K and AKT
phosphorylation revealed that they were significantly reduced in
the HFD group compared with those in the CON group (Fig. 5). By contrast, PI3K and AKT
phosphorylation in the HFD + MET group was significantly higher
compared with that in the HFD group (Fig. 5).
Verification of the
differentially-expressed lncRNAs in the liver of mice
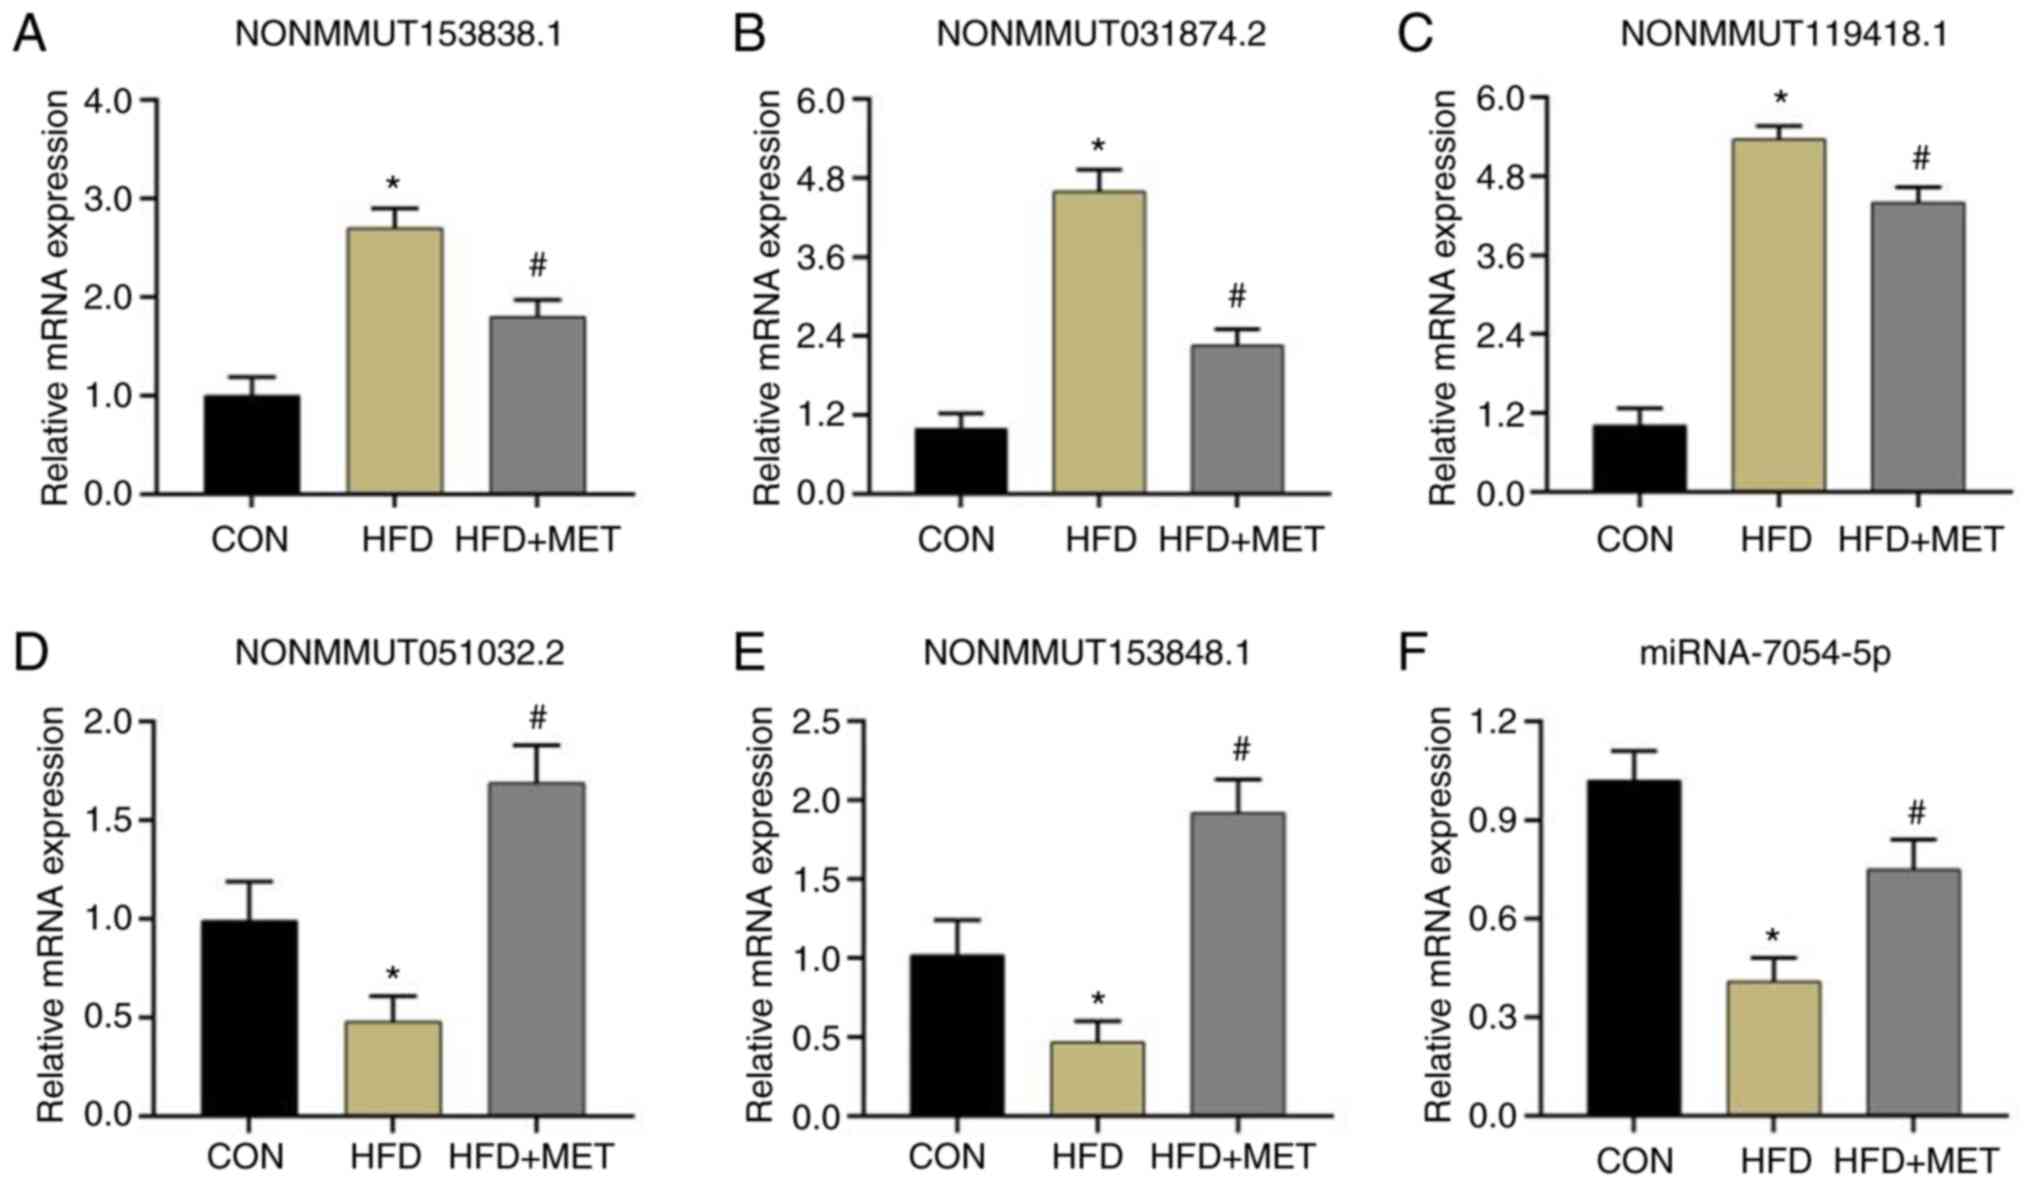
Among the lncRNAs found to be differentially
expressed after MET treatment in mice in the HFD group, three
lncRNAs that were upregulated by HFD and subsequently downregulated
by MET treatment (NONMMUT153838.1, NONMMUT031874.2 and
NONMMUT119418.1) and two lncRNAs showing the opposite pattern
(NONMMUT051032.2 and NONMMUT153848.1) were randomly selected to be
analyzed. RT-qPCR analysis verified that the expression pattern of
these five lncRNAs was consistent with the results of
high-throughput sequencing analysis (Fig. 6A-E).
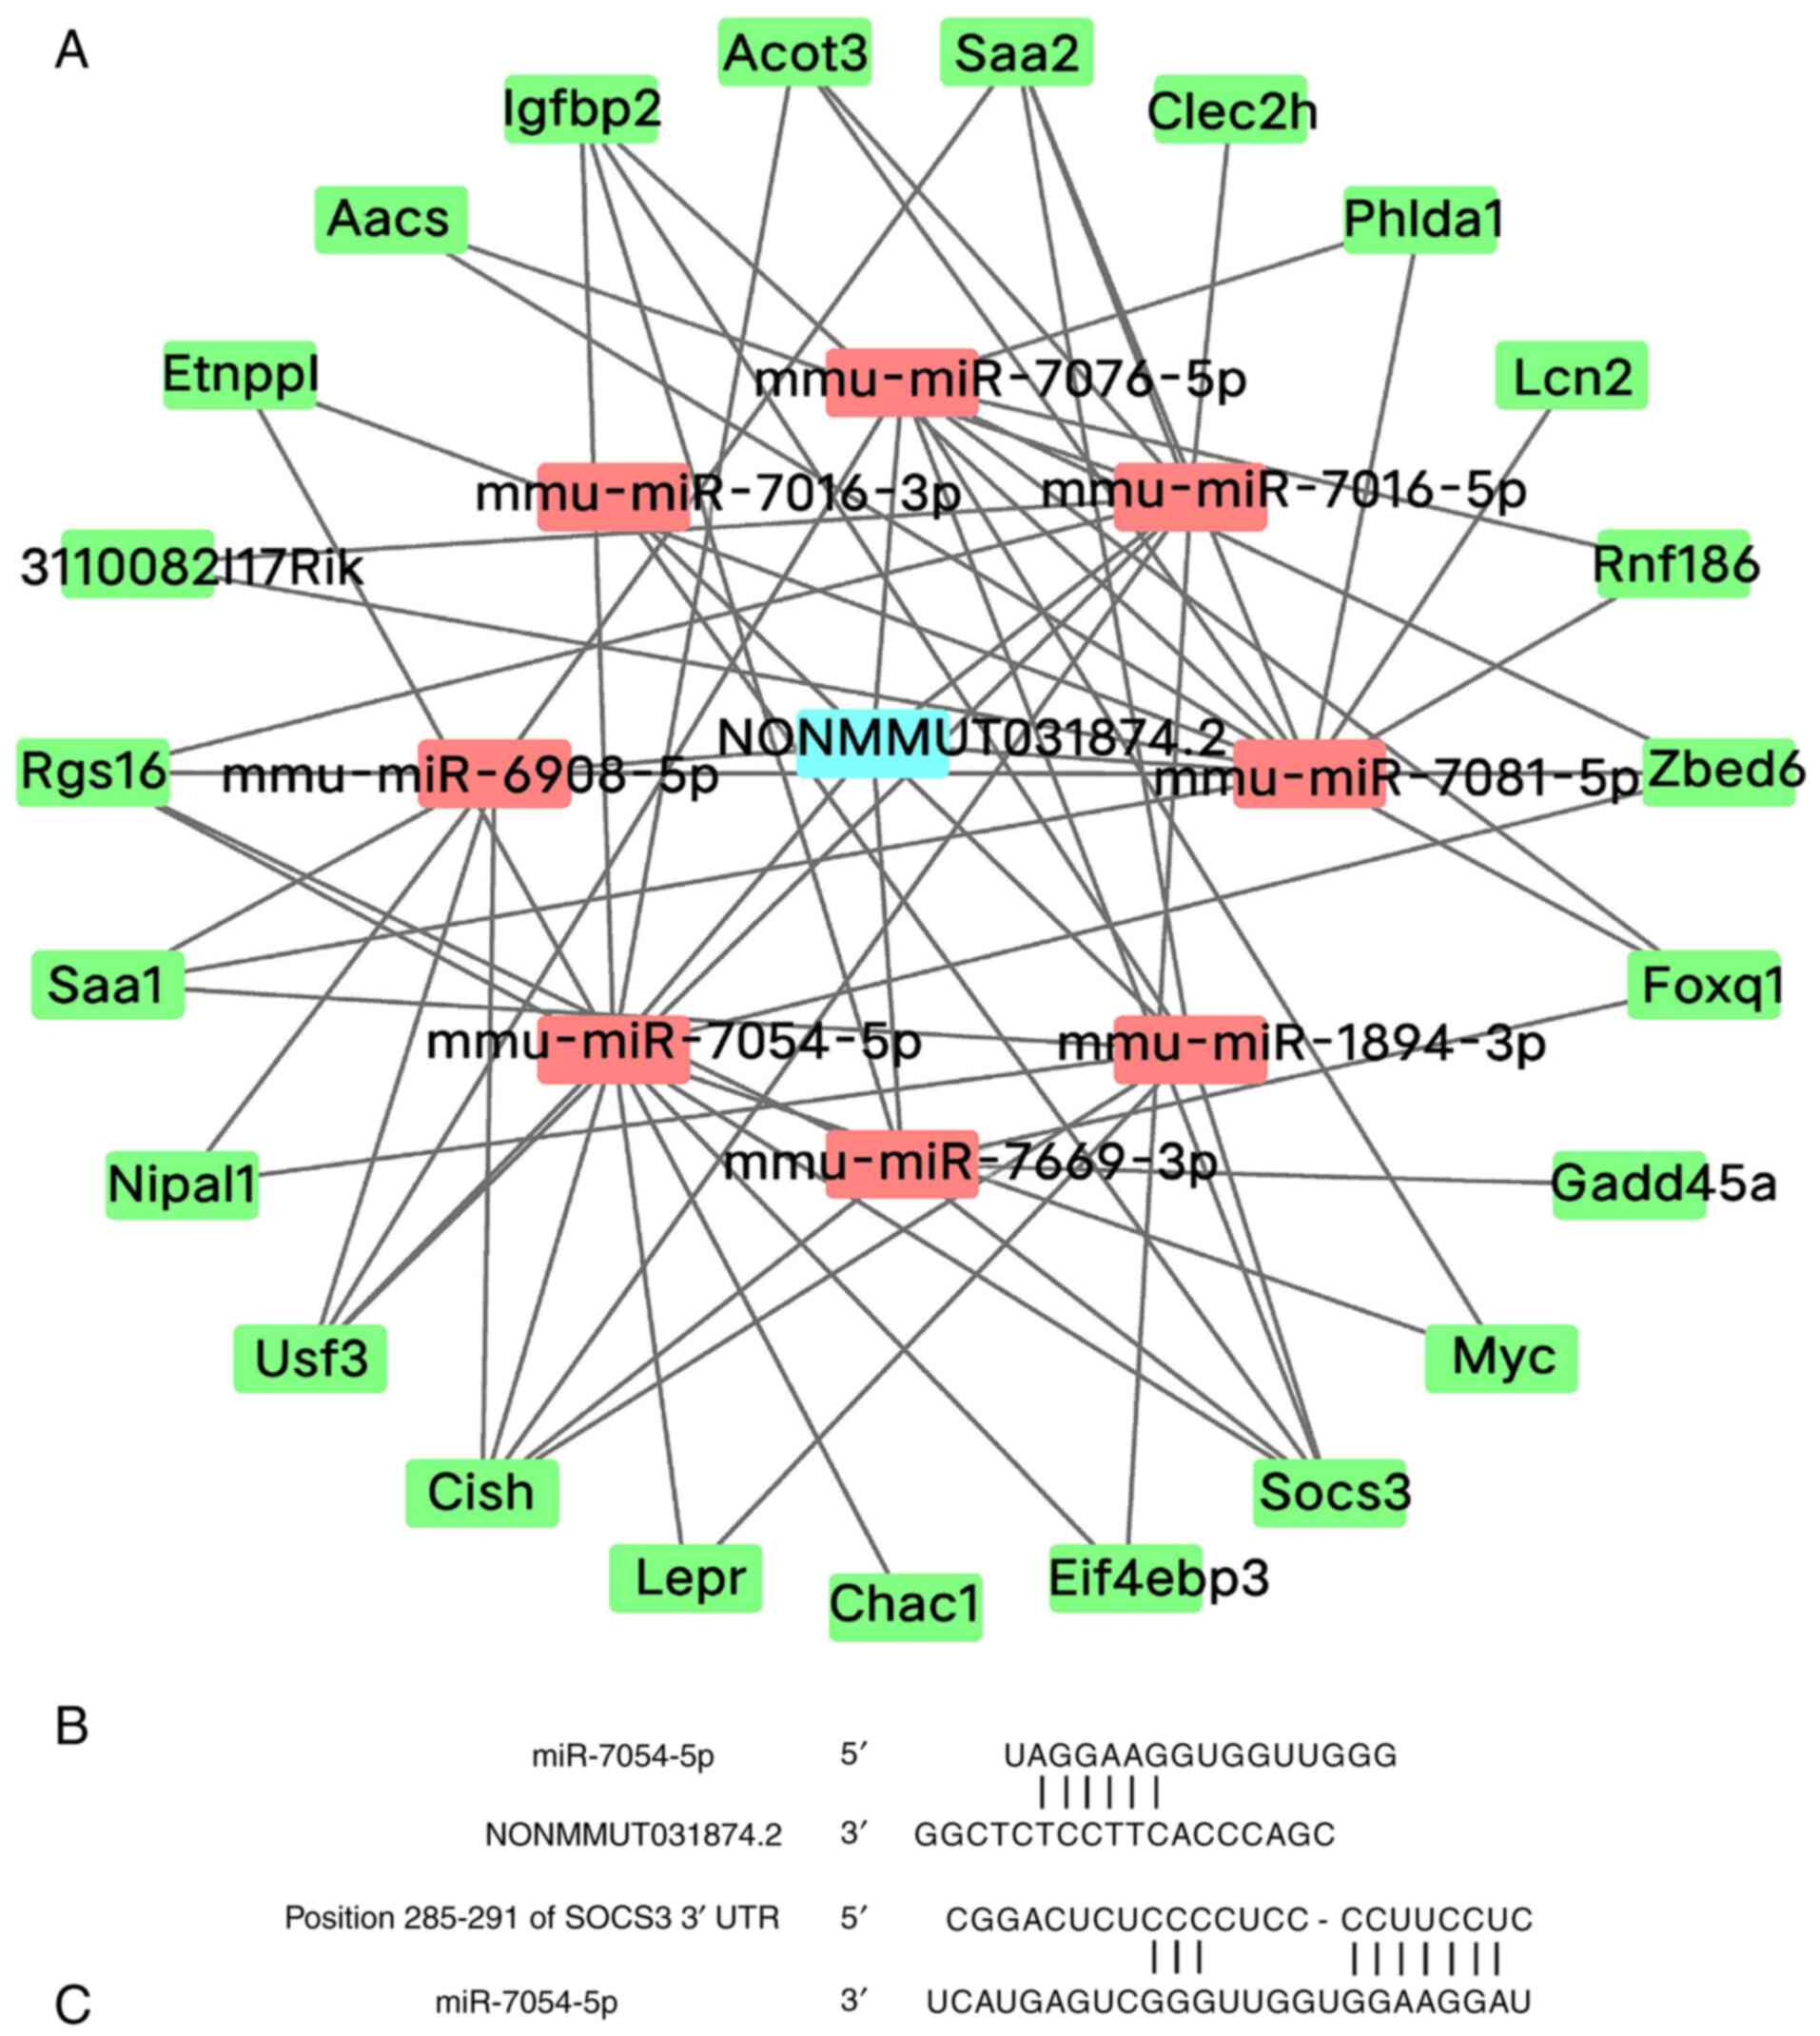
LncRNA-miRNA-mRNA co-expression
network
Among the verified lncRNAs, NONMMUT031874.2 was
highly expressed compared with the other verified lncRNAs. The KEGG
analysis indicated that SOCS3 played a notable role in the insulin
signaling pathway. In the latter, SOCS3 was reportedly involved in
the development of IR (24). To
assess this potential interaction, a lncRNA-miRNA-mRNA-related
network was constructed and the results showed that NONMMUT031874.2
may regulate SOCS3 expression by interacting with miR-7054-5p,
miR-7669-3p, miR-1894-3p, miR-7016-3p and miR-7076-5p (Fig. 7A).
LncRNA-miRNA-mRNA base-pairing
diagram
To explore the potential molecular mechanism of
NONMMUT031874.2, NONCODE (http://www.noncode.org/) and miRBase online databases
(http://www.mirbase.org/index.shtml)
were used, which showed that the mouse NONMMUT031874.2 sequence
contains an miR-7054-5p binding site. In addition, the Targetscan
database (http://www.targetscan.org/vert_71/) also predicted
that SOCS3 is a target gene of miR-7054-5p (Fig. 7B and C). These results suggest that
NONMMUT031874.2 may regulate the expression of SOCS3 through
miR-7054-5p.
miRNA-7054-5p expression in liver
tissues of mice in the three groups
The expression of miR-7054-5p in the liver tissues
was measured by RT-qPCR. The expression of miR-7054-5p mRNA in the
HFD group was significantly decreased compared with that in the CON
group, whilst its expression was significantly increased in the HFD
+ MET group compared with that in the HFD group (Fig. 6F).
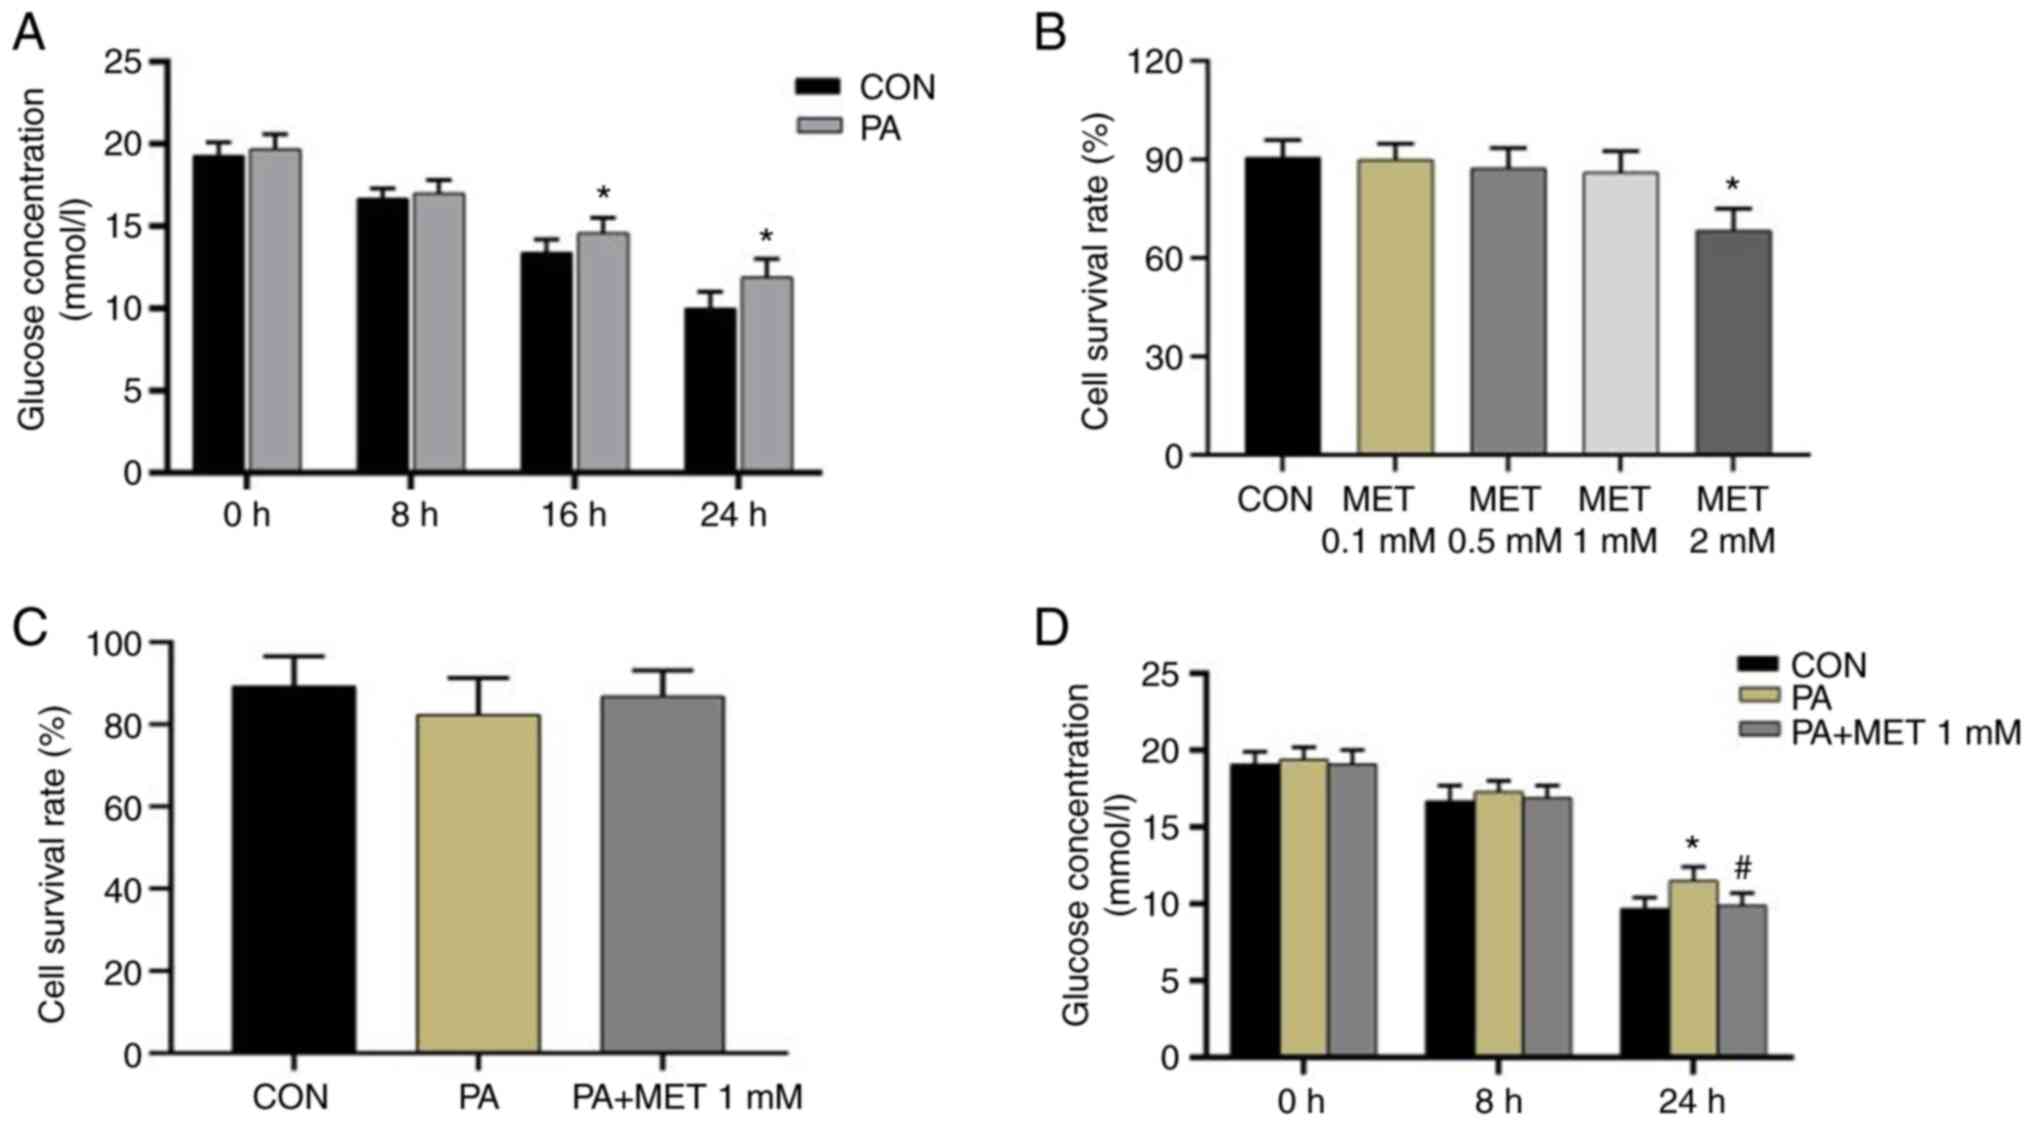
Establishment of an in vitro model of
insulin resistance
The insulin resistance model was established in
AML12 cells by treatment with PA, before the glucose concentrations
in the culture medium at 0, 8, 16 and 24 h after PA intervention
were measured. At 0 and 8 h, the glucose concentration in the
medium showed no significant difference between the CON and PA
groups. By contrast, at 16 and 24 h, the glucose concentration in
the PA group was higher compared with that in the CON group,
suggesting that the in vitro insulin resistance model had
been successfully established (Fig.
8A). This could be seen as after 24 h of treatment with PA in
AML12 cells, the glucose concentration in the culture medium of the
PA group was significantly higher compared with that of the Con
group, which indicated that the gluconeogenesis of these cells was
significantly increased due to the PA, and more glucose was
released into the culture medium. Therefore, it can be demonstrated
that the insulin resistance model was successfully established.
Cell viability assay
AML12 cells were treated with different
concentrations of MET (0.1, 0.5, 1 and 2 mM). MET at a
concentration of 2 mM significantly reduced cell viability compared
with that in the CON group (Fig.
8B). To observe the effect of MET on cells after PA
intervention, 1 mM was selected as the MET concentration for
further functional analysis. The cell survival rate did not differ
significantly among the three groups (Fig. 8C).
Changes in glucose concentration after
PA and MET treatment
After the cells were treated with PA and 1 mM MET,
no significant difference in glucose concentration could be found
among the three groups at 0 and 8 h. However, compared with those
in the CON group, the media glucose levels in the PA group were
significantly increased at 24 h. After treatment with MET, the
glucose levels were significantly decreased at 24 h (Fig. 8D).
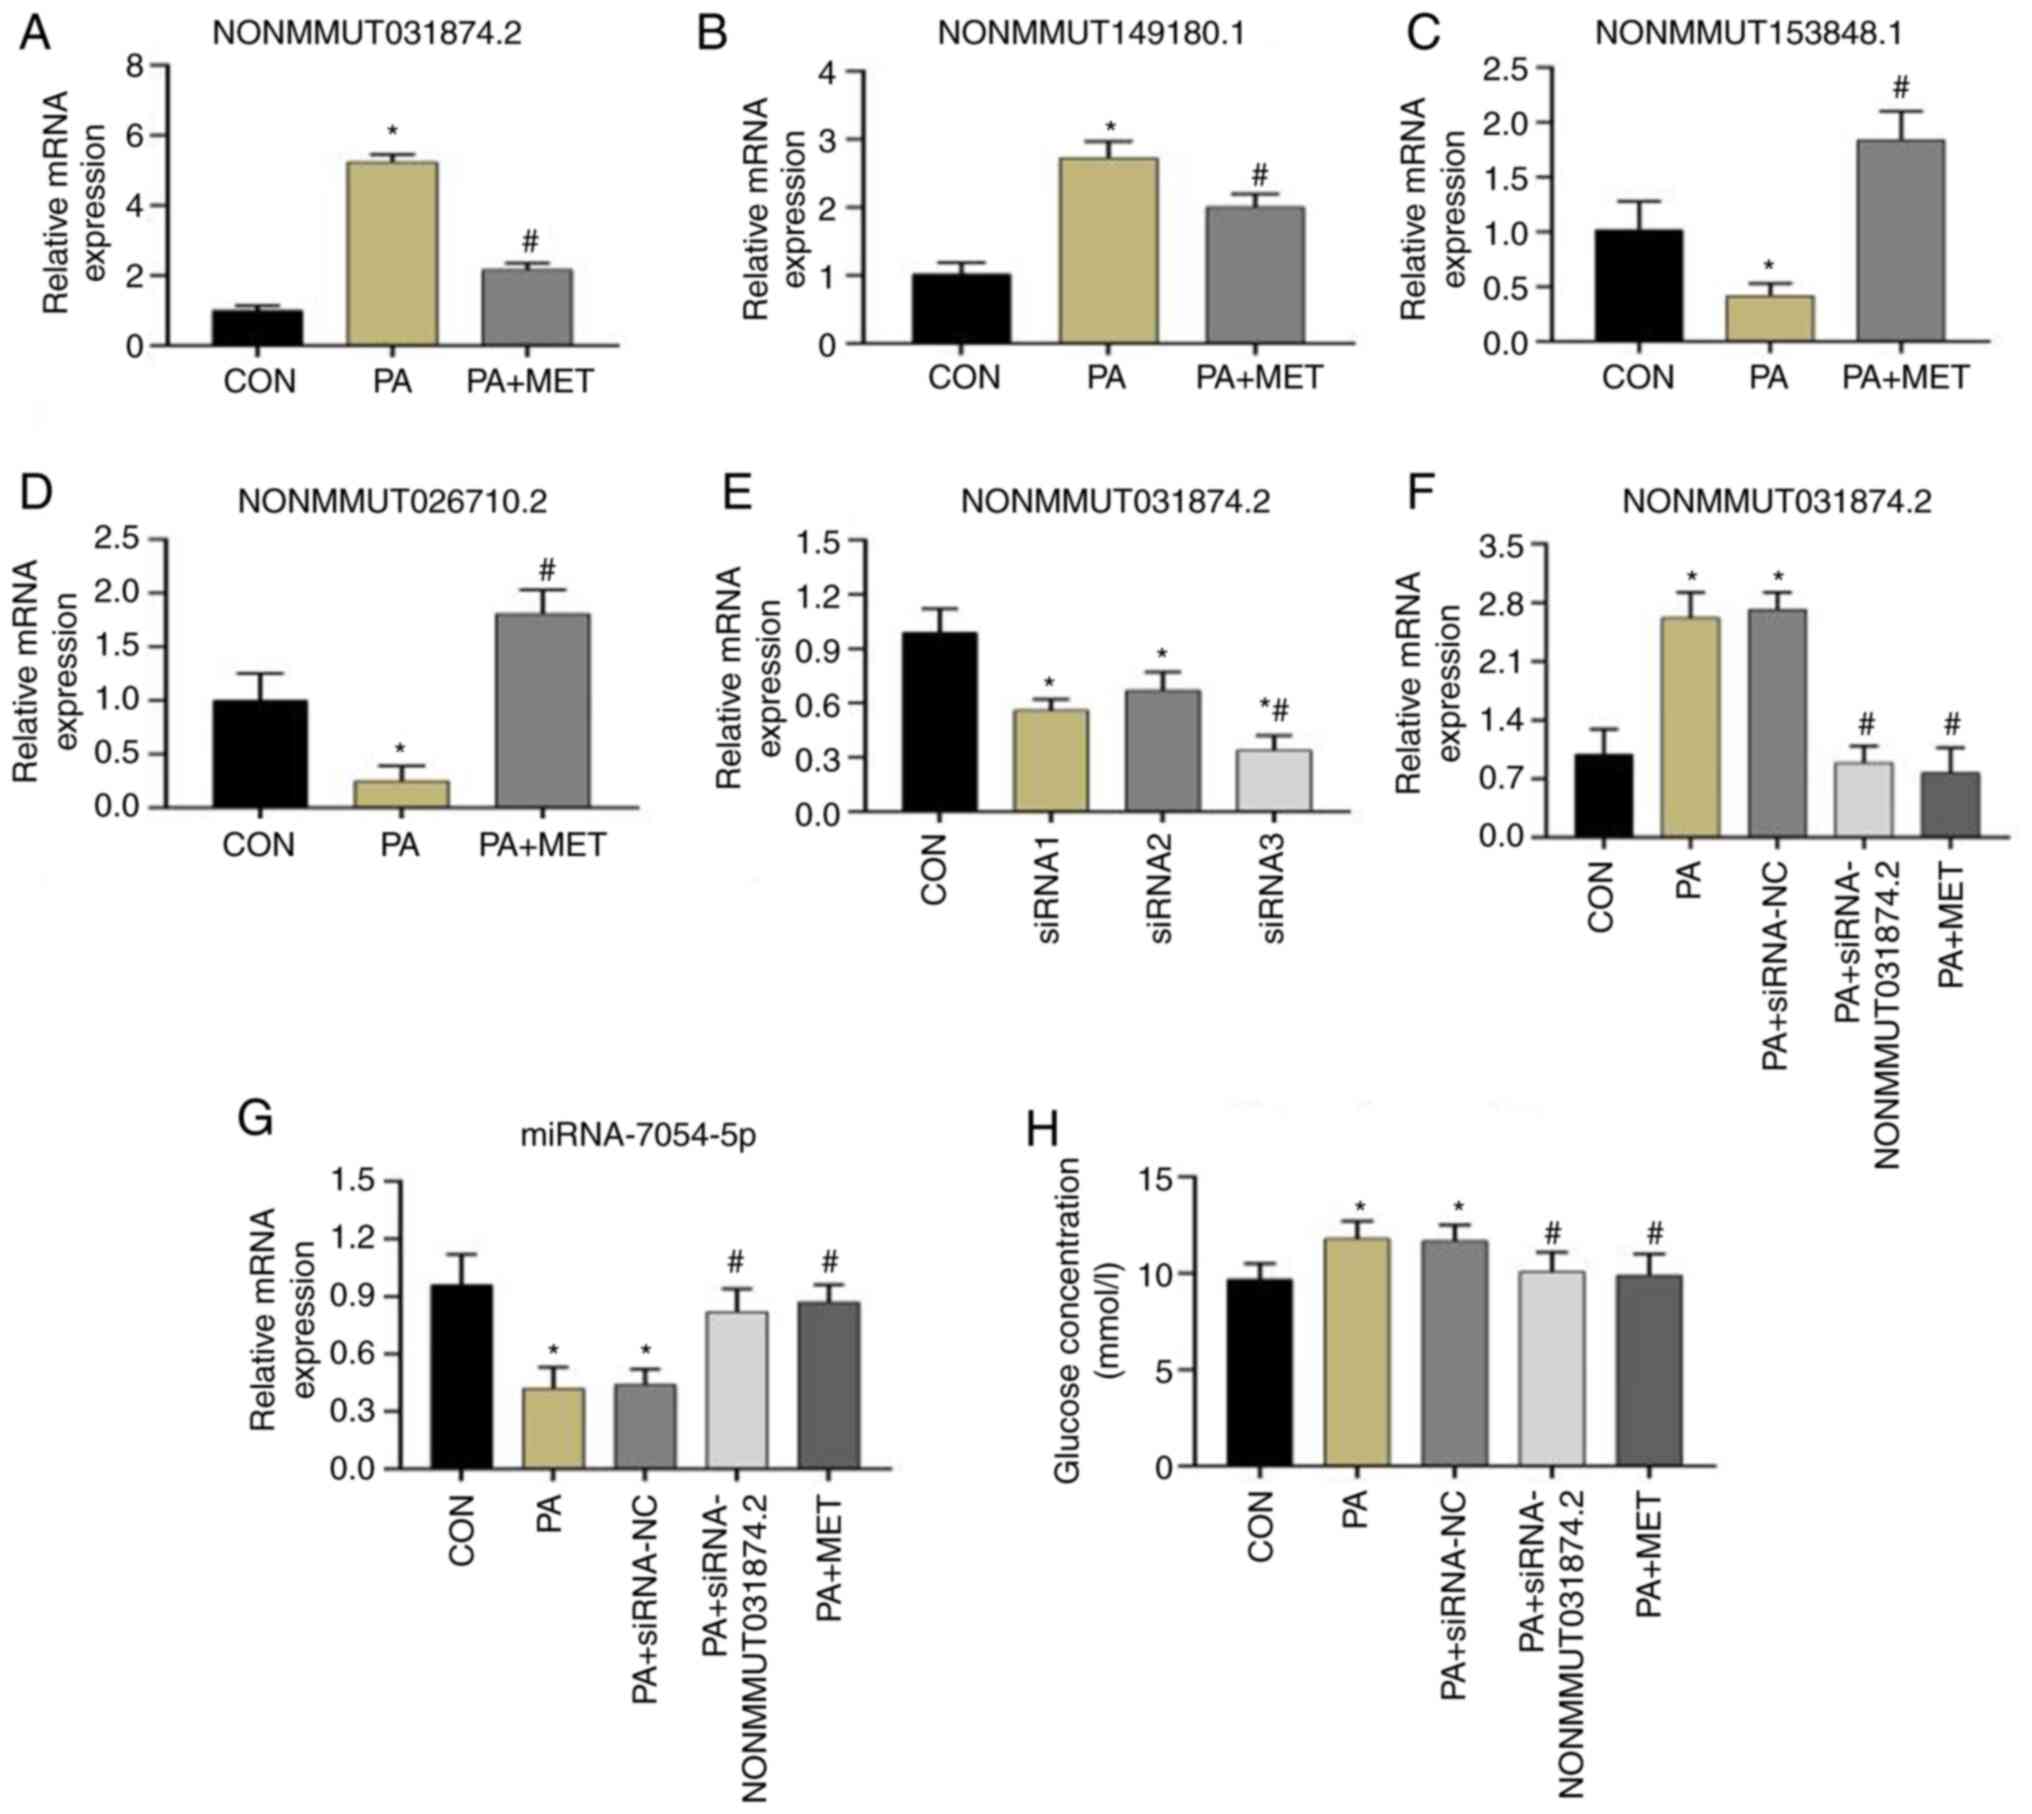
Verification of lncRNAs in AML12
cells
Among the lncRNAs that were differentially expressed
by MET treatment after HFD feeding and then verified, two lncRNAs
that were upregulated by HFD and reversed by MET (NONMMUT031874.2
and NONMMUT149180.1) and two lncRNAs that exhibited the opposite
pattern (NONMMUT153848.1 and NONMMUT026710.2) were randomly
selected. The AML12 cell RNA samples were subjected to RT-qPCR to
verify the sequencing results in AML12 cells. As shown by RT-qPCR,
it was shown that the expression patterns of these four lncRNAs
were consistent with the results of sequencing analyses of the
mouse liver samples (Fig.
9A-D).
Expression of NONMMUT031874.2 mRNA
after different siRNAs were transfected into AML12 cells
After the three different siRNAs were transfected
into AML12 cells for 24 h, the results of RT-qPCR showed that,
compared with those in the CON group (the cells without siRNA), the
expression levels of NONMMUT031874.2 in the three siRNA groups were
significantly decreased. Compared with the levels in the siRNA1 and
siRNA2 groups, NONMMUT031874.2 expression in the siRNA3 group was
lower, with the difference significant compared with siRNA2. This
suggested that the knockdown efficiency of siRNA3 was the most
efficient, which was used for subsequent experiments (Fig. 9E).
Expression of NONMMUT031874.2 mRNA in
the CON, PA, PA + siRNA-NC, PA + siRNA-NONMMUT031874.2 and PA + MET
groups
After NONMMUT031874.2 siRNA transfection into AML12
cells, compared with that in the CON group, the expression of
NONMMUT031874.2 in the PA and the PA + siRNA-NC groups was
significantly increased. In addition, the expression of
NONMMUT031874.2 in the PA + siRNA-NONMMUT031874.2 and PA + MET
groups was significantly decreased compared with that in the PA
group. There was no difference between the PA +
siRNA-NONMMUT031874.2 group and the PA + MET group (Fig. 9F).
Expression of miR-7054-5p mRNA after
knocking down NONMMUT031874.2 expression
After siRNA transfection into AML12 cells, compared
with that in the CON group, the expression of miR-7054-5p was
significantly decreased in the PA and PA + siRNA-NC groups. In
addition, the expression of miR-7054-5p in the PA + siRNA-NONMMUT
031874.2 and PA + MET groups was significantly increased compared
with that in the PA group. The expression levels in the PA +
siRNA-NONMMUT031874.2 and PA + MET groups did not differ from each
other (Fig. 9G).
Changes in glucose concentration after
NONMMUT031874.2 knockdown
After siRNA transfection into AML12 cells, the
glucose concentration in the medium of cells in the PA and PA +
siRNA-NC groups were significantly increased compared with that in
the CON group. Additionally, the glucose concentration of cells in
the PA + siRNA-NONMMUT031874.2 and PA + MET groups were
significantly decreased compared with that in the PA group.
However, there was no significant difference between the glucose
levels of cells in the PA + siRNA-NONMMUT031874.2 and PA + MET
groups (Fig. 9H).
Effect of MET on insulin signaling
pathway after knockdown of NONMMUT031874.2
Compared with that in the CON group, the expression
of SOCS3 and PEPCK in the PA and PA + siRNA-NC groups were
significantly higher, whilst the levels of p-AKT/AKT and
p-PI3K/PI3K were significantly decreased (Fig. 10). Compared with that in the PA
group, the expression of PEPCK and SOCS3 in the PA +
siRNA-NONMMUT031874.2 and PA + MET groups were significantly
decreased, whilst the levels of p-AKT/AKT and p-PI3K/PI3K were
significantly increased (Fig.
10). In addition, compared with that in the PA +
siRNA-NONMMUT031874.2 group, the expression of PEPCK was markedly
decreased in the PA + MET group though these differences did not
reach statistical significance (Fig.
10F). The expression of SOCS3 in the PA + MET group was
decreased significantly compared with that in the PA +
siRNA-NONMMUT031874.2 group, although there were no significant
differences in the expression of AKT and PI3K among the groups
(Fig. 10B and C). These results suggest that the
mechanism by which MET improves insulin resistance may be
associated with the downregulation of NONMMUT031874.2.
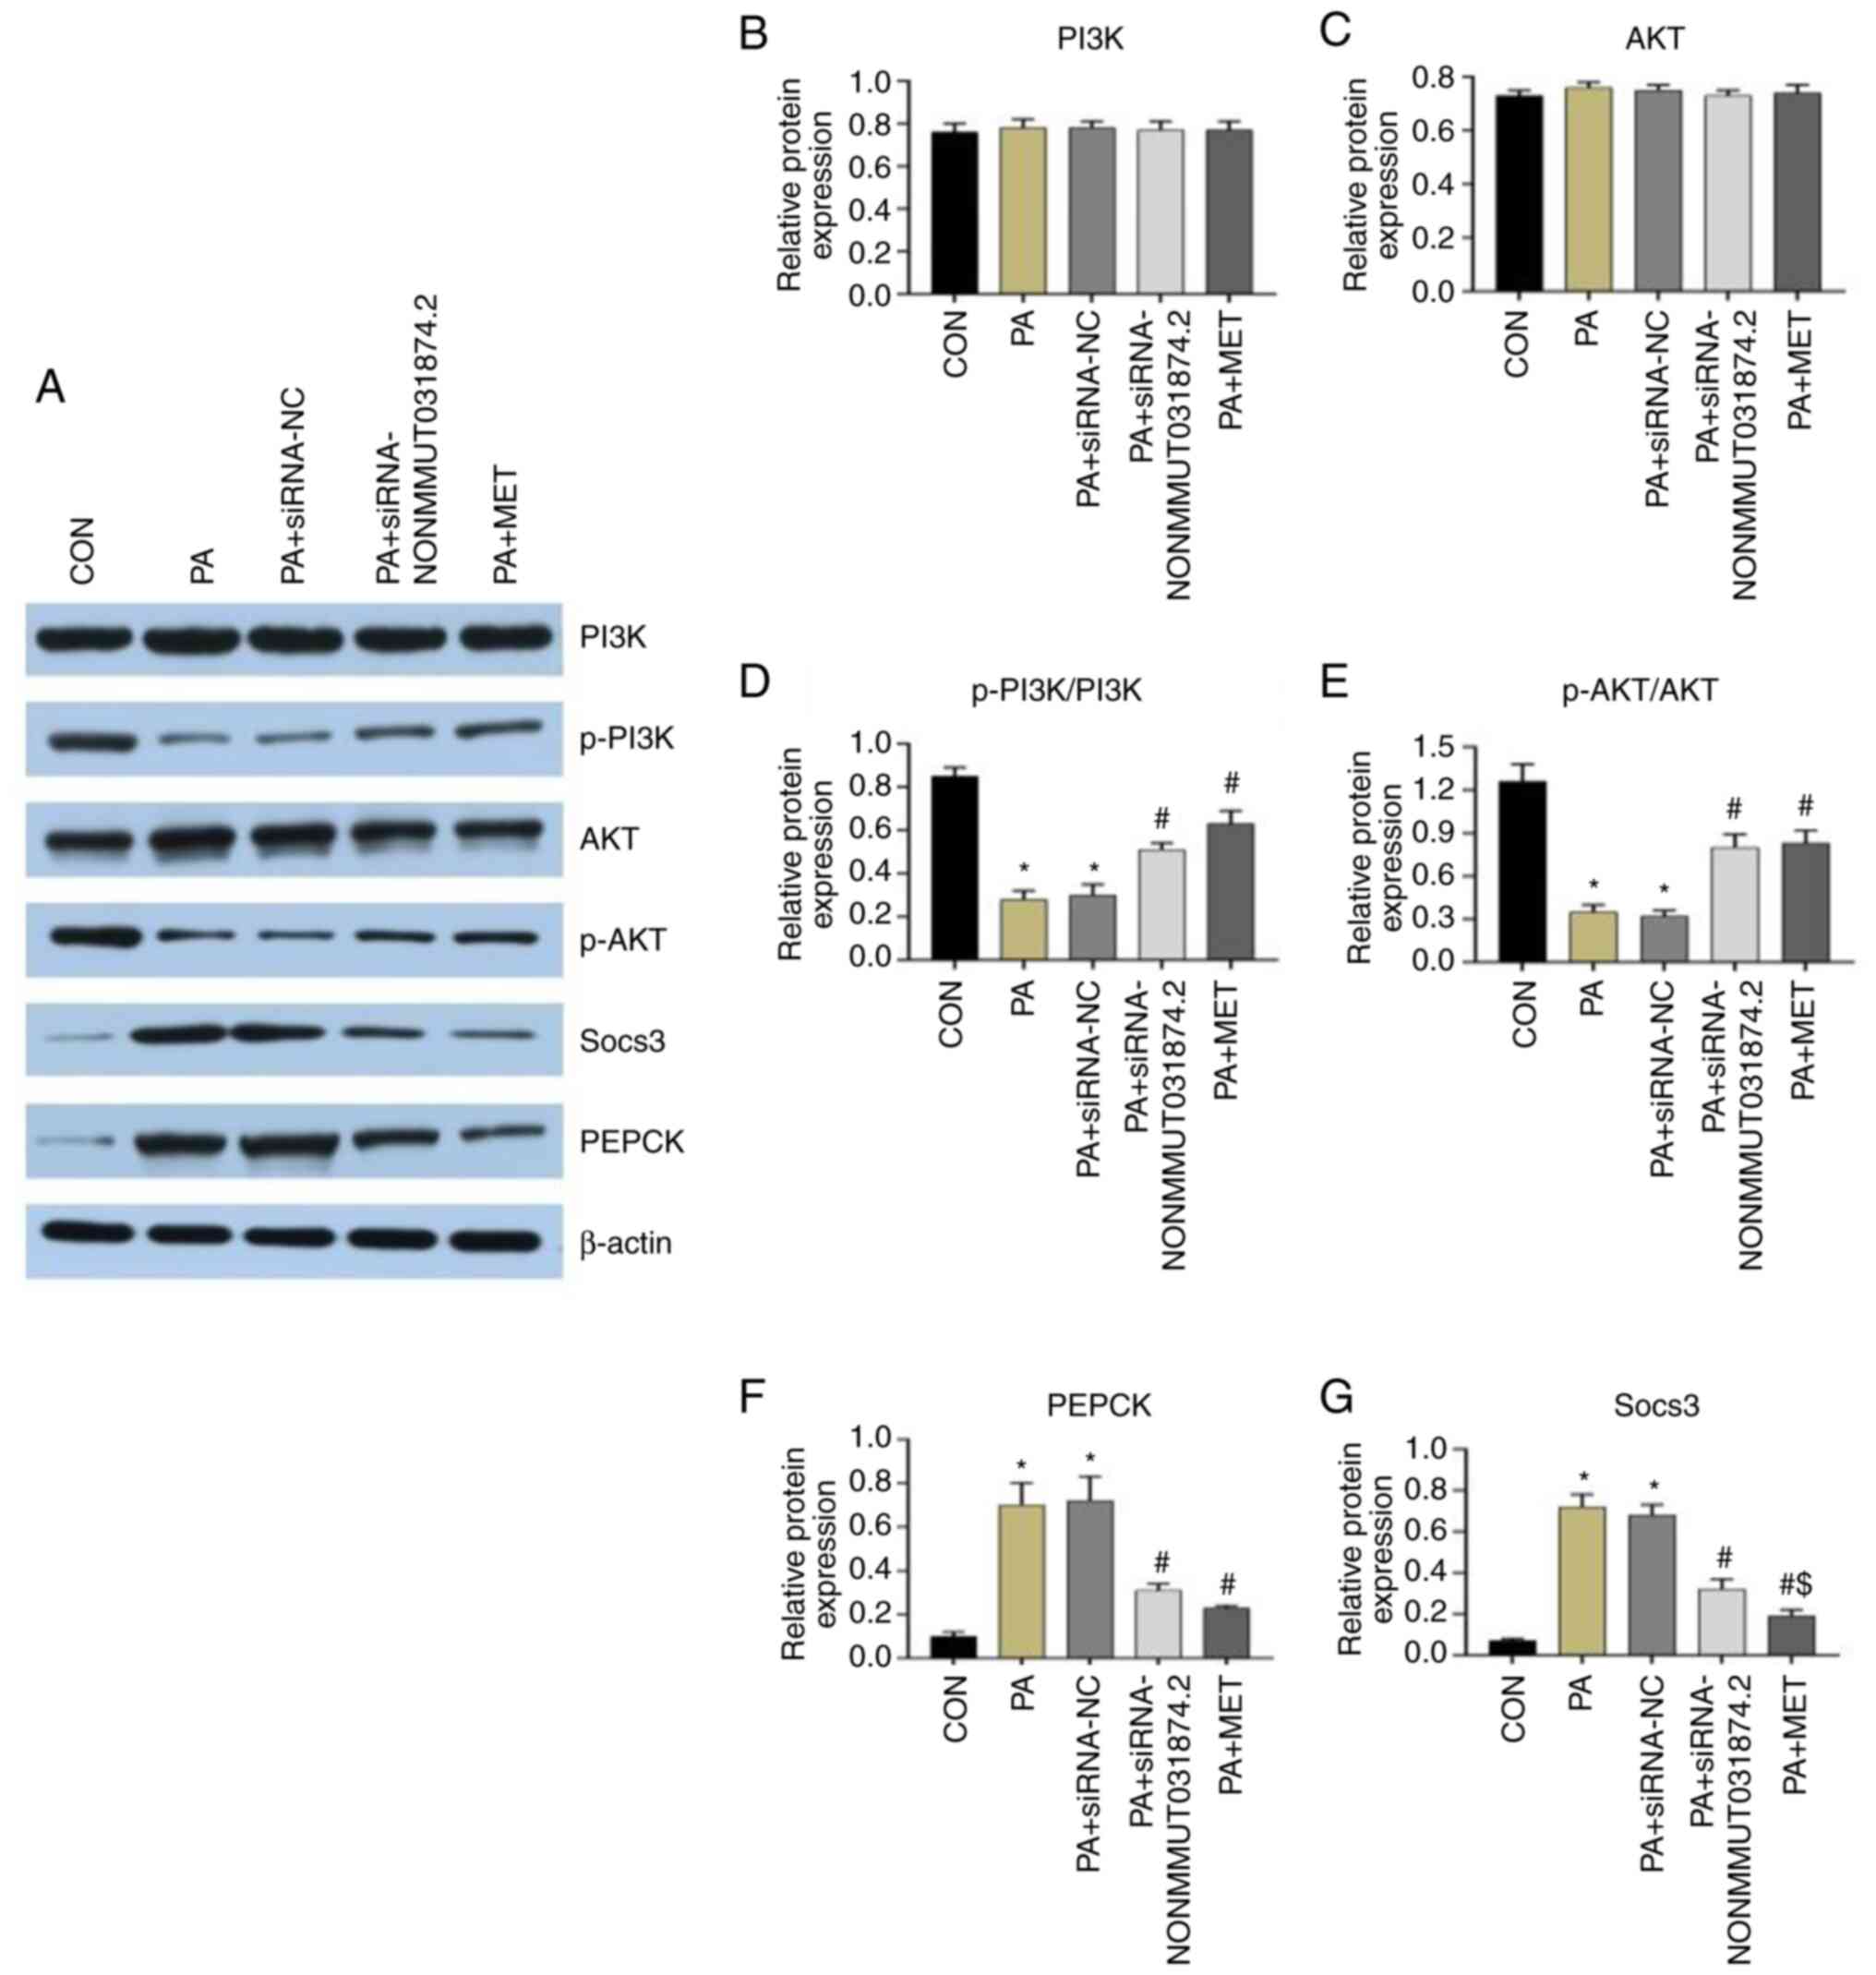 | Figure 10Effect of MET treatment or
NONMMUT031874.2 knockdown on insulin signaling. (A) Representative
western blotting images insulin signaling pathway components. (B)
PI3K, (C) AKT, (D) p-PI3K/PI3K, (E) p-AKT/AKT, (F) PEPCK and (G)
Socs3 protein levels. Data are presented as the mean ± SD (n=3).
*P<0.05 vs. CON and #P<0.05 vs. PA,
$P<0.05 vs. PA + siRNA-NONMMUT031874.2. CON, control;
PA, palmitic acid; siRNA, small interfering RNA; NC, negative
control; MET, metformin; p-, phosphorylated; Socs3, suppressor of
cytokine signaling 3; PEPCK, phosphoenolpyruvate carboxykinase. |
Discussion
Over the past number of decades, the incidence of
type 2 diabetes has been consistently increasing. It is expected to
increase further by 55% in the year 2035 and affect 591.9 million
people globally (25). The
pathogenesis of type 2 diabetes is complex. However, the most
significant pathogenic factor is disruption of the insulin
signaling pathway, which leads to insulin resistance (26).
Previous studies have shown that lncRNA MALAT1 and
NONMMUT008655.2 can promote insulin resistance (27,28).
Islet-enriched lncRNA glucose transporter 1 has been reported to be
involved in the regulation of insulin secretion. Yin et al
(29) revealed that downregulation
of lncRNA TUG1 can increase islet β cell apoptosis and reduce
insulin secretion both in vitro and in vivo
conditions and then regulate the occurrence and development of
diabetes. In addition, studies have previously shown that MET can
ameliorate insulin resistance in hepatic cells (19) and can exert anti-inflammatory and
antioxidant effects in insulin-resistant HepG2 cells (30). MET also can reduce blood lipid
levels and alleviate insulin resistance in mice (31). In the present study, MET
significantly reduced fasting blood glucose and insulin levels, in
addition to TG, TC and FFA in mice that were fed on a high-fat
diet. MET also increased the levels of HDL-C and QUICKI values.
These results suggest that MET can reduce insulin resistance in
mice fed on a high-fat diet. However, whether MET can improve
insulin resistance by regulating the expression of lncRNAs remains
controversial.
According to high-throughput sequencing results in
the present study, among the upregulated lncRNAs in the HFD group,
386 lncRNAs were downregulated in the HFD + MET group. Among the
lncRNAs downregulated in the HFD group, 202 lncRNAs were
upregulated in the HFD + MET group. RT-qPCR verified these results,
suggesting that MET may improve insulin resistance in mice by
regulating the expression of lncRNAs. Among the verified lncRNAs,
NONMMUT031874.2 was the most highly expressed. Furthermore,
differentially-expressed mRNAs were found to be associated with the
insulin signaling pathway, where subsequent pathway analysis
predicted that NONMMUT031874.2 was closely related to SOCS3.
SOCS3 is an important member of the SOCS family,
which serves as a negative modulator of insulin signaling in
sensitive tissues, including hepatocytes and adipocytes (32). In a previous study, it was found
that insulin resistance in diabetic mice was significantly improved
after knocking down SOCS3 expression. In addition, the expression
of SOCS3 in obese mice with insulin resistance is higher compared
with that in the control group (33).
The PI3K/AKT pathway is an important component of
the insulin signaling pathway that can regulate hepatic glucose
synthesis and transport (34).
Insulin promotes insulin receptor substrate (IRS) 2 tyrosine
phosphorylation and transmits signals through to the PI3K/AKT
pathway (35). Previous studies
found that in AML12 cells treated with PA, the phosphorylation
levels of STAT3 and SOCS3 expression were increased significantly,
thereby activating sterol regulatory element binding protein-1c and
inhibiting the PI3K/AKT pathway, leading to disorders in glucose
and lipid metabolism (36). MET
has been found to downregulate the expression levels of PEPCK and
G6PC in insulin-resistant HepG2 cells by upregulating the
expression levels of IRS-1, p-PI3K and p-AKT (37). Additionally, the levels of
inflammatory factors SOCS3, IL-6 and TNF-α were found to be
increased in rats fed on an HFD combined with low-dose
levostreptozotocin treatment, by acting on the PI3K/AKT pathway to
increase blood glucose levels (38). The present study found that, the
expression levels of SOCS3, PEPCK and G6PC were increased in the
HFD group compared with CON group. After intervention with MET,
these changes were reversed. This suggests that MET can reduce
insulin resistance.
AML12 cells have been previously used to establish
an insulin resistance model in vitro (39). In the present study, these cells
were treated with 0.25 mM PA to induce insulin resistance,
following which glucose concentration in the medium was determined
at 0, 8, 16 and 24 h. The glucose concentration in the media was
increased at 24 h, suggesting that the insulin resistance model was
successfully established.
Previous studies have revealed an increasing number
of lncRNAs that can serve important roles in alleviating insulin
resistance (40,41). To clarify the potential
relationship between NONMMUT031874.2 and SOCS3 further, a
lncRNA-miRNA-mRNA network diagram was constructed. According to the
NONCODE, miRbase and Targetscan databases, NONMMUT031874.2 and
miR-7054-5p; and miR-7054-5p and Socs3 base-pairing diagrams, were
created. The results from these diagrams suggest that
NONMMUT031874.2 may regulate the expression of SOCS3 through
miR-7054-5p. Fan et al (42) demonstrated that lncRNA ADAMTS9-AS1
can participate in breast cancer by regulating the expression of
miRNA-182 targets. In addition, Zhu et al (43) have found that MEG3 can promote
hepatic insulin resistance by serving as a ceRNA of miR-214 to
facilitate ATF4 expression. However, in HFD fed mice, MEG3
knockdown can upregulate miR-214 expression, downregulate ATF4
expression and then improve insulin resistance.
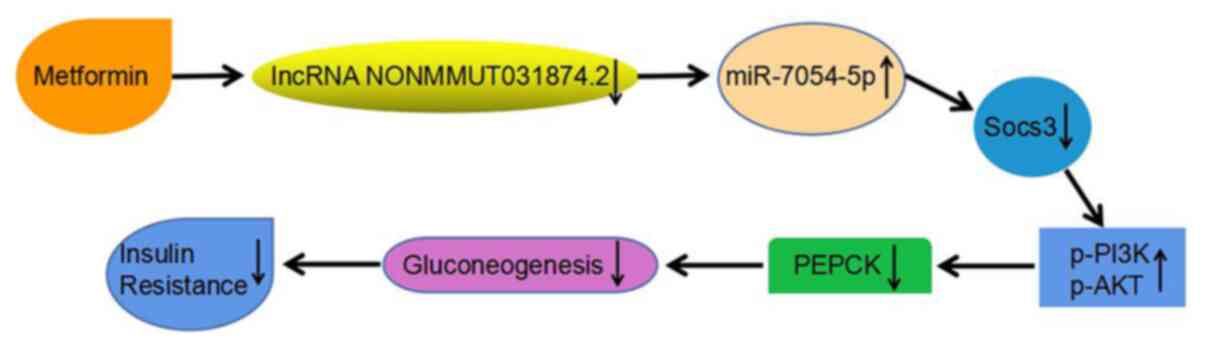
To explore the function of NONMMUT031874.2, siRNA
was used for transfection into AML12 cells to knock down
NONMMUT031874.2 expression, before PA and MET were performed.
Subsequently, the expression levels of NONMMUT031874.2, miR-7054-5p
and insulin signaling pathway-related proteins, in addition to
glucose concentration in the culture medium, were all measured in
the different groups. The results revealed that knocking down
NONMMUT031874.2 expression and treatment with MET mediated similar
effects in ameliorating insulin resistance and decreasing the
glucose concentrations. In these cells, MET increased the
expression of miR-7054-5p by downregulating the expression of
NONMMUT031874.2, thereby improving insulin resistance by
downregulating the expression of SOCS3, which increased the
expression of p-PI3K/p-AKT (Fig.
11).
In conclusion, according to the results of
high-throughput sequencing analysis and studies in vivo and
in vitro in the present study, NONMMUT031874.2 appeared to
be a key molecule that can alleviate insulin resistance in the
liver. These results also suggest that NONMMUT031874.2 may improve
insulin resistance through the miR-7054-5p/SOCS3 axis, in addition
to being a target of MET for insulin resistance.
Supplementary Material
Differentially-expressed lncRNAs found
in mice fed with ND, HD or MH.
Differentially-expressed mRNAs found
in mice fed with ND, HD or MH.
Acknowledgements
Not applicable.
Funding
Funding: The present study was supported by a Natural Science
Foundation of Hebei Province grant (grant no. H201830-7071).
Availability of data and materials
The datasets generated and/or analyzed during the
current study are available in the GEO database under the accession
number GSE137840.
Authors' contributions
ZMZ performed the experiments, analyzed the data and
wrote the manuscript. CW and GYS designed the study and edited
drafts of the manuscript. LLY interpretated the data and revised
the manuscript. XMZ and LQY collected the data. ZHL and QN
performed the experiments and prepared the figures. ZMZ and ZHL
confirm the authenticity of all the raw data. All authors read and
approved the final manuscript, and agree to be accountable for all
aspects of the work.
Ethics approval and consent to
participate
Experiments were approved by the Ethics Committee of
Hebei General Hospital (approval no. 2019E368; Shijiazhuang, China)
and complied with the Animal (Scientific Procedures) Act 1986 and
associated guidelines (14).
Patient consent for publication
Not applicable.
Competing interests
The authors declare that they have no competing
interests.
References
|
1
|
Ning G: Decade in review-type 2 diabetes
mellitus: At the centre of things. Nat Rev Endocrinol. 11:636–638.
2015.PubMed/NCBI View Article : Google Scholar
|
|
2
|
Ogurtsova K, da Rocha Fernandes JD, Huang
Y, Linnenkamp U, Guariguata L, Cho NH, Cavan D, Shaw JE and
Makaroff LE: IDF diabetes atlas: Global estimates for the
prevalence of diabetes for 2015 and 2040. Diabetes Res Clin Pract.
128:40–50. 2017.PubMed/NCBI View Article : Google Scholar
|
|
3
|
Akash MSH, Rehman K and Liaqat A: Tumor
necrosis factor-alpha: Role in development of insulin resistance
and pathogenesis of type 2 diabetes mellitus. J Cell Biochem.
119:105–110. 2018.PubMed/NCBI View Article : Google Scholar
|
|
4
|
Kurokawa R, Rosenfeld MG and Glass CK:
Transcriptional regulation through noncoding RNAs and epigenetic
modifications. RNA Biol. 6:233–236. 2009.PubMed/NCBI View Article : Google Scholar
|
|
5
|
Ravasi T, Suzuki H, Pang KC, Katayama S,
Furuno M, Okunishi R, Fukuda S, Ru K, Frith MC, Gongora MM, et al:
Experimental validation of the regulated expression of large
numbers of non-coding RNAs from the mouse genome. Genome Res.
16:11–19. 2006.PubMed/NCBI View Article : Google Scholar
|
|
6
|
Sathishkumar C, Prabu P, Mohan V and
Balasubramanyam M: Linking a role of lncRNAs (long non-coding RNAs)
with insulin resistance, accelerated senescence, and inflammation
in patients with type 2 diabetes. Hum Genomics.
12(41)2018.PubMed/NCBI View Article : Google Scholar
|
|
7
|
Hanson A, Wilhelmsen D and DiStefano JK:
The role of long non-coding RNAs (lncRNAs) in the development and
progression of fibrosis associated with nonalcoholic fatty liver
disease (NAFLD). Noncoding RNA. 4(18)2018.PubMed/NCBI View Article : Google Scholar
|
|
8
|
Pielok A and Marycz K: Non-coding RNAs as
potential novel biomarkers for early diagnosis of hepatic insulin
resistance. Int J Mol Sci. 21(4182)2020.PubMed/NCBI View Article : Google Scholar
|
|
9
|
Davies MJ, D'Alessio DA, Fradkin J, Kernan
WN, Mathieu C, Mingrone G, Rossing P, Tsapas A, Wexler DJ and Buse
JB: Management of hyperglycaemia in type 2 diabetes, 2018. A
consensus report by the American diabetes association (ADA) and the
European association for the study of diabetes (EASD).
Diabetologia. 61:2461–2498. 2018.PubMed/NCBI View Article : Google Scholar
|
|
10
|
Hundal RS, Krssak M, Dufour S, Laurent D,
Lebon V, Chandramouli V, Inzucchi SE, Schumann WC, Petersen KF,
Landau BR and Shulman GI: Mechanism by which metformin reduces
glucose production in type 2 diabetes. Diabetes. 49:2063–2069.
2000.PubMed/NCBI View Article : Google Scholar
|
|
11
|
Ren GF, Xiao LL, Ma XJ, Yan YS and Jiao
PF: Metformin decreases insulin resistance in type 1 diabetes
through regulating p53 and RAP2A in vitro and in vivo. Drug Des
Devel Ther. 14:2381–2392. 2020.PubMed/NCBI View Article : Google Scholar
|
|
12
|
Grycel S, Markowski AR, Hady HR, Zabielski
P, Kojtallmierska M, Górski J and Blachnio-Zabielska AU: Metformin
treatment affects adipocytokine secretion and lipid composition in
adipose tissues of diet-induced insulin-resistant rats. Nutrition.
63-64:126–133. 2019.PubMed/NCBI View Article : Google Scholar
|
|
13
|
Wang Y, Tang H, Ji X, Zhang Y, Xu W, Yang
X, Deng R, Liu Y, Li F, Wang X and Zhou L: Expression profile
analysis of long non-coding RNAs involved in the
metformin-inhibited gluconeogenesis of primary mouse hepatocytes.
Int J Mol Med. 41:302–310. 2018.PubMed/NCBI View Article : Google Scholar
|
|
14
|
Ferdowsian H: Human and animal research
guidelines: Aligning ethical constructs with new scientific
developments. Bioethics. 25:472–478. 2011.PubMed/NCBI View Article : Google Scholar
|
|
15
|
Zhao H, Zhang Y, Shu L, Song G and Ma H:
Resveratrol reduces liver endoplasmic reticulum stress and improves
insulin sensitivity in vivo and in vitro. Drug Des Devel Ther.
13:1473–1485. 2019.PubMed/NCBI View Article : Google Scholar
|
|
16
|
Katz A, Nambi SS, Mather K, Baron AD,
Follmann DA, Sullivan G and Quon MJ: Quantitative insulin
sensitivity check index: A simple, accurate method for assessing
insulin sensitivity in humans. J Clin Endocrinol Metab.
85:2402–2410. 2000.PubMed/NCBI View Article : Google Scholar
|
|
17
|
Fang F, Li H, Qin T, Li M and Ma S: Thymol
improves high-fat diet-induced cognitive deficits in mice via
ameliorating brain insulin resistance and upregulating NRF2/HO-1
pathway. Metab Brain Dis. 32:385–393. 2017.PubMed/NCBI View Article : Google Scholar
|
|
18
|
Zhang R, Chu K, Zhao N, Wu J, Ma L, Zhu C,
Chen X, Wei G and Liao M: Corilagin alleviates nonalcoholic fatty
liver disease in high-fat diet-induced C57BL/6 mice by ameliorating
oxidative stress and restoring autophagic flux. Front Pharmacol.
10(1693)2020.PubMed/NCBI View Article : Google Scholar
|
|
19
|
Villalva-Pérez JM, Ramírez-Vargas MA,
Serafín-Fabían JI, Ramírez M, Moreno-Godínez ME, Espinoza-Rojo M
and Flores-Alfaro E: Characterization of Huh7 cells after the
induction of insulin resistance and post-treatment with metformin.
Cytotechnology. 72:499–511. 2020.PubMed/NCBI View Article : Google Scholar
|
|
20
|
Livak KJ and Schmittgen TD: Analysis of
relative gene expression data using real-time quantitative PCR and
the 2(-delta C(T)) method. Methods. 25:402–408. 2001.PubMed/NCBI View Article : Google Scholar
|
|
21
|
Robinson MD, McCarthy DJ and Smyth GK:
edgeR: A bioconductor package for differential expression analysis
of digital gene expression data. Bioinformatics. 26:139–140.
2010.PubMed/NCBI View Article : Google Scholar
|
|
22
|
Moriya Y, Itoh M, Okuda S, Yoshizawa A and
Kanehisa M: KAAS: An automatic genome annotation and pathway
reconstruction server. Nucleic Acids Res. 35 (Web Server
Issue):W182–W185. 2007.PubMed/NCBI View Article : Google Scholar
|
|
23
|
Rice P, Longden I and Bleasby A: EMBOSS:
The European molecular biology open software suite. Trends Genet.
16:276–277. 2000.PubMed/NCBI View Article : Google Scholar
|
|
24
|
Li YC, Kang L, Huang J, Zhang J, Liu C and
Shen W: Effects of miR-152-mediated targeting of SOCS3 on hepatic
insulin resistance in gestational diabetes mellitus mice. Am J Med
Sci. 361:365–374. 2021.PubMed/NCBI View Article : Google Scholar
|
|
25
|
Guariguata L, Whiting DR, Hambleton I,
Beagley J, Linnenkamp U and Shaw JE: Global estimates of diabetes
prevalence for 2013 and projections for 2035. Diabetes Res Clin
Pract. 103:137–149. 2014.PubMed/NCBI View Article : Google Scholar
|
|
26
|
Kim J, Bilder D and Neufeld TP: Mechanical
stress regulates insulin sensitivity through integrin-dependent
control of insulin receptor localization. Genes Dev. 32:156–164.
2018.PubMed/NCBI View Article : Google Scholar
|
|
27
|
Yan C, Chen J and Chen N: Long noncoding
RNA MALAT1 promotes hepatic steatosis and insulin resistance by
increasing nuclear SREBP-1c protein stability. Sci Rep.
6(22640)2016.PubMed/NCBI View Article : Google Scholar
|
|
28
|
Shu L, Hou G, Zhao H, Huang W, Song G and
Ma H: Resveratrol improves high-fat diet-induced insulin resistance
in mice by downregulating the lncRNA NONMMUT008655.2. Am J Transl
Res. 12:1–18. 2020.PubMed/NCBI
|
|
29
|
Yin DD, Zhang EB, You LH, Wang N, Wang LT,
Jin FY, Zhu YN, Cao LH, Yuan QX, De W and Tang W: Downregulation of
lncRNA TUG1 affects apoptosis and insulin secretion in mouse
pancreatic β cells. Cell Physiol Biochem. 35:1892–1904.
2015.PubMed/NCBI View Article : Google Scholar
|
|
30
|
Yang Q, Zhu Z, Wang L, Xia H, Mao J, Wu J,
Kato K, Li H, Zhang J, Yamanaka K and An Y: The protective effect
of silk fibroin on high glucose induced insulin resistance in HepG2
cells. Environ Toxicol Pharmacol. 69:66–71. 2019.PubMed/NCBI View Article : Google Scholar
|
|
31
|
Choi BR, Kim HJ, Lee YJ and Ku SK:
Anti-diabetic obesity effects of Wasabia japonica matsum leaf
extract on 45% kcal high-fat diet-fed mice. Nutrients.
12(2837)2020.PubMed/NCBI View Article : Google Scholar
|
|
32
|
Cao L, Wang Z and Wan W: Suppressor of
cytokine signaling 3: Emerging role linking central insulin
resistance and Alzheimer's disease. Front Neurosci.
12(417)2018.PubMed/NCBI View Article : Google Scholar
|
|
33
|
Galic S, Sachithanandan N, Kay TW and
Steinberg GR: Suppressor of cytokine signalling (SOCS) proteins as
guardians of inflammatory responses critical for regulating insulin
sensitivity. Biochem J. 461:177–188. 2014.PubMed/NCBI View Article : Google Scholar
|
|
34
|
Song C, Liu D, Yang S, Cheng L, Xing E and
Chen Z: Sericin enhances the insulin-PI3K/AKT signaling pathway in
the liver of a type 2 diabetes rat model. Exp Ther Med.
16:3345–3352. 2018.PubMed/NCBI View Article : Google Scholar
|
|
35
|
Yang P, Liang Y, Luo Y, Li Z, Wen Y, Shen
J, Li R, Zheng H, Gu HF and Xia N: Liraglutide ameliorates
nonalcoholic fatty liver disease in diabetic mice via the
IRS2/PI3K/Akt signaling pathway. Diabetes Metab Syndr Obes.
12:1013–1021. 2019.PubMed/NCBI View Article : Google Scholar
|
|
36
|
Xu L, Li Y, Yin L, Qi Y, Sun H, Sun P, Xu
M, Tang Z and Peng J: miR-125a-5p ameliorates hepatic glycolipid
metabolism disorder in type 2 diabetes mellitus through targeting
of STAT3. Theranostics. 8:5593–5609. 2018.PubMed/NCBI View Article : Google Scholar
|
|
37
|
Yang Z, Huang W, Zhang J, Xie M and Wang
X: Baicalein improves glucose metabolism in insulin resistant HepG2
cells. Eur J Pharmacol. 854:187–193. 2019.PubMed/NCBI View Article : Google Scholar
|
|
38
|
Cui X, Qian DW, Jiang S, Shang EX, Zhu ZH
and Duan JA: Scutellariae radix and coptidis rhizoma improve
glucose and lipid metabolism in T2DM rats via regulation of the
metabolic profiling and MAPK/PI3K/Akt signaling pathway. Int J Mol
Sci. 19(3634)2018.PubMed/NCBI View Article : Google Scholar
|
|
39
|
Ma H, Yuan J, Ma J, Ding J, Lin W, Wang X,
Zhang M, Sun Y, Wu R, Liu C, et al: BMP7 improves insulin signal
transduction in the liver via inhibition of mitogen-activated
protein kinases. J Endocrinol. 243:97–110. 2019.PubMed/NCBI View Article : Google Scholar
|
|
40
|
Han M, You L, Wu Y, Gu N, Wang Y, Feng X,
Xiang L, Chen Y, Zeng Y and Zhong T: RNA-sequencing analysis
reveals the potential contribution of lncRNAs in palmitic
acid-induced insulin resistance of skeletal muscle cells. Biosci
Rep. 40(BSR20192523)2020.PubMed/NCBI View Article : Google Scholar
|
|
41
|
Chen DL, Shen DY, Han CK and Tian Y:
LncRNA MEG3 aggravates palmitate-induced insulin resistance by
regulating miR-185-5p/Egr2 axis in hepatic cells. Eur Rev Med
Pharmacol Sci. 23:5456–5467. 2019.PubMed/NCBI View Article : Google Scholar
|
|
42
|
Fan CN, Ma L and Liu N: Systematic
analysis of lncRNA-miRNA-mRNA competing endogenous RNA network
identifies four-lncRNA signature as a prognostic biomarker for
breast cancer. J Transl Med. 16(264)2018.PubMed/NCBI View Article : Google Scholar
|
|
43
|
Zhu X, Li H, Wu Y, Zhou J, Yang G and Wang
W: lncRNA MEG3 promotes hepatic insulin resistance by serving as a
competing endogenous RNA of miR-214 to regulate ATF4 expression.
Int J Mol Med. 43:345–357. 2019.PubMed/NCBI View Article : Google Scholar
|