Introduction
Sepsis is a condition of life-threatening organ
dysfunction caused by a dysregulated host response to infection
(1). As sepsis progresses, the
systemic inflammatory response can lead to multiple organ failures,
including that of the lung, kidney and liver. According to research
data published in The Lancet in 2020(2), it is estimated that there were 48.9
million global cases of sepsis in 2017, resulting in ~11 million
deaths and accounting for 19.7% of all global deaths. Due to its
complex pathogenesis, high morbidity and high fatality rate, sepsis
has caused a notable burden on human health and medical resources,
and has therefore become a major clinical research area in the
field of critical care medicine.
In recent years, a large number of studies have
explored the significance of biochemical indicators in the
diagnosis, staging, prognosis and clinical monitoring of patients
with sepsis (3-5).
Early diagnosis of sepsis allows clinicians to initiate effective
interventions at an early stage, such as the use of antibiotics and
supportive care, through the implementation of goal-directed
treatment to reduce the risk of mortality and improve the prognosis
of patients with sepsis. C-reactive protein (CRP) and procalcitonin
(PCT) are proteins produced during infection and inflammatory
response, and are currently the most widely used biomarkers in
sepsis diagnosis and disease monitoring (6,7). CRP
is an acute-phase protein, the level of which increases with the
inflammatory response; however, it has limited accuracy in
reflecting disease progression (6). PCT is a sensitive marker of the early
stages of infection (8), but it
does not reflect the disease progression in later stages, and
therefore its prognostic value is not high. It can be argued that
there is a lack of useful indicators for the rapid diagnosis and
prognosis of sepsis, and there is an urgent need to develop more
prognostic markers.
The third international consensus on sepsis in
2016(9) emphasized the use of the
sequential organ failure assessment (SOFA) score for functional
assessment and risk stratification of organs, and proposed the
‘infection + quick SOFA score (qSOFA) ≥2’ for the rapid diagnosis
of patients with suspected sepsis. The qSOFA score contains three
indicators: Hypotension [systolic blood pressure (BP) ≤100 mmHg],
shortness of breath (respiratory rate ≥22 breaths/min) and altered
mental status (Glasgow Coma Scale score ≤13). Each index is
assigned 1 point, and the risk of sepsis is significantly increased
in patients with qSOFA ≥2 points (10). This criterion will help clinicians
identify patients with sepsis as well as infected patients at risk
of developing sepsis.
Furthermore, patients with elevated conjugated
bilirubin (CB) levels have presented with higher illness severity
scores, and higher incidences of sepsis, shock and organ failure
(11). In addition, sepsis is
often accompanied by acute kidney injury, of which serum creatinine
level is a reliable indicator. As an independent risk factor, it
has significance for the diagnosis of acute kidney injury secondary
to sepsis (12,13). Thus, the qSOFA score, along with CB
and creatinine levels, may play a role as indicators in the
progression of sepsis. However, the significance of these factors
in the prediction of sepsis remains unknown. Hence, the aim of the
present study was to evaluate qSOFA scores, and serum CB and
creatinine levels during sepsis and septic shock to identify
whether they are associated with disease prognosis (28-day
mortality).
Patients and methods
Patients
A retrospective, observational study was conducted
at The Second Affiliated Hospital, Zhejiang University School of
Medicine (Hangzhou, China). A total of 360 nonsurgical and
non-trauma adult patients with sepsis or septic shock, who were
admitted to the Department of Emergency Intensive Care
consecutively between January 2015 and December 2019, were included
in the present study. The inclusion criteria included a diagnosis
for sepsis or septic shock according to the Third International
Consensus Definitions (9). The
exclusion criteria were as follows: i) Age of <18 or >90
years; ii) presence of conditions, such as surgical trauma and/or
severe heart, liver, lung, kidney, blood system or metabolic
diseases; iii) presence of tumors; iv) pregnancy; v) receipt of
antibiotic treatment within 28 days before study enrollment; and
vi) patients with rapid death outcomes (within 24 h after
admission). The basic and test data of the enrolled patients within
24 h of the first visit to the emergency room were collected. All
patients were followed up for 28 days after admission, and those
who were discharged within 28 days were followed up by telephone.
All eligible patients were divided into two groups: i) The survival
group, which included patients who survived 28 days after the
initial diagnosis; and ii) the non-survival group, which included
patients who died within 28 days after diagnosis. The study was
carried out in accordance with The Declaration of Helsinki for
research involving humans. The present study received approval from
the Ethics Committee of The Second Affiliated Hospital, Zhejiang
University School of Medicine (approval no. 2021-0641; Hangzhou,
China), while the Ethics Committee waived the need for written
informed consent of the patients because of the anonymous nature of
the clinical data acquired retrospectively.
Clinical data collection and
processing
Basic patient data, such as age, sex, height,
weight, comorbidities, infection site, qSOFA score and preliminary
diagnosis within 24 h after admission, were collected. The
following evaluations were performed within 24 h after the patients
first arrived at the emergency room: Routine blood examination,
arterial blood gas analysis, biochemical examination, coagulation
parameters, myocardial enzyme spectrum, PCT, CRP, and blood, urine
or sputum pathogen detection. The routine blood tests were
performed using an automatic blood analyzer (XN-9000; Sysmex
Corporation). Arterial blood gas analyses were conducted using an
automated blood gas analyzer (ABL800; Radiometer Medical ApS). The
levels of biochemical markers and CRP were determined using an
automated dry chemistry analyzer (v5600; Johnson & Johnson).
Coagulation parameters were measured with an automated blood
coagulation analyzer (STA R Max systems; Stago). Myocardial enzyme
and PCT levels were determined using an automated electrochemical
enzyme immunoluminescence analyzer (E601; Roche Diagnostics).
Statistical analysis
All statistical analyses were performed using SPSS
software (version 24.0; IBM Corp.), and P<0.05 was considered to
indicate a statistically significant difference. Data with normal
distribution are presented as the mean ± standard deviation, and
those not conforming to normal distribution are presented as median
(25-75%). All numerical variables were compared using the
Mann-Whitney U test. χ2 or Fisher's exact probability
test was used to compare categorical variables. Bonferroni's
correction was used to compare differences among three or more
groups. Cox regression analysis was used to analyze potential
prognostic risk factors. Risk factors were incorporated into the
multivariate model based on univariate analyses. Receiver operating
characteristic (ROC) curves for mortality risk factors were
plotted. The area under the curve (AUC) was calculated using
MedCalc software (version 18.2.1; MedCalc software bvba).
A multivariable Cox proportional hazard regression
analysis was performed to evaluate the independent association of
qSOFA score, CB level or creatinine level with 28-day mortality,
and the results are expressed as hazard ratios (HRs) and 95%
confidence intervals (CIs). The survival curves for the two groups
according to the qSOFA score, CB level or creatinine level were
plotted using the Kaplan-Meier method, and the log-rank test was
applied. Age, sex, body mass index (BMI) and variables considered
to be associated with infection, such as whether the lung and
urogenital organs were primary sites of infection, serum creatinine
concentration and coagulation parameters, were included in the
analysis.
Results
Patient characteristics
The current study investigated patients with sepsis
admitted between January 2015 and December 2019. Patients with
rapid death outcomes (within 24 h after admission) were excluded
from the analysis, and 360 patients with sepsis were eventually
included in the study. Among them, 216 (60.0%) and 144 (40.0%)
cases were diagnosed with sepsis and septic shock, respectively.
These patients included 212 men (58.9%) and 148 women (41.1%), aged
between 18 and 89 years (median age, 64.5 years). The 28-day
mortality rate was 28.6% (103/360). The 28-day mortality of the
septic shock group was significantly higher than that of the sepsis
group (34.7% vs. 24.5%; χ2=4.388; P=0.043). In
comparison with survivors, non-survivors were older (P<0.05),
more frequently male (P<0.05) and had a lower BMI and BP (both
P<0.01), as well as higher heart rate, respiratory rate and
qSOFA scores (all P<0.01). The 28-day mortality rates associated
with pulmonary infection, urinary tract infection (UTI) and other
infections were significantly different between the two groups
(χ2 =15.148; P=0.001). The 28-day mortality rate of
pulmonary infection was the highest (39.6%; 53/134), followed by
other infections (24.5%; 45/184), while the 28-day mortality rate
of UTIs was the lowest (11.9%; 5/42). The 28-day mortality rate of
pulmonary infection was significantly different from those of other
infections and UTIs (Bonferroni correction, P<0.0167), while
there was no significant difference in 28-day mortality rates
between UTIs and other infections (Bonferroni correction, P≥0.0167)
(data not shown). Prothrombin time, international normalized ratio,
activated partial thromboplastin time, thrombin time and D-dimer
values in non-survivors were higher than those in the survival
group, and fibrinogen values in non-survivors were significantly
lower than those in the survival group (all P<0.05). The levels
of red blood cell distribution width, pro B-type natriuretic
peptide, CB, aspartate aminotransferase, lactate dehydrogenase,
cardiac troponin T, blood urea nitrogen and creatinine in the
non-survival group were significantly higher than those in the
survival group, whereas red blood cell and platelet counts were
significantly lower in the non-survival group (all P<0.01). The
white blood cell count and PCT level in the non-survival group were
higher than those in the survival group, but the difference was not
significant. Table I presents the
baseline clinical characteristics of the 360 patients included in
the current study.
 | Table IBaseline characteristics of the study
population. |
Table I
Baseline characteristics of the study
population.
| Characteristics | Overall (n=360) | Survivors
(n=257) | Non-survivors
(n=103) | χ2 or U
value | P-value |
|---|
| Age, years [median
(IQR)] | 64.50
(54.00-74.00) | 64.00
(52.00-72.50) | 66.00
(58.00-75.00) | -1.994a | 0.046 |
| Male sex, n (%) | 212 (58.89) | 142 (55.25) | 70 (67.96) | 4.905b | 0.033 |
| BMI, kg/m2
(mean ± SD) | 21.80±3.79 | 22.18±3.86 | 20.47±3.23 | -3.776a | <0.001 |
| BP, mmHg (mean ±
SD) | | | | | |
|
Systolic | 119.74±22.88 | 121.99±21.59 | 113.26±25.28 | -3.048a | 0.002 |
|
Diastolic | 69.16±14.95 | 71.23±13.37 | 63.19±17.54 | -4.015a | <0.001 |
| Heart rate, beats/min
[median (IQR)] | 87.00
(76.00-102.00) | 83.00
(74.00-97.75) | 98.00
(86.00-119.00) | -6.136a | <0.001 |
| Respiratory rate,
breaths/min [median (IQR)] | 19.00
(18.00-20.00) | 18.00
(18.00-20.00) | 20.00
(18.00-25.00) | -3.710a | <0.001 |
| Body temperature, ˚C
[median (IQR)] | 37.10
(36.80-37.70) | 37.10
(36.80-37.60) | 37.20
(36.60-37.90) | -0.467a | 0.641 |
| Comorbidities, n
(%) | | | | 2.617b | 0.454 |
|
No | 326 (90.56) | 229 (89.11) | 97 (94.17) | 1.833b,c | 0.176 |
|
Hypertension | 10 (2.78) | 9 (3.50) | 1 (0.97) | 0.561b,d | 0.454 |
|
Diabetes | 19 (5.28) | 15 (5.84) | 4 (3.89) | 0.003b,e | 0.959 |
|
Combination
of hypertension and diabetes | 5 (1.39) | 4 (1.56) | 1 (0.97) | 7l.956b,f | 0.005 |
| qSOFA score, n
(%) | | | | 75.857b | <0.001 |
|
≥2 | 60 (16.67) | 15 (5.84) | 45 (43.69) | | |
|
<2 | 300 (83.33) | 242 (94.16) | 58 (56.31) | | |
| Septic shock, n
(%) | 144 (40.00) | 94 (36.58) | 50 (48.54) | 4.388b | 0.043 |
| Infection site, n
(%) | | | | 15.148b | 0.001 |
|
Lung | 134 (37.22) | 81 (31.52) | 53 (51.46) | 11.063b,g | 0.001 |
|
Urinary
tract | 42 (11.67) | 37 (14.40) | 5 (4.85) | 3.127b,h | 0.099 |
|
Others | 184 (51.11) | 139 (54.09) | 45 (43.69) | 8.287b,i | 0.005 |
| WBC,
x109/l [median (IQR)] | 12.85
(7.43-19.68) | 12.70
(7.90-18.80) | 13.10
(6.40-21.00) | -0.447a | 0.655 |
| RBC,
x1012/l [median (IQR)] | 3.73
(3.09-4.27) | 3.81
(3.21-4.32) | 3.57
(2.60-4.15) | -3.147a | 0.002 |
| RDW, % [median
(IQR)] | 13.75
(12.80-15.28) | 13.50
(12.70-14.70) | 14.70
(13.30-16.50) | -4.706a | <0.001 |
| PLT,
x109/l [median (IQR)] | 126.00
(64.00-201.50) | 138.00
(81.50-202.50) | 89.00
(40.00-190.00) | -3.044a | 0.002 |
| PCT, ng/ml [median
(IQR)] | 10.85
(1.22-54.01) | 10.53
(1.14-54.03) | 11.15
(1.53-52.79) | -0.492a | 0.623 |
| NT-proBNP, pg/ml
[median (IQR)] | 3,057.00
(915.59-9,072.38) | 2,180.00
(775.00-6,309.00) | 4,204.50
(1,465.25-1,6156.75) | -3.245a | 0.001 |
| CB, µmol/l [median
(IQR)] | 1.10
(0.10-7.73) | 0.80
(0.10-6.18) | 3.10
(0.65-17.20) | -3.303a | 0.001 |
| AST, U/l [median
(IQR)] | 45.00
(25.00-106.50) | 40.00
(23.00-81.00) | 69.00
(35.00-278.50) | -4.400a | <0.001 |
| LDH, U/l [median
(IQR)] | 254.00
(191.00-415.50) | 233.00
(182.00-340.75) | 350.00
(231.00-720.50) | -5.314a | <0.001 |
| cTn-T, ng/ml
[median (IQR)] | 0.04
(0.02-0.12) | 0.03
(0.01-0.09) | 0.07
(0.03-0.22) | -4.841a | <0.001 |
| BUN, mmol/l [median
(IQR)] | 8.44
(5.77-13.35) | 7.78
(5.37-11.31) | 11.80
(7.51-21.72) | -5.318a | <0.001 |
| Creatinine, µmol/l
[median (IQR)] | 102.00
(68.00-183.75) | 92.00
(65.00-157.00) | 142.00
(82.50-244.00) | -3.762a | <0.001 |
| Coagulation
parameter | | | | | |
|
PT, sec
[median (IQR)] | 15.70
(14.50-17.60) | 15.15
(14.30-16.90) | 16.95
(15.30-19.35) | -5.870a | <0.001 |
|
PT, % (mean
± SD) | 69.33±18.76 | 73.09±17.40 | 59.94±18.83 | -5.853a | <0.001 |
|
INR [median
(IQR)] | 1.25
(1.14-1.46) | 1.21
(1.12-1.39) | 1.40
(1.22-1.64) | -5.880a | <0.001 |
|
APTT, sec
[median (IQR)] | 42.45
(37.53-49.00) | 41.90
(37.40-47.60) | 45.75
(38.18-52.48) | -2.947a | 0.003 |
|
TT, sec
[median (IQR)] | 16.00
(15.10-17.50) | 15.80
(15.00-17.23) | 16.45
(15.28-18.38) | -2.709a | 0.007 |
|
Fbg, g/l
(mean ± SD) | 5.02±2.15 | 5.22±2.04 | 4.52±2.33 | -2.949a | 0.003 |
|
DD, µg/l
[median (IQR)] | 3,770.00
(2,210.00-9,080.00) | 3,425.00
(2,030.00-7,927.50) | 4,390.00
(2,715.00-10,585.00) | -2.234a | 0.025 |
Analysis of relevant variables using
Cox regression
qSOFA scores ≥2 and the CB and creatinine levels
were closely associated with 28-day mortality. Cox regression
models identified CB (HR, 1.006; P=0.002) and creatinine levels
(HR, 1.002; P=0.024) as independent factors of 28-day mortality
(Table II).
| Table IICox regression analysis of the risk
factors for 28-day mortality. |
Table II
Cox regression analysis of the risk
factors for 28-day mortality.
| A, Univariable Cox
regression |
|---|
| Variables | β | HR | 95% CI | P-value |
|---|
| qSOFA (≥2) | 0.541 | 1.718 | 1.155-2.555 | 0.008 |
| Septic shock | 0.320 | 1.377 | 0.932-2.035 | 0.108 |
| Heart rate | 0.009 | 1.009 | 0.999-1.019 | 0.081 |
| CB | 0.004 | 1.004 | 1.001-1.008 | 0.014 |
| Creatinine | 0.001 | 1.001 | 1.000-1.003 | 0.041 |
| APTT | 0.008 | 1.008 | 0.998-1.018 | 0.102 |
| TT | 0.008 | 1.008 | 0.998-1.018 | 0.107 |
| B, Multivariable
Cox regression |
| Variables | β | HR | 95% CI | P-value |
| CB | 0.006 | 1.006 | 1.003-1.011 | 0.002 |
| Creatinine | 0.002 | 1.002 | 1.000-1.005 | 0.024 |
Combined evaluation of CB and
creatinine levels, and qSOFA scores in the prognosis of 28-day
mortality
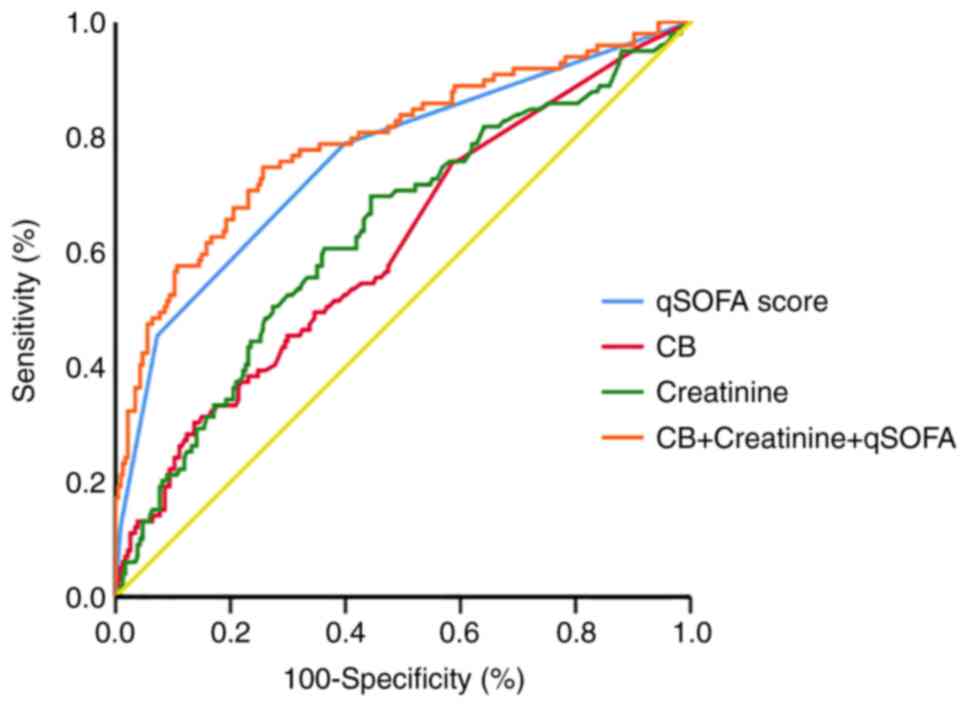
A logistic regression model was established based on
the CB and creatinine levels and qSOFA values, and a ROC curve
analysis was used to generate the combined diagnostic curve to
evaluate the prognostic value of CB and creatinine levels plus
qSOFA scores in 28-day mortality (Fig.
1). The larger the AUC, the better the prognostic performance.
AUC <0.5 was considered to have no prognostic significance and
AUC >0.9 was considered to have high prognostic accuracy
(14). The AUC of CB level alone
was 0.613 (95% CI, 0.558-0.665). The AUC of creatinine level alone
was 0.628 (95% CI, 0.575-0.678), and that of the qSOFA score alone
was 0.749 (95% CI, 0.701-0.793). However, the AUC of CB and
creatinine levels plus the qSOFA score was 0.792 (95% CI,
0.745-0.834), which was larger than the AUCs of the individual
factors alone (all P<0.01) (Table
III).
| Table IIIReceiver operating characteristic
curve data for CB and creatinine levels, and qSOFA scores in the
prediction of 28-day mortality. |
Table III
Receiver operating characteristic
curve data for CB and creatinine levels, and qSOFA scores in the
prediction of 28-day mortality.
| | Vs. CB + Creatinine
+ qSOFA |
|---|
| Variables | AUC (95% CI) | Cut-off value | P-value | Sensitivity, % | Specificity, % | PPV, % | NPV, % | Z-value | P-value |
|---|
| CB | 0.613
(0.558-0.665) | >0.5 | 0.0008 | 76.00 | 41.45 | 29.94 | 70.06 | 4.869 | <0.0001 |
| Creatinine | 0.628
(0.575-0.678) | 117 | 0.0001 | 59.41 | 63.53 | 28.37 | 71.63 | 4.413 | <0.0001 |
| qSOFA | 0.749
(0.701-0.793) | 1 | <0.0001 | 75.73 | 62.26 | 28.61 | 71.39 | 2.637 | 0.0084 |
| CB + Creatinine +
qSOFA | 0.792
(0.745-0.834) |
>0.275a | <0.0001 | 74.75 | 74.36 | 29.73 | 70.27 | - | - |
The cut-off was defined as the value of the point on
the curve when the Youden index (sensitivity + specificity-1) was
the greatest. A value greater than the cut-off value may be
considered to indicate the possibility of dying within 28 days.
The sensitivity and specificity of combined
detection were 74.75 and 74.36%, respectively. The specificity of
combined detection was notably higher than that of the single
tests, while the sensitivity of combined detection was almost the
same as those of CB alone and qSOFA alone, and was higher than that
of creatinine alone (Table
III).
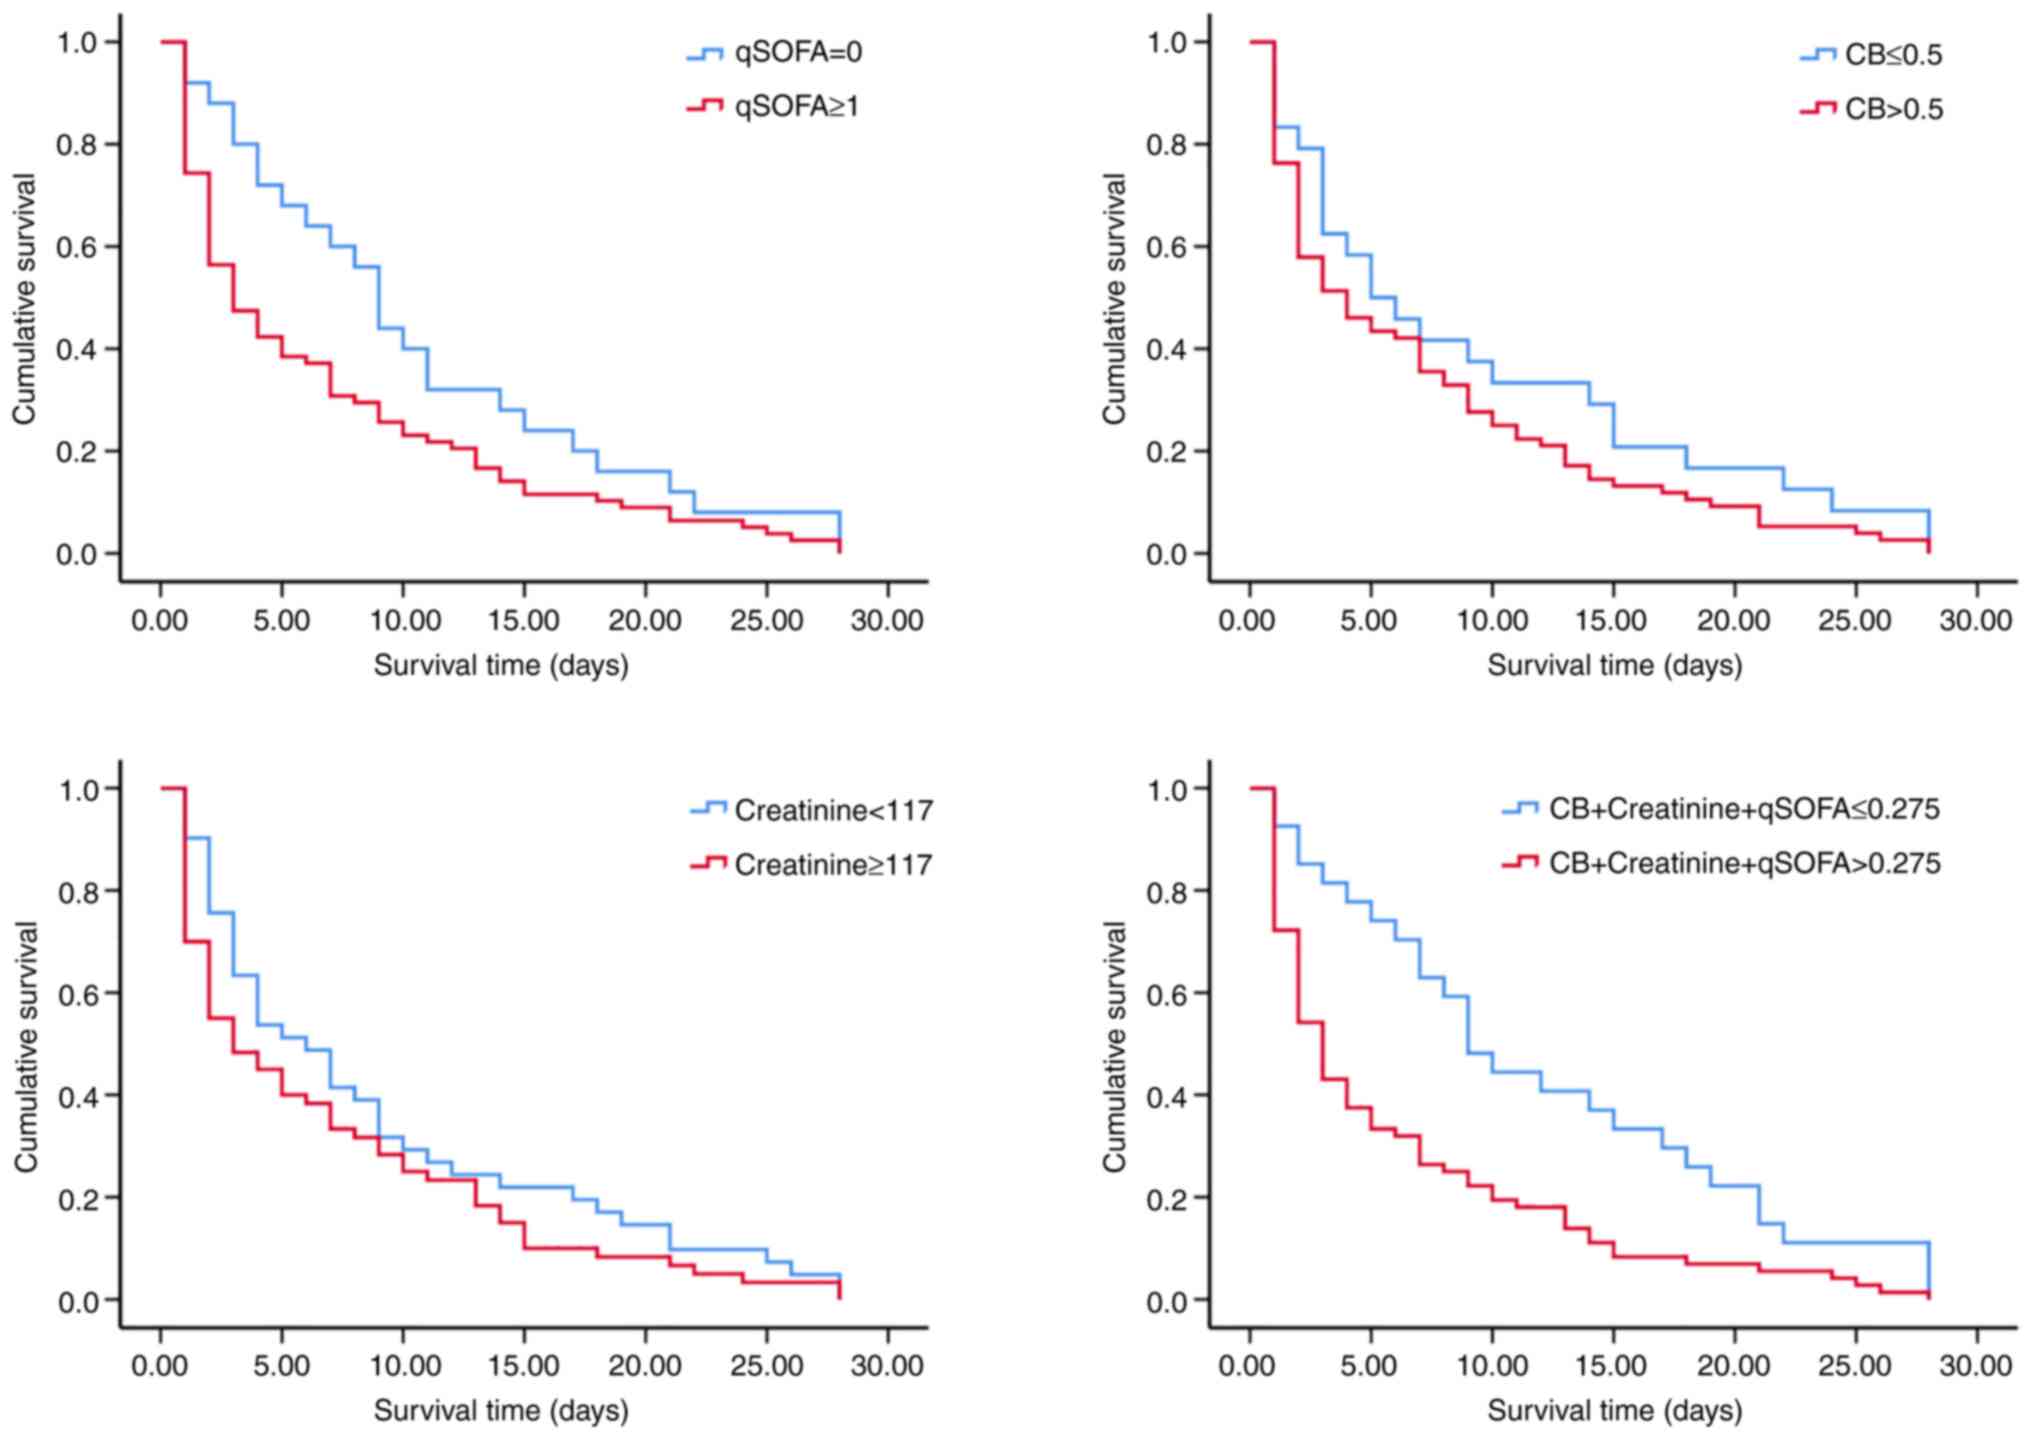
Kaplan-Meier survival curve
analysis
Using the cut-off value determined by the ROC curve,
Kaplan-Meier survival curves of CB, creatinine, qSOFA and combined
detection were established. The Kaplan-Meier analysis indicated
that patients with a qSOFA score of 0 had a better chance of 28-day
survival than those with qSOFA ≥1 (log-rank, 4.069; P=0.044). In
addition, patients with a combined predictor (-2.466 + 0.012 x CB +
0.002 x creatinine + 1.289 x qSOFA) value ≤0.275 had a better
chance of 28-day survival than those with a combined predictor
value >0.275 (log-rank, 10.060; P=0.002) (Table IV; Fig. 2).
| Table IVKaplan-Meier survival curve
analysis. |
Table IV
Kaplan-Meier survival curve
analysis.
| Variables | Cut-off value | Median, days | 95% CI | Log-rank | P-value |
|---|
| CB | ≤0.5 | 5 | 1.399-8.601 | 1.890 | 0.169 |
| | >0.5 | 4 | 1.677-6.323 | | |
| Creatinine | <117 | 6 | 3.212-8.788 | 1.724 | 0.189 |
| | ≥117 | 3 | 0.471-5.529 | | |
| qSOFA | 0 | 9 | 7.378-10.622 | 4.069 | 0.044 |
| | ≥1 | 3 | 1.428-4.572 | | |
| CB + Creatinine +
qSOFA | ≤0.275 | 9 | 6.456-11.544 | 10.060 | 0.002 |
| | >0.275 | 3 | 2.216-3.784 | | |
Subgroup analysis
Of the 360 patients, 144 patients were diagnosed
with septic shock. The combined predictor value of CB and
creatinine levels, and qSOFA scores in the septic shock group was
higher than that in the sepsis group (median, 0.2750 vs. 0.1496;
P<0.001). Among patients with septic shock, survivors tended to
have lower combined predictor values than non-survivors (median,
0.2545 vs. 0.5780; P<0.001). For patients with sepsis, survivors
had significantly lower combined predictor values than
non-survivors (median, 0.1103 vs. 0.4500; P<0.001) as shown in
Table V.
| Table VCombined predictor values in subgroup
analyses. |
Table V
Combined predictor values in subgroup
analyses.
| Variables | Combined predictor
values (median) | P-value |
|---|
| Sepsis | 0.1496 |
<0.001a |
|
Survivors | 0.1103 |
<0.001b |
|
Non-survivors | 0.4500 | |
| Septic shock | 0.2750 | |
|
Survivors | 0.2545 |
<0.001b |
|
Non-survivors | 0.5780 | |
As presented in Table
VI, Cox regression models were applied in subgroup analyses,
which indicated that the combination of CB and creatinine levels
and qSOFA scores could serve as an independent risk factor of
28-day mortality for patients with septic shock (HR, 4.240; 95% CI,
1.408-12.767; P=0.010), as well as for those with sepsis (HR,
4.068; 95% CI, 1.287-12.858; P=0.017).
| Table VICox regression models in subgroup
analyses. |
Table VI
Cox regression models in subgroup
analyses.
| Variables | β | HR | 95% CI | P-value |
|---|
| Septic shock | 1.444 | 4.240 | 1.408-12.767 | 0.010 |
| Sepsis | 1.403 | 4.068 | 1.287-12.858 | 0.017 |
| All | 1.479 | 4.388 | 2.007-9.591 | <0.001 |
Discussion
Sepsis is a rapidly progressive condition and a
major cause of death. Therefore, timely and accurate assessment of
the patient's condition is beneficial in improving prognosis and
reducing mortality (1,2). In the present study, serum CB and
creatinine levels, and qSOFA scores at admission in patients with
sepsis were higher in the non-surviving group than in the surviving
group. In multivariate analysis, serum CB and creatinine levels
were indicated to be independent predictors of poor sepsis
outcomes. When the combined predictor value of CB and creatinine
levels and qSOFA scores reached 0.275, 28-day mortality
increased.
Several studies (15-17)
have attempted to predict the prognosis of sepsis by indirectly
estimating liver and renal function. Serum bilirubin concentration
has been used as one of the indicators for the assessment of liver
function in critically ill patients. For example, Pierrakos et
al (15) reported that
hyperbilirubinemia was an independent factor for patient morbidity
and mortality in the Intensive Care Unit (ICU), and mortality was
linearly associated with bilirubin concentrations between 1.1 and 6
mg/dl. Patel et al (16)
also found that elevated serum bilirubin levels within 72 h of
admission were associated with an increased risk of death in
patients with severe sepsis and septic shock. However, in addition
to being an indicator of liver dysfunction, bilirubin itself may
also influence patient outcomes. Bilirubin can impair the
bactericidal properties of neutrophils (17) through its antioxidant action
(18), and may be nephrotoxic
(19) and neurotoxic (20). It also inhibits inducible nitric
oxide synthase (21) and exerts an
anti-platelet aggregation effect by inhibiting collagen-induced
platelet activation (22).
However, certain reports have suggested that bilirubin may play a
role in suppressing inflammatory responses (23) and that hyperbilirubinemia may be an
adaptive response to critical illness (24). The present data emphasized that
altered liver function has an important role in septic multi-organ
failure and that elevated serum CB levels are common in patients
with sepsis and are associated with 28-day mortality. Multivariable
analysis showed that the serum CB level was an independent risk
factor for increased mortality. It was demonstrated that an
increased bilirubin level was accompanied by increased inflammation
(increased white blood cell count), and we hypothesize that high CB
levels may reduce blood flow velocity and induce microcirculation
disturbances, while stimulating the production of inflammatory
factors to promote liver damage and cholestasis, thereby affecting
the poor prognosis of sepsis. The specific mechanism remains to be
further studied in the future.
One of the most commonly affected organs in sepsis
is the kidney, and sepsis-induced acute kidney injury is the most
common form of acute kidney injury in the ICU (25). Sepsis-induced acute kidney injury
is associated with an increased risk of subsequent chronic kidney
disease (26), as well as being
associated with increased morbidity and mortality rates in sepsis
(27). During sepsis, endothelial
cell activation, increased microvascular permeability, changes in
regional blood flow distribution, and the resulting hypoperfusion
and hypoxemia can lead to acute kidney injury (28). Elevated serum creatinine is one of
the indicators of acute renal impairment (29) and is directly related to the
prognosis of sepsis. The current study findings suggested that
altered renal function may also play an important role in the
progression of multi-organ failure in sepsis. It was also indicated
that increased serum creatinine levels are common in patients with
sepsis, are associated with 28-day mortality, and moreover are an
independent risk factor for increased mortality.
In the present study, CB and creatinine levels, and
qSOFA scores increased with sepsis progression and were higher in
non-survivors compared with survivors of sepsis. All three
indicators were better predictors in combination than they would
have been individually. Therefore, these three indicators may be
useful as commonly used laboratory and clinical tests to assess
28-day mortality and the prognosis of sepsis, with the combined
prediction showing greater prognostic ability.
The current study had several limitations. Firstly,
studying the qSOFA score, CB and creatinine levels alone does not
meet the needs and expectations of all patients with sepsis for
diagnosis and treatment management. Studying kinetic changes in CB
and creatinine levels may be more clinically meaningful than
studying unadjusted CB and creatinine levels, suggesting that
further research is required. Secondly, since the current study is
a single-center retrospective study, whether the findings can be
applied to clinical practice requires further investigation by
large-sample, multi-center prospective studies.
In conclusion, the prognostic value of combined CB
and creatinine levels plus qSOFA score was greater than the
predictive value of CB levels, creatinine levels and qSOFA score
alone in the prognosis of 28-day mortality in patients with sepsis.
Therefore, the combined predictor based on CB and creatinine levels
plus qSOFA scores could be used as a prognostic factor in sepsis or
septic shock, which could help to rapidly detect critically ill
patients and guide clinical treatment.
Acknowledgements
Not applicable.
Funding
Funding: The present work was supported by the National Natural
Science Foundation of China (grant no. 81802081).
Availability of data and materials
All data generated or analyzed during this study are
included in this published article.
Authors' contributions
YX and XY worked on data analysis and
interpretation. LS and QW collected the patients' data. FL and DY
interpreted the data. YQ and WW designed the study. YQ drafted the
manuscript. YQ and YX confirm the authenticity of all the raw data.
All authors read and approved the final version of the
manuscript.
Ethics approval and consent to
participate
The present study was approved by the Clinical
Research Ethics Committee of The Second Affiliated Hospital,
Zhejiang University School of Medicine (approval no. 2021-0641;
Hangzhou, China).
Patient consent for publication
Not applicable.
Competing interests
The authors declare that they have no competing
interests.
References
|
1
|
Esposito S, De Simone G, Boccia G, De Caro
F and Pagliano P: Sepsis and septic shock: New definitions, new
diagnostic and therapeutic approaches. J Glob Antimicrob Resist.
10:204–212. 2017.PubMed/NCBI View Article : Google Scholar
|
|
2
|
Rudd KE, Johnson SC, Agesa KM, Shackelford
KA, Tsoi D, Kievlan DR, Colombara DV, Ikuta KS, Kissoon N, Finfer
S, et al: Global, regional, and national sepsis incidence and
mortality, 1990-2017: Analysis for the global burden of disease
study. Lancet. 395:200–211. 2020.PubMed/NCBI View Article : Google Scholar
|
|
3
|
Feng J, Wang L, Feng Y, Yu G, Zhou D and
Wang J: Serum levels of angiopoietin 2 mRNA in the mortality
outcome prediction of septic shock. Exp Ther Med.
23(362)2022.PubMed/NCBI View Article : Google Scholar
|
|
4
|
Wang J, Feng Q, Wu Y and Wang H:
Involvement of blood lncRNA UCA1 in sepsis development and
prognosis, and its correlation with multiple inflammatory
cytokines. J Clin Lab Anal. 20(e24392)2022.PubMed/NCBI View Article : Google Scholar
|
|
5
|
Sun T, Wang Y, Wu X, Cai Y, Zhai T and
Zhan Q: Prognostic value of Syndecan-1 in the prediction of
sepsis-related complications and mortality: A meta-analysis. Front
Public Health. 10(870065)2022.PubMed/NCBI View Article : Google Scholar
|
|
6
|
Mierzchala-Pasierb M, Krzystek-Korpacka M,
Lesnik P, Adamik B, Placzkowska S, Serek P, Gamian A and
Lipinska-Gediga M: Interleukin-18 serum levels in sepsis:
Correlation with disease severity and inflammatory markers.
Cytokine. 120:22–27. 2019.PubMed/NCBI View Article : Google Scholar
|
|
7
|
Arora S, Singh P, Singh PM and Trikha A:
Procalcitonin levels in survivors and nonsurvivors of sepsis:
Systematic review and meta-analysis. Shock. 43:212–221.
2015.PubMed/NCBI View Article : Google Scholar
|
|
8
|
Kumar N, Dayal R, Singh P, Pathak S,
Pooniya V, Goyal A, Kamal R and Mohanty KK: A comparative
evaluation of presepsin with procalcitonin and CRP in diagnosing
neonatal sepsis. Indian J Pediatr. 86:177–179. 2019.PubMed/NCBI View Article : Google Scholar
|
|
9
|
Singer M, Deutschman CS, Seymour CW,
Shankar-Hari M, Annane D, Bauer M, Bellomo R, Bernard GR, Chiche
JD, Coopersmith CM, et al: The third international consensus
definitions for sepsis and septic shock (sepsis-3). JAMA.
315:801–810. 2016.PubMed/NCBI View Article : Google Scholar
|
|
10
|
Freund Y, Lemachatti N, Krastinova E, Van
Laer M, Claessens YE, Avondo A, Occelli C, Feral-Pierssens AL,
Truchot J, Ortega M, et al: Prognostic accuracy of sepsis-3
criteria for in-hospital mortality among patients with suspected
infection presenting to the emergency department. JAMA.
317:301–308. 2017.PubMed/NCBI View Article : Google Scholar
|
|
11
|
Juschten J, Bos LDJ, de Grooth HJ, Beuers
U, Girbes ARJ, Juffermans NP, Loer SA, van der Poll T, Cremer OL,
Bonten MJM, et al: Incidence, clinical characteristics and outcomes
of early hyperbilirubinemia in critically Ill patients: Insights
from the MARS study. Shock. 57:161–167. 2022.PubMed/NCBI View Article : Google Scholar
|
|
12
|
Collazos J, de la Fuente B, de la Fuente
J, García A, Gómez H, Menéndez C, Enríquez H, Sánchez P, Alonso M,
López-Cruz I, et al: Factors associated with sepsis development in
606 Spanish adult patients with cellulitis. BMC Infect Dis.
20(211)2020.PubMed/NCBI View Article : Google Scholar
|
|
13
|
Waltz P, Carchman E, Gomez H and
Zuckerbraun B: Sepsis results in an altered renal metabolic and
osmolyte profile. J Surg Res. 202:8–12. 2016.PubMed/NCBI View Article : Google Scholar
|
|
14
|
Song R, Xu N, Luo L, Zhang T and Duan H:
Diagnostic value of aortic dissection risk score, coagulation
function, and laboratory indexes in acute aortic dissection. Biomed
Res Int. 2022(7447230)2022.PubMed/NCBI View Article : Google Scholar
|
|
15
|
Pierrakos C, Velissaris D, Felleiter P,
Antonelli M, Vanhems P, Sakr Y and Vincent JL: EPIC II
investigators. Increased mortality in critically ill patients with
mild or moderate hyperbilirubinemia. J Crit Care. 40:31–35.
2017.PubMed/NCBI View Article : Google Scholar
|
|
16
|
Patel JJ, Taneja A, Niccum D, Kumar G,
Jacobs E and Nanchal R: The association of serum bilirubin levels
on the outcomes of severe sepsis. J Intensive Care Med. 30:23–29.
2015.PubMed/NCBI View Article : Google Scholar
|
|
17
|
Arai T, Yoshikai Y, Kamiya J, Nagino M,
Uesaka K, Yuasa N, Oda K, Sano T and Nimura Y: Bilirubin impairs
bactericidal activity of neutrophils through an antioxidant
mechanism in vitro. J Surg Res. 96:107–113. 2001.PubMed/NCBI View Article : Google Scholar
|
|
18
|
Maruhashi T, Soga J, Fujimura N, Idei N,
Mikami S, Iwamoto Y, Kajikawa M, Matsumoto T, Kihara Y, Chayama K,
et al: Hyperbilirubinemia, augmentation of endothelial function,
and decrease in oxidative stress in Gilbert syndrome. Circulation.
126:598–603. 2012.PubMed/NCBI View Article : Google Scholar
|
|
19
|
Uslu A, Taşli FA, Nart A, Postaci H, Aykas
A, Bati H and Coşkun Y: Human kidney histopathology in acute
obstructive jaundice: A prospective study. Eur J Gastroenterol
Hepatol. 22:1458–1465. 2010.PubMed/NCBI View Article : Google Scholar
|
|
20
|
Brites D and Fernandes A:
Bilirubin-induced neural impairment: A special focus on
myelination, age-related windows of susceptibility and associated
co-morbidities. Semin Fetal Neonatal Med. 20:14–19. 2015.PubMed/NCBI View Article : Google Scholar
|
|
21
|
Lanone S, Bloc S, Foresti R, Almolki A,
Taillé C, Callebert J, Conti M, Goven D, Aubier M, Dureuil B, et
al: Bilirubin decreases nos2 expression via inhibition of NAD(P)H
oxidase: Implications for protection against endotoxic shock in
rats. FASEB J. 19:1890–1892. 2005.PubMed/NCBI View Article : Google Scholar
|
|
22
|
Kundur AR, Bulmer AC and Singh I:
Unconjugated bilirubin inhibits collagen induced platelet
activation. Platelets. 25:45–50. 2014.PubMed/NCBI View Article : Google Scholar
|
|
23
|
Li Y, Huang B, Ye T, Wang Y, Xia D and
Qian J: Physiological concentrations of bilirubin control
inflammatory response by inhibiting NF-κB and inflammasome
activation. Int Immunopharmacol. 84(106520)2020.PubMed/NCBI View Article : Google Scholar
|
|
24
|
Vanwijngaerden YM, Langouche L, Brunner R,
Debaveye Y, Gielen M, Casaer M, Liddle C, Coulter S, Wouters PJ,
Wilmer A, et al: Withholding parenteral nutrition during critical
illness increases plasma bilirubin but lowers the incidence of
biliary sludge. Hepatology. 60:202–210. 2014.PubMed/NCBI View Article : Google Scholar
|
|
25
|
Chen Y, Zhou X and Wu Y: The
miR-26a-5p/IL-6 axis alleviates sepsis-induced acute kidney injury
by inhibiting renal inflammation. Ren Fail. 44:551–561.
2022.PubMed/NCBI View Article : Google Scholar
|
|
26
|
Bellomo R, Kellum JA, Ronco C, Wald R,
Martensson J, Maiden M, Bagshaw SM, Glassford NJ, Lankadeva Y,
Vaara ST and Schneider A: Acute kidney injury in sepsis. Intensive
Care Med. 43:816–828. 2017.PubMed/NCBI View Article : Google Scholar
|
|
27
|
Poston JT and Koyner JL: Sepsis associated
acute kidney injury. BMJ. 364(k4891)2019.PubMed/NCBI View Article : Google Scholar
|
|
28
|
Sun J, Zhang J, Tian J, Virz GM, Digvijay
K, Cueto L, Yin Y, Rosner MH and Ronco C: Mitochondria in
Sepsis-induced AKI. J Am Soc Nephrol. 30:1151–1161. 2019.PubMed/NCBI View Article : Google Scholar
|
|
29
|
Ronco C, Bellomo R and Kellum JA: Acute
kidney injury. Lancet. 394:1949–1964. 2019.PubMed/NCBI View Article : Google Scholar
|