Introduction
Conventional magnetic resonance imaging (MRI)
protocols in multiple sclerosis (MS) are oriented toward
recognizing mainly structural abnormalities since they are focused
on morphology and topographical changes of the MRI signal, thus
failing to identify subtle and/or diffuse abnormalities in
normal-appearing white matter (NAWM) and normal-appearing grey
matter (NAGM) that are not visible with the use of conventional MRI
(1). However, changes in NAWM and
NAGM, including deep GM nuclei like the thalamus, have been
described in neuropathological studies and can be present from the
early stages of MS (2-4).
In particular, the thalamus is frequently affected during the MS
pathogenetic process, being a key site of demyelination and
neurodegeneration (such as brain atrophy) (5,6). In
studying the early clinical stage of MS, the clinically isolated
syndrome (CIS), e.g. the first clinical episode with
characteristics of inflammatory demyelination on the brain and/or
spinal MRI suggestive of MS) (7),
holds interest. Notably, the estimated risk for CIS to progress to
MS has been estimated as 42-82% (8) depending on the follow-up
duration.
The aforementioned limitations of conventional MRI
in the study of normal-appearing (NA) tissue could be partially
overcome with the use of other MRI techniques such as proton
magnetic resonance spectroscopy (1H-MRS), a non-invasive
advanced method that can be considered a ‘metabolic biopsy’.
Specifically, 1H-MRS is capable of detecting certain
metabolite peaks from a region of interest and quantifying the
concentrations of these metabolites by measuring regional tissue
metabolism (9-12).
Particularly in MS, 1H-MRS enables examination of
neurometabolic profiles that may be altered during the pathogenesis
of the disease in the brain and spine; moreover, depending on the
voxel placement it can examine not only regions with visible
lesions on conventional MRI but also NA ones, thus assessing
indirectly the degree of tissue damage based on the calculated
biochemical changes (10,13-15).
A variety of metabolites of the central nervous
system (CNS) can be detected and quantified with 1H-MRS
including N-acetyl aspartate (NAA), creatine (Cr), choline (Cho),
glutamine (Gln) and glutamate (Glu), myoinositol (mIns) and
glutathione (Glth) (9,10,16,17).
NAA is one of the most common compounds assessed by
1H-MRS; it is produced by mitochondria, localized in
neuronal cell bodies and found in high concentrations in
oligodendrocytes/myelin (18). It
is considered a marker of neuronal viability. Reduced NAA levels
are reported specifically in MS, which is usually interpreted as an
indirect reflection of neuronal/axonal dysfunction or loss
(19). The neurometabolite Cr was
shown to be linked with cellular energy metabolism in metabolically
active tissue such as the brain; the influence of the demyelinating
process in Cr concentration is ambiguous since both diminished and
increased levels were previously demonstrated (10). Another key molecule examined using
1H-MRS is Cho. Cho-containing compounds are considered
precursors but also products of cellular membrane turnover, having
been reported in different studies on patients with relapsing
and/or progressive MS either as high (10,19,20)
or as low (10) levels and
possibly attributed to inflammation, demyelination and/or
remyelination. Glu is one of the main excitatory neurotransmitters
in the CNS, with a molecular structure similar to Gln,
participating in the interplay of the Glu/Gln cycle between neurons
and surrounding astrocytes (21).
Data on Glu remain unclear in MS spectroscopy; both normal and
increased levels have been reported in white matter lesions and
NAWM (22), while also decreased
levels in mixed grey and white matter (WM) tissue (23,24).
The mIns is another peak on the 1H-MRS spectrum and is
considered a marker of glia, a key molecule in cellular signaling
systems, and also an organic osmolyte (14). The levels of mIns are increased in
several 1H-MRS MS studies (10,25,26).
Glth is considered a 'protective' metabolite against oxidative
stress and is synthesized mainly by glia; Glth levels are reported
to be higher in astrocytes than in neurons (27,28)
At present, to the best of our knowledge, only a few
1H-MRS studies have estimated Glth in MS and decreased
levels are observed in patients with secondary progressive MS
(SPMS) (29,30).
To the best of our knowledge, the existing
literature on 1H-MRS of patients with CIS is very
limited, with only a few studies (31-35)
reporting neurometabolic alterations compared with healthy controls
(HCs). Therefore, the present study aimed to evaluate the metabolic
signatures of brain NAWM and NAGM in patients with CIS, focusing on
possible underlying biochemical alterations that could be present
in the NA areas on conventional MRI and also to identify possible
markers of early cellular changes that may precede severe
inflammation and degeneration by comparing metabolite
concentrations of participants with CIS with those of HCs.
Materials and methods
Study population
The present study enrolled prospectively 38
consecutive female and male patients with CIS (CIS group), aged
18-50 years, diagnosed and recruited at the First Department of
Neurology at Eginition Hospital, Athens, Greece. In addition, 29
age- and sex-matched HCs with no past medical history were also
recruited (HC group). Inclusion criteria for the CIS group were as
follows: i) History of a single clinical attack within 6 months
before 1H-MRS acquisition with objective clinical
evidence of at least one lesion due to an acute inflammatory
demyelinating event in the CNS with a duration ≥24 h in the absence
of fever or infection (36,37);
ii) baseline brain and spinal MRI scans at CIS onset demonstrating
T2-weighted lesions in ≥1 of the four typical CNS locations for MS
(periventricular, infratentorial, juxtacortical or spinal cord)
according to the 2010 revisions to the McDonald criteria (37); iii) absence of thalamic lesions on
baseline brain MRI and iv) aged 18-50 years. Exclusion criteria
were as follows: i) a clinical relapse or administration of oral or
intravenous corticosteroids within 4 weeks preceding
1H-MRS acquisition; ii) history of other medical
conditions associated with WM brain lesions (e.g. presence of
multiple vascular risk factors, substance abuse) and iii)
pregnancy. All differential diagnoses of CIS/MS, including other
autoimmune inflammatory diseases of the CNS and infectious or
vascular diseases were excluded by appropriate blood and
cerebrospinal fluid (CSF) laboratory tests.
The MRI/1H-MRS studies were performed
from October 2015 to January 2017; moreover, on the date of the
scan, all patients with CIS had a history of ≤6 months from the
first clinical attack and all participants were evaluated by a
neurologist at the Eginition Hospital (DT) including neurological
examination. Assessment of the Expanded Disability Status Scale
(EDSS) (38) was also performed
for the CIS group. All participants provided written informed
consent for participation in the study and publication of data.
Written approval of the study protocol was obtained from the Ethics
Committee of Eginition Hospital (approval no. 518/5.10.2015).
Imaging techniques and data
analysis
All participants underwent brain MRI using a 3.0 T
MRI Philips manufactured scanner (Achieva 3T TX; Philips
Healthcare) equipped with an eight-channel head receive coil. The
brain imaging protocol included a T2-weighted
fluid-attenuation-inversion-recovery (FLAIR) sequence in the axial
plane [repetition time (TR), 11,000 msec; inversion time (TI),
2,800 msec; echo time (TE), 125 msec; voxel size, 0.45x0.45x4.00
mm; scanning time, 3 min 40 sec] for lesion detection and a
high-resolution three dimensional (3D)-T1-weighted turbo field echo
(3D-T1w) in the sagittal plane (TR, 9.9 msec; TE, 3.7 msec; voxel
size: 1.0x1.00x1.00 mm; scanning time, 6 min) to obtain
morphological images and also spectroscopic sequences.
1H-MRS protocol
Single voxel 1H-MRS spectroscopic data
were acquired using point resolved spectroscopy sequence, receiving
1,024 samples with 2,000 Hz spectral bandwidth, 2,000 msec TR, 35
msec TE, 128 averages combined with excitation water suppression
technique (scanning time, ~5 min). For each participant, two
1H-MRS-voxels were located, one in the left thalamus and
the other in the left centrum semiovale (CS), adjusting their
dimensions to maximize the volume while avoiding contamination from
neighboring structures or lesions; thereby only NAGM and NAWM were
included, respectively. In the CIS group, in case an increased
lesion load was detected in the left CS on T2/FLAIR images, the
voxel was located on the right CS provided that no lesions were
included.
1H-MRS data analysis
The 1H-MRS spectroscopy data were
processed with TARQUIN software (version no. 4.3.10; tarquin.sourceforge.net/index.php)
following the standard procedure implemented in the toolbox
(39,40) Briefly, preprocessing stages
included: i) Subtraction of the post-acquisition residual water by
applying a signal model that contained a range of frequencies
(-fs/2,+45 Hz), where fs is the sampling frequency from the free
induction decay nuclear medicine resonance signal; ii) phase
adjustment applying a zero and first-order phase correction to the
undergoing signal and iii) automatic referencing to optimal signal
fitting. Subsequently, the TARQUIN algorithm using the basing
simulated set of brain metabolites was applied to solve the
non-linear least squares fitting problem providing metabolite
concentrations. To gain reliable spectral data the following
inclusion criteria were defined: Signal-to-noise ratio >5 (Q),
fit quality <2.5 (index provided by TARQUIN) and absence of
visually detected baseline abnormalities and artifacts.
Specifically, the absolute concentrations of eight metabolites were
estimated: i) total (t)NAA; ii) tCr; iii) tCho; iv) mIns; v) Gln;
vi) Glu, vii) Gln + Glu (Glx) and viii) Glth.
Statistical analysis
Preliminary testing showed that metabolite
concentrations and metabolite concentration ratios within groups
were not normally distributed. Therefore, the non-parametric method
of quantile regression was used to compare median values between
the following groups: i) CIS vs. HC; ii) CIS-treated with disease
modifying therapies (DMTs) at 1H-MRS acquisition vs.
CIS-untreated and iii) CIS-untreated vs. HC. The STATA statistical
software package (version no. 13; StataCorp LP) was used for
statistical analysis.
Results
Patient characteristics
Following the initial evaluation of the MRI data and
1H-MRS spectra, four participants were excluded from the
analysis, of whom three were patients with CIS and artifacts were
affecting spectral quality and one was a participant from the HC
group with WM brain lesions detected οn FLAIR images. In the CIS
group, no thalamic lesions were identified on FLAIR and 3D-T1w
images, a finding in accordance with their baseline MRI scan.
Accordingly, the analysis included 35 patients with CIS and 28 HCs;
the CIS group included 23 females and 12 males with a median age of
32 years and an interquartile range (IQR) of 27.00-36.50 years,
whereas the HC group contained 20 females and 8 males with a median
age of 32 years and IQR of 28.75-36.25 years.
The clinical presentations at first clinical attack
for the participants in the CIS group were typical for CNS
demyelination (37): Unilateral
optic neuritis (n=8); brainstem syndrome (n=3); myelitis (n=16);
ataxic syndrome (n=1); isolated sensory symptoms due to a cerebral
lesion (n=3); multifocal/polysymptomatic (n=2) and symptoms of
undetermined location (n=2). A total of 30 patients fulfilled the
criteria for dissemination in space (DIS), 15 for dissemination in
time (DIT), and 14 for DIS and DIT according to 2010 revisions to
the McDonald criteria (37). In
addition, lesions in the cervical and/or thoracic spine were
identified in 27 patients with CIS on their baseline MRI scan
before 1H-MRS examination. Regarding CSF findings, of 30
patients with CIS who underwent lumbar puncture, oligoclonal bands
were detected in 26 and elevated IgG index (>0.65) in 21. At the
1H-MRS, the median duration from the CIS onset (first
clinical attack) was 102 days and the median EDSS score date was 1
for the CIS group. DMTs were started in the majority of the
patients with CIS that met the DIS and DIT criteria for MS.
Specifically, 12 out of 14 patients fulfilling the DIS and DIT
criteria were receiving DMTs at the time of the 1H-MRS
acquisition; these included interferon β-1a (n=7); peginterferon
β-1a (n=1); glatiramer acetate (n=2); natalizumab (n=1) and
dimethyl fumarate (n=1). Treatment duration was short with a median
of 23.50 days (IQR, 12.00-35.50). The demographic, clinical and
laboratory features of the CIS group are summarized in Table I.
 | Table IDemographic, clinical, and laboratory
features of the CIS group. |
Table I
Demographic, clinical, and laboratory
features of the CIS group.
| Characteristic | Patients
(n=35) |
|---|
| Female/male ratio,
(%) | 23/35 (65.70) |
| Caucasian (%) | 35(100) |
| Median (IQR) age at
MRI/1H-MRS acquisition, years | 32
(27.00-36.50) |
| Median (IQR)
duration from the CIS onset (first clinical attack) to
1H-MRS acquisition, days | 102
(89.50-131.50) |
| Median (IQR) EDSS
score at 1H-MRS acquisition | 1 (1.00-1.50) |
| Number of patients
with CIS and spinal cord lesions | 27 |
| Number of patients
with CSF-OCBs | 26 |
| Number of patients
fulfilling the criteria for DIS | 30 |
| Number of patients
fulfilling the criteria for DIT | 15 |
| Number of patients
fulfilling the criteria for DIS and DIT | 14 |
| Number of patients
treated with DMTs at the time of 1H-MRS acquisition | 12 |
| Median (IQR) DMT
duration, days | 23.50
(12.00-35.50) |
1H-MRS
For the CIS group, the median 1H-MRS
voxel size for the thalamus was 1.3 cm3 (IQR, 0.95-1.55)
and for the CS 3.62 cm3 (IQR, 3.22-4.11). Similar values
were noted for the HC group with thalamic-voxel (th) 1.29
cm3 (IQR, 1.08-1.64) and CS-voxel (cs) 3.88
cm3 (IQR, 2.99-4.45). Representative 1H-MRS
voxels and spectra from two participants in the CIS group are shown
in Fig. 1. The estimated
concentrations of tNAA, tCr, tCho and mIns in 'th' and 'cs' did not
differ significantly between the CIS and HC groups. Concentrations
of Gln(th), Gln(cs), Glu(th), Glu(cs), Glx(th) and Glx(cs) were
lower in the CIS group than the HC group, however, only Glx(cs) was
significantly decreased. Additionally, the concentration of Glth
was increased in the CIS group compared with that in HCs in both
applied voxels, but the difference did not reach statistical
significance. The 1H-MRS metabolite concentrations in
the CIS and HC groups are represented in Table II and Fig. 2A. Ratio of tNAA, tCho, mIns, Gln,
Glu, Glx and Glth concentrations relative to tCr concentration and
also the ratio of Glx and Glth concentrations relative to tNAA
concentration were evaluated; significantly lower ratios of
tCho/tCr(th), Glu/tCr(cs), Glx/tCr(cs), Glx/tNAA(th) and
Glx/tNAA(cs) were observed in patients with CIS compared with those
in the HC group (Table II;
Fig. 2B).
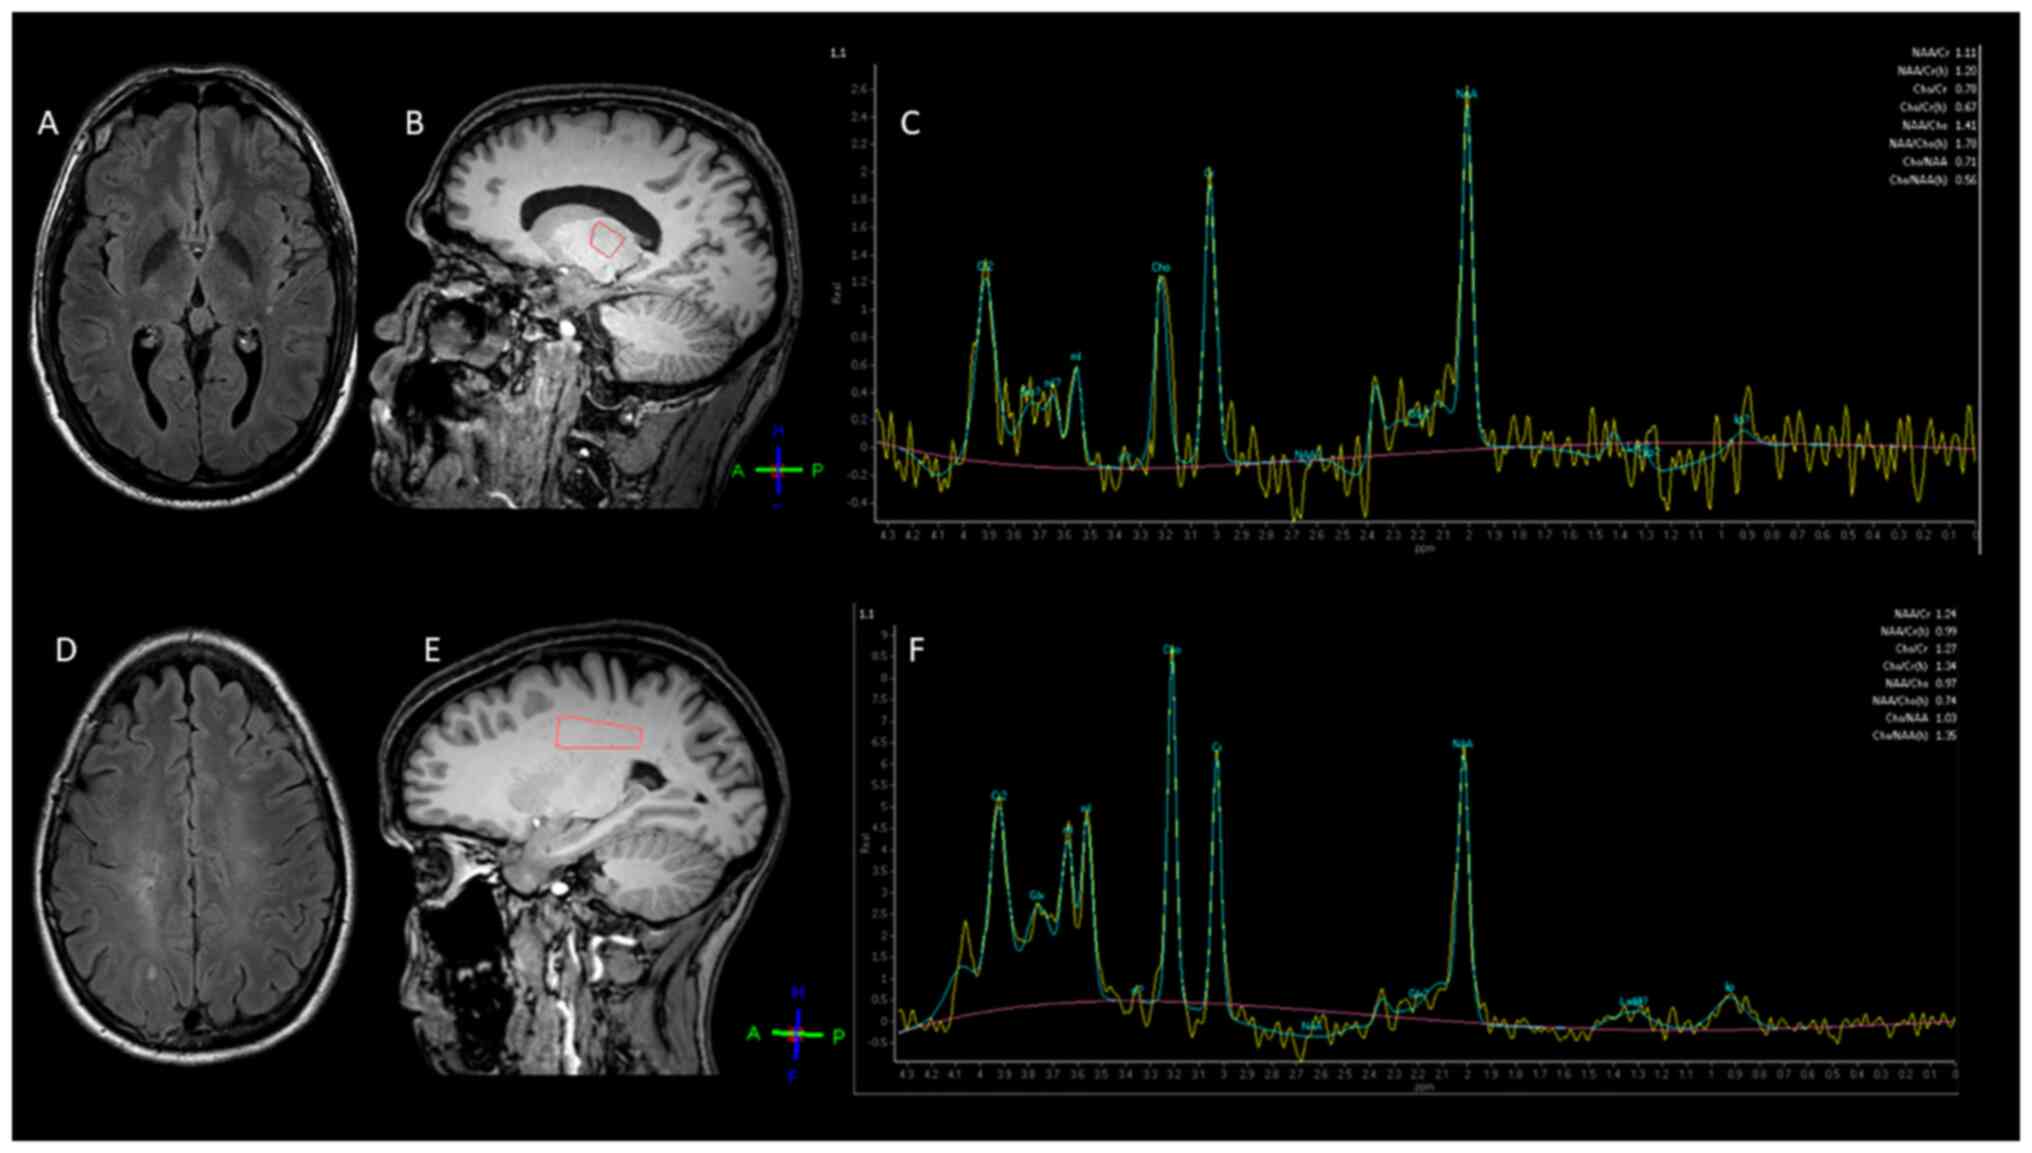 | Figure 1Representative 3.0 T
1H-MRS images in two patients with CIS. (A) Brain axial
FLAIR MRI image of a 35-year-old male patient with CIS. (B)
Positioning of the single voxel in the left thalamus (orange) and
its (C) 1H-MRS spectrum. (D) MRI scan of a 32-year-old
female patient with CIS (axial FLAIR). (E) Single voxel was placed
in the left centrum semiovale (orange) including only
normal-appearing white matter and (F) the derived spectrum.
1H-MRS, proton magnetic resonance spectroscopy; CIS,
clinically isolated syndrome; FLAIR, fluid-attenuated inversion
recovery; tNAA, total N-acetyl aspartate; tCr, total creatine;
tCho, total choline; mIns, myoinositol; Gln, glutamine; Glu,
glutamate; Glx, glutamate + glutamine; Glth, glutathione. |
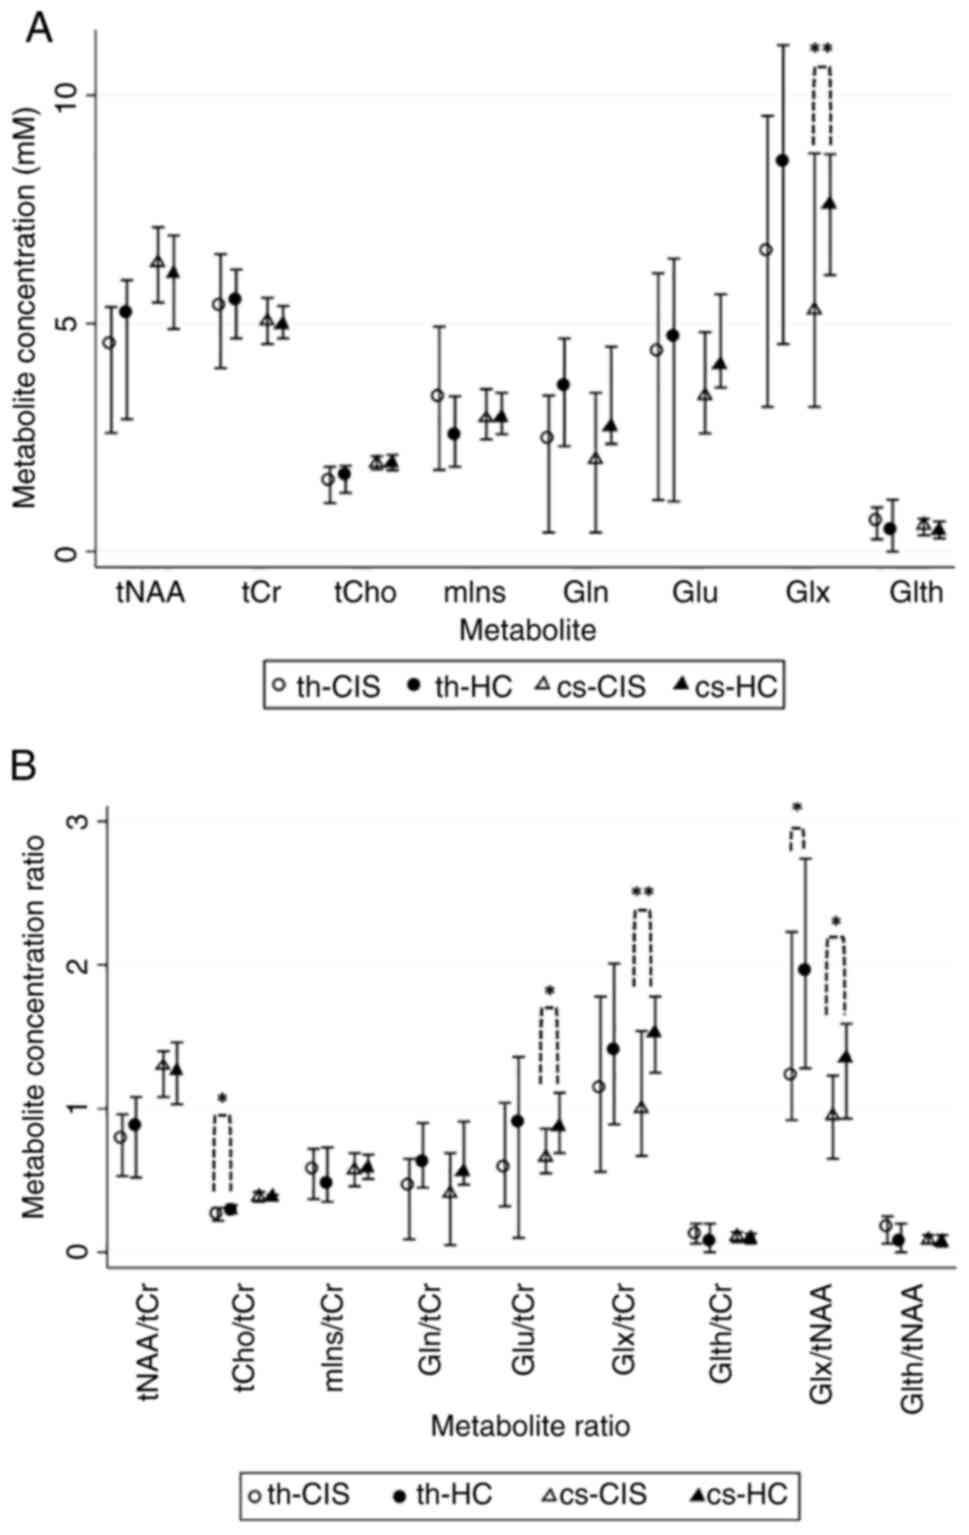 | Figure 21H-MRS metabolite
concentrations and ratios in the CIS and HC groups. (A)
Concentration for each metabolite (median ± IQR) obtained from th
and cs. (B) Estimated metabolite concentration ratios (median ±
IQR). *P<0.05 and **P<0.01.
1H-MRS, proton magnetic resonance spectroscopy; CIS,
clinically isolated syndrome; HC, healthy control; tNAA, total
N-acetyl aspartate; tCr, total creatine; tCho, total choline; mIns,
myoinositol; Gln, glutamine; Glu, glutamate; Glx, glutamate +
glutamine; Glth, glutathione; th, thalamic-voxel; cs, centrum
semiovale-voxel; IQR, interquartile range. |
| Table II1H-MRS metabolite
concentrations and ratios in the CIS and HC groups. |
Table II
1H-MRS metabolite
concentrations and ratios in the CIS and HC groups.
| A, Median
concentration (IQR), mM |
|---|
| Metabolite | CIS group
(n=35) | HC group
(n=28) | P-value |
|---|
| tNAA(th) | 4.55
(2.60-5.36) | 5.23
(2.90-5.95) | 0.114 |
| tNAA(cs) | 6.33
(5.46-7.11) | 6.08
(4.88-6.93) | 0.557 |
| tCr(th) | 5.39
(4.02-6.52) | 5.49
(4.67-6.18) | 0.952 |
| tCr(cs) | 5.03
(4.55-5.56) | 4.96
(4.67-5.38) | 0.724 |
| tCho(th) | 1.53
(1.06-1.86) | 1.66
(1.29-1.88) | 0.535 |
| tCho(cs) | 1.92
(1.80-2.09) | 1.91
(1.78-2.12) | 0.908 |
| mIns(th) | 3.40
(1.79-4.93) | 2.56
(1.86-3.40) | 0.252 |
| mIns(cs) | 2.90
(2.46-3.56) | 2.93
(2.57-3.48) | 0.853 |
| Gln(th) | 2.47
(0.42-3.42) | 3.64
(2.31-4.67) | 0.156 |
| Gln(cs) | 1.99
(0.42-3.48) | 2.74
(2.36-4.49) | 0.335 |
| Glu(th) | 4.37
(1.13-6.10) | 4.69
(1.10-6.42) | 0.736 |
| Glu(cs) | 3.41
(2.59-4.81) | 4.07
(3.59-5.64) | 0.129 |
| Glx(th) | 6.58
(3.17-9.55) | 8.53
(4.55-11.10) | 0.292 |
| Glx(cs) | 5.26
(3.17-8.73 | 7.59
(6.06-8.71) | 0.014a |
| Glth(th) | 0.68
(0.27-0.97) | 0.46
(0.00-1.14) | 0.100 |
| Glth(cs) | 0.55
(0.36-0.72) | 0.44
(0.29-0.66) | 0.741 |
| B, Median ratio
(IQR) |
| Metabolite | CIS group
(n=35) | HC group
(n=28) | P-value |
| tNAA/tCr(th) | 0.79
(0.53-0.96) | 0.876
(0.52-1.08) | 0.283 |
| tNAA/tCr(cs) | 1.29
(1.08-1.40) | 1.26
(1.03-1.46) | 0.675 |
| tCho/tCr(th) | 0.26
(0.22-0.31) | 0.29
(0.27-0.33) | 0.026a |
| tCho/tCr(cs) | 0.38
(0.35-0.42) | 0.38
(0.36-0.40) | 0.431 |
| mIns/tCr(th) | 0.57
(0.37-0.72) | 0.48
(0.35-0.73) | 0.505 |
| mIns/tCr(cs) | 0.57
(0.46-0.69) | 0.58
(0.51-0.68) | 0.678 |
| Gln/tCr(th) | 0.46
(0.09-0.65) | 0.62
(0.45-0.90) | 0.166 |
| Gln/tCr(cs) | 0.41
(0.05-0.69) | 0.55
(0.47-0.91) | 0.387 |
| Glu/tCr(th) | 0.59
(0.32-1.04) | 0.90
(0.10-1.36) | 0.399 |
| Glu/tCr(cs) | 0.66
(0.55-0.86) | 0.87
(0.69-1.11) | 0.040a |
| Glx/tCr(th) | 1.14
(0.56-1.78) | 1.40
(0.89-2.01) | 0.573 |
| Glx/tCr(cs) | 0.99
(0.67-1.54) | 1.52
(1.25-1.78) | 0.004a |
| Glth/tCr(th) | 0.12
(0.06-0.20) | 0.07
(0.00-0.20) | 0.197 |
| Glth/tCr(cs) | 0.10
(0.07-0.14) | 0.09
(0.06-0.13) | 0.514 |
| Glx/tNAA(th) | 1.23
(0.92-2.23) | 1.95
(1.28-2.74) | 0.043a |
| Glx/tNAA(cs) | 0.95
(0.65-1.23) | 1.35
(0.93-1.59) | 0.015a |
| Glth/tNAA(th) | 0.17
(0.06-0.25) | 0.07
(0.00-0.20) | 0.106 |
| Glth/tNAA(cs) | 0.08
(0.06-0.12) | 0.07
(0.04-0.12) | 0.748 |
The present study also investigated if the use of
DMTs could have an early indirect impact on metabolic
1H-MRS profiles. Accordingly, the estimated metabolite
concentrations and ratios in patients with CIS who received DMTs
(CIS-treated group, n=12) were compared with patients with CIS who
were DMT-naïve at the 1H-MRS acquisition (CIS-untreated
group, n=23). In the CIS-treated-group tNAA(cs) was significantly
higher and tCr(cs) was also elevated showing a trend toward
significance (Table III,
Fig. 3A). The comparisons between
metabolic ratios indicated a non-significant trend for increased
Gln/tCr(th) ratio in the CIS-treated group (Table III, Fig. 3B).
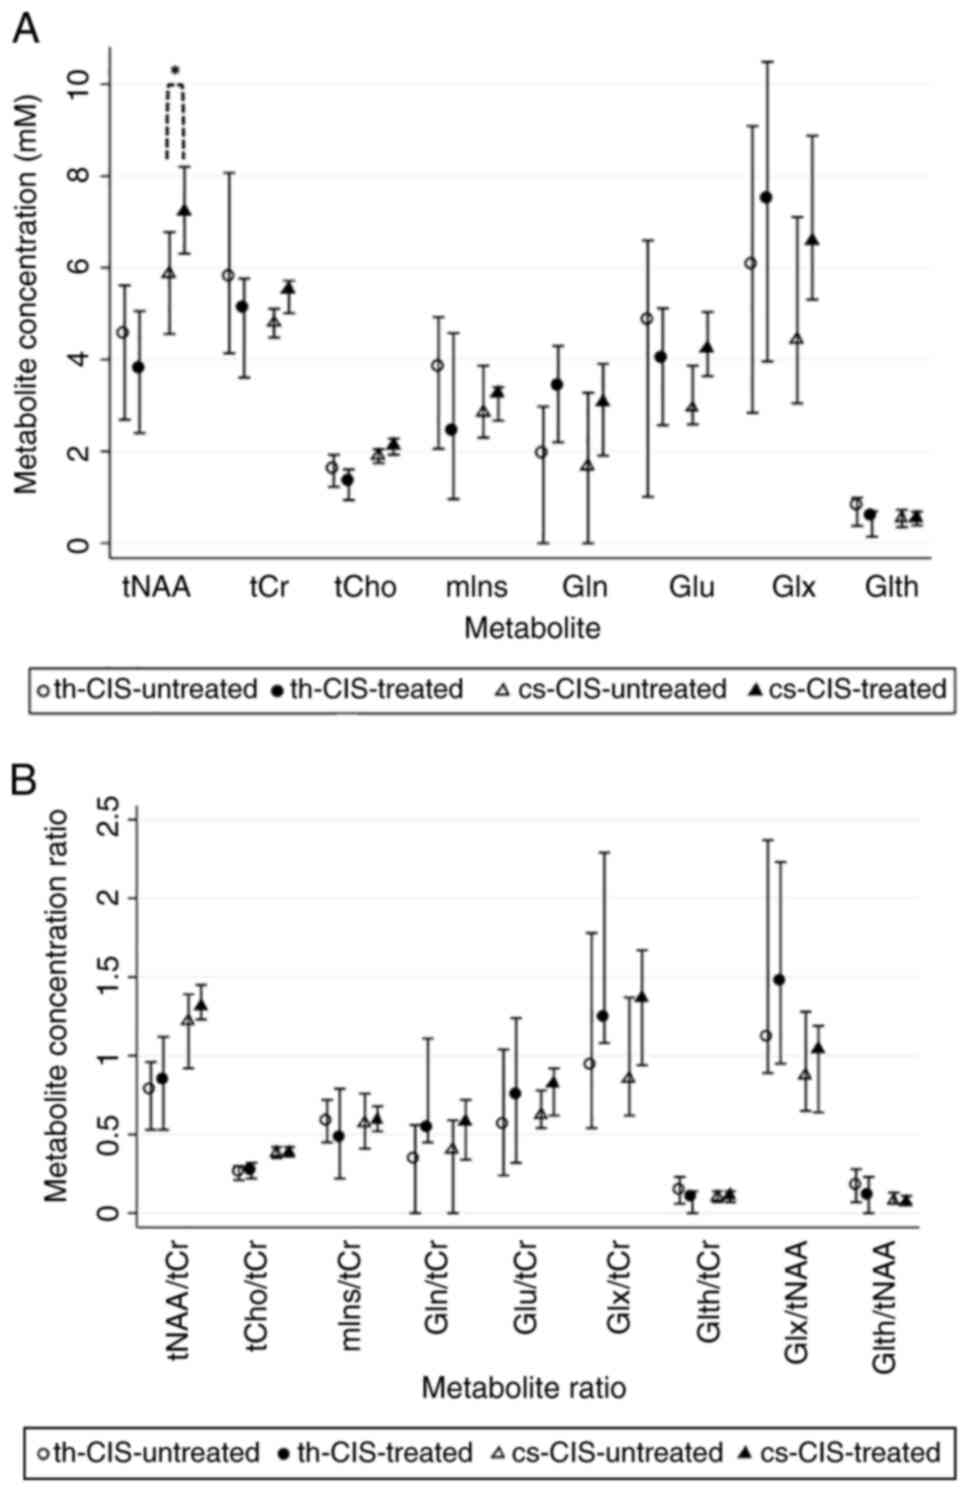 | Figure 31H-MRS metabolite
concentrations and ratios in the CIS-untreated and the CIS-treated
groups. (A) Metabolite concentrations (median ± IQR) in th and cs.
(B) Estimated metabolite concentration ratios (median ± IQR).
*P<0.05. 1H-MRS, proton magnetic resonance
spectroscopy; CIS, clinically isolated syndrome; tNAA, total
N-acetyl aspartate; tCr, total creatine; tCho, total choline; mIns,
myoinositol; Gln, glutamine; Glu, glutamate; Glx, glutamate +
glutamine; Glth, glutathione; th, thalamic-voxel; cs, centrum
semiovale-voxel; IQR, interquartile range. |
| Table IIIMetabolite concentrations and ratios
in the CIS-untreated and CIS-treated groups at 1H-MRS
acquisition. |
Table III
Metabolite concentrations and ratios
in the CIS-untreated and CIS-treated groups at 1H-MRS
acquisition.
| A, Median
concentration (IQR), mM |
|---|
| Metabolite | CIS-untreated
(n=23) | CIS-treated
(n=12) | P-value |
|---|
| tNAA(th) | 4.57
(2.69-5.62) | 3.80
(2.40-5.06) | 0.558 |
| tNAA (cs) | 5.87
(4.56-6.78) | 7.21
(6.31-8.20) | 0.028a |
| tCr(th) | 5.79
(4.14-8.07) | 5.11
(3.61-5.77) | 0.642 |
| tCr(cs) | 4.78
(4.48-5.11) | 5.51
(5.01-5.72) | 0.073 |
| tCho (th) | 1.61
(1.23-1.93) | 1.34
(0.94-1.61) | 0.432 |
| tCho(cs) | 1.90
(1.75-2.05) | 2.12
(1.93-2.28) | 0.308 |
| mIns(th) | 3.83
(2.06-4.93) | 2.43
(0.96-4.58) | 0.462 |
| mIns(cs) | 2.84
(2.30-3.87) | 3.25
(2.67-3.40) | 0.817 |
| Gln(th) | 1.94
(0.00-2.98) | 3.42
(2.20-4.30) | 0.383 |
| Gln(cs) | 1.68
(0.00-3.28) | 3.05
(1.91-3.91) | 0.109 |
| Glu(th) | 4.85
(1.01-6.60) |
4.03(2.57-5.12) | 0.501 |
| Glu(cs) | 2.93
(2.59-3.87) | 4.22
(3.64-5.04) | 0.113 |
| Glx(th) | 6.06
(2.84-9.09) | 7.49
(3.96-10.49) | 0.406 |
| Glx(cs) | 4.44
(3.05-7.11) | 6.59
(5.31-8.88) | 0.125 |
| Glth(th) | 0.82
(0.38-0.99) | 0.60
(0.14-0.70) | 0.429 |
| Glth(cs) | 0.54
(0.35-0.73) | 0.55
(0.39-0.69) | 0.850 |
| B, Median ratio
(IQR) |
| Metabolite | CIS-untreated
(n=23) | CIS-treated
(n=12) | P-value |
| tNAA/tCr(th) | 0.78
(0.53-0.96) | 0.84
(0.53-1.12) | 0.497 |
| tNAA/tCr(cs) | 1.22
(0.92-1.39) | 1.31
(1.23-1.45) | 0.292 |
| tCho/tCr(th) | 0.26
(0.21-0.30) | 0.27
(0.22-0.32) | 0.390 |
| tCho/tCr(cs) | 0.38
(0.35-0.42) | 0.38
(0.36-0.42) | 0.819 |
| mIns/tCr(th) | 0.58
(0.45-0.72) | 0.48
(0.22-0.79) | 0.609 |
| mIns/tCr(cs) | 0.57
(0.41-0.76) | 0.59
(0.52-0.68) | 0.680 |
| Gln/tCr(th) | 0.34
(0.00-0.56) | 0.54
(0.45-1.11) | 0.088 |
| Gln/tCr(cs) | 0.40
(0.00-0.59) | 0.58
(0.34-0.72) | 0.122 |
| Glu/tCr(th) | 0.56
(0.24-1.04) | 0.75
(0.32-1.24) | 0.986 |
| Glu/tCr(cs) | 0.62
(0.54-0.78) | 0.82
(0.62-0.92) | 0.352 |
| Glx/tCr(th) | 0.94
(0.54-1.78) | 1.24
(1.08-2.29) | 0.191 |
| Glx/tCr(cs) | 0.85
(0.62-1.37) | 1.36
(0.94-1.67) | 0.770 |
| Glth/tCr(th) | 0.14
(0.06-0.23) | 0.10
(0.00-0.14) | 0.542 |
| Glth/tCr(cs) | 0.10
(0.07-0.14) | 0.11
(0.07-0.14) | 0.984 |
| Glx/tNAA(th) | 1.12
(0.89-2.37) | 1.47
(0.95-2.23) | 0.566 |
| Glx/tNAA(cs) | 0.87
(0.65-1.28) | 1.04
(0.64-1.19) | 0.497 |
| Glth/tNAA(th) | 0.18
(0.07-0.28) | 0.11
(0.00-0.23) | 0.795 |
| Glth/tNAA(cs) | 0.08
(0.06-0.13) | 0.07
(0.06-0.11) | 0.994 |
Compared between CIS-untreated and HC group, there
were significant differences (Table
IV). CIS-untreated-group showed significantly decreased Glu(cs)
and Glx(cs) and lower Gln(th), however this was not significant
(Fig. 4A). Comparisons between
metabolite ratios revealed significantly decreased tCho/tCr(th),
Gln/tCr(th), Glu/tCr(cs), Glx/tCr(th), Glx/tCr(cs), Glx/tNAA(th)
and Glx/tNAA(cs) in the CIS-untreated group compared with those in
the HC group. Additionally, increased Glth/tCr(th) and
Glth/tNAA(th) were observed in the CIS-untreated group, however
this was not significant (Table
IV; Fig. 4B).
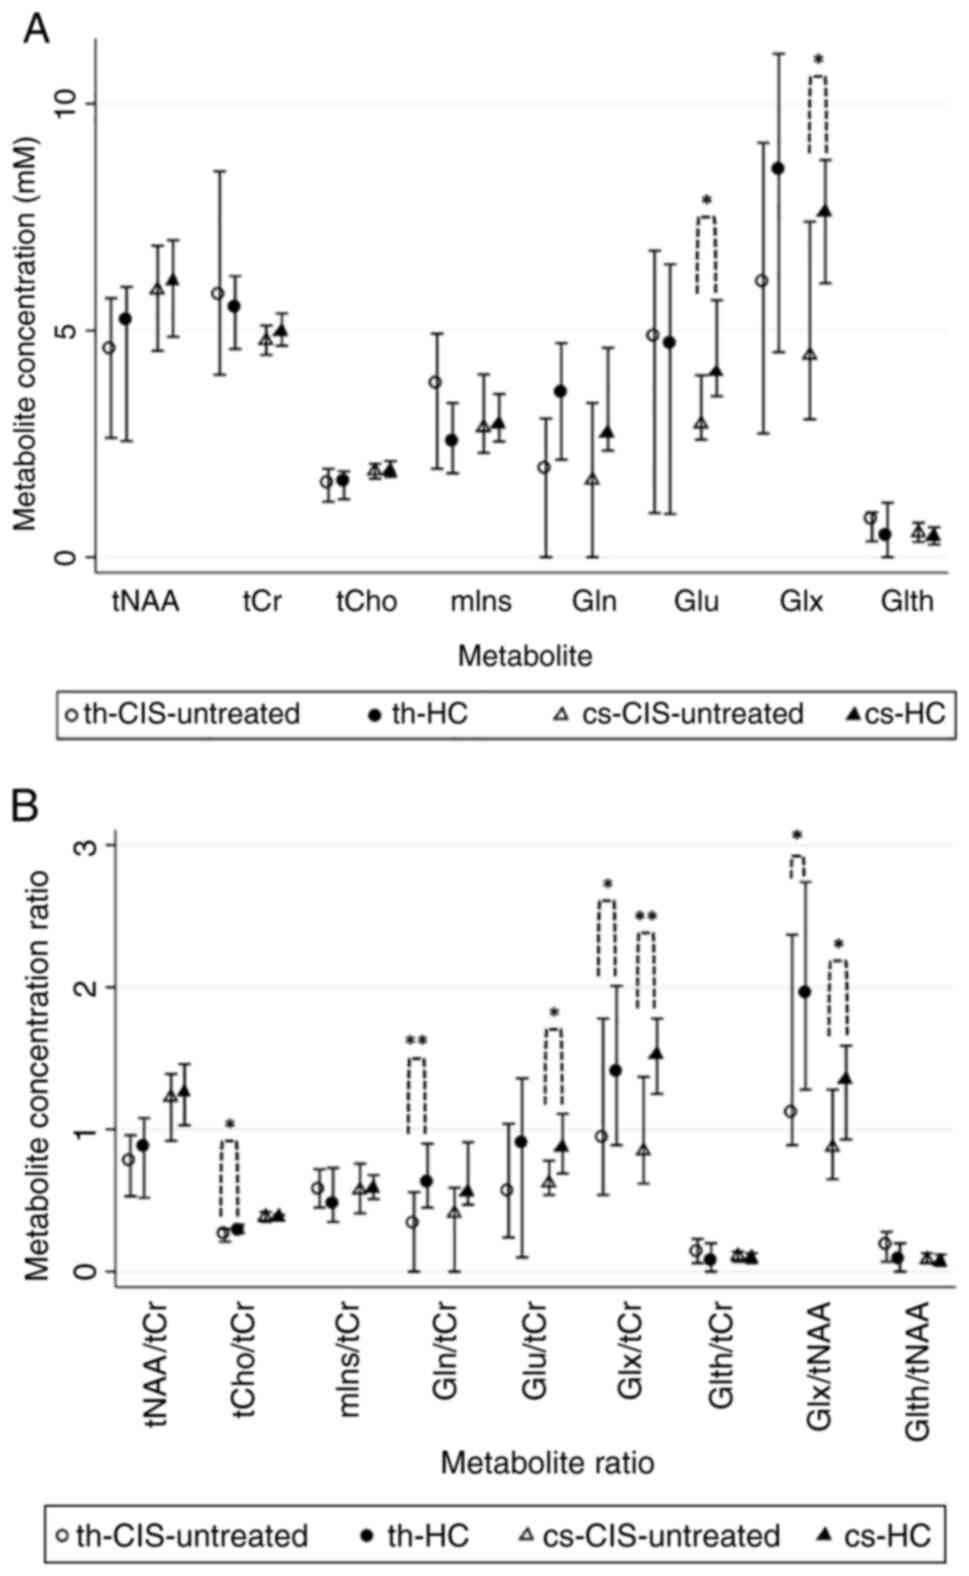 | Figure 41H-MRS metabolite
concentrations and ratios in the CIS-untreated and HC groups. (A)
Metabolite concentrations (median ± IQR) in th and cs. (B)
Estimated metabolite concentration ratios (median ± IQR).
*P<0.05 and **P<0.01.
1H-MRS, proton magnetic resonance spectroscopy; CIS,
clinically isolated syndrome; HC, healthy control; tNAA, total
N-acetyl aspartate; tCr, total creatine; tCho, total choline; mIns,
myoinositol; Gln, glutamine; Glu, glutamate; Glx, glutamate +
glutamine; Glth, glutathione; th, thalamic-voxel; cs, centrum
semiovale-voxel; IQR, interquartile range. |
| Table IVMetabolite concentrations and ratios
in the CIS-untreated and HC groups. |
Table IV
Metabolite concentrations and ratios
in the CIS-untreated and HC groups.
| A, Median
concentration (IQR), mM |
|---|
| Metabolite | CIS-untreated
(n=23) | HC (n=28) | P-value |
|---|
| tNAA(th) | 4.57
(2.63-5.71) | 5.23
(2.56-5.96) | 0.543 |
| tNAA(cs) | 5.87
(4.55-6.87) | 6.07
(4.86-6.99) | 0.639 |
| tCr(th) | 5.79
(4.02-8.51) | 5.49
(4.59-6.20) | 0.611 |
| tCr(cs) | 4.77
(4.46-5.11) | 4.96
(4.66-5.38) | 0.247 |
| tCho(th) | 1.61
(1.22-1.95) | 1.66
(1.28-1.89) | 0.983 |
| tCho(cs) | 1.90
(1.73-2.06) | 1.90
(1.77-2.12) | 0.797 |
| mIns(th) | 3.83
(1.95-4.93) | 2.56
(1.85-3.40) | 0.244 |
| mIns(cs) | 2.84
(2.30-4.03) | 2.92
(2.55-3.60) | 0.949 |
| Gln(th) | 1.94
(0.00-3.06) | 3.64
(2.15-4.72) | 0.068 |
| Gln(cs) | 1.68
(0.00-3.40) | 2.74
(2.35-4.62) | 0.404 |
| Glu(th) | 4.85
(0.97-6.76) | 4.69
(0.95-6.46) | 0.561 |
| Glu(cs) | 2.93
(2.59-4.01) | 4.06
(3.55-5.67) | 0.019a |
| Glx(th) | 6.05
(2.73-9.14) | 8.53
(4.52-11.10) | 0.199 |
| Glx(cs) | 4.44
(3.04-7.40) | 7.59
(6.04-8.76) | 0.014a |
| Glth(th) | 0.82
(0.35-0.99) | 0.46 (0-1.20) | 0.113 |
| Glth(cs) | 0.54
(0.34-0.76) | 0.44
(0.28-0.66) | 0.941 |
| B, Median ratio
(IQR) |
| Metabolite | CIS-untreated
(n=23) | HC (n=28) | P-value |
| tNAA/tCr(th) | 0.78
(0.53-0.96) | 0.876
(0.52-1.08) | 0.513 |
| tNAA/tCr(cs) | 1.22
(0.92-1.39) | 1.26
(1.03-1.46) | 0.840 |
| tCho/tCr(th) | 0.26
(0.21-0.30) | 0.29
(0.27-0.33) | 0.015a |
| tCho/tCr(cs) | 0.38
(0.35-0.42) | 0.38
(0.36-0.40) | 0.875 |
| mIns/tCr(th) | 0.58
(0.45-0.72) | 0.48
(0.35-0.73) | 0.456 |
| mIns/tCr(cs) | 0.57
(0.41-0.76) | 0.58
(0.51-0.68) | 0.760 |
| Gln/tCr(th) | 0.34
(0.00-0.56) | 0.62
(0.45-0.90) | 0.004a |
| Gln/tCr(cs) | 0.40
(0.00-0.59) | 0.55
(0.47-0.91) | 0.267 |
| Glu/tCr(th) | 0.56
(0.24-1.04) | 0.90
(0.10-1.36) | 0.272 |
| Glu/tCr(cs) | 0.62
(0.54-0.78) | 0.87
(0.69-1.11) | 0.021a |
| Glx/tCr(th) | 0.94
(0.54-1.78) | 1.40
(0.89-2.01) | 0.041a |
| Glx/tCr(cs) | 0.85
(0.62-1.37) | 1.52
(1.25-1.78) | 0.003a |
| Glth/tCr(th) | 0.14
(0.06-0.23) | 0.07
(0.00-0.20) | 0.064 |
| Glth/tCr(cs) | 0.10
(0.07-0.14) | 0.09
(0.06-0.13) | 0.626 |
| Glx/tNAA(th) | 1.12
(0.89-2.37) | 1.95
(1.28-2.74) | 0.030a |
| Glx/tNAA(cs) | 0.87
(0.65-1.28) | 1.35
(0.93-1.59) | 0.015a |
| Glth/tNAA(th) | 0.18
(0.07-0.28) | 0.08
(0.00-0.20) | 0.086 |
| Glth/tNAA(cs) | 0.08
(0.06-0.13) | 0.07
(0.04-0.12) | 0.552 |
Discussion
The present 1H-MRS study quantified and
investigated brain metabolites in patients with CIS and HCs. The
present results showed metabolic alterations in the thalamus and CS
in otherwise NA brain tissue on conventional MRI. 1H-MRS
protocol was designed to evaluate brain regions that did not show
lesions on classic FLAIR/T2 MRI sequences. Accordingly, the voxels
were placed strictly in the thalamus and CS areas without including
any lesions. Additionally, the present results showed similar
dimensions of the 'th' and 'cs' between the patients with CIS and
the HCs. Use of short TE 1H-MRS was optimal for Glu and
Gln peak detection (41,42).
The present analysis compared the 1H-MRS
results of the CIS and HC group and concluded that Glu, its
metabolic precursor Gln (43) and
Glx were reduced in the thalamus and the CS, indicating possibly
diminished glutaminergic activity; however, only the difference of
Glx(cs) reached statistical significance. The mixture of Glu/Gln is
involved in both excitatory and inhibitory neuronal pathways
(9) and concentrations of Glu, Gln
and Glx are affected by the interaction between Glu
formation/degradation and neurotransmission in neurons and
astrocytes (21,44). Zhang and Shen (44) observed higher Glu levels in GM than
in WM on 1H-MRS of brain cortices in healthy
individuals. Furthermore, a previous 3.0 T 1H-MRS study
in young adults showed Glx concentration to be increased in GM
(thalamus included) compared with that in WM (CS included). This
may be because Glu/Gln is located close to the synapses (45); this observation was in line with
the present results demonstrating absolute Glx(th) higher than
Glx(cs) in both the CIS and HC groups. 1H-MRS studies in
patients with MS also reported decreased Glu, Gln and/or Glx
concentrations: Nantes et al (23) reported decreased Glu concentrations
in the sensorimotor and parietal regions of the left cerebral
hemisphere; Chard et al (46) reported lower levels of Glx in the
cortical GM of clinically early relapsing-remitting (RR)MS compared
with those in HCs and Muhlert et al (24) reported lower Glu and Glx levels in
GM regions in patients with RRMS compared with those in controls at
3.0 T. Notably, another 1H-MRS study involving patients
with primary progressive MS (47)
demonstrated decreased Glu and Gln concentrations in cortical GM
compared with those in healthy individuals; these correlated with
increased EDSS scores. Additionally, the 1H-MRS study
performed at 7.0 T by Swanberg et al (48) involving patients with progressive
MS, RRMS and healthy controls demonstrated that only patients with
progressive MS had lower frontal cortical Glu levels but not
reduced Gln compared to healthy individuals; moreover, a negative
correlation of Glu levels with MS duration was found, suggesting
that these findings may reflect neuronal cell death (48). Even though the present study
applied the voxel in deep GM (thalamus) and not in the cortex, it
found no significant differences in Glu(th) levels between the CIS
and the HC group. Conversely, other 1H-MRS studies
estimating Glu or Glx levels in WM reported increased levels of
these two markers: Srinivasan et al (22) reported an elevation of Glu in acute
lesions (contrast-enhancing) and NAWM areas, but no significant
elevation in chronic lesions. Moreover, Tisell et al
(49) used 1.5 T 1H-MRS
and observed that Glx concentration was higher in the NAWM of
patients with MS compared with that in healthy individuals, showing
a positive correlation with the MS severity score, therefore
suggesting that Glx in the NAWM may be associated with disease
progression. Another 3.0 T 1H-MRS study of NAWM in
patients with SPMS revealed annual declines of Glu and Gln levels
within a 2-year period follow-up, implying that these metabolic
changes may be considered biomarkers of MS disease progression
(50). Azevedo et al
(51) used multi-voxel
1H-MRS of mixed tissue of NAWM plus GM and concluded
that higher Glu concentrations increased the rate of NAA decline
and a higher Glu/NAA ratio in the NAWM increased the rate of the
decrease in brain volume. Although Fernando et al (35) and Wattjes et al (32) reported higher mIns in the NAWM of
patients with CIS than in HCs, the present study did not confirm
such a difference.
In the present study, several metabolite ratios were
also calculated and showed heterogeneity between the CIS and the HC
groups; significantly reduced ratios of tCho/tCr(th), Glu/tCr(cs),
Glx/tCr(cs), Glx/tNAA(th) and Glx/tNAA(cs) were found in the CIS
group. In in vivo 1H-MRS studies, Cr is commonly
considered a relatively stable marker of intact brain energy
metabolism; therefore it has been frequently used as the reference
molecule for the 1H-MRS metabolite ratios (17,52).
Moreover, Cho is considered a marker of cell wall integrity as it
is a precursor of the cellular membranes (20). Therefore, decreased tCho/tCr(th)
ratio that was found in the CIS group may be mainly attributed to
the lower Cho levels in the thalamus. This could reflect increased
uptake of Cho from the free phase for the building of cell
membranes and therefore may be associated with the onset of healing
of brain tissue (53). Mathiesen
et al (54) reported
reduced Cho/Cr ratio within the cortical GM in patients with MS
compared with that in HCs. These results in the NAGM may also
indicate reduced cellularity during MS pathogenesis. In further
accordance with the present results, which demonstrated reduced
Glu/tCr(cs) and Glx/tCr(cs) ratios, Wattjes et al (32) indicated that the Glx/Cr ratio
decreased by 13.2% in the parietal NAWM of patients with CIS
compared with that in the HC group.
Furthermore, the present results demonstrated that
tNAA(cs) was not affected in the CIS-cohort, which was in
accordance with Fernando et al (35) and Brex et al (33); this may be indicative of a chemical
environment characterized by lack of severe impairment of axonal
and neuronal integrity (55).
Nevertheless, other 1H-MRS studies described lower tNAA
in the parietal NAWM in patients with CIS than that in HCs
(32,34). The present Glx/tNAA ratio was found
to be decreased in the thalamus and CS of the CIS group compared
with that in the HC group; this may suggest disruption of glutamate
homeostasis rather than neuronal/axonal damage (56) and could be because the compensatory
capacity of the CNS for axonal disruption is not significantly
compromised at the early stages of the MS pathogenic process.
Glx/NAA ratio of the hypothalamus in patients with RRMS was
assessed by Polacek et al (57); the increased ratio is associated
with an increase in the MS severity scale score and disease
severity. Low Glx/tNAA was observed in the NAWM and NAGM of the
present CIS group; this could be attributed to their mild disease
severity, since all the participants in the CIS group were at the
early clinical stage of MS, with <6 months from the first
clinical episode and a low median EDSS score of 1 (IQR,
1.0-1.5).
The present analysis compared 1H-MRS
results between the CIS-untreated and the HC group, thus excluding
the CIS-treated participants to examine for potential early impact
of DMTs on the biochemical brain content. Differences between the
CIS-untreated and HC group yielded statistically stronger
differences than testing between the CIS vs. the HC group for
Glx(cs), tCho/tCr(th), Glu/tCr(cs) Glx/tCr(cs), Glx/tNAA(th) and
Glx/tNAA(cs). These findings were in alignment with the hypothesis
of glutaminergic impairment and altered glutamate homeostasis in
early MS (58,59). Glu(cs), Gln/tCr(th) and Glx/tCr(th)
were significantly decreased in the CIS-untreated group compared
with HCs, reflecting the aforementioned imbalance of Glu and its
metabolites in the NAWM and NAGM.
CNS demyelination is associated with increased
energy demand; Witte et al (60) observed enhanced mitochondrial
density in axons and astrocytes in active MS lesions. An elevated
number of mitochondria is also reported in the NAGM of patients
with MS (61). Additionally,
mitochondrial dysfunction is observed in the NAWM of MS (62). Consequently, the 1H-MRS
quantification of tNAA, which is located in neurons and axons, may
provide not only information on axonal integrity but also on
mitochondrial function (11,63).
The present comparison between the CIS-treated and the
CIS-untreated groups indicated a higher tNAA(cs) in the CIS-treated
group; this could reflect an early protective treatment effect on
the chemical environment of brain WM tissue as increased levels of
NAA contribute to the enhancement of mitochondrial energy
production and membrane lipid production and thus to the survival
of neurons (56).
Glth, is hypothesized to be a key antioxidant in
neuroprotection by interacting with the reactive oxygen species,
which are increased during MS pathogenesis (64) and are generated by activated
macrophages during inflammation (63), thus leading to cellular damage and
tissue injury. Glth is involved in the Glu-Gln cycle in astrocytes
and neurons of the brain (65),
and its synthesis depends on extracellular Glu levels, hence
possibly contributing to the minimization of Glu toxicity by the
conversion of Glu to Glth (66,67).
Here, Glth(cs) and Glth(th) were estimated to be higher in the CIS
than in the HC group and also in the CIS-untreated group than in
HCs; however, these differences did not reach statistical
significance. Differences in Glth ratios were also observed.
Increased Glth/tCr and Glth/tNAA were evidenced in the thalamus and
CS of the CIS-untreated group compared with those in the HC group
with the thalamic voxel ratios demonstrating a trend toward
significance for both ratios. Considering the decrease in
concentrations of Glx that was observed in the CIS group of the
present study, which may be attributed to the inhibition of Glu
synthesis or to its rapid transformation to other metabolites such
as Glth, the higher levels of Glth could reflect an adequate
compensatory mechanism for diminishing Glu levels in the neuronal
environment in the early clinical stage of MS as the CIS.
In the present study, certain results demonstrated
only a trend toward statistical significance; a larger sample size
could lead to significant results. Comparison of the CIS treated
and untreated groups decreased the number of patients per
sub-group, however, it revealed additional multiple significant
associations and hence indicated strong differences. Additionally,
heterogeneity with the results of previous 1H-MRS MS
studies may be attributed to the following factors: different
technical and methodological approaches and discrepancies within
various spectroscopy acquisition protocols; differences in the
applied magnetic field strength (1.5, 3.0 or 7.0 T); use of
different [short (35 msec) or intermediate (144 msec)] TEs;
inhomogeneity of tissue selection during voxel placement (such as
inclusion of mixed areas of NAWM with GM or ventricles, or
inclusion of regions with demyelinating lesions); different methods
for spectral processing and quantification; heterogeneity in the
definition of the diagnosis of early or progressive MS, and
treatment influence on the levels of neurometabolites.
Consequently, 1H-MRS acquisition and data processing
protocols must be standardized to achieve reliable results and
expand its clinical utility in MS and other diseases affecting the
CNS. Follow-up 1H-MRS measurements in both CIS and HC
groups should be performed to evaluate changes in metabolite levels
in the long term.
In conclusion, the current findings suggested that
3.0 T 1H-MRS may provide novel insights into the
metabolic alterations that could occur during the pathogenesis of
MS and at the very early clinical phase of the disease. It could be
considered a useful and advanced method to non-invasively evaluate
and quantify brain metabolite concentrations. 3.0 T
1H-MRS was capable of detecting early biochemical
changes in NAWM and NAGM before lesion formation became evident on
conventional MRI, reflecting an imbalance caused by the
immunological mechanism of MS. Moreover, an early indirect
therapeutic impact of DMTs on the biochemical profile of NAWM and
NAGM in the CIS group was also observed, despite the relatively
small number of patients in the sub-group comparisons. The observed
therapeutic effect indicated the need for early initiation of
immunotherapy, aiming for rapid disease control to ameliorate
tissue damage, since a biochemical shift may be mediated even in a
few weeks from treatment onset, as shown in the present study.
Therefore, in the future, 1H-MRS might be incorporated
both into the monitoring of treatment efficacy and therapeutic
decision-making process in MS.
Acknowledgements
Not applicable.
Funding
Funding: No funding was received.
Availability of data and materials
The datasets used and/or analyzed during the current
study are available from the corresponding authors on reasonable
request.
Authors' contributions
DT, AK, EK, GV, CP, CK and EA conceived and designed
the study. DT, AK, EK, GV, JST, SAS, PT, IE, GT, CP, CK and EA
acquired, analyzed and interpreted the data. DT and AK confirm the
authenticity of the raw data. DT, AK, EK and EA drafted the
manuscript. All authors critically reviewed the manuscript for
important intellectual content. All authors have read and approved
the final manuscript.
Ethics approval and consent to
participate
Approval was obtained from the Ethics Committee of
Eginition Hospital (approval no. 518/5.10.2015). Informed written
consent to participate was obtained from all the participants.
Patient consent for publication
Not applicable.
Competing interests
The authors declare that they have no competing
interests.
References
|
1
|
Bakshi R, Thompson AJ, Rocca MA, Pelletier
D, Dousset V, Barkhof F, Inglese M, Guttmann CR, Horsfield MA and
Filippi M: MRI in multiple sclerosis: Current status and future
prospects. Lancet Neurol. 7:615–625. 2008.PubMed/NCBI View Article : Google Scholar
|
|
2
|
Lassmann H: Targets of therapy in
progressive MS. Mult Scler. 23:1593–1599. 2017.PubMed/NCBI View Article : Google Scholar
|
|
3
|
Lassmann H: Pathogenic mechanisms
associated with different clinical courses of multiple sclerosis.
Front Immunol. 9(3116)2019.PubMed/NCBI View Article : Google Scholar
|
|
4
|
Haider L, Simeonidou C, Steinberger G,
Hametner S, Grigoriadis N, Deretzi G, Kovacs GG, Kutzelnigg A,
Lassmann H and Frischer JM: Multiple sclerosis deep grey matter:
The relation between demyelination, neurodegeneration, inflammation
and iron. J Neurol Neurosurg Psychiatry. 85:1386–1395.
2014.PubMed/NCBI View Article : Google Scholar
|
|
5
|
Minagar A, Barnett MH, Benedict RHB,
Pelletier D, Pirko I, Sahraian MA, Frohman E and Zivadinov R: The
thalamus and multiple sclerosis: Modern views on pathologic,
imaging, and clinical aspects. Neurology. 80:210–219.
2013.PubMed/NCBI View Article : Google Scholar
|
|
6
|
Houtchens MK, Benedict RHB, Killiany R,
Sharma J, Jaisani Z, Singh B, Weinstock-Guttman B, Guttmann CR and
Bakshi R: Thalamic atrophy and cognition in multiple sclerosis.
Neurology. 69:1213–1223. 2007.PubMed/NCBI View Article : Google Scholar
|
|
7
|
Miller DH, Chard DT and Ciccarelli O:
Clinically isolated syndromes. Lancet Neurol. 11:157–169.
2012.PubMed/NCBI View Article : Google Scholar
|
|
8
|
Brownlee WJ and Miller DH: Clinically
isolated syndromes and the relationship to multiple sclerosis. J
Clin Neurosci. 21:2065–2071. 2014.PubMed/NCBI View Article : Google Scholar
|
|
9
|
Lin A, Ross BD, Harris K and Wong W:
Efficacy of proton magnetic resonance spectroscopy in neurological
diagnosis and neurotherapeutic decision making. NeuroRx. 2:197–214.
2005.PubMed/NCBI View Article : Google Scholar
|
|
10
|
Swanberg KM, Landheer K, Pitt D and Juchem
C: Quantifying the metabolic signature of multiple sclerosis by in
vivo proton magnetic resonance spectroscopy: Current challenges and
future outlook in the translation from proton signal to diagnostic
biomarker. Front Neurol. 10(1173)2019.PubMed/NCBI View Article : Google Scholar
|
|
11
|
Oh J, Ontaneda D, Azevedo C, Klawiter EC,
Absinta M, Arnold DL, Bakshi R, Calabresi PA, Crainiceanu C, Dewey
B, et al: Imaging outcome measures of neuroprotection and repair in
MS: A consensus statement from NAIMS. Neurology. 92:519–533.
2019.PubMed/NCBI View Article : Google Scholar
|
|
12
|
Wilson M, Andronesi O, Barker PB, Bartha
R, Bizzi A, Bolan PJ, Brindle KM, Choi IY, Cudalbu C, Dydak U, et
al: Methodological consensus on clinical proton MRS of the brain:
Review and recommendations. Magn Reson Med. 82:527–550.
2019.PubMed/NCBI View Article : Google Scholar
|
|
13
|
Bitsch A, Bruhn H, Vougioukas V,
Stringaris A, Lassmann H, Frahm J and Brück W: Inflammatory CNS
demyelination: Histopathologic correlation with in vivo
quantitative proton MR spectroscopy. AJNR Am J Neuroradiol.
20:1619–1627. 1999.PubMed/NCBI
|
|
14
|
Rae CD: A guide to the metabolic pathways
and function of metabolites observed in human brain 1H magnetic
resonance spectra. Neurochem Res. 39:1–36. 2014.PubMed/NCBI View Article : Google Scholar
|
|
15
|
Geurts JJG, Reuling IEW, Vrenken H,
Uitdehaag BMJ, Polman CH, Castelijns JA, Barkhof F and Pouwels PJW:
MR spectroscopic evidence for thalamic and hippocampal, but not
cortical, damage in multiple sclerosis. Magn Reson Med. 55:478–483.
2006.PubMed/NCBI View Article : Google Scholar
|
|
16
|
Zhu H and Barker PB: MR spectroscopy and
spectroscopic imaging of the brain. Methods Mol Biol. 711:203–226.
2011.PubMed/NCBI View Article : Google Scholar
|
|
17
|
Buonocore MH and Maddock RJ: Magnetic
resonance spectroscopy of the brain: A review of physical
principles and technical methods. Rev Neurosci. 26:609–632.
2015.PubMed/NCBI View Article : Google Scholar
|
|
18
|
Nordengen K, Heuser C, Rinholm JE, Matalon
R and Gundersen V: Localisation of N-acetylaspartate in
oligodendrocytes/myelin. Brain Struct Funct. 220:899–917.
2015.PubMed/NCBI View Article : Google Scholar
|
|
19
|
Narayana PA: Magnetic resonance
spectroscopy in the monitoring of multiple sclerosis. J
Neuroimaging. 15 (Suppl 4):46S–57S. 2005.PubMed/NCBI View Article : Google Scholar
|
|
20
|
Scheau C, Preda EM, Popa GA, Ghergus AE,
Capsa RA and Lupescu IG: Magnetic resonance spectroscopy-a
non-invasive method in evaluating focal and diffuse central nervous
system disease. J Med Life. 5:423–427. 2012.PubMed/NCBI
|
|
21
|
Hertz L: Intercellular metabolic
compartmentation in the brain: Past, present and future. Neurochem
Int. 45:285–296. 2004.PubMed/NCBI View Article : Google Scholar
|
|
22
|
Srinivasan R, Sailasuta N, Hurd R, Nelson
S and Pelletier D: Evidence of elevated glutamate in multiple
sclerosis using magnetic resonance spectroscopy at 3 T. Brain.
128:1016–1025. 2005.PubMed/NCBI View Article : Google Scholar
|
|
23
|
Nantes JC, Proulx S, Zhong J, Holmes SA,
Narayanan S, Brown RA, Hoge RD and Koski L: GABA and glutamate
levels correlate with MTR and clinical disability: Insights from
multiple sclerosis. Neuroimage. 157:705–715. 2017.PubMed/NCBI View Article : Google Scholar
|
|
24
|
Muhlert N, Atzori M, De Vita E, Thomas DL,
Samson RS, Wheeler-Kingshott CAM, Geurts JJ, Miller DH, Thompson AJ
and Ciccarelli O: Memory in multiple sclerosis is linked to
glutamate concentration in grey matter regions. J Neurol Neurosurg
Psychiatry. 85:834–840. 2014.PubMed/NCBI View Article : Google Scholar
|
|
25
|
Mader I, Roser W, Kappos L, Hagberg G,
Seelig J, Radue EW and Steinbrich W: Serial proton MR spectroscopy
of contrast-enhancing multiple sclerosis plaques: Absolute
metabolic values over 2 years during a clinical pharmacological
study. Am J Neuroradiol. 21:1220–1227. 2000.PubMed/NCBI
|
|
26
|
Vafaeyan H, Ebrahimzadeh SA, Rahimian N,
Alavijeh SK, Madadi A, Faeghi F, Harirchian MH and Rad HS:
Quantification of diagnostic biomarkers to detect multiple
sclerosis lesions employing (1)H-MRSI at 3T. Australas Phys Eng Sci
Med. 38:611–618. 2015.PubMed/NCBI View Article : Google Scholar
|
|
27
|
Cooper AJL: Role of astrocytes in
maintaining cerebral glutathione homeostasis and in protecting the
brain against xenobiotics and oxidative stress. In: Glutathione in
the Nervous System. CRC Press, pp91-115, 2020.
|
|
28
|
Rice ME and Russo-Menna I: Differential
compartmentalization of brain ascorbate and glutathione between
neurons and glia. Neuroscience. 82:1213–1223. 1998.PubMed/NCBI View Article : Google Scholar
|
|
29
|
Choi I, Lee P, Hughes AJ, Denney DR and
Lynch SG: Longitudinal changes of cerebral glutathione (GSH) levels
associated with the clinical course of disease progression in
patients with secondary progressive multiple sclerosis. Mult Scler.
23:956–562. 2017.PubMed/NCBI View Article : Google Scholar
|
|
30
|
Choi IY, Lee SP, Denney D and Lynch S:
Lower levels of glutathione in the brains of secondary progressive
multiple sclerosis patients measured by 1H magnetic resonance
chemical shift imaging at 3 T. Mult Scler. 17:289–296.
2011.PubMed/NCBI View Article : Google Scholar
|
|
31
|
Filippi M, Bozzali M, Rovaris M, Gonen O,
Kesavadas C, Ghezzi A, Martinelli V, Grossman RI, Scotti G, Comi G
and Falini A: Evidence for widespread axonal damage at the earliest
clinical stage of multiple sclerosis. Brain. 126:433–437.
2003.PubMed/NCBI View Article : Google Scholar
|
|
32
|
Wattjes MP, Harzheim M, Lutterbey GG,
Klotz L, Schild HH and Träber F: Axonal damage but no increased
glial cell activity in the normal-appearing white matter of
patients with clinically isolated syndromes suggestive of multiple
sclerosis using high-field magnetic resonance spectroscopy. Am J
Neuroradiol. 28:1517–1522. 2007.PubMed/NCBI View Article : Google Scholar
|
|
33
|
Brex PA, Gomez-Anson B, Parker GJ,
Molyneux PD, Miszkiel KA, Barker GJ, MacManus DG, Davie CA, Plant
GT and Miller DH: Proton MR spectroscopy in clinically isolated
syndromes suggestive of multiple sclerosis. J Neurol Sci.
166:16–22. 1999.PubMed/NCBI View Article : Google Scholar
|
|
34
|
Wattjes MP, Harzheim M, Lutterbey GG,
Bogdanow M, Schild HH and Träber F: High field MR imaging and 1H-MR
spectroscopy in clinically isolated syndromes suggestive of
multiple sclerosis: Correlation between metabolic alterations and
diagnostic MR imaging criteria. J Neurol. 255:56–63.
2008.PubMed/NCBI View Article : Google Scholar
|
|
35
|
Fernando KTM, McLean MA, Chard DT,
MacManus DG, Dalton CM, Miszkiel KA, Gordon RM, Plant GT, Thompson
AJ and Miller DH: Elevated white matter myo-inositol in clinically
isolated syndromes suggestive of multiple sclerosis. Brain.
127:1361–1369. 2004.PubMed/NCBI View Article : Google Scholar
|
|
36
|
Miller DH, Weinshenker BG, Filippi M,
Banwell BL, Cohen JA, Freedman MS, Galetta SL, Hutchinson M,
Johnson RT, Kappos L, et al: Differential diagnosis of suspected
multiple sclerosis: A consensus approach. Mult Scler. 14:1157–1174.
2008.PubMed/NCBI View Article : Google Scholar
|
|
37
|
Polman CH, Reingold SC, Banwell B, Clanet
M, Cohen JA, Filippi M, Fujihara K, Havrdova E, Hutchinson M,
Kappos L, et al: Diagnostic criteria for multiple sclerosis: 2010
Revisions to the McDonald criteria. Ann Neurol. 69:292–302.
2011.PubMed/NCBI View Article : Google Scholar
|
|
38
|
Kurtzke JF: Rating neurologic impairment
in multiple sclerosis: An expanded disability status scale (EDSS).
Neurology. 33:1444–1452. 1983.PubMed/NCBI View Article : Google Scholar
|
|
39
|
Wilson M, Reynolds G, Kauppinen RA,
Arvanitis TN and Peet AC: A constrained least-squares approach to
the automated quantitation of in vivo ¹H magnetic resonance
spectroscopy data. Magn Reson Med. 65:1–12. 2011.PubMed/NCBI View Article : Google Scholar
|
|
40
|
Reynolds G, Wilson M, Peet A and Arvanitis
TN: An algorithm for the automated quantitation of metabolites in
in vitro NMR signals. Magn Reson Med. 56:1211–1219. 2006.PubMed/NCBI View Article : Google Scholar
|
|
41
|
Ramadan S, Lin A and Stanwell P: Glutamate
and glutamine: A review of in vivo MRS in the human brain. NMR
Biomed. 26:1630–1646. 2013.PubMed/NCBI View Article : Google Scholar
|
|
42
|
Hancu I: Optimized glutamate detection at
3T. J Magn Reson Imaging. 30:1155–1162. 2009.PubMed/NCBI View Article : Google Scholar
|
|
43
|
Walls AB, Waagepetersen HS, Bak LK,
Schousboe A and Sonnewald U: The glutamine-glutamate/GABA cycle:
Function, regional differences in glutamate and GABA production and
effects of interference with GABA metabolism. Neurochem Res.
40:402–409. 2015.PubMed/NCBI View Article : Google Scholar
|
|
44
|
Zhang Y and Shen J: Regional and
tissue-specific differences in brain glutamate concentration
measured by in vivo single voxel MRS. J Neurosci Methods.
239:94–99. 2015.PubMed/NCBI View Article : Google Scholar
|
|
45
|
Baker EH, Basso G, Barker PB, Smith MA,
Bonekamp D and Horská A: Regional apparent metabolite
concentrations in young adult brain measured by (1)H MR
spectroscopy at 3 Tesla. J Magn Reson Imaging. 27:489–499.
2008.PubMed/NCBI View Article : Google Scholar
|
|
46
|
Chard DT, Griffin CM, McLean MA, Kapeller
P, Kapoor R, Thompson AJ and Miller DH: Brain metabolite changes in
cortical grey and normal-appearing white matter in clinically early
relapsing-remitting multiple sclerosis. Brain. 125:2342–2352.
2002.PubMed/NCBI View Article : Google Scholar
|
|
47
|
Sastre-Garriga J, Ingle GT, Chard DT,
Ramió-Torrentà L, McLean MA, Miller DH and Thompson AJ: Metabolite
changes in normal-appearing gray and white matter are linked with
disability in early primary progressive multiple sclerosis. Arch
Neurol. 62:569–573. 2005.PubMed/NCBI View Article : Google Scholar
|
|
48
|
Swanberg KM, Prinsen H, DeStefano K,
Bailey M, Kurada AV, Pitt D, Fulbright RK and Juchem C: In vivo
evidence of differential frontal cortex metabolic abnormalities in
progressive and relapsing-remitting multiple sclerosis. NMR Biomed.
34(e4590)2021.PubMed/NCBI View Article : Google Scholar
|
|
49
|
Tisell A, Leinhard OD, Warntjes JBM, Aalto
A, Smedby Ö, Landtblom AM and Lundberg P: Increased concentrations
of glutamate and glutamine in normal-appearing white matter of
patients with multiple sclerosis and normal MR imaging brain scans.
PLoS One. 8(e61817)2013.PubMed/NCBI View Article : Google Scholar
|
|
50
|
Macmillan EL, Tam R, Zhao Y, Vavasour IM,
Li DKB, Oger J, Freedman MS, Kolind SH and Traboulsee AL:
Progressive multiple sclerosis exhibits decreasing glutamate and
glutamine over two years. Mult Scler. 22:112–116. 2016.PubMed/NCBI View Article : Google Scholar
|
|
51
|
Azevedo CJ, Kornak J, Chu P, Sampat M,
Okuda DT, Cree BA, Nelson SJ, Hauser SL and Pelletier D: In vivo
evidence of glutamate toxicity in multiple sclerosis. Ann Neurol.
76:269–278. 2014.PubMed/NCBI View Article : Google Scholar
|
|
52
|
Cecil KM: Proton magnetic resonance
spectroscopy: Technique for the Neuroradiologist. Neuroimaging Clin
N Am. 23:381–392. 2013.PubMed/NCBI View Article : Google Scholar
|
|
53
|
Gustafsson MC, Dahlqvist O, Jaworski J,
Lundberg P and Landtblom AME: Low choline concentrations in
normal-appearing white matter of patients with multiple sclerosis
and normal MR imaging brain scans. Am J Neuroradiol. 28:1306–1312.
2007.PubMed/NCBI View Article : Google Scholar
|
|
54
|
Mathiesen HK, Tscherning T, Sorensen PS,
Larsson HBW, Rostrup E, Paulson OB and Hanson LG: Multi-slice
echo-planar spectroscopic MR imaging provides both global and local
metabolite measures in multiple sclerosis. Magn Reson Med.
53:750–759. 2005.PubMed/NCBI View Article : Google Scholar
|
|
55
|
Su K, Bourdette D and Forte M:
Mitochondrial dysfunction and neurodegeneration in multiple
sclerosis. Front Physiol. 4(169)2013.PubMed/NCBI View Article : Google Scholar
|
|
56
|
Moffett JR, Ross B, Arun P, Madhavarao CN
and Namboodiri AMA: N-Acetylaspartate in the CNS: From
neurodiagnostics to neurobiology. Prog Neurobiol. 81:89–131.
2007.PubMed/NCBI View Article : Google Scholar
|
|
57
|
Polacek H, Kantorova E, Hnilicova P,
Grendar M, Zelenak K and Kurca E: Increased glutamate and deep
brain atrophy can predict the severity of multiple sclerosis.
Biomed Pap Med Fac Univ Palacky Olomouc Czech Repub. 163:45–53.
2019.PubMed/NCBI View Article : Google Scholar
|
|
58
|
Werner P, Pitt D and Raine CS: Multiple
sclerosis: Altered glutamate homeostasis in lesions correlates with
oligodendrocyte and axonal damage. Ann Neurol. 50:169–180.
2001.PubMed/NCBI View Article : Google Scholar
|
|
59
|
Kostic M, Zivkovic N and Stojanovic I:
Multiple sclerosis and glutamate excitotoxicity. Rev Neurosci.
24:71–88. 2013.PubMed/NCBI View Article : Google Scholar
|
|
60
|
Witte ME, Bø L, Rodenburg RJ, Belien JA,
Musters R, Hazes T, Wintjes LT, Smeitink JA, Geurts JJ, De Vries
HE, et al: Enhanced number and activity of mitochondria in multiple
sclerosis lesions. J Pathol. 219:193–204. 2009.PubMed/NCBI View Article : Google Scholar
|
|
61
|
Blokhin A, Vyshkina T, Komoly S and Kalman
B: Variations in mitochondrial DNA copy numbers in MS brains. J Mol
Neurosci. 35:283–287. 2008.PubMed/NCBI View Article : Google Scholar
|
|
62
|
Dutta R, McDonough J, Yin X, Peterson J,
Chang A, Torres T, Gudz T, Macklin WB, Lewis DA, Fox RJ, et al:
Mitochondrial dysfunction as a cause of axonal degeneration in
multiple sclerosis patients. Ann Neurol. 59:478–489.
2006.PubMed/NCBI View Article : Google Scholar
|
|
63
|
Paling D, Golay X, Wheeler-Kingshott C,
Kapoor R and Miller D: Energy failure in multiple sclerosis and its
investigation using MR techniques. J Neurol. 258:2113–2127.
2011.PubMed/NCBI View Article : Google Scholar
|
|
64
|
Van Horssen J, Witte ME, Schreibelt G and
de Vries HE: Radical changes in multiple sclerosis pathogenesis.
Biochim Biophys Acta. 1812:141–150. 2011.PubMed/NCBI View Article : Google Scholar
|
|
65
|
McKenna MC: The glutamate-glutamine cycle
is not stoichiometric: Fates of glutamate in brain. J Neurosci Res.
85:3347–3358. 2007.PubMed/NCBI View Article : Google Scholar
|
|
66
|
Koga M, Serritella AV, Messmer MM,
Hayashi-Takagi A, Hester LD, Snyder SH, Sawa A and Sedlak TW:
Glutathione is a physiologic reservoir of neuronal glutamate.
Biochem Biophys Res Commun. 409:596–602. 2011.PubMed/NCBI View Article : Google Scholar
|
|
67
|
Sedlak TW, Paul BD, Parker GM, Hester LD,
Snowman AM, Taniguchi Y, Kamiya A, Snyder SH and Sawa A: The
glutathione cycle shapes synaptic glutamate activity. Proc Natl
Acad Sci USA. 116:2701–2706. 2019.PubMed/NCBI View Article : Google Scholar
|


