Introduction
Melanoma is a neoplasm with numerous chromosomal
aberrations that can be difficult to differentiate from atypical
nevi, particularly during the early stages of its development
(1,2). Chromosomal instability (CIN) is a
hallmark of all neoplasms and is highly prevalent in melanoma,
primarily being caused by exposure to ultraviolet radiation,
genetics or other factors (angiogenesis, stress and smoking, among
others) (2-4).
CIN is characterized by an increased rate of chromosomal
missegregation leading to aneuploidy, which may also occur in
benign tissues (particularly in Spitz nevi) (2,5).
Differentiating between melanoma in its early stages
from atypical nevi presents a pathological challenge that can
potentially result in misdiagnosis due to the similarities in their
characteristics (2,6). It has been demonstrated that
melanomas can be differentiated from nevi based on the loss or gain
of certain chromosomal regions (1). The gold standard in melanoma
diagnosis is histopathological examination; however, additional
tests can also be used to obtain a more accurate diagnosis. One of
these complementary diagnostic techniques is fluorescence in
situ hybridization (FISH), which can be used to assist in the
diagnosis of melanoma using skin biopsy specimens. FISH facilitates
the visualization of nucleic acid sequences and involves precise
annealing of a single-stranded, fluorophore-labeled DNA probe to
complementary target sequences. The hybridization of the DNA probe
be visualized using an epi-illumination fluorescence microscope.
FISH can identify various chromosomal aberrations that may have
contributed to the occurrence of melanoma; it is used to detect the
duplication/amplification, deletion or translocation of certain
chromosomes [for example, gains of 6p25 (RREB1) and 11q13 (CCND1),
and losses of 9p21 (CDKN2A)], making it a valuable tool for
diagnosis and prognosis, predicting the response to therapy or
monitoring patients to assess treatment efficacy (2). In the present study, signal gains for
RREB1 and CCND1 were frequently observed. Additionally, MYB and
CEP6 aberrations were also identified, supporting the utility of
FISH for detecting diagnostically relevant chromosomal changes.
Lai et al (7) reported that the Vysis Melanoma FISH
Probe Kit (Abbott Pharmaceutical Co. Ltd.) was a valuable ancillary
tool and highly sensitive in distinguishing early-stage acral and
cutaneous melanomas from dysplastic nevi in the Chinese population.
Also, according to Vergier et al (8), the Vysis Melanoma FISH Probe kit
achieved a sensitivity of 85%, a specificity of 90%, a positive
predictive value of 89.5% and a negative predictive value of 86%.
While the sensitivity and specificity of FISH can be high, it is
essential to rely on clinicopathological examinations to confirm
the final diagnosis and treatment decision, particularly when
assessing ambiguous melanocytic lesions (9). Therefore, although FISH has proven to
be a helpful tool in assisting clinicians to establish a diagnosis
it should be used as a complementary diagnostic technique due to
the potential for false-positive or false-negative results
(10).
In the present study, based on these findings, the
aim was to assess the reliability of the FISH test, through a
small-scale investigation conducted on 18 melanocytic lesions
previously diagnosed as either atypical nevi or melanoma by
dermoscopy (clinical examination) and histopathology. A 4-probe set
targeting 6p25 [Ras responsive element binding protein 1 (RREB1)],
6q23 [v-myb myeloblastosis viral oncogene homologue (MYB)],
centromere 6 (CEP6) and 11q13 [cyclin D1 (CCND1)] was used
(2). This kit was chosen due to
the various aforementioned studies that indicated that it was
reliable and produced good results.
Materials and methods
Sample collection and processing
A total of 20 melanocytic lesions that had
previously been diagnosed through dermoscopy and histopathological
examination between January 2017 and December 2022 at a private
dermatology office in Sibiu (Romania) and at the Emergency Hospital
of Sibiu County (Sibiu, Romania) were initially obtained. Probes
were collected from 20 patients (9 men and 11 women), aged between
30 and 84 years (mean age, 56.2 years). Patients were included in
the study based on the following criteria: Adult patients diagnosed
with atypical nevi or melanoma. Patients were excluded if they were
minors, patients with non-melanocytic tumors and patients with
common (non-atypical) nevi. However, two lesions (cases 15 and 16)
were excluded in the FISH pre/post-treatment phase of the study due
to primary processing artifacts (tissue quality/age and fixation
peculiarities). The study was conducted in 2023 at a private
analysis center with the help of two anatomopathologists and a
dermatologist. Of the 18 remaining lesions, five were
histopathologically confirmed as melanomas, eight were ambiguous
melanocytic lesions that were clinically diagnosed as melanomas,
but later proved to be atypical nevi on the histopathological
examination and the last five lesions were from patients with
atypical mole syndrome and were used for research purposes.
Therefore, the study was divided into two categories: FISH testing
on melanocytic tumors and FISH-histopathological associations. The
lesions were histopathologically analyzed according to the American
Joint Committee on Cancer 8th edition TNM classification for
melanoma (11) for tumoral
thickness (T1, ≤1 mm; T2, >1- ≤2 mm; T3, >2- ≤4 mm; and T4,
>4 mm in thickness), differentiation (G-), cell infiltrates, the
presence of emboli and mitoses, which are important prognostic
factors for localized primary melanomas where a higher mitotic
count is indicative of a higher likelihood of the tumor having
metastasized, as well as the presence of pigment. Histopathology is
considered the gold standard in melanoma diagnosis; however, it
should also be used in association to clinical history and
examination of the patient (12,13).
Typically, FISH is used solely on ambiguous melanocytic lesions to
confirm their melanoma nature; however, in the present study, FISH
was also used to confirm atypical nevi to assess its reliability
for research-related reasons. In the present study, the Vysis
Melanoma FISH Probe kit (catalogue number 30-608220/R6; Abbott
Pharmaceutical Co. Ltd.) was used to test the 18 melanocytic
lesions. This kit can detect the copy numbers of the RREB1 (6p25),
MYB (6q23) and CCND1 (11q13) genes and of CEP6 in formalin-fixed,
paraffin-embedded human skin biopsy specimens. The RREB1 (6p25)
probe is labeled with SpectrumRed and covers a 638 kb region that
contains the RREB1 gene. The MYB (6q23) probe is labeled with
SpectrumGold and covers a 743 kb region that contains the MYB gene.
The CCND1 (11q13) probe is labeled with SpectrumGreen and covers a
378 kb region that contains the CCND1 gene. The CEP6 probe, labeled
with SpectrumAqua, hybridizes with the α satellite DNA located at
the centromere of chromosome 6 (6p11.1-q11). The specimens were
prepared by two anatomopathologists; this included sectioning of
formalin-fixed, paraffin-embedded tissue specimens and preparing
slides. The tissue samples were fixed in 10% neutral buffered
formalin at room temperature for 24 h. Sections were cut at a
thickness of 4 µm. All specimens were histopathologically
re-verified to confirm their diagnosis. The specimens were
subjected to DNA denaturation (the DNA was denatured into
single-stranded DNA) at 80˚C for 5 min and then hybridized using
the RREB1/MYB/CCND1/CEP probes at 37˚C for 24 h (pretreatment).
After hybridization, the slides were washed with a washing buffer
solution (post-treatment), wash buffer 2X SSC, pH 7.0, 0.3% Nonidet
P-40, to remove the unbound probes, and subsequently the slides
were dried and the nuclei were stained with DAPI [at room
temperature (20-25˚C) for 10-15 min]. Then, the slides were covered
using lamellas and stored in a freezer according to the
manufacturer's instructions (-20˚C). Slides were examined using a
fluorescence microscope (Olympus BX61; Olympus Corporation). Each
slide was analyzed by an anatomopathologist and a dermatologist who
manually counted all the FISH signals. The medical personnel who
performed the FISH test had received formal training in the FISH
technique as part of their medical specialty and professional
development. They were experienced in performing FISH, including
sample preparation, hybridization and fluorescence signal
interpretation. Quality control steps were implemented to ensure
accuracy and consistency, including supervision and validation of
the procedures by experienced personnel, adherence to established
protocols, use of control samples [previously diagnosed benign
lesions (e.g., atypical nevi) within the sample cohort] to
differentiate true signals from artifacts and review of results to
minimize subjective bias.
Statistical analysis
Data were handled using Microsoft Excel (Office 365
version 2412; Microsoft Corporation) and are presented as frequency
(%). SPSS version 23 (IBM Corp.) was used for statistical analysis.
For the comparison of two qualitative variables, an association
table was used (Crosstabs). The significance level of the
Likelihood ratio test was considered. The results were interpreted
based on the instructions for melanoma status determination
provided by the manufacturer of the kit as follows: i) The number
of RREB1, MYB, CCND1 and CEP6 counts in each of 30 nuclei (out of
90 nuclei); ii) the number of RREB1 nuclei with aberrant signals
(<2 or >2) and the percentage of abnormal nuclei for RREB1
signals; iii) the sum and median of MYB signals per 90 nuclei; iv)
the number and median of CCND1 signals per 90 nuclei; and v) the
percentage and number of nuclei that showed a loss for MYB relative
to CEP6. The diagnosis (FISH+/FISH-) was based on either a median
value of CCND1 signals per nuclei or a median of MYB signals per
nuclei ≥2.5, a percentage loss of MYB relative to CEP6 of ≥31% or a
percentage of abnormal nuclei for RREB1 of ≥63% (FISH+ diagnosis).
A FISH- diagnosis was considered if none of the diagnostic criteria
were met. Histopathological association was performed for the
lesions that had ambiguous FISH results. P<0.05 was considered
to indicate a statistically significant difference.
Results
FISH testing on melanocytic
tumors
A total of 18 melanocytic lesions were analyzed
based on the manufacturer's instructions for the Vysis Melanoma
FISH Probe kit. The results for each examined gene are provided
below on a case-by-case basis.
The diagnosis of the cases was as follows: Case 1,
nodular melanoma; case 2, lentigo maligna melanoma; case 3,
melanoma; case 4, lentigo simplex; case 5, junctional atypical
nevus; case 6, lentiginous junctional atypical nevus; case 7,
junctional atypical nevus; case 8, Spitz nevus; case 9, lentiginous
melanocytic proliferation; case 10, mixed atypical nevus; case 11,
junctional atypical nevus; case 12, mixed atypical nevus; case 13,
mixed atypical nevus; case 14, mixed atypical nevus; case 17,
melanoma; case 18, mixed atypical nevus; case 19, atypical nevus;
and case 20, lentigo maligna melanoma.
RREB1 (6p25). The number of signals in each
of 30 out of 90 nuclei were counted and the lowest number of counts
was 52, found in case 14 (compound atypical nevus). The highest
number of signals was 94 in case 17 (melanoma) (Table I). The sum of the signals for RREB1
in each case was calculated and the lowest sum of signals value
(163 signals) was found in case 14, while 4 cases had >200
signals: Case 2 (lentigo maligna melanoma; 206 signals), case 3
(melanoma; 229 signals), case 9 (lentiginous melanocytic
proliferation; 213 signals) and case 17 (melanoma; 242 signals)
(Table II). There was a mean of
183.55 signals/case for RREB1 (median, 172.00 signals/case; IQR,
11.25 signals/case).
 | Table INumber of RREB1, MYB, CCND1 and CEP6
counts in each of 30 out of 90 nuclei. |
Table I
Number of RREB1, MYB, CCND1 and CEP6
counts in each of 30 out of 90 nuclei.
| Case no. | RREB1 0-30
nuclei | RREB1 31-60
nuclei | RREB1 61-90
nuclei | MYB 0-30
nuclei | MYB 31-60
nuclei | MYB 61-90
nuclei | CEP6 0-30
nuclei | CEP6 31-60
nuclei | CEP6 61-90
nuclei | CCND1 0-30
nuclei | CCND1 31-60
nuclei | CCND1 61-90
nuclei |
|---|
| Case 1 | 58 | 62 | 65 | 57 | 66 | 67 | 60 | 56 | 56 | 56 | 75 | 66 |
| Case 2 | 68 | 66 | 72 | 61 | 62 | 72 | 60 | 56 | 57 | 71 | 69 | 72 |
| Case 3 | 83 | 73 | 73 | 64 | 63 | 73 | 62 | 63 | 64 | 74 | 77 | 77 |
| Case 4 | 55 | 58 | 54 | 53 | 57 | 59 | 52 | 56 | 55 | 56 | 53 | 56 |
| Case 5 | 59 | 57 | 57 | 65 | 57 | 56 | 56 | 60 | 57 | 62 | 60 | 54 |
| Case 6 | 56 | 60 | 60 | 55 | 52 | 49 | 56 | 57 | 55 | 56 | 55 | 56 |
| Case 7 | 61 | 59 | 60 | 55 | 54 | 54 | 55 | 56 | 54 | 54 | 49 | 53 |
| Case 8 | 54 | 56 | 54 | 52 | 60 | 57 | 50 | 53 | 54 | 52 | 58 | 56 |
| Case 9 | 68 | 72 | 73 | 76 | 67 | 71 | 57 | 54 | 55 | 79 | 89 | 63 |
| Case 10 | 59 | 63 | 60 | 58 | 64 | 60 | 54 | 50 | 58 | 67 | 61 | 58 |
| Case 11 | 57 | 61 | 57 | 61 | 56 | 56 | 56 | 58 | 56 | 55 | 58 | 57 |
| Case 12 | 58 | 58 | 55 | 55 | 55 | 56 | 59 | 55 | 58 | 54 | 57 | 61 |
| Case 13 | 57 | 55 | 58 | 58 | 54 | 57 | 60 | 58 | 57 | 56 | 60 | 54 |
| Case 14 | 54 | 57 | 52 | 58 | 56 | 54 | 57 | 52 | 58 | 53 | 58 | 54 |
| Case 17 | 68 | 80 | 94 | 62 | 72 | 58 | 59 | 56 | 55 | 59 | 57 | 57 |
| Case 18 | 57 | 59 | 54 | 55 | 57 | 53 | 56 | 53 | 58 | 56 | 53 | 54 |
| Case 19 | 61 | 54 | 55 | 57 | 56 | 53 | 57 | 56 | 55 | 54 | 56 | 56 |
| Case 20 | 57 | 56 | 55 | 53 | 56 | 54 | 58 | 55 | 57 | 56 | 53 | 56 |
| Table IISum of RREB1, MYB, CEP6 and CCND1
signals per 90 nuclei. |
Table II
Sum of RREB1, MYB, CEP6 and CCND1
signals per 90 nuclei.
| Case no. | RREB1 | MYB | CEP6 | CCND1 |
|---|
| Case 1 | 185 | 190 | 172 | 197 |
| Case 2 | 206 | 195 | 173 | 212 |
| Case 3 | 229 | 200 | 189 | 228 |
| Case 4 | 167 | 169 | 163 | 165 |
| Case 5 | 173 | 178 | 173 | 176 |
| Case 6 | 176 | 156 | 168 | 167 |
| Case 7 | 180 | 163 | 165 | 156 |
| Case 8 | 164 | 169 | 157 | 166 |
| Case 9 | 213 | 214 | 166 | 231 |
| Case 10 | 182 | 182 | 162 | 186 |
| Case 11 | 175 | 173 | 170 | 170 |
| Case 12 | 171 | 166 | 172 | 172 |
| Case 13 | 170 | 169 | 175 | 170 |
| Case 14 | 163 | 168 | 167 | 165 |
| Case 17 | 242 | 192 | 170 | 173 |
| Case 18 | 170 | 165 | 167 | 163 |
| Case 19 | 170 | 166 | 168 | 166 |
| Case 20 | 168 | 163 | 170 | 165 |
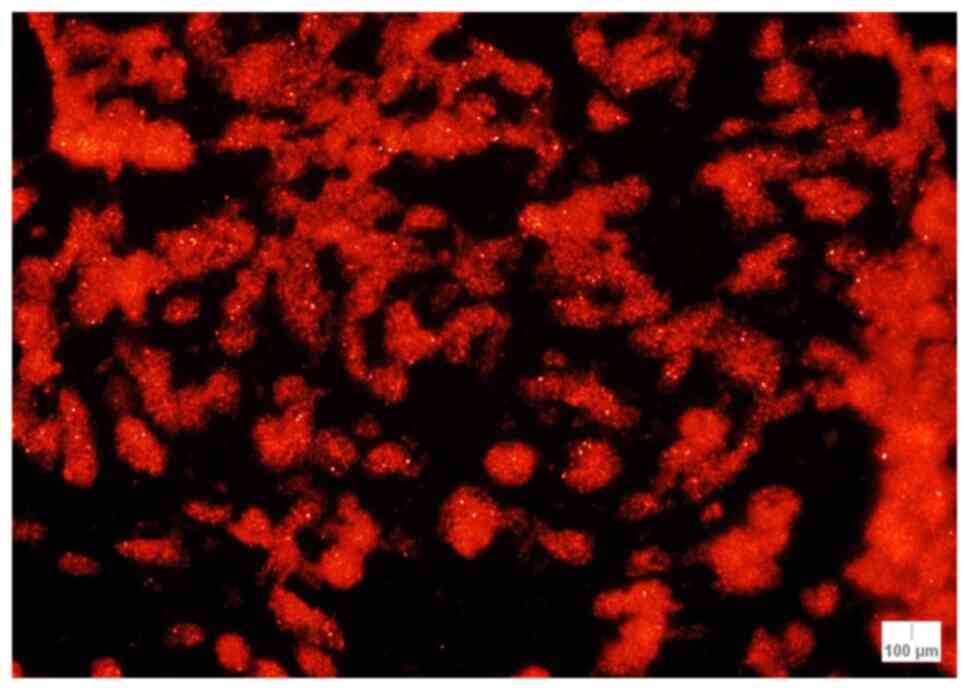
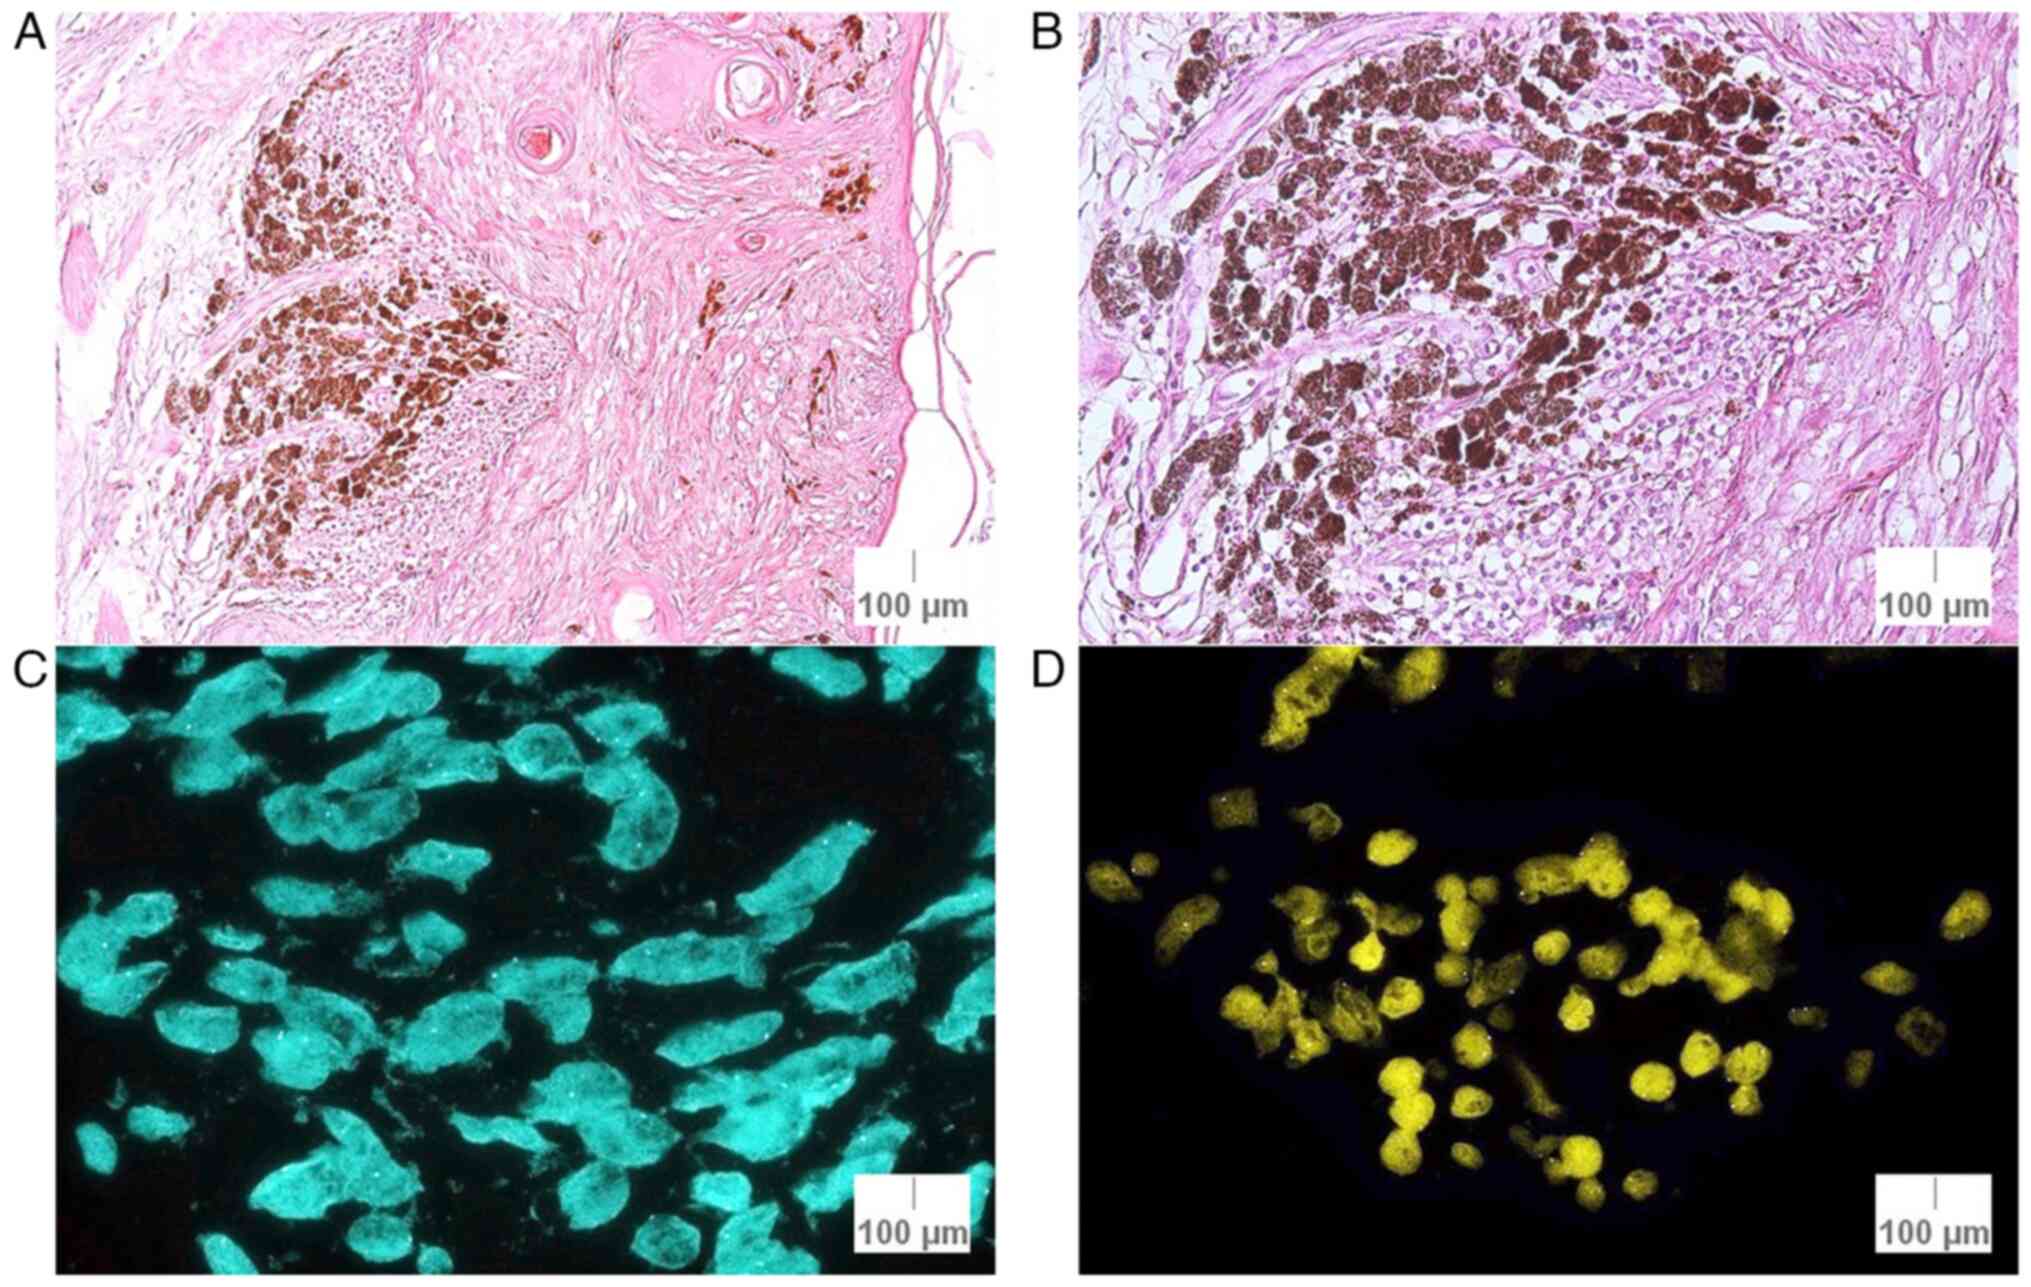
The number of abnormal nuclei for RREB1 (with <2
or >2 signals per nuclei) was counted and the percentage was
next calculated. The lowest number of abnormal nuclei for RREB1 was
found in case 12 (mixed atypical nevus; 9 abnormal nuclei) and the
highest number was encountered in case 17 (melanoma; 45 abnormal
nuclei out of 90; Fig. 1).
Concerning the percentage of abnormal nuclei for RREB1, the highest
percentages were as follows: 50.0% (Case 17; melanoma), 42.2% (case
3; melanoma) and 31.1% (case 2; lentigo maligna melanoma) (Table III).
| Table IIIPercentage of abnormal nuclei for
RREB1. |
Table III
Percentage of abnormal nuclei for
RREB1.
| Case no. | Number of abnormal
nuclei for RREB1 signals | Percentage of
abnormal nuclei for RREB1 |
|---|
| Case 1 | 17 | 18.8 |
| Case 2 | 28 | 31.1 |
| Case 3 | 38 | 42.2 |
| Case 4 | 25 | 27.7 |
| Case 5 | 17 | 18.8 |
| Case 6 | 12 | 13.3 |
| Case 7 | 13 | 14.4 |
| Case 8 | 21 | 23.3 |
| Case 9 | 24 | 26.7 |
| Case 10 | 12 | 13.3 |
| Case 11 | 12 | 13.3 |
| Case 12 | 9 | 10.0 |
| Case 13 | 10 | 11.1 |
| Case 14 | 14 | 15.5 |
| Case 17 | 45 | 50.0 |
| Case 18 | 12 | 13.3 |
| Case 19 | 14 | 15.5 |
| Case 20 | 12 | 13.3 |
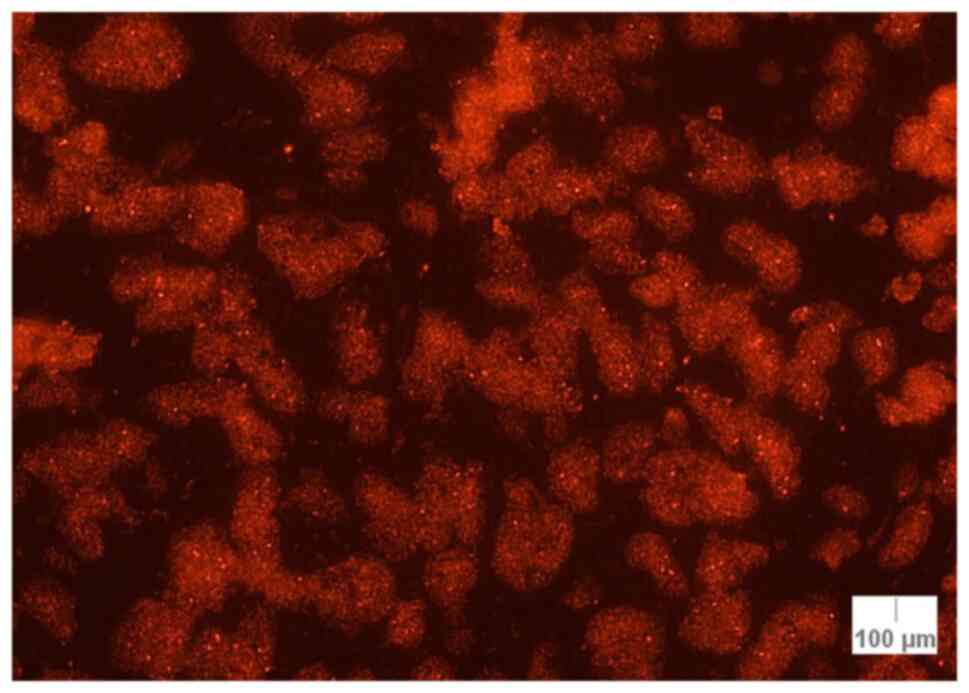
MYB (6q23) and CEP6. The lowest number of
counts (49 signals) was found in case 6 (atypical lentiginous
junctional nevus) and the highest number of signals (76 signals)
was found in case 9 (lentiginous melanocytic proliferation)
(Table I). The sum of MYB signals
was also calculated and the lowest sum (156 signals) was found in
case 6, while 2 cases had ≥200 signals: Case 3 (melanoma; 200
signals) and case 9 (melanocytic proliferation; 214 signals)
(Table II). There was a mean of
176.55 signals/case for MYB (median, 169.00 signals/case; IQR,
24.75 signals/case).
The sum of MYB signals for each case was counted.
The lowest number of signals was found in case 6 (junctional
atypical nevus; 156 signals) and the highest number of signals was
observed in cases 9 (lentiginous melanocytic proliferation; 214
signals) and 3 (melanoma; 200 signals). As for the median values of
MYB signals, there were 6 cases with a median of >2 signals per
nuclei: Case 1 (nodular melanoma; 2.11 signals/nuclei), case 2
(lentigo maligna melanoma; 2.16 signals/nuclei), case 3 (melanoma;
2.22 signals/nuclei), case 9 (lentiginous melanocytic
proliferation; 2.37 signals/nuclei), case 10 (mixed atypical nevus;
2.02 signals/nuclei), and case 17 (melanoma; 2.13 signals/nuclei;
Fig. 2) (Table IV).
| Table IVSum and median of MYB and CCND1
signals. |
Table IV
Sum and median of MYB and CCND1
signals.
| Case no. | Sum of MYB
signals | Median of MYB
signals | Sum of CCND1
signals | Median of CCND1
signals |
|---|
| Case 1 | 190 | 2.11 | 197 | 2.18 |
| Case 2 | 195 | 2.16 | 212 | 2.35 |
| Case 3 | 200 | 2.22 | 228 | 2.53 |
| Case 4 | 169 | 1.87 | 165 | 1.88 |
| Case 5 | 178 | 1.97 | 176 | 1.95 |
| Case 6 | 156 | 1.73 | 167 | 1.85 |
| Case 7 | 163 | 1.81 | 156 | 1.73 |
| Case 8 | 169 | 1.87 | 166 | 1.84 |
| Case 9 | 214 | 2.37 | 231 | 2.56 |
| Case 10 | 182 | 2.02 | 186 | 2.06 |
| Case 11 | 173 | 1.92 | 170 | 1.88 |
| Case 12 | 166 | 1.84 | 172 | 1.91 |
| Case 13 | 169 | 1.87 | 170 | 1.88 |
| Case 14 | 168 | 1.86 | 165 | 1.83 |
| Case 17 | 192 | 2.13 | 173 | 1.92 |
| Case 18 | 165 | 1.83 | 163 | 1.81 |
| Case 19 | 166 | 1.84 | 166 | 1.84 |
| Case 20 | 163 | 1.81 | 165 | 1.83 |
Next, the number of CEP6 signals in each of 30 out
of 90 nuclei was counted. The lowest number of counts (50 signals)
was found in cases 8 (spitz nevus) and 10 (atypical compound
nevus). The highest number of counts (64 signals) was observed in
case 3 (melanoma) (Table I). The
sum of signals per case was counted; the lowest number (157
signals) was found in case 8 (spitz nevus) and the highest number
of signals (189 signals) was observed in case 3 (melanoma). A mean
value of 169.27 signals/case for CEP6 was calculated (median,
169.00 signals/case; IQR, 6.5 signals/case).
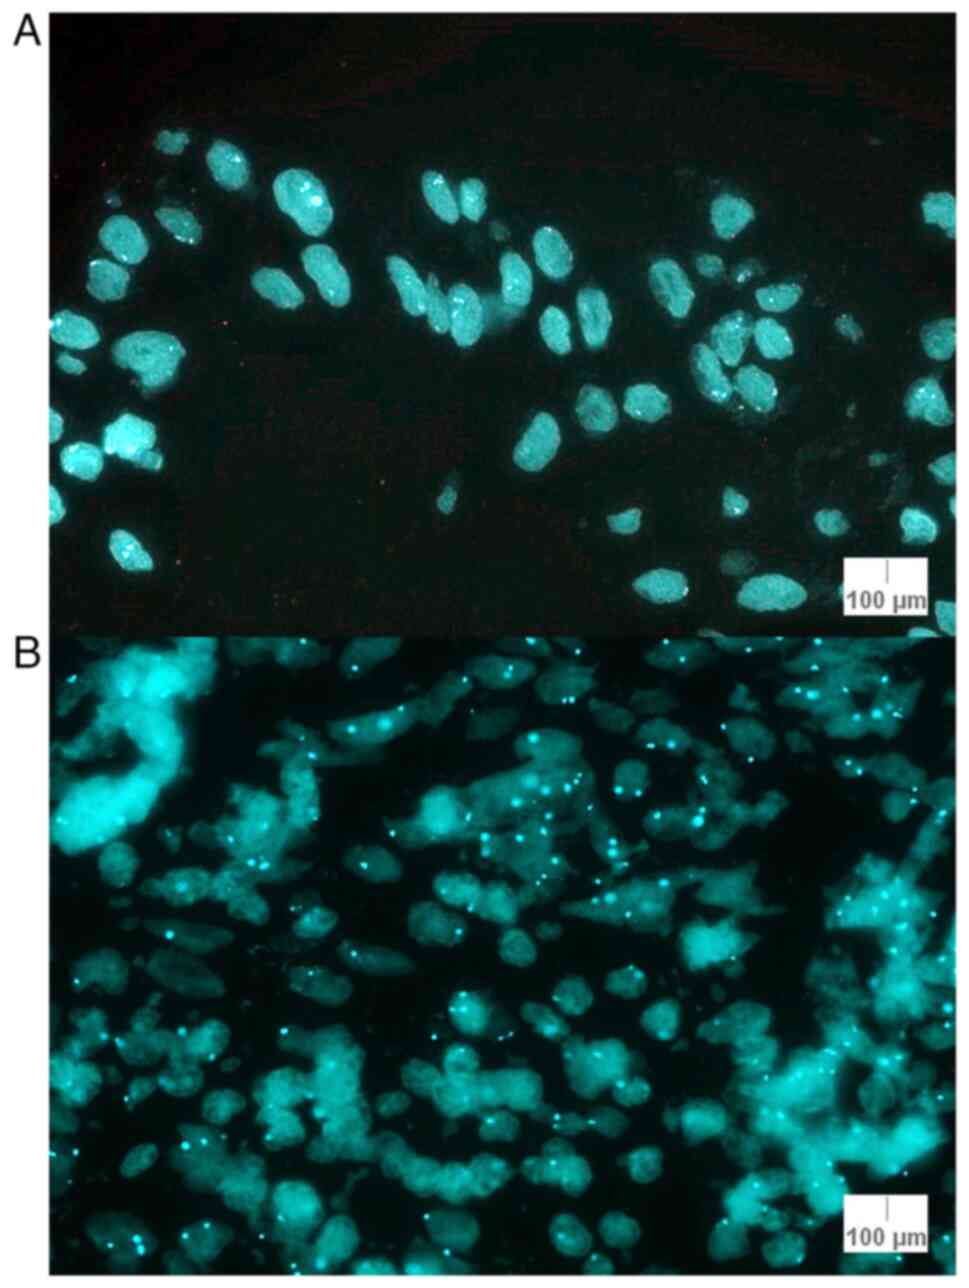
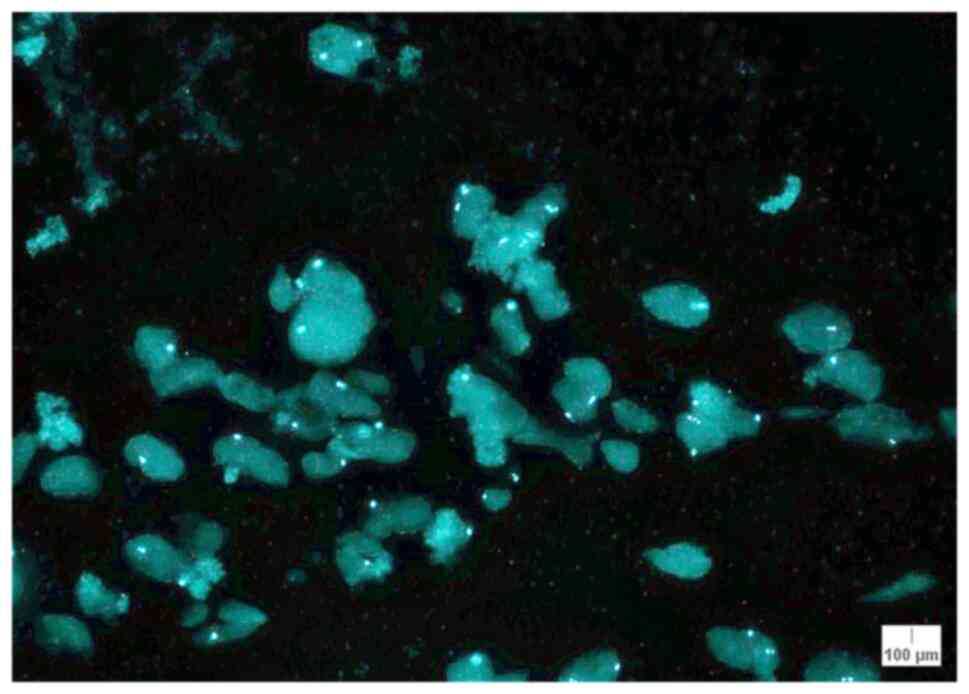
The number of nuclei where the number of signals for
MYB was less than the number of signals for CEP6 was counted. This
was done to highlight the number of nuclei where there was a loss
for MYB relative to CEP6. The lowest number of nuclei with a loss
for MYB relative to CEP6 was 6: Cases 9 (lentiginous melanocytic
proliferation) and 17 (melanoma). The highest number of nuclei with
the aforementioned characteristics was 24 (case 7; junctional
atypical nevus). The percentage loss of MYB relative to CEP6 was
calculated, and the highest percentage was 26.66% for case 7
(Table V). The staining pattern
for CEP6 is illustrated in Fig. 3
for cases 11 and 17.
| Table VNumber and percentage of nuclei that
show a loss for MYB relative to CEP6. |
Table V
Number and percentage of nuclei that
show a loss for MYB relative to CEP6.
| Case no. | Number of nuclei
that show a loss for MYB relative to CEP6 | Percent loss of MYB
relative to CEP6 |
|---|
| Case 1 | 7 | 7.77 |
| Case 2 | 8 | 8.88 |
| Case 3 | 14 | 15.55 |
| Case 4 | 16 | 17.77 |
| Case 5 | 16 | 17.77 |
| Case 6 | 18 | 20.00 |
| Case 7 | 24 | 26.66 |
| Case 8 | 15 | 16.66 |
| Case 9 | 6 | 6.66 |
| Case 10 | 9 | 10.00 |
| Case 11 | 10 | 11.11 |
| Case 12 | 11 | 12.22 |
| Case 13 | 10 | 11.11 |
| Case 14 | 13 | 14.44 |
| Case 17 | 6 | 6.66 |
| Case 18 | 13 | 14.44 |
| Case 19 | 15 | 16.66 |
| Case 20 | 16 | 17.77 |
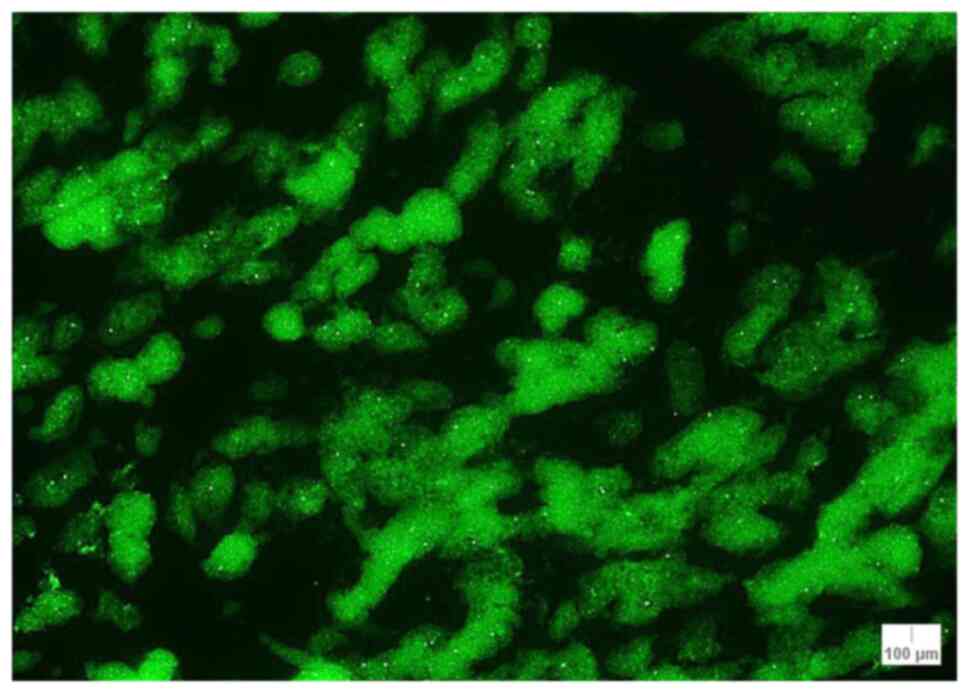
CCND1 (11q13). For CCND1, the lowest number
of counts (49 signals) was found in case 7 (atypical junctional
nevus) and the highest number of counts (89 signals) was observed
in case 9 (lentiginous melanocytic proliferation) (Table I). The sum of the CCND1 signals was
calculated. The lowest sum of signals (156 signals) was found in
case 7, while 3 cases had >200 signals: Case 2 (lentigo maligna
melanoma; 212 signals), case 3 (melanoma; 228 signals) and case 9
(melanocytic proliferation; 231 signals) (Table II). There was a mean of 179.33
signals/case for CCND1 (median, 170.00 signals/case; IQR, 23.75
signals/case) (Table IV).
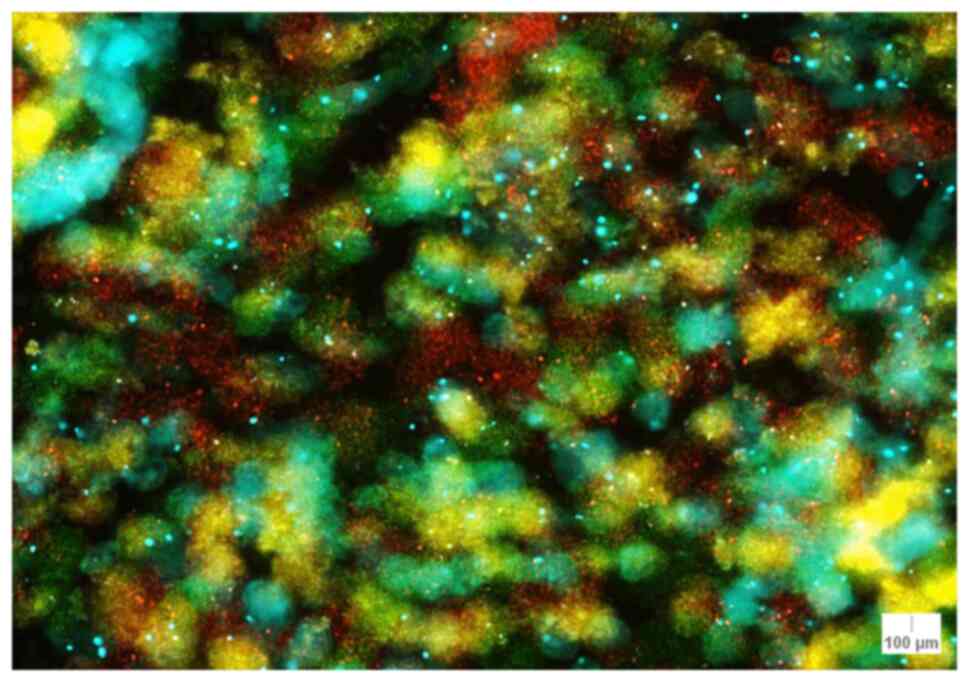
The median of CCND1 signals/nuclei was also
calculated, and a median of >2 signals/nuclei was obtained for 5
cases: Case 1 (nodular melanoma; 2.18 signals/nuclei), case 2
(lentigo maligna melanoma; 2.35 signals/nuclei), case 3 (melanoma;
2.53 signals/nuclei), case 9 (lentiginous melanocytic
proliferation; 2.56 signals/nuclei) and case 10 (atypical compound
nevus; 2.06 signals/nuclei) (Table
IV). The lowest median value was encountered in case 7 with
1.73 signals/nuclei. The staining pattern for CCND1 is illustrated
in Fig. 4 for case 17.
FISH+/- diagnosis of the melanocytic
lesions
Only one FISH+ result out of the 5
histopathologically confirmed melanoma cases was obtained, as well
as a FISH+ result for a lentiginous melanocytic proliferation
specimen (histopathologically confirmed benign lesion). The FISH+
specimens were cases 3 (melanoma) and 9 (lentiginous melanocytic
proliferation), with an average of CCND1 signals of >2.5
signals/nuclei (2.53 signals for case 3 and 2.56 signals for case
9). The remaining of the analyzed melanomas and atypical nevi were
diagnosed as FISH-, although certain results approached a FISH+
diagnosis: Case 1 (nodular melanoma), with a median of 2.18
signals/nuclei for CCND1 and 2.11 signals/nuclei for MYB; case 2
(lentigo maligna melanoma), with a median of 2.35 signals/nuclei
for CCND1 and 2.16 signals/nuclei; and case 17 (melanoma), with a
median of 2.13 signals/nuclei for MYB and 50.00% of abnormal nuclei
for RREB1 (Fig. 5). Additionally,
two atypical nevi cases also approached a FISH+ result: Case 6,
with 20.00% loss of MYB relative to CEP6; and case 7, with 26.66%
loss of MYB relative to CEP6. Case 10, with a median of 2.06
signals/nuclei for CCND1 and a median of 2.02 signals/nuclei for
MYB, as well as case 20 (lentigo maligna melanoma) did not approach
a FISH+ result (Table VI).
| Table VICriteria for FISH+/- diagnosis. |
Table VI
Criteria for FISH+/- diagnosis.
| Case no. | Average CCND1
signals per nuclei ≥2.5 | Average MYB signals
per nuclei ≥2.5 | Percent loss of MYB
relative to CEP6 ≥31% | Percentage of
abnormal nuclei for RREB1 ≥63% | FISH+/-result |
|---|
| Case 1 | 2.18 | 2.11 | 7.77 | 18.8 | FISH- |
| Case 2 | 2.35 | 2.16 | 8.88 | 31.1 | FISH- |
| Case 3 | 2.53 | 2.22 | 15.55 | 42.2 | FISH+ |
| Case 4 | 1.88 | 1.87 | 17.77 | 27.7 | FISH- |
| Case 5 | 1.95 | 1.97 | 17.77 | 18.8 | FISH- |
| Case 6 | 1.85 | 1.73 | 20.00 | 13.3 | FISH- |
| Case 7 | 1.73 | 1.81 | 26.66 | 14.4 | FISH- |
| Case 8 | 1.84 | 1.87 | 16.66 | 23.3 | FISH- |
| Case 9 | 2.56 | 2.37 | 6.66 | 26.7 | FISH+ |
| Case 10 | 2.06 | 2.02 | 10.00 | 13.3 | FISH- |
| Case 11 | 1.88 | 1.92 | 11.11 | 13.3 | FISH- |
| Case 12 | 1.91 | 1.84 | 12.22 | 10.0 | FISH- |
| Case 13 | 1.88 | 1.87 | 11.11 | 11.1 | FISH- |
| Case 14 | 1.83 | 1.86 | 14.44 | 15.5 | FISH- |
| Case 17 | 1.92 | 2.13 | 6.66 | 50.0 | FISH- |
| Case 18 | 1.81 | 1.83 | 14.44 | 13.3 | FISH- |
| Case 19 | 1.84 | 1.84 | 16.66 | 15.5 | FISH- |
| Case 20 | 1.83 | 1.81 | 17.77 | 13.3 | FISH- |
The statistical analysis revealed a significant
result (likelihood ratio; P=0.002) for criterion 10.a of the
manufacturer's instructions for the Vysis Melanoma FISH Probe kit
(catalogue number, 30-608220/R6) average CCND1 signals per nuclei
or average MYB signals per nuclei ≥2.5), indicating that there was
a significant association between the diagnosis of melanoma and the
value of criterion 10.a. For the other two criteria (10.b and 10.c)
the following results were obtained: For criterion 10.b (percent
loss of MYB relative to CEP6 ≥31%) P=0.542 and for criterion 10.c
(percentage of abnormal nuclei for RREB1 ≥63%) P=0.223, indicating
that there was no association between these two criteria and
melanoma.
FISH and histopathological
associations
Next, histopathological associations with FISH for
the cases that had inconclusive FISH results were performed, to
examine whether further histopathological clues could be deciphered
from the FISH results (Table
VII). Of the 5 studied melanoma cases, 4 cases had a FISH-
result, although some of the criteria analyzed to establish a FISH
diagnosis approached a FISH+ result. These 4 cases are described
below.
| Table VIIAssociations of FISH with
histopathology. |
Table VII
Associations of FISH with
histopathology.
| Case no. | Histopathological
diagnosis | FISH+/- | T-stage | G-grade | Cell
infiltrate | Emboli | Mitoses | Pigment |
|---|
| Case 1 | Nodular
melanoma | FISH- | T2 | G1 | None | None | None | Melanophages
present |
| Case 2 | Lentigo maligna
melanoma | FISH- | T1 | G2 | Score +2
(asymmetrical inflammatory infiltrate) | None | None | Present |
| Case 6 | Junctional atypical
nevus | FISH- | T2 | G1 | None | None | None | Present |
| Case 7 | Junctional atypical
nevus | FISH- | T1 | G1 | None | None | None | None |
| Case 9 | Lentiginous
melanocytic proliferation | FISH+ | T2 | G1 | Score 1 (numerous
melanophages, inflammatory infiltrate) | None | None | None |
| Case 10 | Mixed atypical
nevus | FISH- | T2 | G1 | Score 1
(melanophages present, inflammatory infiltrate) | None | None | None |
| Case 17 | Melanoma | FISH- | T3 | G2 | Score 3 | None | 1 mitosis
(rare) | Present |
| Case 20 | Lentigo maligna
melanoma | FISH- | T2 | G2 | Score +1 (low
infiltrate) | None | Present | None |
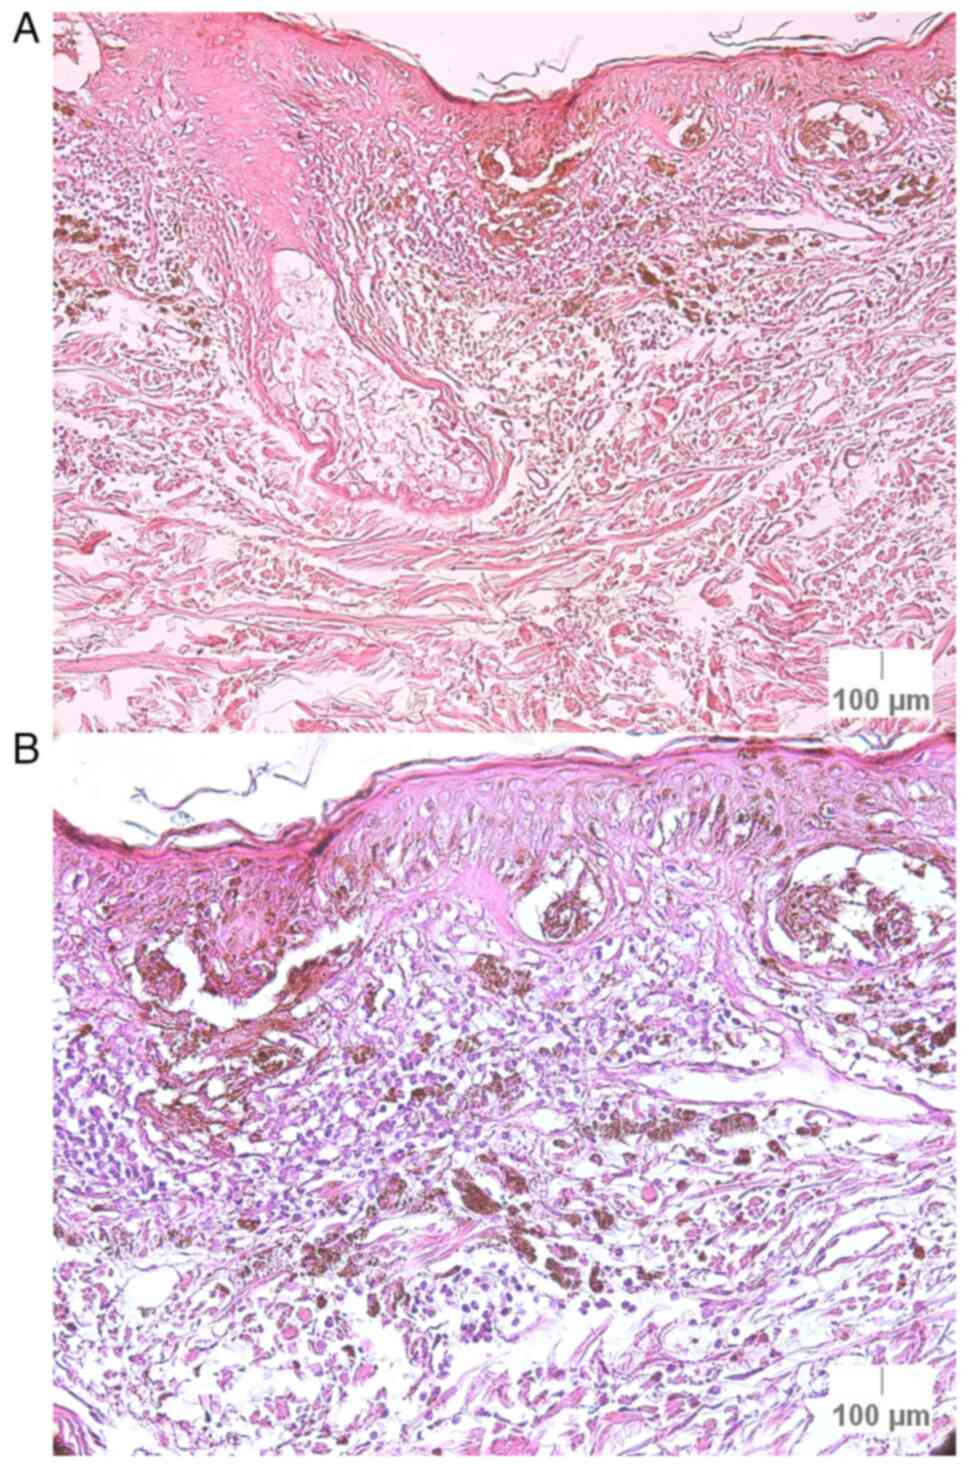
i) Case 2 (lentigo maligna melanoma): This specimen
had a FISH- result, although two criteria were close to a positive
result, a median of 2.35 signals/nuclei for CCND1 and a median of
2.16 signals/nuclei for MYB. In the initial histopathological
examination, it was a confirmed as lentigo maligna melanoma, Clark
I stage, Breslow index of 0.37 mm, G2 differentiation (moderate
differentiation) and a score of +2 for the cell infiltrate, with
asymmetrical inflammatory infiltrate, without emboli or mitoses,
but with the presence of pigment (Fig.
6).
ii) Case 9 (lentiginous melanocytic proliferation):
This specimen exhibited a FISH+ result, with an average of 2.56
signals/nuclei for CCND1 signals (threshold of >2.5
signals/nuclei). The histopathological examination indicated that
it was a benign tumor and was graded as follows: T1 tumoral
thickness, G1 differentiation (well-differentiated), a score of 1
for the cell infiltrate, with several melanophages and inflammatory
infiltrates, and without emboli, mitoses or pigment (Fig. 7). Initially, this lesion was
diagnosed as a malignant tumor through dermoscopy (superficial
spreading melanoma localized on the right shoulder of an
84-year-old female patient), but it was later shown to be a benign
lesion as confirmed by the histopathological examination.
iii) Case 17 (melanoma): This case was a
histopathologically confirmed melanoma, but with a FISH- result.
Histopathological examination revealed the following grading: T3
tumoral thickness, G2 differentiation (moderate differentiation), a
score of 3 for the cell infiltrate, with rare mitoses (one), no
emboli and the presence of pigment. Although the FISH test was
negative, certain results approached a FISH+ diagnosis;
specifically, a median of 2.13 signals/nuclei for MYB and 50.00% of
abnormal nuclei for RREB1 (Fig.
8).
iv) Case 20 (lentigo maligna melanoma): This lesion
did not exhibit any FISH+ results and it obtained a FISH-
diagnosis. However, it was a histopathologically confirmed lentigo
maligna melanoma with T2 tumoral thickness, G2 differentiation
(moderate differentiation), a score of +1 for the cell infiltrate,
without emboli, present mitoses and no pigment (Fig. 9).
Discussion
Melanoma is one of the most aggressive neoplasms,
and patients often present with numerous chromosomal aberrations.
Advances in medical technology are important for improving patient
outcomes, as earlier diagnosis of melanoma can improve the
prognosis of patients and long-term survival (2).
In the presnet study, the value of FISH in melanoma
diagnosis was assessed, and used in accordance with the
manufacturer's protocol of the kit employed. First, the number of
signals for RREB1, MYB, CCND1 and CEP6 in each of 30 nuclei were
counted. The highest number of signals were found in the
histopathologically confirmed cases of melanoma. Then, the median
of the sum of signals for each of the four probes was calculated
for each case, with the highest median value of signals observed
for RREB1 (183.55 signals/case). Similar to the present study, a
previous study found that the aforementioned loci were
predominantly observed in melanomas (87% of the cases), and rarely
in congenital nevi (5%) or dysplastic nevi (5%) (14).
Next, the number and percentage of abnormal RREB1
nuclei were counted. For the diagnosis of melanoma, according to
the manufacturer of the kit used, the percentage of RREB1 abnormal
nuclei should be ≥63%. In the present study, the highest percentage
of abnormal nuclei encountered in melanoma cases were 50.0% for
case 17 (melanoma), 42.2% for case 3 (melanoma) and 31.1% for case
2 (lentigo maligna melanoma), thus not meeting the diagnostic
criteria. There were no FISH+ results for RREB1 (6p25), although in
the literature it is stated that RREB1 plays an important role in
the tumorigenesis of melanoma, potentially serving as a crucial
driver-gene in the development of melanoma by inhibiting tumor
suppressors, and is one of the most sensitive criteria encountered
in the melanocytic lesions analyzed using FISH (14,15).
The statistical analysis did not show an association between the
percentage of abnormal RREB1 nuclei and melanoma.
Concerning the sum and median of MYB and CCND1
signals, the highest sum of signals was found in melanomas, except
for case 9 which had 214 signals (and a median of 2.37
signals/nuclei) for MYB and 231 signals (and a median of 2.56
signals/nuclei) for CCND1. The lowest number of signals was found
in two junctional atypical nevi cases (cases 6 and 7), with 156
signals for both MYB and CCND1. For a positive melanoma diagnosis,
there must be a median of ≥2.5 CCND1 or MYB signals per nuclei, a
result which was only obtained for CCND1 in cases 3 (melanoma; 2.53
signals/nuclei) and 9 (lentiginous melanocytic lesion; 2.56
signals/nuclei). In the present study, there was a significant
association between this criterion and melanoma. In contrast to the
results of the present study where only FISH+ cases exhibited
alterations in CCND1 (11q23), in a previous study, the majority of
cases tested positive due to an anomaly in chromosome 6, while the
probe for CCND1 did not play an important role (16).
There were no positive results for the percentage
loss of MYB relative to CEP6 (≥31%); however, in 1 case the result
was close to being FISH+ (26.66% in case 7; junctional atypical
nevus). Newmann et al (16)
also observed a small number of cases with positive FISH tests for
MYB/CEP6, with only 4 out of 36 cases that met the criteria for the
loss of MYB relative to CEP6. Furthermore, according to Horst et
al (17), there were no cases
with histopathological features typical of Spitz nevi with
chromosomal abnormalities detected by FISH, similar to the present
study.
Concerning the FISH+/- results, after analysis of
the melanocytic lesions, one benign lesion out of all the studied
nevi had a positive FISH diagnosis. A previous study found that
chromosomal abnormalities were noted in 2 out of 32 cases of benign
nevi, while 29 of 31 melanoma cases exhibited changes (2). In the present study, only 1 of the 5
melanoma cases had a positive FISH test, but all cases exhibited
notable chromosomal changes with results close to a FISH+
diagnosis, except for 1 case (case 20; lentigo maligna melanoma).
The melanoma case with a positive FISH test was due to an average
of >2.5 signals/nuclei for CCND1, indicating that there were
certain chromosomal anomalies found in the 11q23 region. For case
3, the result was also close to being FISH+ (2.22 signals/nuclei
for MYB and 42.2% of abnormal nuclei for RREB1), indicating that
there may have been anomalies in chromosome 6 (6p25 for RREB1 and
6q23 for MYB). Gerami et al (18) suggested that clonal abnormalities
in chromosome 6 (short arm relative to the long arm) were common in
all melanoma subtypes. For other histopathologically confirmed
cases of melanoma, FISH- results were obtained, which were thus
considered false-negative results. According to previous
literature, there is a high number of FISH false-negative results;
for example, Nijhawan et al (19), citing Kerl et al (20), found a false-negative rate of 30.7%
using the criteria followed in the present study. In the present
study, the false-negative rate was 80.0% (4 out of 5 melanomas had
a FISH- result), whereas the false-positive percentage for FISH+
tests was 7.7% (1 out of 13 benign cases). Gerami et al
(21) found that FISH correctly
classified melanoma with 86.7% sensitivity and 95.4% specificity,
and correctly identified all melanoma lesions (6 out of 6 cases).
However, in a study by Fang et al (22), a rare nevus was incorrectly
diagnosed as FISH+ (false-positive result), while 9 cases of
melanoma incorrectly exhibited FISH- results, out of which 6
metastasized. Other studies have observed only modest sensitivity
for FISH as a diagnostic tool. For example, 60% sensitivity was
observed by Gaisier et al (23) and 50% by Tetzlaff et al
(24).
Considering the high number of false-negative
results in the present study, the FISH technique may be considered
to be an unreliable tool. However, FISH is a valuable technique,
known for several clinical applications, such as the screening or
confirmation of melanoma diagnosis, where FISH provides information
concerning the duplication/amplification, deletion or translocation
of chromosomes in the studied tumors and can be used for diagnosis,
prognosis and for predicting the response to therapy. Additionally,
in relation to establishing a melanoma diagnosis or distinguishing
between common/atypical nevi and melanoma, FISH can also be used
for diagnosing rare types of melanoma (conjunctival melanoma in
children) (25) and
differentiating mitotically active nevi from nevoid melanoma
(19). In nevi-associated
melanoma, FISH can help to estimate tumoral thickness and
delimitate the transition from nevi to melanoma (13). FISH can also distinguish cellular
blue nevi from blue nevus-like melanomas and may confirm a
diagnosis of metastatic uveal melanoma (19). Furthermore, FISH may also
differentiate nodal nevi from metastatic melanoma (19), amongst other types of melanoma
(26). Moreover, FISH can be used
in other types of cancer, such as breast (HER2+) cancer, lung
cancer, bladder cancer, acute myeloid leukemia or acute lymphocytic
leukemia (19,26).
Out of all the benign lesions in the present study,
one of them (5.6% of all lesions; case 9; lentiginous melanocytic
proliferation) had a positive FISH result concerning the CCND1
(green) signals with >2.5 signals/nuclei (2.56 signals/nuclei).
This suggests that in this lesion, there may have been a
chromosomal abnormality in the 11q23 region. According to a
previous study, an increase in copy number of 11q13 is most
frequently seen in chronically sun-damaged melanomas, which could
have been the case for the patient in the present study as well
(case 9), since the lesion was in a sun-exposed area (18). This lesion was initially diagnosed
through dermoscopy as a superficial spreading melanoma, located on
the right shoulder area of an 84-year-old female patient. This
diagnosis was later dismissed by the histopathological examination
that confirmed it to be a benign lesion [lentiginous melanocytic
proliferation, without emboli, mitoses or pigment,
well-differentiated tumor (G1) with a small quantity of cell
infiltrate]. According to the positive FISH test, this could have
been diagnosed as a malignant tumor, as it had at least one
criterion necessary to establish a melanoma diagnosis. Similar
results were also encountered in a study by Fang et al
(22), where there was 1 patient
who had a benign lesion with a FISH+ result. Lai et al
(7) also had similar cases with
positive FISH results in 3 atypical nevi (6.0% of the studied
lesions). Another study has shown that there is often a recurring
theme in reporting an initial diagnosis of benign nevi that later
prove to be malignant melanomas (9), which could also be the case in the
present study. Zulauf et al (27) reported that they had an initial
case of a benign nevus, which later was shown to be a nevoid
melanoma, similar to the FISH+ case in the present study. It has
been reported that if there is a FISH+ result in a melanocytic
lesion, it should be monitored closely, as it is widely agreed that
FISH+ lesions have a notably higher risk of progression to melanoma
(14).
The most sensitive criterion in all the analyzed
cases was the one regarding MYB (6q23), with 6 out of 18 cases
(33.3%) having results either positive (2 cases) or close to being
positive (4 cases). This was followed by the CCND1 (11q13)
criterion with changes in 5 out of 18 cases (27.8%), with 2
positive cases. The least sensitive criterion was the loss of MYB
relative to CEP6 which was not encountered in any cases in the
present study. In a study by Abasolo et al (28), the most sensitive criterion was
RREB1, observed in all cases (100%), followed by the CEP6-related
MYB loss (48.1%), CCND1 gain (37%) and MYB gain (22.2%). A similar
results was obtained by Gerami et al (18), who found that the gain of 6p25 had
the highest sensitivity overall. In the present study, changes
regarding the RREB1 criterion were found in only 2 out of 18 cases
(11.1%), which were close to positive results. Another study by
Hossain et al (29) showed
that the gain in chromosome 11 was the most commonly
encountered.
Certain FISH-histopathological associations were
observed for the cases that had inconclusive results in the FISH
analysis. It has been reported that FISH can distinguish
mitotically active nevi from nevoid melanoma (19). In the present study, none of the
nevi had mitoses, which may have helped in establishing the FISH
diagnosis. However, there were 2 melanoma cases with mitoses that
were diagnosed as FISH-. Tumoral thickness, emboli, the grading of
the tumors, the cell infiltrate and the presence of pigment were
also analyzed. None of the tumors had emboli present, although out
of the 5 melanoma cases, 1 had a positive FISH result for CCND1.
The presence of emboli in melanocytic lesions may suggest
lymphovascular invasion, which is hypothesized as the mechanism by
which melanoma cells can disseminate to regional lymph nodes or
other organs (30). In general,
the tumoral thickness is mostly used for malignant lesions
(melanomas), it was also used for benign lesions (atypical nevi) in
the present study to assess the depth of the tumors, and the
following results were obtained: 2 cases with a T1 grading (one of
them being a lentigo maligna melanoma), 5 cases with a T2 grading
(with only 2 of them being melanomas) and 1 case with a T3 grading
(this tumor also had mitoses and a higher score of cell
infiltrate). The tumoral thickness was analyzed for these lesions,
as it is strongly associated with survival (Breslow index)
(31). Regarding the grade of the
inconclusive studied specimens (with either false-negative or
false-positive FISH results), 5 cases were classed as G1
(well-differentiated; with 1 case being a nodular melanoma) and 3
cases as G2 (moderatety differentiated). The G2 grade tumors were
all melanomas, had a higher score of cell infiltrate, and exhibited
the presence of pigment. Grade differentiation is scored from a low
grade of 1, indicating a high level of cellular differentiation
(well-differentiated) to a high grade of 3 (poorly differentiated
or undifferentiated) (32).
Vergier et al (8) reported
that by combining the histopathological diagnosis with the FISH
results, the diagnosis can be optimized, with an increase in
specificity and sensitivity. The findings of the present study
support this hypothesis, as the histopathological-FISH associations
assisted in the understanding of the final diagnosis of the lesions
that had an inconclusive FISH result. Moreover, Vergier et
al (8) indicated that in
relation to the outcome, the sensitivity and specificity of FISH
were 43.0 and 80.0%, while compared with the histopathological
review, the sensitivity and specificity of FISH were 34.5 and
91.0%. This shows a low sensitivity (high false-negative rate),
similar to the high rate of false-negative results in the present
study.
As for the evolution of the cases, all the patients
had a good evolution and response to the specific treatment
followed, except for 1 patient (case 9) who died shortly after the
histopathological diagnosis, although this may have been due to old
age (84 years old). A previous study indicated that survival
analysis using the Kaplan-Meier method showed a trend for worse
prognosis in FISH+ patients, which could also be the case for the
aforementioned patient (19).
The present study has certain limitations. There
were only 18 (out of 20) cases studied due to some artifacts during
the pre/post-treatment phase of the study; however, the present
study is intended to be a preliminary step in exploring the
potential benefits of FISH in melanoma diagnosis or in
distinguishing between atypical nevi and melanoma. Another reason
why the number of cases was limited was that the Vysis Melanoma
FISH Probe Kit could only include 20 cases, and due to the high
cost of the materials needed to perform this test and the length of
time required to process the results (the FISH signals had to be
manually counted), the study was limited to using a single kit.
Therefore, based on the findings of the present study, FISH test
results should only be considered for experimental and scientific
reasons and not for therapeutic or management decisions. However,
although this was a small study, it highlighted the worth of FISH
for further larger studies in the future. The present study
demonstrated that FISH is a valuable tool; however, given the high
number of false-negative results, it should only be used along with
other more robust diagnostic techniques (such as histopathological
examination) or for scientific and screening purposes. Aims of
further studies should include the expansion of the number of cases
analyzed and the conduct of larger cohort studies. Future
directions include: i) Expanding the gene panel to investigate
additional chromosomal regions or genes beyond those already
assessed [for example, 7q34, CEP3, 3p26, 8q24 (MYC), 9q21 (CDKN2A)
and CEP9]; ii) evaluating how FISH-detected aberrations correlate
with the patient prognosis, metastatic risk or therapeutic
response; and iii) assessing the performance of FISH compared with
other molecular techniques, such as chromogenic in situ
hybridization and comparative genomic hybridization, in melanoma. A
larger study could improve the sensitivity and specificity of the
test, and explore its full potential role in clinical
decision-making.
The findings of the present study are supported by
Gaiser et al (23), where
FISH did not achieve clinically useful sensitivity and specificity
results. Another study also reported FISH- results in melanomas,
similar to the present study, and indicated that survival
probability could not be concluded based on the test used (33). The accuracy of FISH may be
increased when used in combination with multiple diagnostic
techniques (dermoscopy, histopathology and molecular tests) and may
help in improving early diagnosis (29).
The present study highlighted both the advantages
and challenges of using FISH in melanoma diagnosis. While a high
rate of false-negative results was observed, nearly all malignant
tumors exhibited findings close to a FISH+ diagnosis, except for 1
case. Similarly, all but one benign lesion were correctly
identified as FISH-, reinforcing the value of this technique.
However, challenges such as manual signal counting, the high cost
of reagents and potential errors due to equipment limitations
should be considered. We hypothesize that similar studies are
essential in presenting both the strengths and limitations of FISH
as a diagnostic tool.
In conclusion, FISH has numerous clinical
applications and provides information concerning the
duplication/amplification, deletion or translocation of
chromosomes, making it a useful tool in cancer diagnosis. FISH was
found to be a valuable tool aiding clinicians in establishing a
melanoma diagnosis, although it is recommended to be only used as a
complementary diagnostic technique to supplement standard methods
of examination. The present study focused on the chromosomal
anomalies encountered in melanocytic lesions and on the importance
of FISH in melanoma diagnosis. With the recent improvements in
probes, including enhanced sensitivity and chromosomal target
specificity, and clearer signal detection, FISH may play an
increasingly central role in prognosis and early cancer diagnosis;
however, future studies are required to understand the utility of
FISH in the management of melanocytic lesions.
Acknowledgements
Not applicable.
Funding
Funding: The authors acknowledge Victor Babeș University of
Medicine and Pharmacy Timișoara (Timișoara, Romania) for their
support in covering the costs of publication for this research
paper.
Availability of data and materials
The data generated in the present study may be
requested from the corresponding author.
Authors' contributions
CR(J)M was involved in conceptualization, data
curation, formal analysis, investigation, methodology, data
validation, data visualization, writing the original draft, project
administration, review and editing. ARC participated in
conceptualization, supervision, data validation, data
visualization, review and editing. NPG was involved in
conceptualization, data visualization, supervision, review and
editing. MRo participated in conceptualization, data curation,
providing resources, supervision, data validation, data
visualization, review and editing. MRa was involved in
conceptualization, formal analysis, investigation, methodology,
data validation, supervision, data visualization, review and
editing. CR(J)M and MRa confirm the authenticity of all the raw
data. All authors read and approved the final manuscript.
Ethics approval and consent to
participate
The present study was conducted in accordance with
The Declaration of Helsinki and was approved by the Ethics
Committees of the Victor Babeș University of Medicine and Pharmacy
(approval no. 28/23.09.2019 from 10.03.2022; Timișoara, Romania)
and the Emergency Hospital of Sibiu County (approval no.
6001/09.03.2022; Sibiu, Romania). Written informed consent was
obtained from the patients for the use of human tissue in
research.
Patient consent for publication
Written informed consent for publication of results
obtained using human tissues was obtained from the patients
involved in the present study.
Competing interests
The authors that they have no competing
interests.
References
|
1
|
Dalton SR, Gerami P, Kolaitis NA, Charzan
S, Werling R, LeBoit PE and Bastian BC: Use Of fluorescence in-situ
hybridization (Fish) to distinguish intranodal nevus from
metastatic melanoma. Am J Surg Pathol. 34:231–237. 2010.PubMed/NCBI View Article : Google Scholar
|
|
2
|
Dabas N, Byrnes DM, Rosa AM, Eller MS and
Grichnik JM: Diagnostic role of chromosomal instability in
melanoma. J Skin Cancer. 2012(914267)2012.PubMed/NCBI View Article : Google Scholar
|
|
3
|
Mihulecea CR and Rotaru M: Review: The key
factors to melanomagenesis. Life (Basel). 13(181)2023.PubMed/NCBI View Article : Google Scholar
|
|
4
|
Jitariu AA, Cimpean AM, Kundnani NR and
Raica M: Platelet-derived growth factors induced lymphangiogenesis:
Evidence, unanswered questions and upcoming challenges. Arch Med
Sci. 11:57–66. 2015.PubMed/NCBI View Article : Google Scholar
|
|
5
|
Bastian BC, Olshen AB, LeBoit PE and
Pinkel D: Classifying melanocytic tumors based on DNA copy number
changes. Am J Pathol. 163:1765–1770. 2003.PubMed/NCBI View Article : Google Scholar
|
|
6
|
Mihulecea CR, Frățilă S and Rotaru M:
Clinical-dermoscopic similarities between atypical nevi and early
stage melanoma. Exp Ther Med. 22(854)2021.PubMed/NCBI View Article : Google Scholar
|
|
7
|
Lai Y, Wu Y, Liu R, Lu A, Zhou L, Jia L,
Diao X and Li Z: Four-color fluorescence in-situ hybridization is
useful to assist to distinguish early stage acral and cutaneous
melanomas from dysplastic junctional or compound nevus. Diagn
Pathol. 15(51)2020.PubMed/NCBI View Article : Google Scholar
|
|
8
|
Vergier B, Prochazkova-Carlotti M, de la
Fouchardière A, Cerroni L, Massi D, De Giorgi V, Bailly C,
Wesselmann U, Karlseladze A, Avril MF, et al: Fluorescence in situ
hybridization, a diagnostic aid in ambiguous melanocytic tumors:
European study of 113 cases. Mod Pathol. 24:613–623.
2011.PubMed/NCBI View Article : Google Scholar
|
|
9
|
Ferrara G and De Vanna AC: Fluorescence in
situ hybridization for melanoma diagnosis: A review and a
reappraisal. Am J Dermatopathol. 38:253–269. 2016.PubMed/NCBI View Article : Google Scholar
|
|
10
|
Senetta R, Paglierani M and Massi D:
Fluorescence in-situ hybridization analysis for melanoma diagnosis.
Histopathology. 60:706–714. 2012.PubMed/NCBI View Article : Google Scholar
|
|
11
|
Keung EZ and Gershenwald JE: The eighth
edition American Joint Committee on Cancer (AJCC) melanoma staging
system: Implications for melanoma treatment and care. Expert Rev
Anticancer Ther. 18:775–784. 2018.PubMed/NCBI View Article : Google Scholar
|
|
12
|
Mihulecea CR, Iancu GM, Leventer M and
Rotaru M: The many roles of dermoscopy in melanoma detection. Life
(Basel). 13(477)2023.PubMed/NCBI View Article : Google Scholar
|
|
13
|
Miedema J and Andea AA: Through the
looking glass and what you find there: Making sense of comparative
genomic hybridization and fluorescence in situ hybridization for
melanoma diagnosis. Mod Pathol. 33:1318–1330. 2020.PubMed/NCBI View Article : Google Scholar
|
|
14
|
Moore MW and Gasparini R: FISH as an
effective diagnostic tool for the management of challenging
melanocytic lesions. Diagn Pathol. 6(76)2011.PubMed/NCBI View Article : Google Scholar
|
|
15
|
Deng YN, Xia Z, Zhang P, Ejaz S and Liang
S: Transcription factor RREB1: From target genes towards biological
functions. Int J Biol Sci. 16:1463–1473. 2020.PubMed/NCBI View Article : Google Scholar
|
|
16
|
Newman MD, Lertsburapa T, Mirzabeigi M,
Mafee M, Guitart J and Germai P: Fluorescence in situ hybridization
as a tool for microstaging in malignant melanoma. Mod Pathol.
22:989–995. 2009.PubMed/NCBI View Article : Google Scholar
|
|
17
|
Horst BA, Fang Y, Silvers DN and Busam KJ:
Chromosomal aberrations by 4-color fluorescence in situ
hybridization not detected in spitz nevi of older individuals. Arch
Dermatol. 148:1152–1156. 2012.PubMed/NCBI View Article : Google Scholar
|
|
18
|
Gerami P, Mafee M, Lurtsbarapa T, Guitart
J, Haghighat Z and Newman M: Sensitivity of fluorescence in situ
hybridization for melanoma diagnosis Using RREB1, MYB, Cep6, and
11q13 probes in melanoma subtypes. Arch Dermatol. 146:273–278.
2010.PubMed/NCBI View Article : Google Scholar
|
|
19
|
Nijhawan RI, Votava HJ and Mariwalla K:
Clinical application and limitations of the fluorescence in situ
hybridization (FISH) assay in the diagnosis and management of
melanocytic lesions: A report of 3 cases. Cutis. 90:189–195.
2012.PubMed/NCBI
|
|
20
|
Kerl K, Palmedo G, Wiesner T, Mentzel T,
Rütten A, Schärer L, Paredes B, Hantschke M and Kutzner H: A
proposal for improving multicolor FISH sensitivity in the diagnosis
of malignant melanoma using newly combined criteria. Am J
Dermatopathol. 34:580–585. 2012.PubMed/NCBI View Article : Google Scholar
|
|
21
|
Gerami P, Jewell SS, Morrison LE, Blondin
B, Schulz J, Ruffalo T, Matushek P IV, Legator M, Jacobson K,
Dalton SR, et al: Fluorescence in situ hybridization (FISH) as an
ancillary diagnostic tool in the diagnosis of melanoma. Am J Surg
Pathol. 33:1146–1156. 2009.PubMed/NCBI View Article : Google Scholar
|
|
22
|
Fang Y, Dusza S, Jhanwar S and Busam KJ:
Fluorescence in situ hybridization (FISH) analysis of melanocytic
nevi and melanomas: Sensitivity, specificity, and lack of
association with sentinel node status. Int J Surg Pathol.
20:434–440. 2012.PubMed/NCBI View Article : Google Scholar
|
|
23
|
Gaiser T, Kutzner H, Palmedo G, Siegelin
MD, Wiesner T, Bruckner T, Hartschuh W, Enk AH and Becker MR:
Classifying ambiguous melanocytic lesions with FISH and correlation
with clinical long-term follow up. Mod Pathol. 23:413–419.
2010.PubMed/NCBI View Article : Google Scholar
|
|
24
|
Tetzlaff MT, Wang WL, Milless TL, Curry
JL, Torres-Cabala CA, McLemore MS, Ivan D, Bassett RL and Prieto
VG: Ambiguous melanocytic tumors in a tertiary referral center: the
contribution of fluorescence in situ hybridization (FISH) to
conventional histopathologic and immunophenotypic analyses. Am J
Surg Pathol. 37:1783–1796. 2013.PubMed/NCBI View Article : Google Scholar
|
|
25
|
Moral RM, Monteagudo C, Muriel J, Moreno L
and Peiró AM: Fluorescent in situ hybridization (FISH): A useful
diagnostic tool for childhood conjunctival melanoma. European J
Ophthalmol. 32:NP13–NP19. 2022.PubMed/NCBI View Article : Google Scholar
|
|
26
|
Chrzanowska NM, Kowalewski J and
Lewandowska MA: Use of fluorescence in situ hybridization (FISH) in
diagnosis and tailored therapies in solid tumors. Molecules.
25(1864)2020.PubMed/NCBI View Article : Google Scholar
|
|
27
|
Zulauf EE, Connors JC, Hardy MA, Hild G
and Coyer MA: Use of fluorescence in situ hybridization for
diagnosis of rare nevoid melanoma: A case report. Foot & Ankle
Surgery: Techniques, Reports & Cases. 1(100013)2021.
|
|
28
|
Abásolo A, Vargas MT, Ríos-Martín JJ,
Trigo I, Arjona A and González-Cámpora R: Application of
fluorescence in situ hybridization as a diagnostic tool in
melanocytic lesions, using paraffin wax-embedded tissues and
imprint-cytology specimens. Clin Exp Dermatol. 37:838–843.
2012.PubMed/NCBI View Article : Google Scholar
|
|
29
|
Hossain D, Qian J, Adupe J, Drewnowska K
and Bostwick DG: Differentiation of melanoma and benign nevi by
fluorescence in-situ hybridization. Melanoma Res. 21:426–430.
2011.PubMed/NCBI View Article : Google Scholar
|
|
30
|
Moy A, Duncan L and Kraft S: Lymphatic
invasion and angiotropism in primary cutaneous melanoma. Lab
Invest. 97:118–129. 2017.PubMed/NCBI View Article : Google Scholar
|
|
31
|
Nardone B, Martini M, Busam K, Marghoob A,
West DP and Gerami P: Integrating clinical/dermatoscopic findings
and fluorescence in situ hybridization in diagnosing melanocytic
neoplasms with less than definitive histopathologic features. J Am
Acad Dermatol. 66:917–922. 2012.PubMed/NCBI View Article : Google Scholar
|
|
32
|
Carbone A: Cancer classification at the
crossroads. Cancers (Basel). 12(980)2020.PubMed/NCBI View Article : Google Scholar
|
|
33
|
de Klein A, Koopmans AE and Kilic E:
Multicolor FISH with improved sensitivity and specificity in the
diagnosis of malignant melanoma. Expert Rev Mol Diagn. 12:683–685.
2012.PubMed/NCBI View Article : Google Scholar
|