Introduction
The polygenic nature of hypertension has made it
difficult to isolate genes involved in the genesis of this disease.
Microarrays are a powerful tool for studying the genetics of
hypertension as they facilitate the measurement of the expression
of thousands of genes simultaneously. Since rodent models of human
essential hypertension are ideal for microarray research, animal
models of essential hypertension have been investigated using
microarrays (1,2).
In this study, we present a comparison of adrenal
gland gene expression in 2 strains of hypertensive rats:
spontaneously hypertensive rats (SHR) and a substrain derived from
SHR, stroke-prone SHR (SHRSP) (3–5).
SHR, the current paradigm for essential hypertension research, were
developed in a breeding program based solely on selection by
elevated blood pressure (BP) in Wistar rats (3). Normotensive descendants of
Wistar-Kyoto rats (WKY), from which SHR were derived, were used as
the controls (3,4). SHRSP were established from SHR by
selective inbreeding for stroke proneness (4).
Adrenal gland secretory products, both medullary and
cortical, are logical candidates for the study of hypertension
since they can directly influence cardiovascular, endocrine and
sympathetic nervous system functions (6,7).
To our knowledge, this study represents the first attempt to
compare the gene expression profiles of SHR and SHRSP in adrenal
glands employing WKY as the controls, as early as 3 weeks of age.
Since the first aim of this study was to identify candidate genes
causing the transcription of BP-regulating genes in SHR, and the
second aim was to identify genes involved in the genesis of stroke
in SHRSP, we compared the gene expression profiles in the rats at 3
and 6 weeks of age, a period in which the rats are considered to be
in a pre-hypertensive state, and isolated a total of 353 genes
showing more than a 4-fold increase or less than a 4-fold decrease
in expression.
After classifying all 353 genes according to their
expression profiles, candidate genes were selected as significantly
enriched genes using the Database for Annotation, Visualization and
Integrated Discovery (DAVID) web tools (8,9),
and their interactions were analyzed with Ingenuity Pathway
Analysis (IPA). Our analyses revealed that one of the SHR-specific
transcriptional regulators, cAMP responsive element modulator
(Crem), interacts, in the presence of Fos, with
several BP-regulating genes, and suggested that one of the
BP-regulating SHRSP-specific genes, angiotensinogen (Agt),
plays pivotal roles in symptoms associated with stroke. Since SHR
and SHRSP are frequently used as animal models in studies of
attention deficit hyperactivity disorder (ADHD), we examined the
correlation between SHR- and SHRSP-specific genes and the
characteristic symptoms of ADHD (10,11).
Materials and methods
Animals
Animals, such as SHR/Izm, SHRSP/Izm, and WKY/Izm,
were provided from the Disease Model Cooperative Research
Association, Kyoto, Japan. Three-week-old rats were purchased and
maintained for 2 days in our animal facility and were used as
3-week-old rats. Five-week-old rats were purchased and, after being
maintained for 1 week in our animal facility, were used as
6-week-old rats. All these rats were euthanized by decapitation
with a guillotine and, as soon as the rats were decapitated, the
adrenal glands were extracted, cut into approximately
5-mm3 cubes, and stored in RNAlater (Ambion, Houston,
TX, USA) at −80°C until RNA extraction. The animals were handled
with due care according to the guidelines established by the
Japanese Association for Laboratory Animal Science, which comply
with international rules and policies. All experiments involving
rats were approved by the Animal Care and Use Committee of Hyogo
College of Medicine on September 27, 2010.
RNA extraction
Total RNA of the entire adrenal glands was purified
using an miRNeasy kit (Qiagen, Hilden, Germany) according to the
manufacturer’s instructions. Eluted RNAs were quantified using a
NanoDrop ND-1000 version 3.5.2 spectrophotometer (Thermo
Scientific, Wilmington, DE, USA). RNA integrity was evaluated using
an RNA 6000 LabChip kit and Bioanalyzer (Agilent Technologies,
Inc., Santa Clara, CA, USA). Each RNA with RNA integrity numbers
>9.0 was used for microarray experiments.
Microarray design
Expression profiling was generated using 4×44K whole
rat genome oligo microarray version 3.0 G2519F (Agilent
Technologies, Inc.). Each microarray uses 42,878 probes to
interrogate 26,930 Entrez gene RNAs. Eighteen microarray analyses
as 1 color experiment were performed with WKY, SHR and SHRSP at 3
and 6 weeks of age as biological triplicates. Each gene expression
profile was compared between SHR and WKY and between SHRSP and SHR
at 3 and 6 weeks of age.
Microarray analysis
Total RNA (200 ng) was reverse transcribed into
double-stranded cDNA by AffinityScript multiple temperature reverse
transcriptase and amplified for 2 h at 40°C. The resulting cDNA was
subsequently used for in vitro transcription by
T7-polymerase and labeled with cyanine-3-labeled cytosine
triphosphate (Perkin-Elmer, Wellesley, MA, USA) for 2 h at 40°C
using a Low Input Quick-Amp Labeling Kit (Agilent Technologies,
Inc.) according to the manufacturer’s instructions. After labeling,
the rates of dye incorporation and quantification were measured
using a NanoDrop ND-1000 version 3.5.2 spectrophotometer (Thermo
Scientific) and were then fragmented for 30 min at 60°C in the
dark. The labeled 1,650 ng of each cRNA sample was then hybridized
on Agilent 4×44K whole rat genome arrays (Agilent Design #028282)
at 65°C for 17 h with rotation in the dark. Hybridization was
performed using a Gene Expression Hybridization kit (Agilent
Technologies, Inc.) following the manufacturer’s instructions.
After washing in GE washing buffer, the slides were scanned with an
Agilent Microarray Scanner (G2505C). Feature extraction software
(version 10.5.1.1) employing defaults for all parameters was used
to convert the images into gene expression data.
Microarray data analysis
Raw data were imported into Subio platform version
1.12 (Subio Inc., Aichi, Japan) for database management, quality
control and statistical analysis. Raw intensity data were
normalized to the 75th percentile intensity of probes above
background levels (gIsWellAbove=1). The normalized values were
compared between SHR and WKY, and between SHRSP and SHR. SHR- and
SHRSP-specific genes were defined to show signal ratios of a
>4.0-fold increase or <4.0-fold decrease. We set the default
cut-off value to P<0.01 in this study. Raw data have been
accepted in Gene Expression Omnibus (GEO), a public repository for
microarray data, aimed at storing Minimum Information About
Microarray Experiments (MIAME). Access to data concerning this
study can be found under GEO experiment accession number
GSE31457.
DAVID web tool analysis
An approach to annotation enrichment analysis was
performed using DAVID web tools (version 6.7, 2010) (8,9).
This web-based resource provides a set of functional annotation
tools for the statistical enrichment of genes categorized into Gene
Ontology (GO) terms. We used the GO FAT category, which filters out
very broad GO terms to identify statistically enriched functional
groups. Annotated gene and protein symbols are written in italics
and regular font, respectively.
Ingenuity pathway analysis (IPA)
IPA software (Ingenuity® Systems,
http://www.ingenuity.com) was used for microarray
analyses conducted to provide functionality for the interpretation
of the gene expression data. IPA software, based on GO, biological
processes, molecular function and genetic networks was used to map
the biological correlation of differentially expressed genes into
networks based on the published literature for each gene. The
biological function network identifies biological functions and
diseases that are most significant to the data set.
Results
Isolation and classification of SHR- and
SHRSP-specific genes
We compared gene expression profiles between SHR and
WKY and between SHRSP and SHR, at 3 and 6 weeks of age, and
isolated SHR- and SHRSP-specific genes using genome-wide microarray
technology. Since we expected that the expression of candidate
genes was regulated long before the increase in BP, i.e., during
the pre-hypertensive period, we examined the expression profiles of
each probe using RNA samples prepared from adrenal glands obtained
at 3 and 6 weeks of age, and isolated a total of 407 SHR- and
SHRSP-specific probes showing a >4-fold increase or <4-fold
decrease (Table I).
 | Table INumber and classification of SHR- and
SHRSP-specific probes compared between the 2 pairs of rat
strains. |
Table I
Number and classification of SHR- and
SHRSP-specific probes compared between the 2 pairs of rat
strains.
| SHR/WKY | SHRSP/SHR | |
|---|
|
|
| |
|---|
| Classification | G-1
3 weeks old | G-2
6 weeks old | G-3
3 weeks old | G-4
6 weeks old | All |
|---|
| All probes
isolated | 123 | 165 | 44 | 75 | 407 |
| Mapped probes | 108 | 151 | 43 | 73 | 375 |
| Unmapped
probes | 15 | 14 | 1 | 2 | 32 |
| Identified unique
genes | 101 | 143 | 42 | 67 | 353 |
| Upregulated | 64 | 73 | 19 | 26 | 182 |
| Downregulated | 37 | 70 | 23 | 41 | 171 |
| Enriched GO
terms | 1 | 8 | 4 | 2 | 15 |
| Enriched
genes | 12 | 42 | 17 | 9 | 80 |
We classified 407 probes into 4 groups, from G-1 to
G-4 (Table I). G-1 probes were
isolated at 3 weeks of age and contained 123 SHR-specific probes.
Their expression profiles were displayed as a heat map using Subio
platform software (Fig. 1). These
123 probes corresponded to 101 unique genes, 64 of them showed a
>4-fold increase and 37 showed <4-fold decrease (Table I). G-2 contained 143 SHR-specific
genes isolated at 6 weeks of age, G-3 contained 42 SHRSP-specific
genes isolated at 3 weeks of age, and G-4 contained 67
SHRSP-specific genes isolated at 6 weeks of age (Table I).
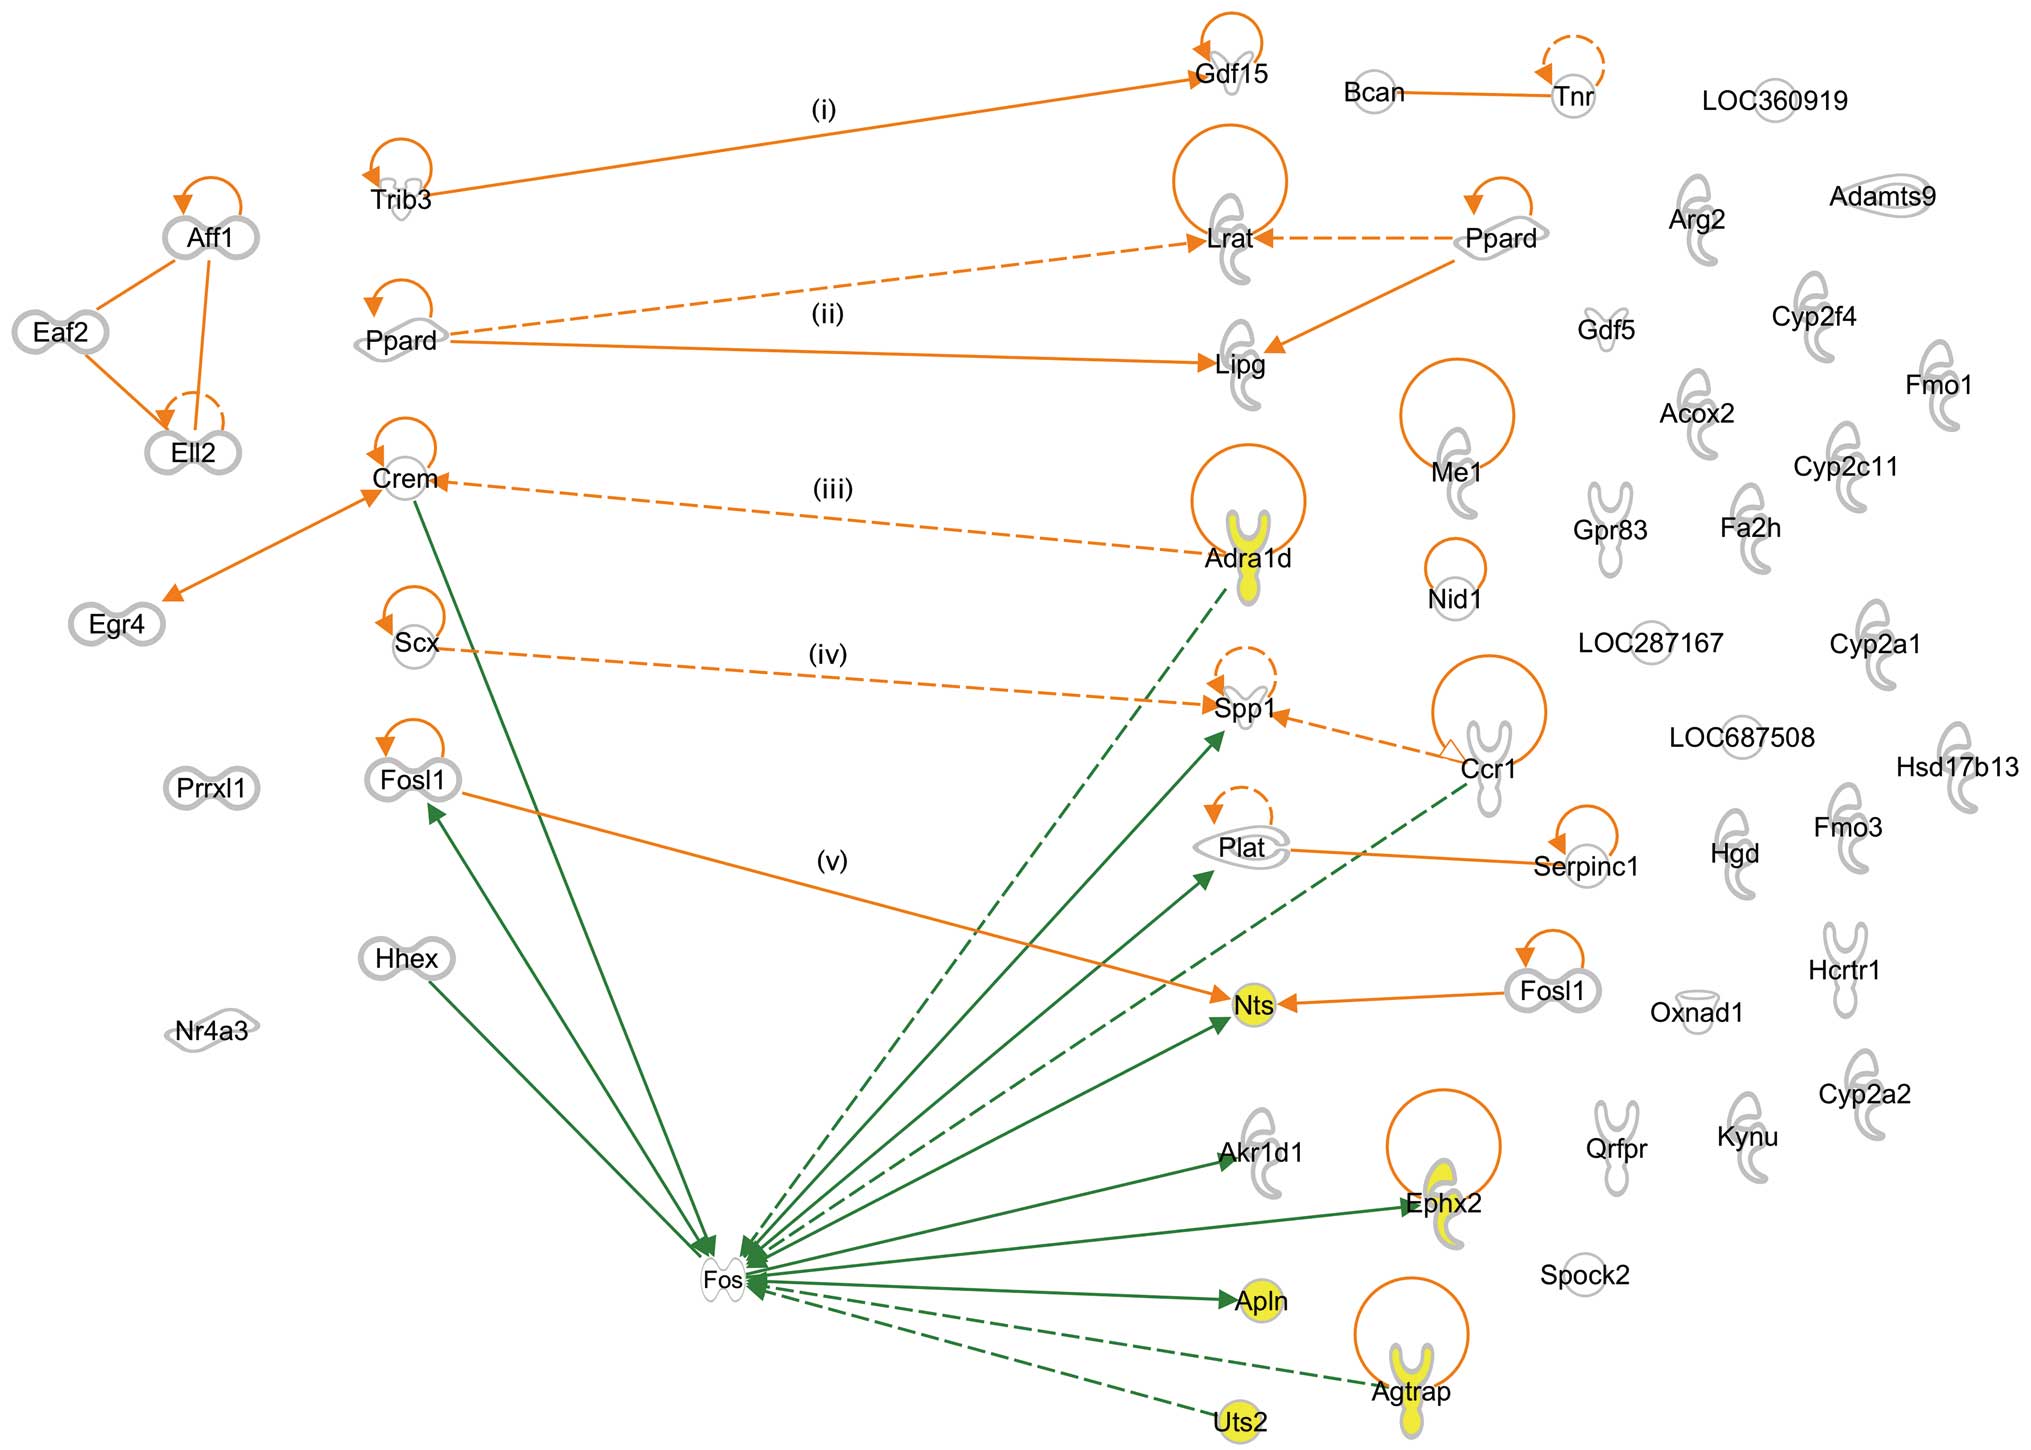
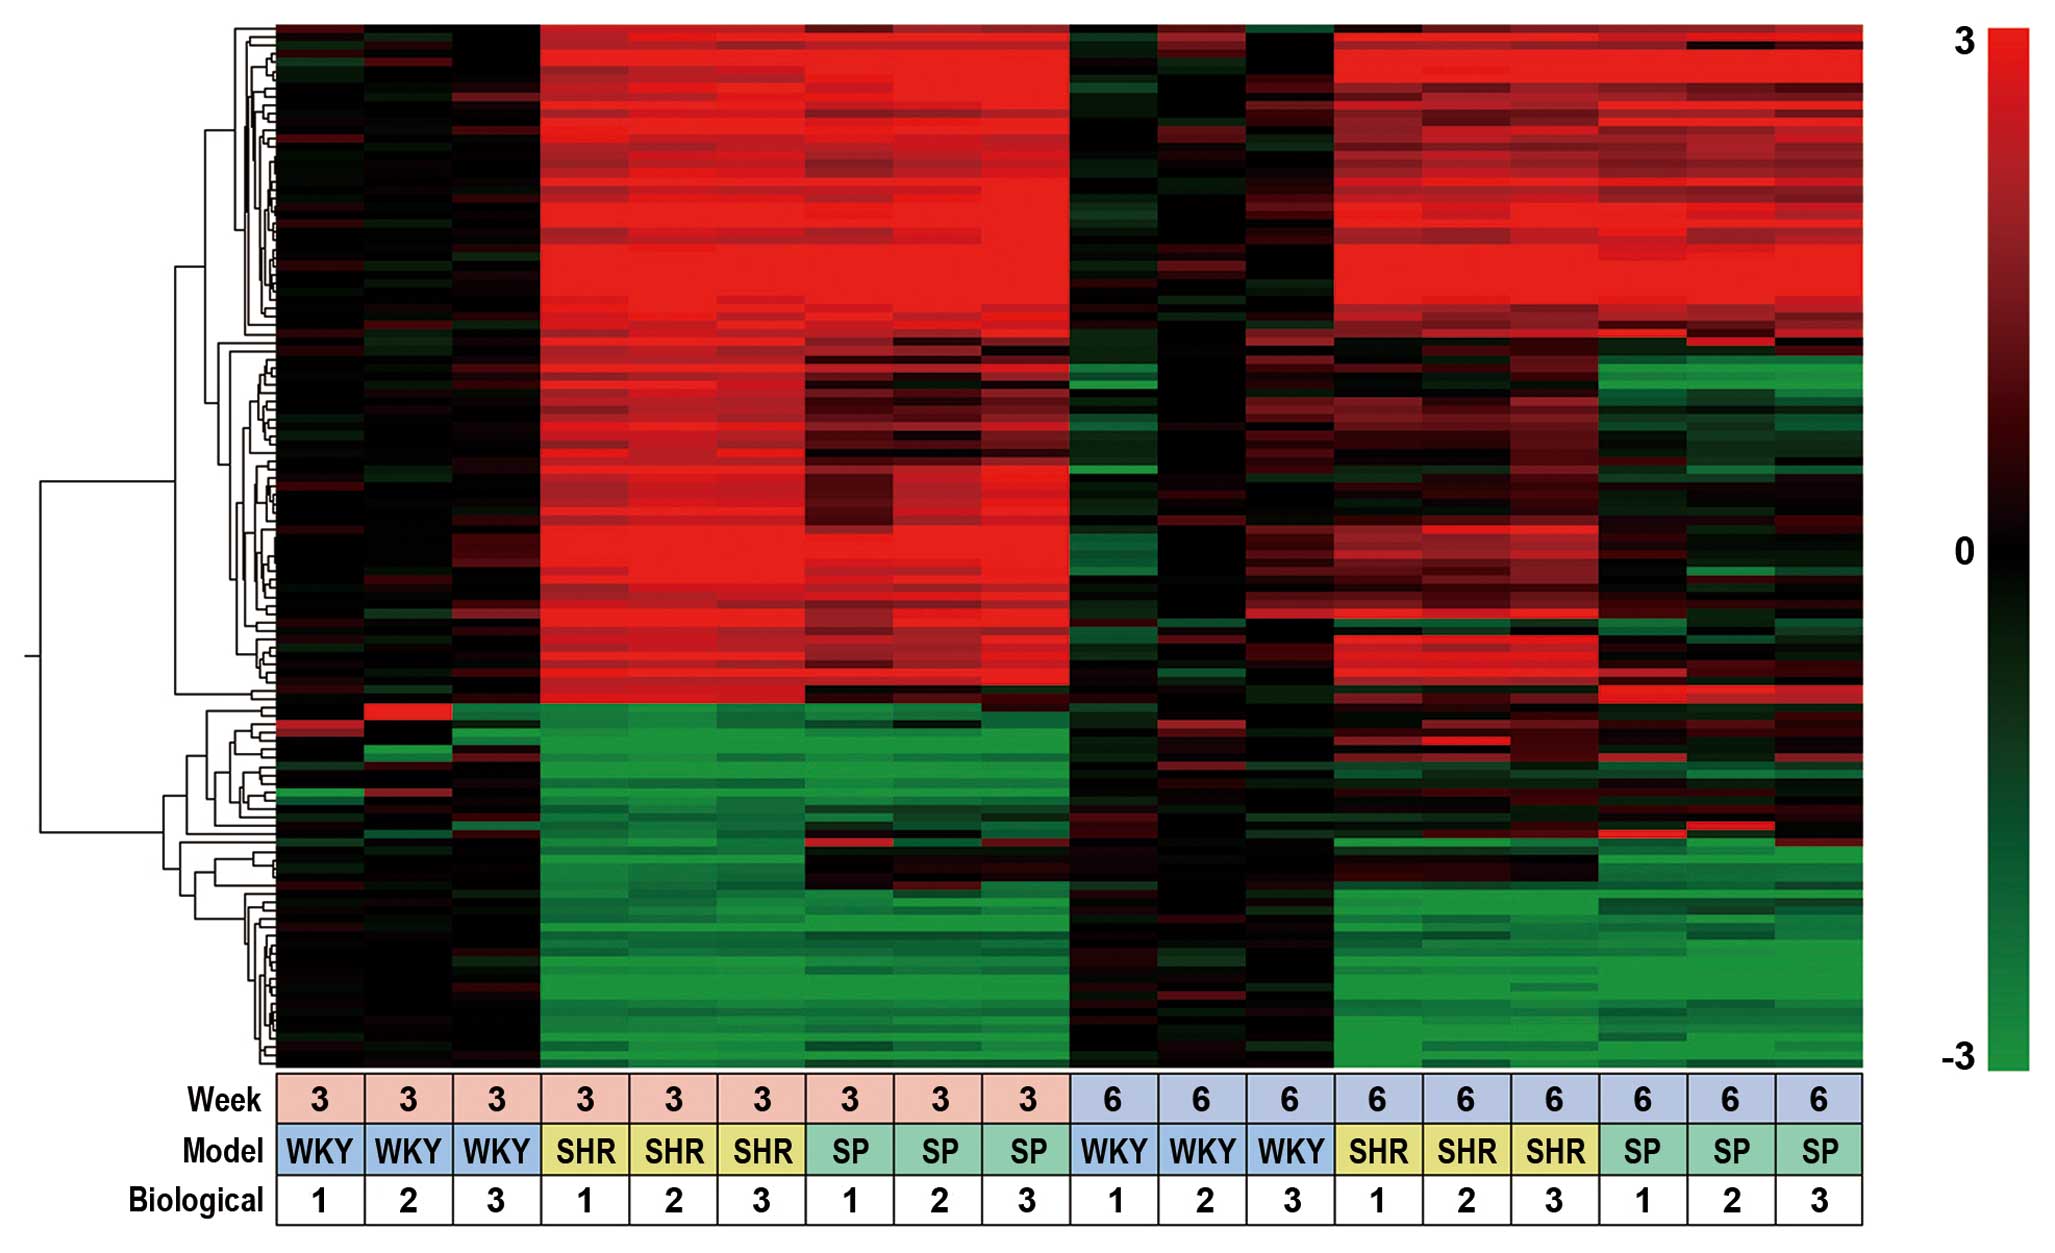 | Figure 1Heat map of SHR- and SHRSP-specific
probes. Heat map of SHR- and SHRSP-specific probes isolated from
the adrenal glands of rats at 3 and 6 weeks of age. Data were
obtained with 407 probes of 3 rat strains, WKY, SHR, SHRSP, under
18 different experimental conditions (3 different rat strains, 2
different rat ages and triplicate experiments). Data obtained with
G-1 probes, i.e., 123 out of 407 probes (Table I), were clustered based on their
biological function and expression profiles using a hierarchical
clustering program and Spearman’s rank correlation. Values used for
clustering were obtained by microarray experiments described in the
Materials and methods. The color bar at the right side of the panel
indicates the log2 ratio for each rat (SHR and SHRSP) at
3 or 6 weeks of age versus each rat (WKY) at 3 or 6 weeks of age.
The bottom panel (small boxes) indicates the experimental
conditions, i.e., examined at 3 or 6 weeks of age, 3 different rat
strains and triplicate experiments. SHR, spontaneously hypertensive
rats; SHRSP, stroke-prone SHR; WKY, Wistar-Kyoto rats. |
Categorization and enrichment of SHR- and
SHRSP-specific genes
Using DAVID web tools, SHR- and SHRSP-specific genes
were categorized into GO terms and significantly enriched genes
were identified.
SHR-specific G-1 genes included 12 enriched genes
categorized into one GO term, GO:0030528 (transcription regulator
activity) (Table II, G-1). G-2
genes included 42 enriched genes and were categorized into 8 GO
terms. They included GO terms not only related to the circulatory
system process, but also those related to the organic acid
catabolic process, oxidation reduction and peptide receptor
activity (Table II, G-2). These
results suggest that enriched G-1 genes include candidate genes
responsible for the genesis of hypertension in SHR.
| Table IIClassification and enrichment of SHR-
and SHRSP-specific genes. |
Table II
Classification and enrichment of SHR-
and SHRSP-specific genes.
| Group | GO category | GenBank ID | Description | GS | FC | P-value |
|---|
| G-1 | GO:0030528
(P=0.006) transcriptional regulator activity | NM_172047 | ELL associated
factor 2 | Eaf2 | 4.8 | 0.004 |
| XM_226624 | Elongation factor
RNA polymerase II 2, transcript variant 2 | Ell2 | 12.2 | 0.004 |
| NM_031628 | Nuclear receptor
subfamily 4, group A, member 3, transcript variant 1 | Nr4a3 | 7.9 | 0.005 |
| NM_001130508 | Scleraxis | Scx | 7.4 | 0.008 |
| NM_013141 | Peroxisome
proliferator-activated receptor delta | Ppard | 6.2 | 0.004 |
| NM_024385 | Hematopoietically
expressed homeobox | Hhex | 5.3 | 0.001 |
| NM_012953 | Fos-like antigen
1 | Fosl1 | 31.7 | 0.001 |
| NM_019137 | Early growth
response 4 | Egr4 | 11.8 | 0.001 |
| NM_001107206 | AF4/FMR2 family,
member 1 | Aff1 | 4.1 | 0.009 |
| NM_144755 | Tribbles homolog 3
(Drosophila) | Trib3 | 4.7 | 0.008 |
| NM_017334 | cAMP responsive
element modulator variant 2 | Crem | 15.5 | 0.001 |
| NM_145767 | Paired related
homeobox protein-like 1 | Prrxl1 | −4.2 | 0.002 |
| G-2 | GO:0016054
(P=0.001) organic acid catabolic process | NM_145770 | Acyl-Coenzyme A
oxidase 2 branched chain | Acox2 | 14.2 | 0.002 |
| NM_019168 | Arginase type
II | Arg2 | 6.6 | 0.005 |
| NM_053902 | Kynureninase | Kynu | 69.9 | 0.000 |
| NM_013141 | Peroxisome
proliferator-activated receptor delta | Ppard | 5.3 | 0.001 |
| NM_138884 | Aldo-keto reductase
family 1 member D1 | Akr1d1 | −10.6 | 0.003 |
| NM_001012145 | Homogentisate 1,
2-dioxygenase | Hgd | −6.5 | 0.008 |
| GO:0055114
(P=0.002) oxidation reduction | NM_053433 | Flavin containing
monooxygenase 3 | Fmo3 | 8.7 | 0.004 |
| NM_001107295 | Oxidoreductase
NAD-binding domain containing 1 | Oxnad1 | 436.4 | 0.003 |
| NM_012692 | Cytochrome P450,
family 2, subfamily a, polypeptide 1 | Cyp2a1 | −8.9 | 0.003 |
| NM_012693 | Cytochrome P450,
family 2, subfamily a, polypeptide 2 | Cyp2a2 | −10.3 | 0.004 |
| NM_019184 | Cytochrome P450,
subfamily 2, polypeptide 11 | Cyp2c11 | −4.8 | 0.006 |
| NM_019303 | Cytochrome P450,
family 2, subfamily f, polypeptide 4 | Cyp2f4 | −4.5 | 0.003 |
| NM_001135583 | Fatty acid
2-hydroxylase | Fa2h | −4.7 | 0.004 |
| NM_012792 | Flavin containing
monooxygenase 1 | Fmo1 | −5.0 | 0.000 |
| NM_001009684 | Hydroxysteroid
(17-β) dehydrogenase 13 | Hsd17b13 | −15.1 | 0.010 |
| NM_012600 | Malic enzyme 1,
NADP(+)-dependent, cytosolic | Me1 | −4.6 | 0.009 |
| GO:0003013
(P=0.005) circulatory system process | NM_024483 | Adrenergic,
alpha-1D−, receptor | Adra1d | 6.5 | 0.002 |
| NM_001102381 | Neurotensin | Nts | 4.1 | 0.007 |
| NM_001007654 | Angiotensin II
receptor-associated protein | Agtrap | −36.0 | 0.002 |
| NM_031612 | Apelin | Apln | −14.1 | 0.001 |
| NM_022936 | Epoxide hydrolase
2, cytoplasmic | Ephx2 | −29.0 | 0.002 |
| NM_019160 | Urotensin 2 | Uts2 | −4.6 | 0.007 |
| GO:0005792
(P=0.001) microsome | NM_012953 | Fos-like antigen
1 | Fosl1 | 8.5 | 0.010 |
| NM_022280 | Lecithin retinol
acyltransferase | Lrat | 7.6 | 0.007 |
| GO:0044421
(P=0.001) extra-cellular region part | NM_001107877 | ADAM with
thrombospondin type 1 motif 9 | Adamts9 | 5.1 | 0.003 |
| NM_012916 | Brevican,
transcript variant 1 | Bcan | −4.9 | 0.006 |
| XM_001066344 | Growth
differentiation factor 5 | Gdf5 | 4.8 | 0.006 |
| XM_213954 | Nidogen 1 | Nid1 | 4.7 | 0.007 |
| NM_013151 | Plasminogen
activator, tissue | Plat | 4.3 | 0.006 |
| NM_001108533 | Sparc/osteonectin,
cwcv and kazal-like domains proteoglycan 2 | Spock2 | 8.9 | 0.001 |
| NM_012881 | Secreted
phosphoprotein 1 | Spp1 | 8.0 | 0.001 |
| NM_013045 | Tenascin R | Tnr | 5.7 | 0.001 |
| NM_019216 | Growth
differentiation factor 15 | Gdf15 | −5.7 | 0.003 |
| NM_001012741 | Lipase,
endothelial | Lipg | −10.1 | 0.005 |
| NM_001108356 | α-fetoprotein | LOC360919 | −7.0 | 0.006 |
| NM_001012027 | Serpin peptidase
inhibitor, clade C, member 1 | Serpinc1 | −593.4 | 0.000 |
| GO:0020037
(P=0.004) heme binding | NM_001013853 | Globin, α | LOC287167 | −89.0 | 0.000 |
| GO:0009055
(P=0.006) electron carrier activity | XM_001075627 | Cytochrome c
oxidase subunit VIIa-heart | LOC687508 | −4.9 | 0.002 |
| GO:0001653
(P=0.007) peptide receptor activity | NM_020542 | Chemokine (C-C
motif) receptor 1 | Ccr1 | 4.4 | 0.010 |
| NM_080411 | G protein-coupled
receptor 83 | Gpr83 | 4.6 | 0.003 |
| NM_198199 | Pyroglutamylated
RFamide peptide receptor | Qrfpr | 4.1 | 0.001 |
| NM_013064 | Hypocretin receptor
1 | Hcrtr1 | −4.7 | 0.009 |
| G-3 | GO:0008217
(P=0.002) regulation of blood pressure | NM_134432 |
Angiotensinogen | Agt | 4.4 | 0.006 |
| NM_001007654 | Angiotensin II
receptor-associated protein | Agtrap | −29.6 | 0.000 |
| NM_022936 | Epoxide hydrolase
2, cytoplasmic | Ephx2 | −10.3 | 0.002 |
| NM_019160 | Urotensin 2 | Uts2 | −13.1 | 0.001 |
| GO:0009891
(P=0.005) positive regulation of biosynthetic process | NM_001106108 | Interferon
regulatory factor 4 | Irf4 | 7.1 | 0.008 |
| XM_229993 |
Cysteine-serine-rich nuclear protein
3 | Csrnp3 | −4.5 | 0.006 |
| NM_019137 | Early growth
response 4 | Egr4 | −5.2 | 0.004 |
| NM_001108214 | Neuronal PAS domain
protein 2 | Npas2 | −4.6 | 0.000 |
| NM_031628 | Nuclear receptor
subfamily 4, group A, member 3, transcript variant 1 | Nr4a3 | −7.6 | 0.001 |
| GO:0042592
(P=0.006) homeostatic process | NM_023969 | Lysophosphatidic
acid receptor 3 | Lpar3 | 5.3 | 0.000 |
| NM_001024767 | Dual-specificity
tyrosine-(Y)-phosphorylation regulated kinase 3 | Dyrk3 | −7.0 | 0.004 |
| NM_212504 | Heat shock 70 kDa
protein 1B | Hspa1b | −4.5 | 0.002 |
| NM_001037357 | Leukocyte
immunoglobulin-like receptor, subfamily B | Lilrb3l | −6.5 | 0.001 |
| XM_001078539 | Ryanodine receptor
type 1 Fragment | Ryr1l | −14.1 | 0.000 |
| GO:0019825
(P=0.003) oxygen binding | NM_012542 | Cytochrome P450,
family 2, subfamily a, polypeptide 3 | Cyp2a3 | −6.0 | 0.001 |
| NM_019303 | Cytochrome P450,
family 2, subfamily f, polypeptide 4 | Cyp2f4 | −5.5 | 0.000 |
| NM_001013853 | Globin, α | LOC287167 | −186.1 | 0.000 |
| G-4 | GO:0045596
(P=0.003) negative regulation of cell differentiation | NM_024360 | Hairy and enhancer
of split 1 (Drosophila) | Hes1 | −7.0 | 0.005 |
| NM_133380 | Interleukin 4
receptor, alpha | Il4ra | −4.8 | 0.002 |
| NM_022392 | Insulin-induced
gene 1 | Insig1 | −4.7 | 0.000 |
| NM_001107276 | Piwi-like 2
(Drosophila) | Piwil2 | −5.1 | 0.003 |
| NM_001013181 | Zinc finger and BTB
domain containing 16 | Zbtb16 | −4.7 | 0.002 |
| GO:0048545
(P=0.010) response to steroid hormone stimulus | NM_013157 | Argininosuccinate
synthase 1 | Ass1 | 4.8 | 0.002 |
| NM_019160 | Urotensin 2 | Uts2 | 17.6 | 0.000 |
| NM_012953 | Fos-like antigen
1 | Fosl1 | −8.2 | 0.004 |
| NM_175762 | Low density
lipoprotein receptor | Ldlr | −7.4 | 0.000 |
SHRSP-specific G-3 genes included 17 enriched genes
and were categorized into 4 GO terms (Table II, G-3), and G-4 genes included 9
enriched genes and were categorized into 2 GO terms, one of which
was related to the control of steroid or fatty acid metabolism
(Table II, G-4).
Interaction among SHR-specific genes
isolated at 3 and 6 weeks of age
Eleven of the 12 enriched G-1 genes were upregulated
and the remaining one, paired related homeobox protein-like 1
(Prrxl1), was downregulated (Table II, G-1). Since our results
suggested the possibility that these 12 G-1 genes interact with G-2
genes, and since most of the 12 genes encode proteins related to
RNA polymerase II transcription, we examined interactions among G-1
and G-2 genes by IPA and found 5 interactions (Fig. 2): i) tribbles homolog 3
(Drosophila) (Trib3) interacted with growth
differentiation factor 15 (Gdf15); ii) peroxisome
proliferator-activated receptor delta (Ppard) interacted
with lecithin retinol acyltransferase (Lrat) and lipase,
endothelial (Lipg); iii) Crem interacted with
adrenergic, alpha-1D-, receptor (Adra1d); iv) scleraxis
(Scx) interacted with secreted phosphoprotein 1
(Spp1); and v) fos-like antigen 1 (Fosl1) interacted
with neurotensin (Nts). However, we did not find any
interactions between G-1 and BP-controlling G-2 genes, such as
angiotensin II receptor-associated protein (Agtrap), apelin
(Apln), epoxide hydrolase 2, cytoplasmic (Ephx2) and
urotensin 2 (Uts2) (Table II,
G-2; GO:0003013, circulatory system process).
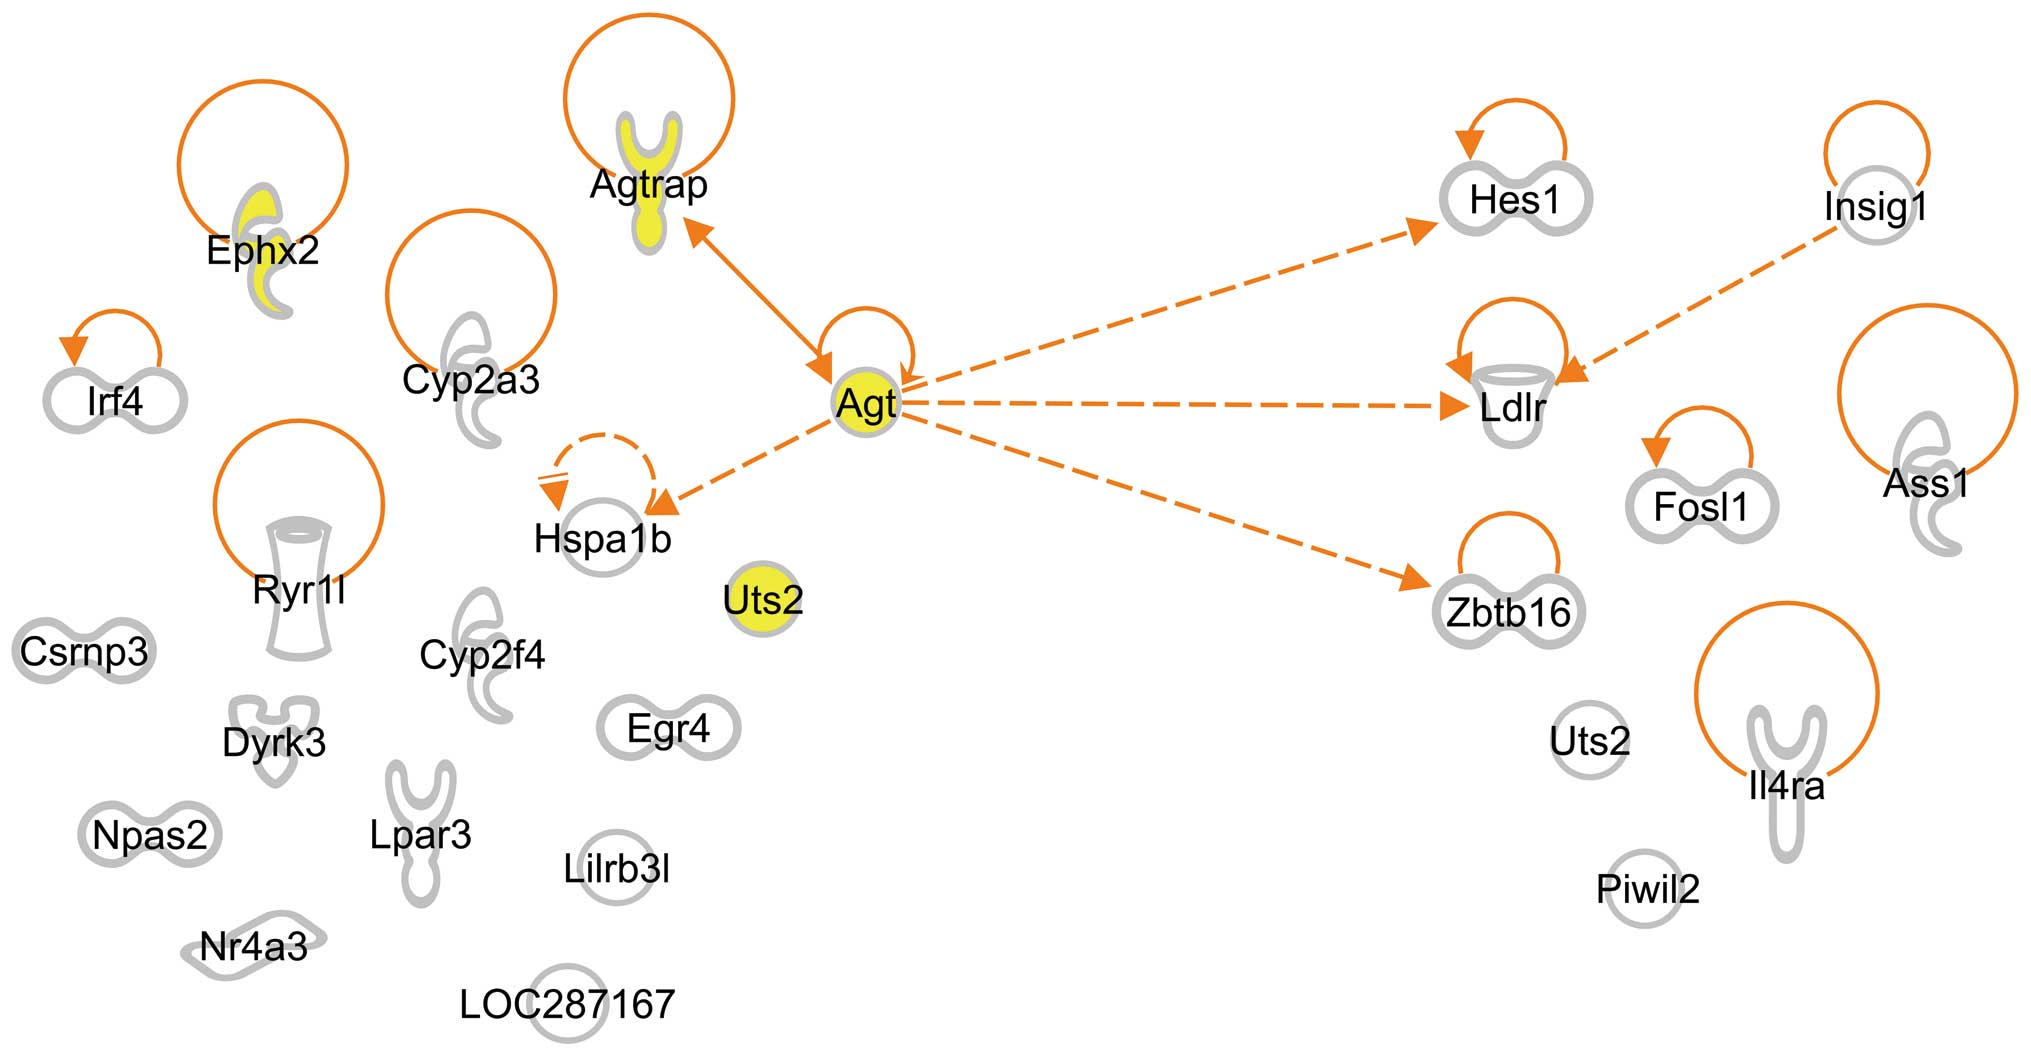
Interaction among SHRSP-specific genes
isolated when the rats were 3 and 6 weeks of age
Since the study of enriched G-1 and G-2 genes
suggested the possibility that enriched G-3 genes regulate the
expression of G-4 genes isolated when the rats were 6 weeks of age,
we examined interactions between G-3 and G-4 genes by IPA and found
that Agt interacted not only with the 3 G-4 genes, hairy and
enhancer of split 1 (Drosophila) (Hes1), low density
lipoprotein receptor (Ldlr) and zinc finger and BTB domain
containing 16 (Zbtb16), but also with 2 G-3 genes,
Agtrap and heat shock 70 kDa protein 1B (Hspa1b)
(Fig. 3). We also found an
interaction between 2 G-4 genes, Ldlr and insulin-induced
gene 1 (Insig1) (Fig.
3).
Discussion
General considerations
We isolated 101 SHR-specific genes by comparing the
gene expression profiles between SHR and WKY at 3 weeks of age and
isolated 143 SHR-specific genes by comparing gene expression
profiles of the rats at 6 weeks of age (Table I). Similarly, we isolated 42
SHRSP-specific genes by comparing the gene expression profiles
between SHRSP and SHR at 3 weeks of age and isolated 67
SHRSP-specific genes by comparing the gene expression profiles of
rats at 6 weeks of age (Table I).
These results indicated that genetic differences between SHR and
WKY were significantly larger than those between SHRSP and SHR.
Since SHR and SHRSP are frequently used as model
rats, not only in studies of hypertension and stroke, but also in
studies of ADHD (10,11), these SHR- and SHRSP-specific genes
are expected to include genes related to ADHD. These points are
discussed later in this section.
SHR-specific genes possibly triggering
hypertension in SHR
We found the following 5 interactions between G-1
and G-2 genes (Fig. 2): i)
Trib3 interacted with Gdf15, which is known as a
protective factor in response to cardiovascular injury (12,13); ii) Ppard interacted with
Lrat and Lipg, where the former is related to steroid
metabolic process (14) and the
latter is involved in lipoprotein metabolism and vascular biology
(15); iii) Crem
interacted with Adra1d, which participates in
norepinephrine-epinephrine vasoconstriction (16); iv) Scx interacted with
Spp1, which can act as a cytokine to stimulate lymphocyte
immunoglobulin production (17,18); and v) Fosl1 interacted with
Nts, which encodes a precursor protein for both peptides
(19) and participates in BP
control by regulating blood vessel size (20). All these results suggest the
possibility that the Trib3, Ppard, Crem, Scx and
Fosl1 genes participate in the regulation of BP. However,
all these interactions are not sufficient to explain the control of
G-2 genes, such as Apln, Ephx2, Uts2 and Agtrap by
G-1 genes (Table II, G-2,
GO:0003013).
In order to identify further interactions between
G-1 and G-2 genes, we suggested the presence of a gene that helps
in the interaction between G-1 and G-2 genes, and found such a gene
(Fos), which helps the interactions between 3 G-1 genes
[Crem, Fosl1 and hematopoietically expressed homeobox
(Hhex)] and many G-2 genes (Fig. 2). Among others, Crem seems
to interact in the presence of Fos with genes regulating BP,
such as Nts, Apln and Ephx2 (Fig. 2 and Table II, G-2), and with SHR-specific
genes, such as Spp1, plasminogen activator, tissue
(Plat) and aldo-keto reductase family 1 member D1
(Akr1d1). Moreover, Crem indirectly interacted with
many other SHR-specific genes, such as Adra1d, chemokine
(C-C motif) receptor 1 (Ccr1), Agtrap and Uts2
(Fig. 2). Although we did not
find SHR-specific Fos transcripts among the transcripts of
enriched G-1 and G-2 genes, we found that levels of the
Fosl1 transcript in SHR at 3 and 6 weeks of age were 31.7-
and 8.5-fold higher than those of the corresponding transcripts in
WKY, respectively (Table II, G-1 and
G-2). Fosl1 is a member of the Fos gene family,
which consists of 4 members, Fos, Fosb, Fosl1 and
Fosl2. Since Fosl1 has high Fos function
rescue activity (21), we expect
that Fosl1 replaces at least a part of Fos function
and supports interactions between G-1 and G-2 genes (Fig. 2). Based on these observations, we
propose that Crem is one of the candidate genes causing
hypertension in SHR.
SHRSP-specific genes related to
stroke-associated symptoms
Our results revealed that G-3 genes isolated from
SHRSP at 3 weeks of age included a significant number of the genes
isolated from SHR at 6 weeks of age, such as Uts2, Ephx2,
Agtrap (GO:0008217, regulation of BP), cytochrome P450,
family 2, subfamily f, polypeptide 4 (Cyp2f4) and globin, α
(GloA) (GO:0019825, oxygen binding) (Table II). These results indicate that
the evolution of the expression of genes related to BP control and
to mitochondrial/cytochrome P450 systems proceed more rapidly in
SHRSP than in SHR during their development.
We found that 4 of the 17 enriched G-3 genes,
Agt, Agtrap, Ephx2 and Uts2, were isolated
from SHRSP at 3 weeks of age and were categorized into GO:0008217
(regulation of BP): Agt was upregulated and the other 3
genes, Agtrap, Ephx2 and Uts2, were downregulated
(Table II, G-3). Since the
expression of these 4 genes was SHRSP-specific, we expected their
participation in stroke-associated symptoms and examined the
interactions between G-3 and G-4 genes by IPA. We found that
Agt interacted not only with G-4 genes, such as Hes1,
Zbtb16 and Ldlr, but also with G-3 genes, such as
Agtrap and Hspa1b (Fig.
3): Hes1 encodes a protein that belongs to the basic
helix-loop-helix family of transcription factors and regulates
transcription from RNA polymerase II promoter (22); Zbtb16 encodes a protein
located in the nucleus and is involved in the positive regulation
of transcription from RNA polymerase II promoter (23); and Ldlr mutations cause the
autosomal dominant disorder, familial hypercholesterolemia
(24,25). Moreover, Agtrap encodes a
protein that interacts with angiotensin II type I receptor and
negatively regulates angiotensin II signaling (26) and Hspa1b encodes a 70 kDa
heat shock protein that is a member of the heat shock protein 70
family and participates in the negative regulation of
vasoconstriction (27). All these
interactions suggest that Agt plays pivotal roles in the
pathogenesis of stroke.
Genes related to ADHD
SHR and SHRSP are frequently used as animal models
in studies of ADHD (10,11) and adrenal gland dysfunction is
believed to be involved in ADHD due to low adrenaline (epinephrine)
levels found in children with ADHD. Since juvenile SHRSP show
significant increases in motor activity, one of the typical
symptoms of ADHD as early as 6 weeks of age (28,29), we expected that the expression
levels of genes related to ADHD would show significant differences
much earlier than 6 weeks of age and that SHR- and SHRSP-specific
genes isolated from the adrenal glands when the rats were 3 and 6
weeks of age not only include genes related to hypertension and
stroke, but also include genes related to ADHD.
Genes involved in the metabolism and functions of
corticosteroids are known to affect adrenaline levels in
circulating blood and are differentially expressed in SHR or SHRSP.
For example, G-2 genes categorized into GO:0055114 (oxidation
reduction), such as cytochrome P450 (Cyp)2a1, Cyp2a2,
Cyp2c11 and Cyp2f4 (Table
II, G-2), and G-3 genes categorized into GO:0019825 (oxygen
binding), such as Cyp2a3 and Cyp2f4 (Table II, G-3), catalyze many reactions
involved in the synthesis of cholesterol, steroids and other
lipids. Four of the G-4 genes, argininosuccinate synthase 1
(Ass1), Uts2, Fosl1 and Ldlr, were categorized
into GO:0048545 (response to a steroid hormone stimulus) (Table II, G-4). One of these genes,
Ldlr, is involved in the rate-limiting step in the synthesis
of cholesterol and is reportedly related to hyperactive behavior
(30).
In this study, we suggest that Crem is one of
the candidate genes causing hypertension in SHR. Of note, Maldonado
et al (31) reported that
Crem-mutant mice exhibited behaviors similar to the symptoms
observed in ADHD, such as an increased level of physical activity,
as well as altered emotional and stress responses, and Lahti and
Partonen (32) hypothesized that
abnormalities in Crem protein functions or mutations in the
Crem gene may underlie at least some of the symptoms in
patients with ADHD.
Since functional and morphological studies in
children affected by ADHD suggest not only adrenal gland
dysfunctions, but also prefrontal cortex dysfunctions (33), we extended our current study to
examine gene expression profiles in brains derived from SHR and
SHRSP at 3 and 6 weeks of age.
In conclusion, SHR and SHRSP are widely used as
animal models, not only in studies of essential hypertension, but
also in studies of ADHD. Using these animal models, in the present
study, 12 enriched SHR-specific genes exhibiting transcriptional
regulatory activity were isolated from the adrenal glands when the
rats were 3 weeks of age and one of these 12 genes, Crem,
was suggested to be a possible candidate gene causing hypertension
in SHR. Similarly, our results suggest that Agt plays
pivotal roles in causing stroke. Genes involved in ADHD were also
discussed.
Acknowledgements
We thank Dr Etsuro Yamanishi, President Emeritus of
Hirakata General Hospital for Developmental Disorders, and Dr
Aritomo Suzuki, Professor Emeritus of Kinki University, for their
constant support and encouragement, and thank Miss Fumie Kanazawa
for her expert secretarial assistance. We also thank the National
Center for Biotechnology Information, US National Library of
Medicine, Bethesda, MD, USA and the DNA Data Bank of Japan for
access to network servers.
Abbreviations:
|
ADHD
|
attention deficit hyperactivity
disorder
|
|
BP
|
blood pressure
|
|
DAVID
|
Database for Annotation, Visualization
and Integrated Discovery
|
|
GEO
|
Gene Expression Omnibus
|
|
GO
|
Gene Ontology
|
|
IPA
|
Ingenuity Pathway Analysis
|
|
SHR
|
spontaneously hypertensive rats
|
|
SHRSP
|
stroke-prone SHR
|
|
WKY
|
Wistar-Kyoto rats
|
References
|
1
|
McBride MW, Charchar FJ, Graham D, Miller
WH, Strahorn P, Carr FJ and Dominiczak AF: Functional genomics in
rodent models of hypertension. J Physiol. 554:56–63. 2004.
View Article : Google Scholar : PubMed/NCBI
|
|
2
|
Delles C, McBride MW, Graham D,
Padmanabhan S and Dominiczak AF: Genetics of hypertension: from
experimental animals to humans. Biochim Biophys Acta.
1802:1299–1308. 2010. View Article : Google Scholar : PubMed/NCBI
|
|
3
|
Okamoto K and Aoki K: Development of a
strain of spontaneously hypertensive rats. Jpn Circ J. 27:282–293.
1963. View Article : Google Scholar : PubMed/NCBI
|
|
4
|
Okamoto K, Hazama F, Yamori Y, Haebara H
and Nagaoka A: Pathogenesis and prevention of stroke in
spontaneously hypertensive rats. Clin Sci Mol Med (Suppl).
2:161s–163s. 1975.PubMed/NCBI
|
|
5
|
Nabika T, Cui Z and Masuda J: The
stroke-prone spontaneously hypertensive rat: how good is it as a
model for cerebrovascular diseases? Cell Mol Neurobiol. 24:639–646.
2004. View Article : Google Scholar : PubMed/NCBI
|
|
6
|
Friese RS, Mahboubi P, Mahapatra NR, et
al: Common genetic mechanisms of blood pressure elevation in two
independent rodent models of human essential hypertension. Am J
Hypertens. 18:633–652. 2005. View Article : Google Scholar
|
|
7
|
Ashenagar MS, Tabuchi M, Kinoshita K, et
al: Gene expression in the adrenal glands of three spontaneously
hypertensive rat substrains. Mol Med Rep. 3:213–222.
2010.PubMed/NCBI
|
|
8
|
Huang da W, Sherman BT and Lempicki RA:
Systematic and integrative analysis of large gene lists using DAVID
bioinformatics resources. Nat Protoc. 4:44–57. 2009.PubMed/NCBI
|
|
9
|
Huang da W, Sherman BT and Lempicki RA:
Bioinformatics enrichment tools: paths toward the comprehensive
functional analysis of large gene lists. Nucleic Acids Res.
37:1–13. 2009.PubMed/NCBI
|
|
10
|
Sagvolden T, Russell VA, Aase H, Johansen
EB and Farshbaf M: Rodent models of attention-deficit/hyperactivity
disorder. Biol Psychiatry. 57:1239–1247. 2005. View Article : Google Scholar : PubMed/NCBI
|
|
11
|
Faraone SV and Mick E: Molecular genetics
of attention deficit hyperactivity disorder. Psychiatr Clin North
Am. 33:159–180. 2010. View Article : Google Scholar : PubMed/NCBI
|
|
12
|
Kempf T, Eden M, Strelau J, et al: The
transforming growth factor-beta superfamily member
growth-differentiation factor-15 protects the heart from
ischemia/reperfusion injury. Circ Res. 98:351–360. 2006. View Article : Google Scholar
|
|
13
|
de Jager SC, Bermúdez B, Bot I, et al:
Growth differentiation factor 15 deficiency protects against
atherosclerosis by attenuating CCR2-mediated macrophage chemotaxis.
J Exp Med. 208:217–225. 2011.PubMed/NCBI
|
|
14
|
Liu L and Gudas LJ: Disruption of the
lecithin:retinol acyltransferase gene makes mice more susceptible
to vitamin A deficiency. J Biol Chem. 280:40226–40234. 2005.
View Article : Google Scholar : PubMed/NCBI
|
|
15
|
Qiu G and Hill JS: Atorvastatin decreases
lipoprotein lipase and endothelial lipase expression in human THP-1
macrophages. J Lipid Res. 48:2112–2122. 2007. View Article : Google Scholar : PubMed/NCBI
|
|
16
|
García-Cazarín ML, Smith JL, Clair DK and
Piascik MT: The alpha1D-adrenergic receptor induces vascular smooth
muscle apoptosis via a p53-dependent mechanism. Mol Pharmacol.
74:1000–1007. 2008.PubMed/NCBI
|
|
17
|
Denhardt DT and Guo X: Osteopontin: a
protein with diverse functions. FASEB J. 7:1475–1482.
1993.PubMed/NCBI
|
|
18
|
Wang KX and Denhardt DT: Osteopontin: role
in immune regulation and stress responses. Cytokine Growth Factor
Rev. 19:333–345. 2008. View Article : Google Scholar : PubMed/NCBI
|
|
19
|
Reghunandanan V and Reghunandanan R:
Neurotransmitters of the suprachiasmatic nuclei. J Circadian
Rhythms. 4:22006. View Article : Google Scholar : PubMed/NCBI
|
|
20
|
Roubert C, Spielewoy C, Soubrié P, Hamon
M, Giros B and Betancur C: Altered neurotensin mRNA expression in
mice lacking the dopamine transporter. Neuroscience. 123:537–546.
2004. View Article : Google Scholar : PubMed/NCBI
|
|
21
|
Matsuo K, Owens JM, Tonko M, Elliott C,
Chambers TJ and Wagner EF: Fosl1 is a transcriptional target of
c-Fos during osteoclast differentiation. Nat Genet. 24:184–187.
2000. View Article : Google Scholar : PubMed/NCBI
|
|
22
|
Hirata H, Tomita K, Bessho Y and Kageyama
R: Hes1 and Hes3 regulate maintenance of the isthmic organizer and
development of the mid/hindbrain. EMBO J. 20:4454–4466. 2001.
View Article : Google Scholar : PubMed/NCBI
|
|
23
|
Senbonmatsu T, Saito T, Landon EJ, et al:
A novel angiotensin II type 2 receptor signaling pathway: possible
role in cardiac hypertrophy. EMBO J. 22:6471–6482. 2003. View Article : Google Scholar : PubMed/NCBI
|
|
24
|
Scotti E, Hong C, Yoshinaga Y, et al:
Targeted disruption of the idol gene alters cellular regulation of
the low-density lipoprotein receptor by sterols and liver x
receptor agonists. Mol Cell Biol. 31:1885–1893. 2011. View Article : Google Scholar
|
|
25
|
Hartvigsen K, Chou MY, Hansen LF, Shaw PX,
Tsimikas S, Binder CJ and Witztum JL: The role of innate immunity
in atherogenesis. J Lipid Res. 50(Suppl): S388–S393. 2009.
View Article : Google Scholar : PubMed/NCBI
|
|
26
|
Azuma K, Tamura K, Shigenaga A, et al:
Novel regulatory effect of angiotensin II type 1
receptor-interacting molecule on vascular smooth muscle cells.
Hypertension. 50:926–932. 2007. View Article : Google Scholar : PubMed/NCBI
|
|
27
|
Zitvogel L, Kepp O and Kroemer G: Decoding
cell death signals in inflammation and immunity. Cell. 140:798–804.
2010. View Article : Google Scholar : PubMed/NCBI
|
|
28
|
Ueno KI, Togashi H, Mori K, et al:
Behavioural and pharmacological relevance of stroke-prone
spontaneously hypertensive rats as an animal model of a
developmental disorder. Behav Pharmacol. 13:1–13. 2002. View Article : Google Scholar
|
|
29
|
Anderson GM, Dover MA, Yang BP, et al:
Adrenomedullary function during cognitive testing in
attention-deficit/hyperactivity disorder. J Am Acad Child Adolesc
Psychiatry. 39:635–643. 2000. View Article : Google Scholar : PubMed/NCBI
|
|
30
|
Mack JT, Beljanski V, Soulika AM, Townsend
DM, Brown CB, Davis W and Tew KD: ‘Skittish’ Abca2 knockout
mice display tremor, hyperactivity, and abnormal myelin
ultrastructure in the central nervous system. Mol Cell Biol.
27:44–53. 2007.
|
|
31
|
Maldonado R, Smadja C, Mazzucchelli C and
Sassone-Corsi P: Altered emotional and locomotor responses in mice
deficient in the transcription factor CREM. Proc Natl Acad Sci USA.
96:14094–14099. 1999. View Article : Google Scholar : PubMed/NCBI
|
|
32
|
Lahti TA and Partonen T: CREM mutations
and ADHD symptoms. Med Hypotheses. 72:544–545. 2009. View Article : Google Scholar : PubMed/NCBI
|
|
33
|
Viggiano D, Ruocco LA, Arcieri S and
Sadile AG: Involvement of norepinephrine in the control of activity
and attentive processes in animal models of attention deficit
hyperactivity disorder. Neural Plast. 11:133–149. 2004. View Article : Google Scholar
|