Introduction
Transgenic animals are a powerful tool used in the
study of the function and regulation of genes in vivo, the
production of important pharmaceutical proteins, and the creation
of pathologic models for human disease therapy (1–3).
When new transgenic animals are generated, one essential step is to
identify the transgenic livestock. Novel approaches to improve the
molecular characterization of transgenic livestock would have
considerable economic and commercial benefits. Commonly used
transgenic techniques such as somatic cell nuclear transfer always
result in the random integration of multiple copies of target genes
in the host genome (4,5). Thus detecting the existence and
expression of target genes in transgenic animals, as well as
determining the copy number and insertion site in transgenic
animals is crucial, as these factors can greatly affect the
expression level and genetic stability of targeted genes (6–8).
The random insertion of multiple copies may have marked effects,
such as the inactivation of an endogenous gene following transgene
insertion. Different levels of transgene expression and even
silencing of the transgene may result when inserted into a
heterochromatic region due to chromosome position effects (9,10).
Based on the difference between the transgenic and
non-transgenic animal at the DNA level (target gene-, promoter-,
marker gene- and construct-specific), a number of DNA-based methods
have been utilized for transgene detection, such as polymerase
chain reaction (PCR), quantitative PCR (qPCR) (11,12) and thermal asymmetric interlaced
(TAIL)-PCR (13–15). The PCR-based detection strategies
have become the core method due to their high specificity,
efficiency and sensitivity (13).
The number of transgene copies has traditionally been estimated by
southern blotting techniques, which are tedious and time-consuming
methods and require a large amount of DNA sample for each assay.
Moreover, quantification using those methods is not accurate (when
multiple copies of transgenes insert into one or more loci) and
yield ambiguous results (16).
The emergence of the sensitivity and accuracy of qPCR technology
allows for the copy numbers in transgene animals can easily be
determined (7,11). qPCR technology has been applied to
analyze the copy number of transgenic mice (17–19), swine (7) and livestock (5).
Chromosome walking and flanking sequence cloning
procedures were employed to detect the integration site of the
target gene. The potential of inserting mutation renders the
identification of the transgene location critical (20). Currently, a number of PCR-based
methods are available for these purposes, including inverse PCR
(I-PCR) (21), ligation-mediated
PCR (22) and event-specific PCR
(23). However, each of these
methods has drawbacks when considered for wide use in transgenic
animal analysis (24). Recently,
improved methodologies have been developed to address these issues.
The TAIL-PCR is the most successful method currently used to
precisely identify transgene flanking sequences. Additionally,
TAIL-PCR has been widely used in identifying the insert sites of
transgenic animals (20). To
obtain precise flanking fragments rapidly, we have developed a
novel efficient method that combined the restriction method from
southern blotting with TAIL-PCR procedures to analyze the
integration sites.
In this study, we generated the transgenic-cloned
goat that specifically expresses insulin-like growth factor I
(IGF-1) in milk (25). To
stimulate the molecular analysis of cloned goats, we initially used
PCR and southern blotting to identify the cloned goats as IGF-1
transgenic goats. The exact integration site and copy numbers of
the four individual IGF-1 transgenic goats were detected by qPCR
and TAIL-PCR methods.
Materials and methods
Production of IGF-1 transgenic goats
Transgenic goats were generated by somatic cell
nuclear transfer (SCNT) with SalI/PvuI-linearized
plasmid pIN, which contained 6.1 kb of the goat β-casein proximal
promoter region, the coding region of goat IGF-1 gene and
2.3 kb of the 3′ β-casein region (26). Briefly,
SalI/PvuI-lineralized plasmid was transferred into
fibroblasts by Lipofectame 2000 and screened with neomycin. Healthy
transferred pIN donor cells (fibroblasts) were then cultured in
starved medium and injected into the perivitelline space of
enucleated oocytes with a beveled micropipette. In addition, the
activated reconstructed couplets were cultured in the oviducts of
synchronized temporary intermediate recipients or transferred into
the uterine tubes of each recipient. After 5 days of culture in
vivo of the reconstructed embryo, the developed morulae and
blastocytes were surgically transferred into the uteri of
synchronized final recipients. At day 35, the surrogates were
scanned with B-ultrasound scanner to detect pregnant goats. Four
cloned goats were eventually born.
DNA extraction and genomic PCR
identification
DNA extraction
Whole goat blood genomic DNA was extracted from the
four IGF-1 transgenic goats and three non-transgenic goats with the
TIANamp Blood DNA Midi kit [Tiangen Biotech (Beijing) Co., Ltd,
Beijing, China] according to the manufacturer’s instructions. The
extracted DNA was kept at −20°C until use. This animal study was
approved by the Institutional Animal Care and Use Committee of
Nanjing Agricultural University. The extracted genomic DNA was
quantified by electrophoresis. Gels were prepared with 1% agarose
in TAE buffer with ethidium bromide (EtBr).
Primer design and PCR
identification
Three pairs of specific primers were designed to
evaluate the presence of the transgene. Primers were designed
according to Fig. 1A and are
listed in Table I. PCR
amplification was performed with the genomic DNA template,
recombinant Taq polymerase, 10X buffer, and primers. The conditions
for PCR were: 94°C for 5 min, 94°C for 30 sec, 60°C for 30 sec, and
72°C for 90 sec for 30 cycles, with a final extension at 72°C for
10 min. The PCR product was isolated and linked to plasmid pMD19-T
for sequencing.
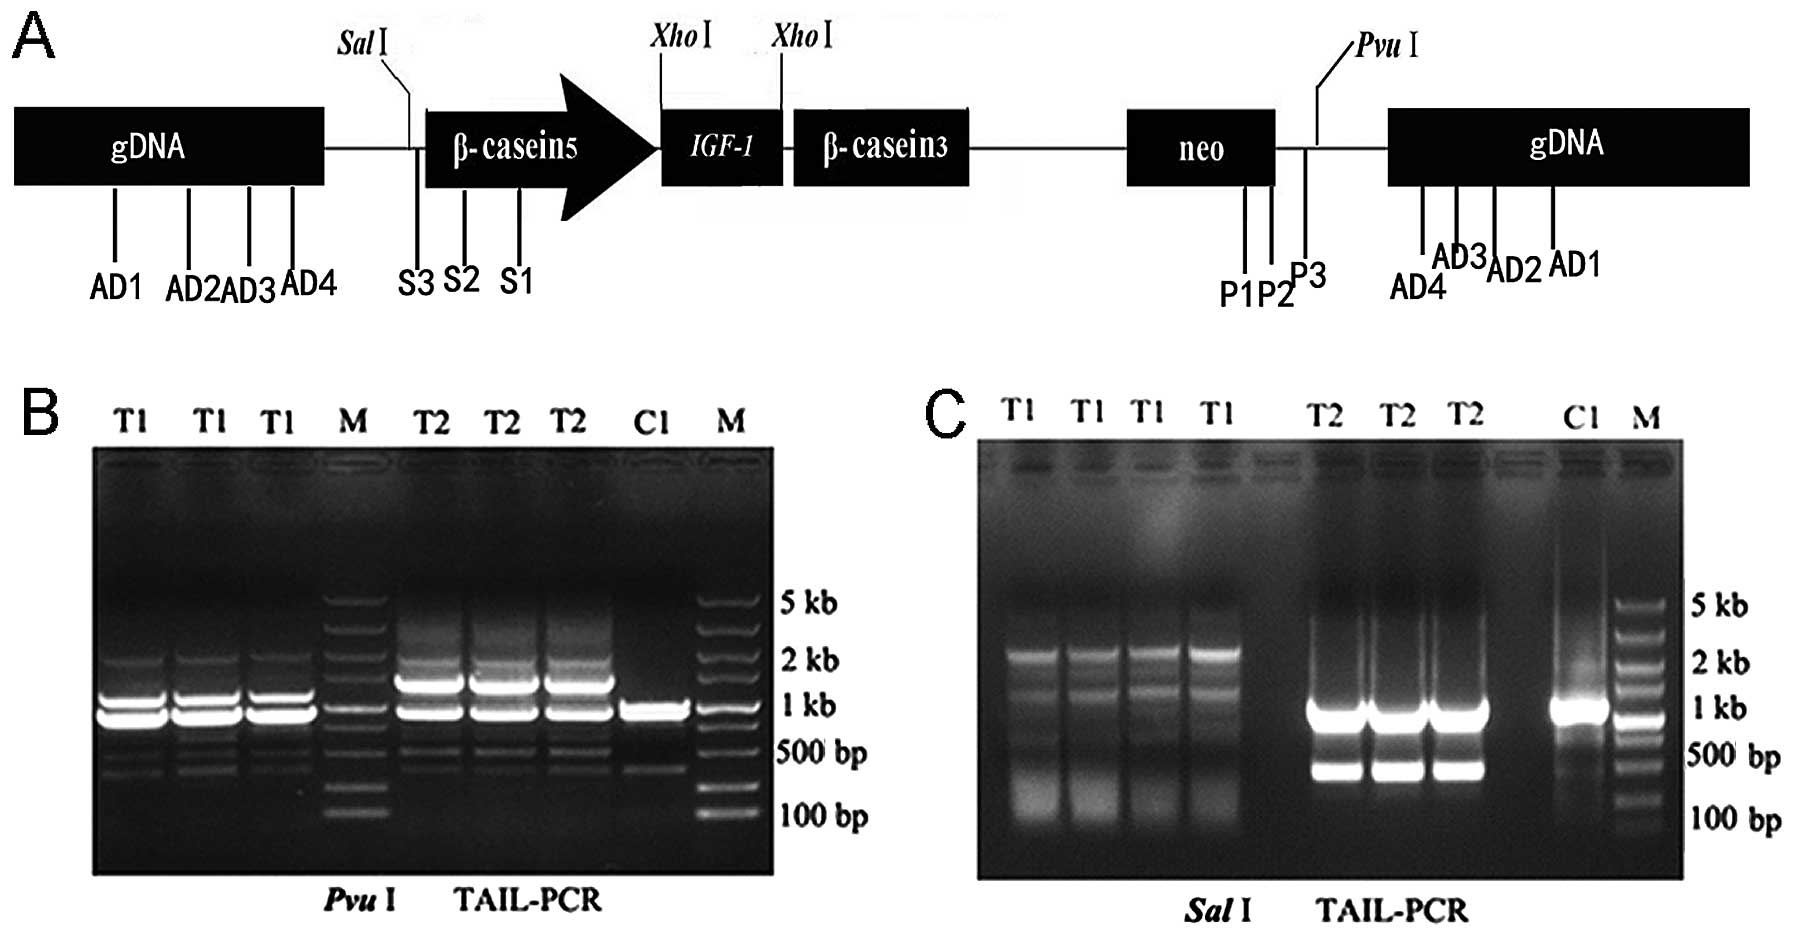
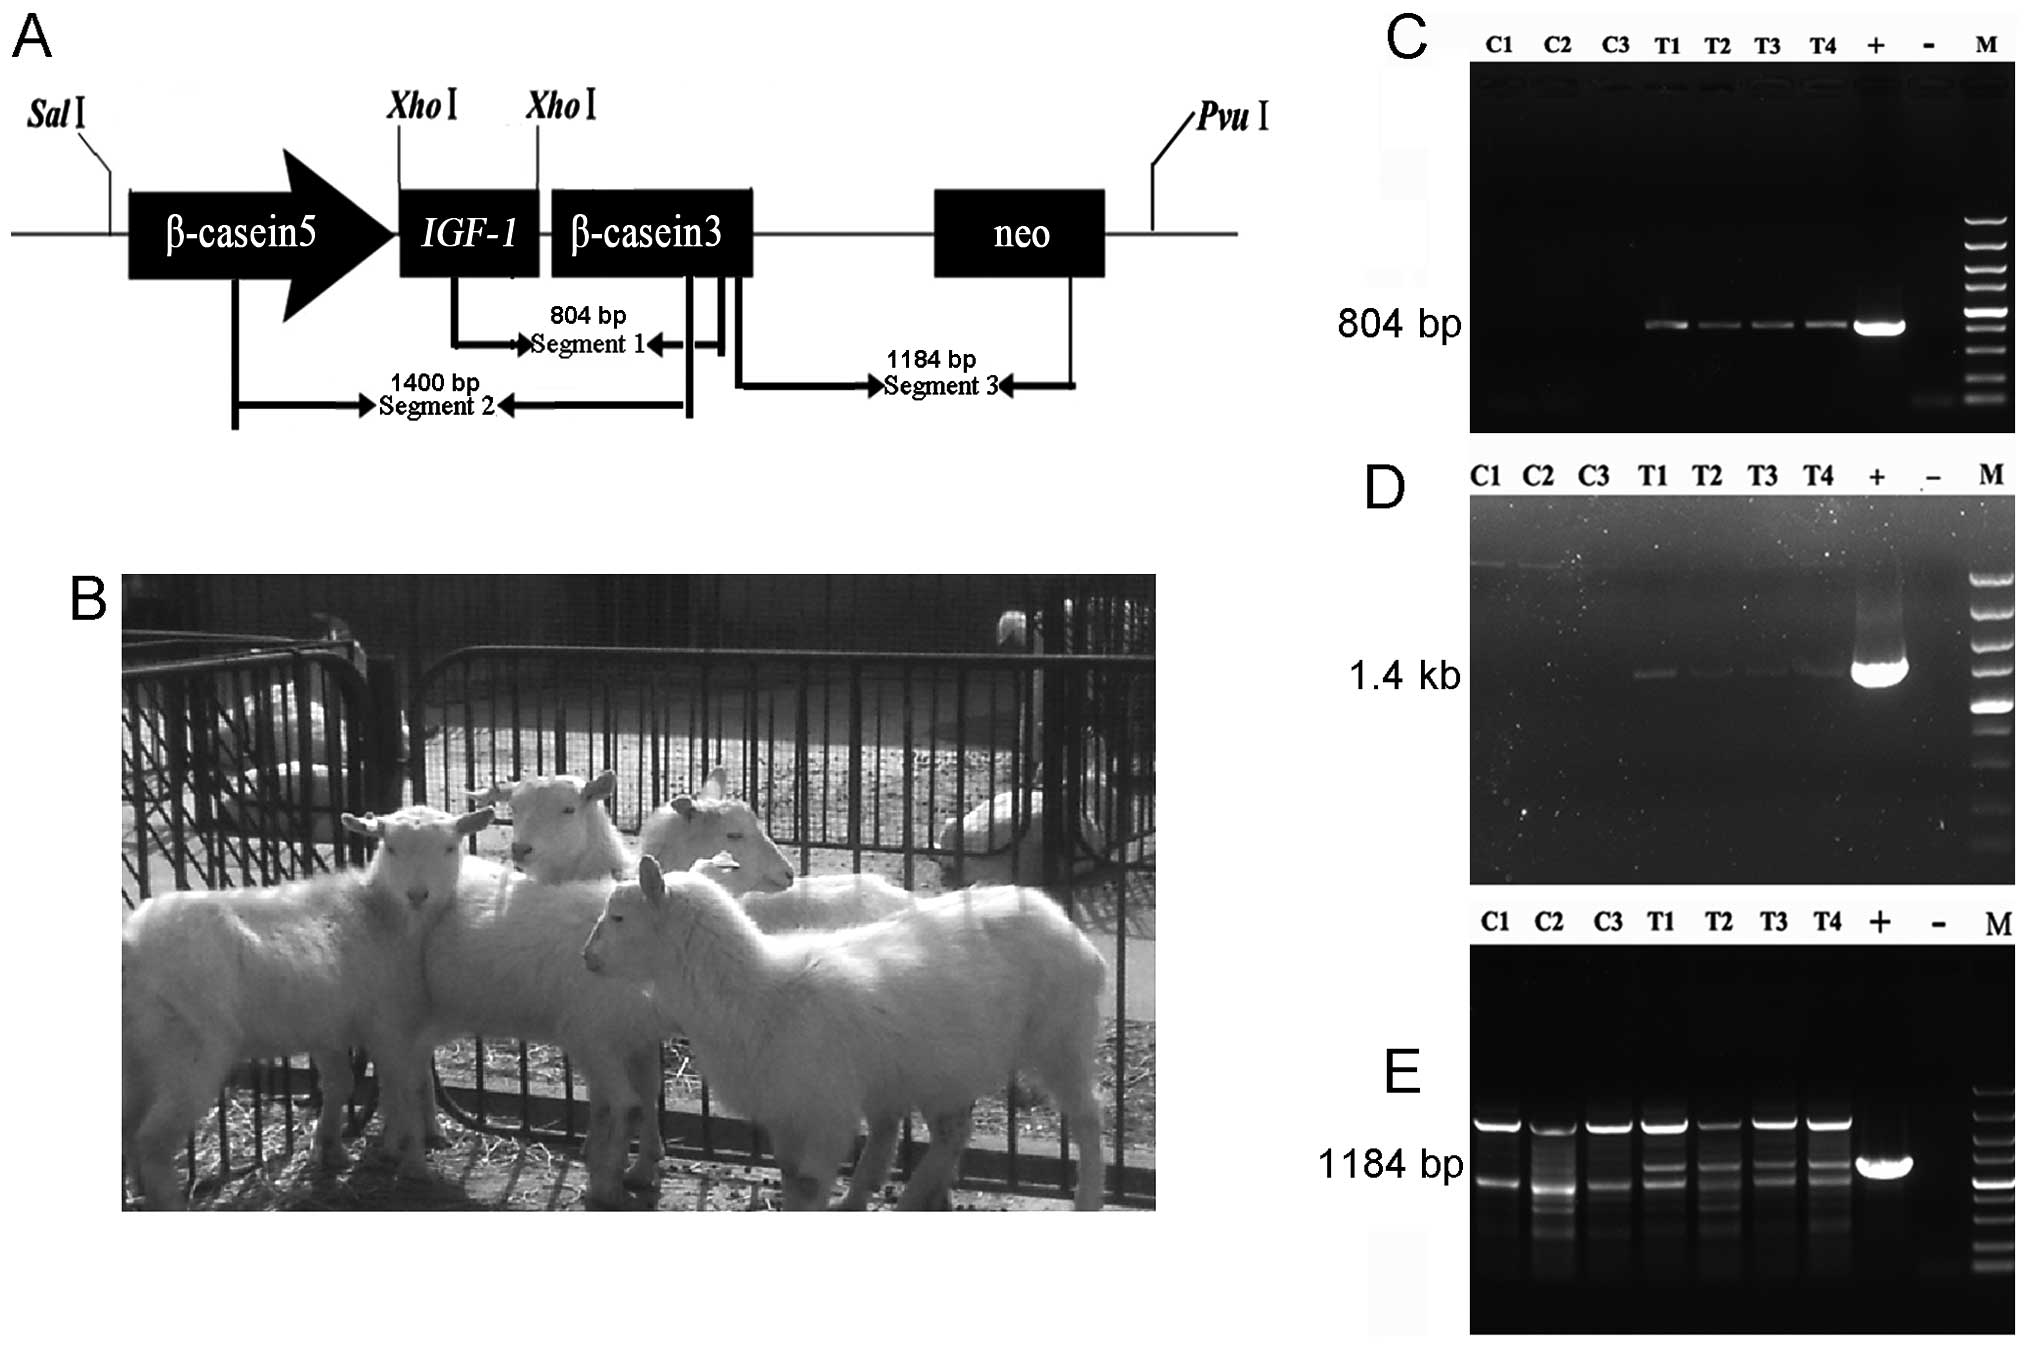 | Figure 1The production of IGF-1 transgenic
goats and its identification. (A) The schematic diagram of vector
pIN and primer design map (β-casein 5, β-casein promoter genes of
goat; IGF-1, insulin-like growth factor I gene of goat; β-casein 3,
β-casein genomic fragment; neo, neomycin resistance gene. (B) IGF-1
transgenic goats (four healthy kids were born and survived to
maturity). (C) The identification of IGF-1 from IGF-1 to 3′
β-castein; (C1, C2 and C3, control goats; T1, T2, T3 and T4, IGF-1
transgenic goats; +, mammary gland-specific expression vector pIN;
-, negative ; M, Marker DNA/Trans2K Plus). (D) The identification
of IGF-1 from 3′ β-castein to 5′ β-castein; (E) the identification
of neo from 3′ β-castein to neo. |
 | Table IqPCR primers designed for detecting
copy number. |
Table I
qPCR primers designed for detecting
copy number.
| Name | Sequence
(5′-3′) | Size (bp) |
|---|
| 1F |
ACATCCTCCTCGCATCTCTTC | 804 |
| 1R |
CCTTCTTAGGTTTGTTATTCTTAGCC | 804 |
| 2F |
CATTGTTTGATCATATGCACCTC′ | 1441 |
| 2R |
CCTTCTTAGGTTTGTTATTCTTAGCC | 1441 |
| 3F |
CTCTGGTTCCTCTGCCTTTTC | 1184 |
| 3R |
ATCTCCTGTCATCTCACCTTGC | 1184 |
Southern blot analysis
Southern blotting hybridization was carried out with
the DIG system (F. Hoffmann-La Roche AG, Basel, Switzerland)
according to the manufacturer’s instructions. Briefly, 30 μg
genomic DNA from four cloned goats and three control goats were
digested with HindIII/EcoRI and separated on a 1.0%
agarose gel. Plasmid pIN was also digested as a positive control.
The gels were blotted onto nylon-N+ membrane (Whatman
plc., Maidstone, England) overnight in 20X SSC buffer. As a probe,
804 bp amplified fragments were labeled with DIG-11-dUTP using the
PCR DIG Probe Synthesis kit and hybridized to the membrane at 45°C
overnight in DIG Easy Hyb solution (both from F. Hoffmann-La Roche
AG). Detection was performed with the DIG Wash and Block Buffer Set
(F. Hoffmann-La Roche AG). The DIG-labeled probe was detected with
anti-digoxigenin AP Fab fragment and visualized with nitroblue
tetrazolium chloride and 5-bromo-4-chloro-3-indolyl-phosphate
(NBT/BCIP) solution (both from F. Hoffmann-La Roche AG).
Detection of qPCR
To examine the copy numbers of the IGF-1 gene
in transgenic goat, it was essential to construct a standard curve
(7). First, a series of standard
samples containing 1, 4, 16, 64, 256 and 1,024 copies of the
IGF-1 gene, respectively, were prepared by mixing the
wild-type genome of a Saanen dairy goat with plasmid pIN. A
standard curve was drawn by plotting ΔCt (ΔCt = CtIGF-1
− CtGAPDH) against the log of IGF-1 gene copies
of corresponding standard samples. qPCR was performed with SYBR
Premix Ex Taq (Takara Bio Inc., Otsu, Japan) on a 7500 real-time
PCR System (Applied Biosystems, Foster City, CA, USA) as follows:
95°C for 10 sec, followed by 40 two-step cycles at 95°C for 5 sec
and at 60°C for 34 sec. Primers for the IGF-1 and
GAPDH genes (GAPDH was amplified concurrently as an
endogenous control) are shown in Table II. A total volume of PCR (20 μl),
containing 2.0 μl 10X PCR buffer, 0.5X SYBR-Green I
deoxyribonucleoside triphosphates, 0.4 mmol/l dNTP, 1 unit Taq DNA
polymerase, 2.0 μl primers and 6 μl 20X diluted cDNA as the
template was also utilized. The Ct value was calculated by the
Sequence Detection System software (Applied Biosystem). The amount
of target normalized to reference was calculated by
2−ΔΔCt in qPCR. For each DNA sample (four IGF-1
transgenic goats and two non-transgenic goats), both the target and
reference genes were amplified independently on the same plate and
in the same experimental run in triplicate. The values are
presented as mean ± SEM. The Ct value was calculated by the
Sequence Detection System software (Applied Biosystems).
| Table IIqPCR primers designed for detecting
copy numbers. |
Table II
qPCR primers designed for detecting
copy numbers.
| Gene | Sense | Antisense |
|---|
| IGF-1 |
ATGCCAGTCACATCCTCCTC |
CTCCAGCCTCCTCAGATCAC |
| GAPDH |
GGGTGTTGTTATACTTCTCGTGGTT |
GTGATGCTGGTGCTGAGTATGTG |
TAIL-PCR analysis of the integration
site
To analyze the integration sites, TAIL-PCR was
performed employing three transgene-specific primers and five
arbitrary degenerate primers (AD1, AD2, AD3, AD4 and AW). Fig. 2A shows the schematic relationship
between the specific primers and arbitrary degenerate primers with
the target genomic sequence or flanking sequence of IGF-1
transgenic insertion. All the primers used in this study were
purchased from Invitrogen Co., Ltd. (Shanghai, China) and are
listed in Table III. The
TAIL-PCR process included three sequential PCR reactions (Table IV). TAIL-PCR protocol was
performed according to the method described by Liu et al
(27). Briefly, the primary PCR
reaction contained recovered HindIII/EcoRI-digested
template (two types of template were used; one was a fragment <4
kb, while the other was a fragment >4 kb), 2.5 mM each dNTPs,
0.6 μM of SP1 primer, 2 μm of the AD primer, and 1 unit of Taq
polymerase in 20 μl reaction buffer. In the secondary or tertiary
round, 1 μl of 10-fold diluted first or secondary products were
used as templates and supplemented in the reaction. The thermal
cycling conditions are shown in Table
V. The products of tertiary TAIL-PCR reaction were separated on
a 1.0% agarose gel. Specific bands for each set were purified using
a gel purification kit (Omega Bio-Tek, Inc., Norcross, GA, USA) and
sequenced. Sequencing results were analyzed using the BLAST and
NCBI databases for bovine genomic DNA to identify the specific
chromosomal integration sites.
| Table IIIPrimers designed for TAIL-PCR. |
Table III
Primers designed for TAIL-PCR.
| Primer | Sequence |
|---|
| AD1 |
TGCACCACTGGACTGAGCGGCCGCVNVNNNGGAA |
| AD2 |
TGCACCACTGGACTGAGCGGCCGCBNBNNNGGTT |
| AD3 |
TGCACCACTGGACTGAGCGGCCGCVVNVNNNCCAA |
| AD4 |
TGCACCACTGGACTGAGCGGCCGCVBNBNNNCGGT |
| AW |
TGCACCACTGGACTGA |
| Special
primers |
| SalI3 |
GAGAAGCGTTCAGAGGAAAGCGATC |
| SalI2 |
CTCAAAGAGCAGCGAGAAGCGTTC |
| SalI1 |
CAGGCCGTTCTATGATTCTGTCATTC |
| PvuI3 |
CGCCGCATACACTATTCTCAGAATG |
| PvuI2 |
CAACTCGGTCGCCGCATACACTATTC |
| PvuI1 |
CTTTTAAAGTTCTGCTATGTGGCGCG |
| Table IVThe reaction system of TAIL-PCR. |
Table IV
The reaction system of TAIL-PCR.
| Reaction
composition | First round | Second round | Third round |
|---|
| 10X ExTaq
buffer | 2 | 2 | 5 |
| 2.5 Mmol/l
dNTP | 1 | 1 | 2 |
| 10 μmol/l AD | 2 | 1 | 2 |
| 10 μmol/l SP | 0.6 | 1 | 2 |
| Ex Taq/(5
U/μl) | 0.2 | 0.2 | 0.5 |
|
ddH2O | Add to 20 μl | Add to 25 μl | Add to 50 μl |
| Template | Genomic DNA
digested with HindIII/EcoRI | 1 μl of 10-fold
diluted the first products | 1 μl of 10-fold
diluted the secondary products |
| Table VThe thermal cycling conditions of
TAIL-PCR. |
Table V
The thermal cycling conditions of
TAIL-PCR.
| Reaction steps | First reaction | Second
reaction | Third reaction |
|---|
|
|
|
|---|
| Temperature
time | Temperature
time | Temperature
time |
|---|
| 1 | 94 | 1 min | 94 | 1 min | 94 | 1 min |
| 2 | 98 | 1 min | 94 | 30 sec | 94 | 30 sec |
| 3 | 94 | 30 sec | 64 | 1 min | 64 | 1 min |
| 4 | 68 | 1 min | 72 | 2 min | 72 | 2 min |
| 5 | 72 | 2 min | 94 | 30 sec | 94 | 30 sec |
| 6 | Go to step 3 | 5 times | 64 | 1 min | 64 | 1 min |
| 7 | 94 | 30 sec | 72 | 2min | 72 | 2 min |
| 8 | 25 | 3 min | 94 | 30 sec | 94 | 30 sec |
| 9 | 72 | 2 min | 44 | 1 min | 44 | 1 min |
| 10 | 94 | 30 sec | 72 | 2 min | 72 | 2 min |
| 11 | 64 | 1 min | Go to step 2 | 15 times | Go to step 2 | 15 times |
| 12 | 72 | 2 min | 72 | 10 min | 72 | 10 min |
| 13 | 94 | 30 sec | | | | |
| 14 | 64 | 1 min | | | | |
| 15 | 72 | 2 min | | | | |
| 16 | 94 | 30 sec | | | | |
| 17 | 44 | 1 min | | | | |
| 18 | 72 | 2 min | | | | |
| 19 | Go to step 10 | 15 times | | | | |
| 20 | 72 | 10 min | | | | |
Results
Generation of transgenic goats
In total, 50 donor goats were used in this study,
with 388 in vivo matured oocytes being recovered. In
addition, 375 oocytes were enucleated and produced
karyoplast-cytoplast couplets using prepared donor cells.
Subsequent to fusion, a total of 221 reconstructed embryos were
obtained. Reconstructed pronuclear-stage embryos were transferred
into 46 synchronized recipients, which produced 23 (50%)
pregnancies at day 35. Four healthy kids were born and survived to
maturity (Fig. 1B).
PCR detecting of transgenic goats
When four cloned goats were previously generated by
SCNT, the first step was to identify whether these cloned goats
were IGF-1 transgenic goat. PCR was carried out with three pairs of
primers to analyze the cloned goats. Results showed that the four
goats that survived to maturity were IGF-1 transgenic. Fig. 1C and D show that the IGF-1
gene was integrated into the genome of four cloned goats, while
there was no target band in the non-transgenic control goats.
Sequencing results showed that the inserted IGF-1 was consistent
with the plasmid pIN, without any mutations. Fig. 1E shows that four clone goats
contained the IGF-1 gene in their genome, and included the
resistance gene (neo).
Southern blotting identification of
transgenic goats
After PCR detection, we verified that plasmid pIN
was integrated into the genomic DNA of transgenic goats using
southern blotting. Southern blotting, a highly accurate and
sensitive technology, has been widely used in the identification of
genetically modified products, especially when the transferred
genes were highly homologous with endogenous genomic DNA. For
detection of southern blotting, a probe was designed and amplified
(Fig. 2A). Fig. 3A shows a clear band on the NC
member only in the four IGF-1 transgenic goat lanes and positive
plasmid pIN lane. This result, consistent with the PCR results,
proved that the four clone goats were IGF-1 transgenic goats.
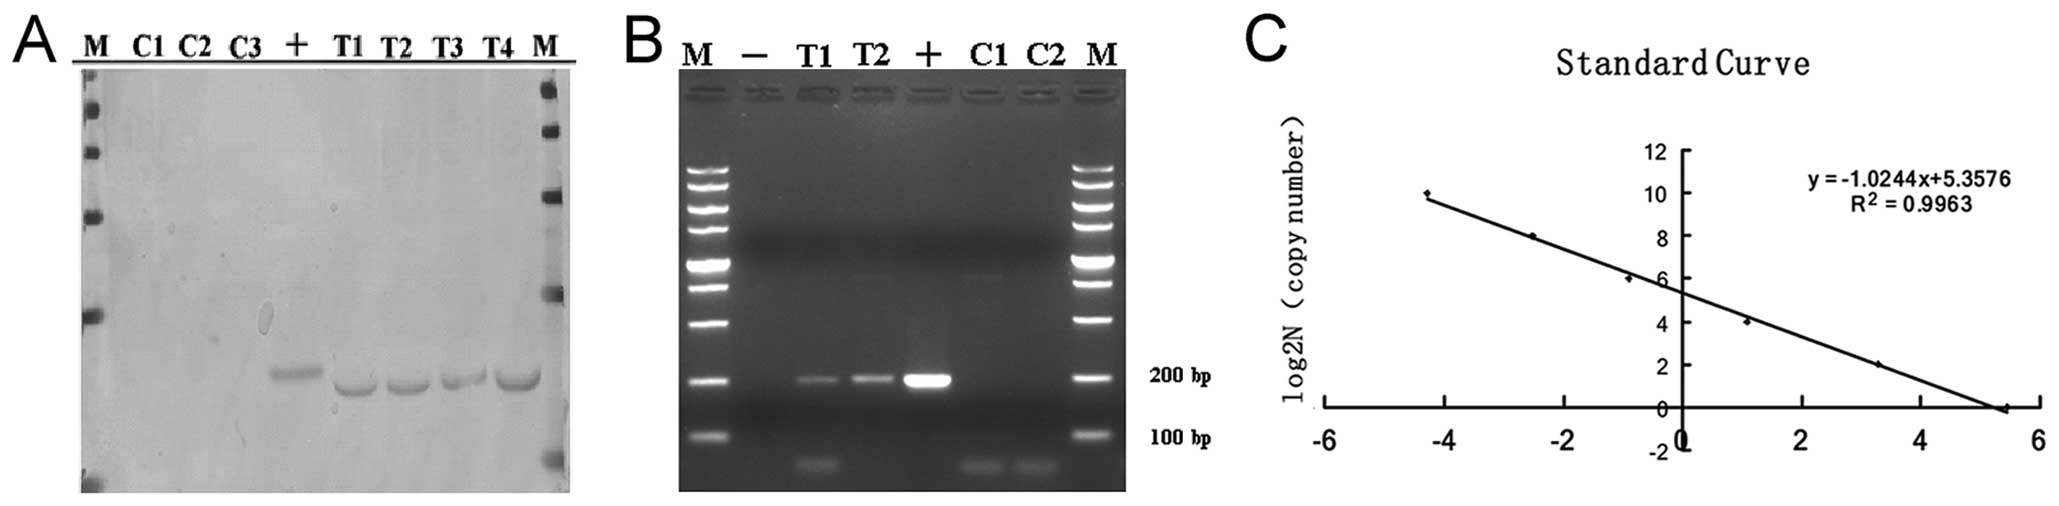 | Figure 3Southern blotting identification
result of the cloned goat (genomic DNA was digested with
HindIII/EcoRI, plasmid pIN was digested as positive
control. A total of 804 bp fragments from IGF-1 to 3′ β-casein was
amplified as a probe). (A) Southern blotting identification result
of the cloned goat (lanes C1, C2 and C3, control goats; lanes T1,
T2, T3 and T4, IGF-1 transgenic goats; lane +, positive control
(mammary gland-specific expression vector pIN); M, DL1000 bp
marker). (B) The PCR products of absolute quantitative primers
(lanes C1 and C2, control goats; lanes T1 and T2, IGF-1 transgenic
goats; lane +, positive control (mammary gland-specific expression
vector pIN); M: DL2000 bp marker). (C) Establishment of the
absolute quantitative standard curve. The standard samples
containing 1, 4, 16, 64, 256 and 1,024 copies of the IGF-1 gene
were prepared. The absolute quantitative standard curve was drawn
by plotting ΔCt (ΔCt = CtIGF-1 − CtGAPDH)
against the log of IGF-1 gene copies of corresponding standard
samples. |
Copy number analysis of the IGF-1 gene in
transgenic goats
Since the copy number of transgenes may greatly
affect the expression of the target genes, we determined the copy
numbers by qPCR. The absolute quantitative standard curve was drawn
by plotting ΔCt (ΔCt = CtIGF-1 − CtGAPDH)
against the log of IGF-1 gene copies of corresponding
standard samples (Table VI). The
standard curve was calculated as: log2N (copy number) = −1.0244ΔCt
+ 5.3576 (R2=0.9963) (Fig.
3C). Following construction of the standard curve, we
sequentially detected the copy numbers of transgenic goats with
qPCR. The reported Ct values were averaged for the triplicates
(Table VII). Using the
equation, the number of IGF-1 transgene copies of the four
transgenic goats were estimated (Table VI). Results determined that four
transgenic goats contained approximately the same number of copies
of the IGF-1 gene (7.89–9 copies), while no copies were
identified for the non-transgenic goats.
| Table VIStandard curve conversion. |
Table VI
Standard curve conversion.
| Copy no. | Ct (IGF-1) | Ct (GAPDH) | ΔC(t) |
|---|
| 1 | 25.51 | 20.07 | 5.45 |
| 4 | 23.38 | 20.09 | 3.28 |
| 16 | 21.34 | 20.26 | 1.08 |
| 64 | 19.4 | 20.3 | −0.9 |
| 256 | 17.81 | 20.33 | −2.53 |
| 1,024 | 16.19 | 20.48 | −4.29 |
| Table VIICopy numbers of IGF-1 in transgenic
goats. |
Table VII
Copy numbers of IGF-1 in transgenic
goats.
| Goat names | Ct (IGF-1) | Ct (GAPDH) | ΔC(t) | log2N (copy
no.) | Copy no. |
|---|
| Wild-type 1 | 33.62 | 21.2 | 12.42 | −7.36 | |
| Wild-type 2 | 32.99 | 21.65 | 11.34 | −6.25 | |
| IGF-1–1 | 23.78 | 21.64 | 2.14 | 3.17 | 9.00 |
| IGF-1–2 | 23.64 | 21.44 | 2.2 | 3.1 | 8.57 |
| IGF-1–3 | 24.46 | 22.17 | 2.29 | 3.01 | 8.06 |
| IGF-1–4 | 24.12 | 21.8 | 2.32 | 2.98 | 7.89 |
Integration sites analysis of IGF-1 gene
in transgenic goats
Since the transgene integration site and the
resulting perturbation may greatly affect the expression of the
inserted gene and its neighbors, we performed TAIL-PCR with three
transgene specific primers and five arbitrary degenerate primers to
clone the flanking sequence. For T1 transgenic goat, two specific
fragments of ~1,500 and 2,000 bp in size were amplified when using
the combination of arbitrary primer AD2 and special primer
SalI3 at the third TAIL-PCR, while TAIL-PCR amplified three
specific fragments of ~500, 1,200 and 2,000 bp with primer AD2 and
special primer PvuI3 in T1 transgenic goat (Fig. 2B). No such specific bands were
amplified in the parallel negative control experiments using
non-transgenic goat genomic DNA as a template. For the T2
transgenic goat, a unique fragment of ~500 bp was amplified with
the arbitrary primer AD2 and special primer SalI3 and three
special fragments of ~500, 1,500 and 2,000 bp were amplified with
primer AD2 and special primer PvuI3 at the third TAIL-PCR
(Fig. 2B). These amplified DNA
fragments were cloned into plasmid pMD19-T and sequenced. The
sequenced DNA fragments were analyzed by Bio-edit. Results show
that the cloned bands from the SalI side contained a 69 bp
sequence of exogenous plasmid pIN SalI border region running
into a goat genomic DNA sequence. The amplified bands from the
PvuI side were consistent with the 160-bp sequence of
exogenous plasmid pIN PvuI border region in contiguity with
the goat genomic DNA sequence. These results suggested that the
junction sequences spanning the transgenic integration sites were
correctly revealed.
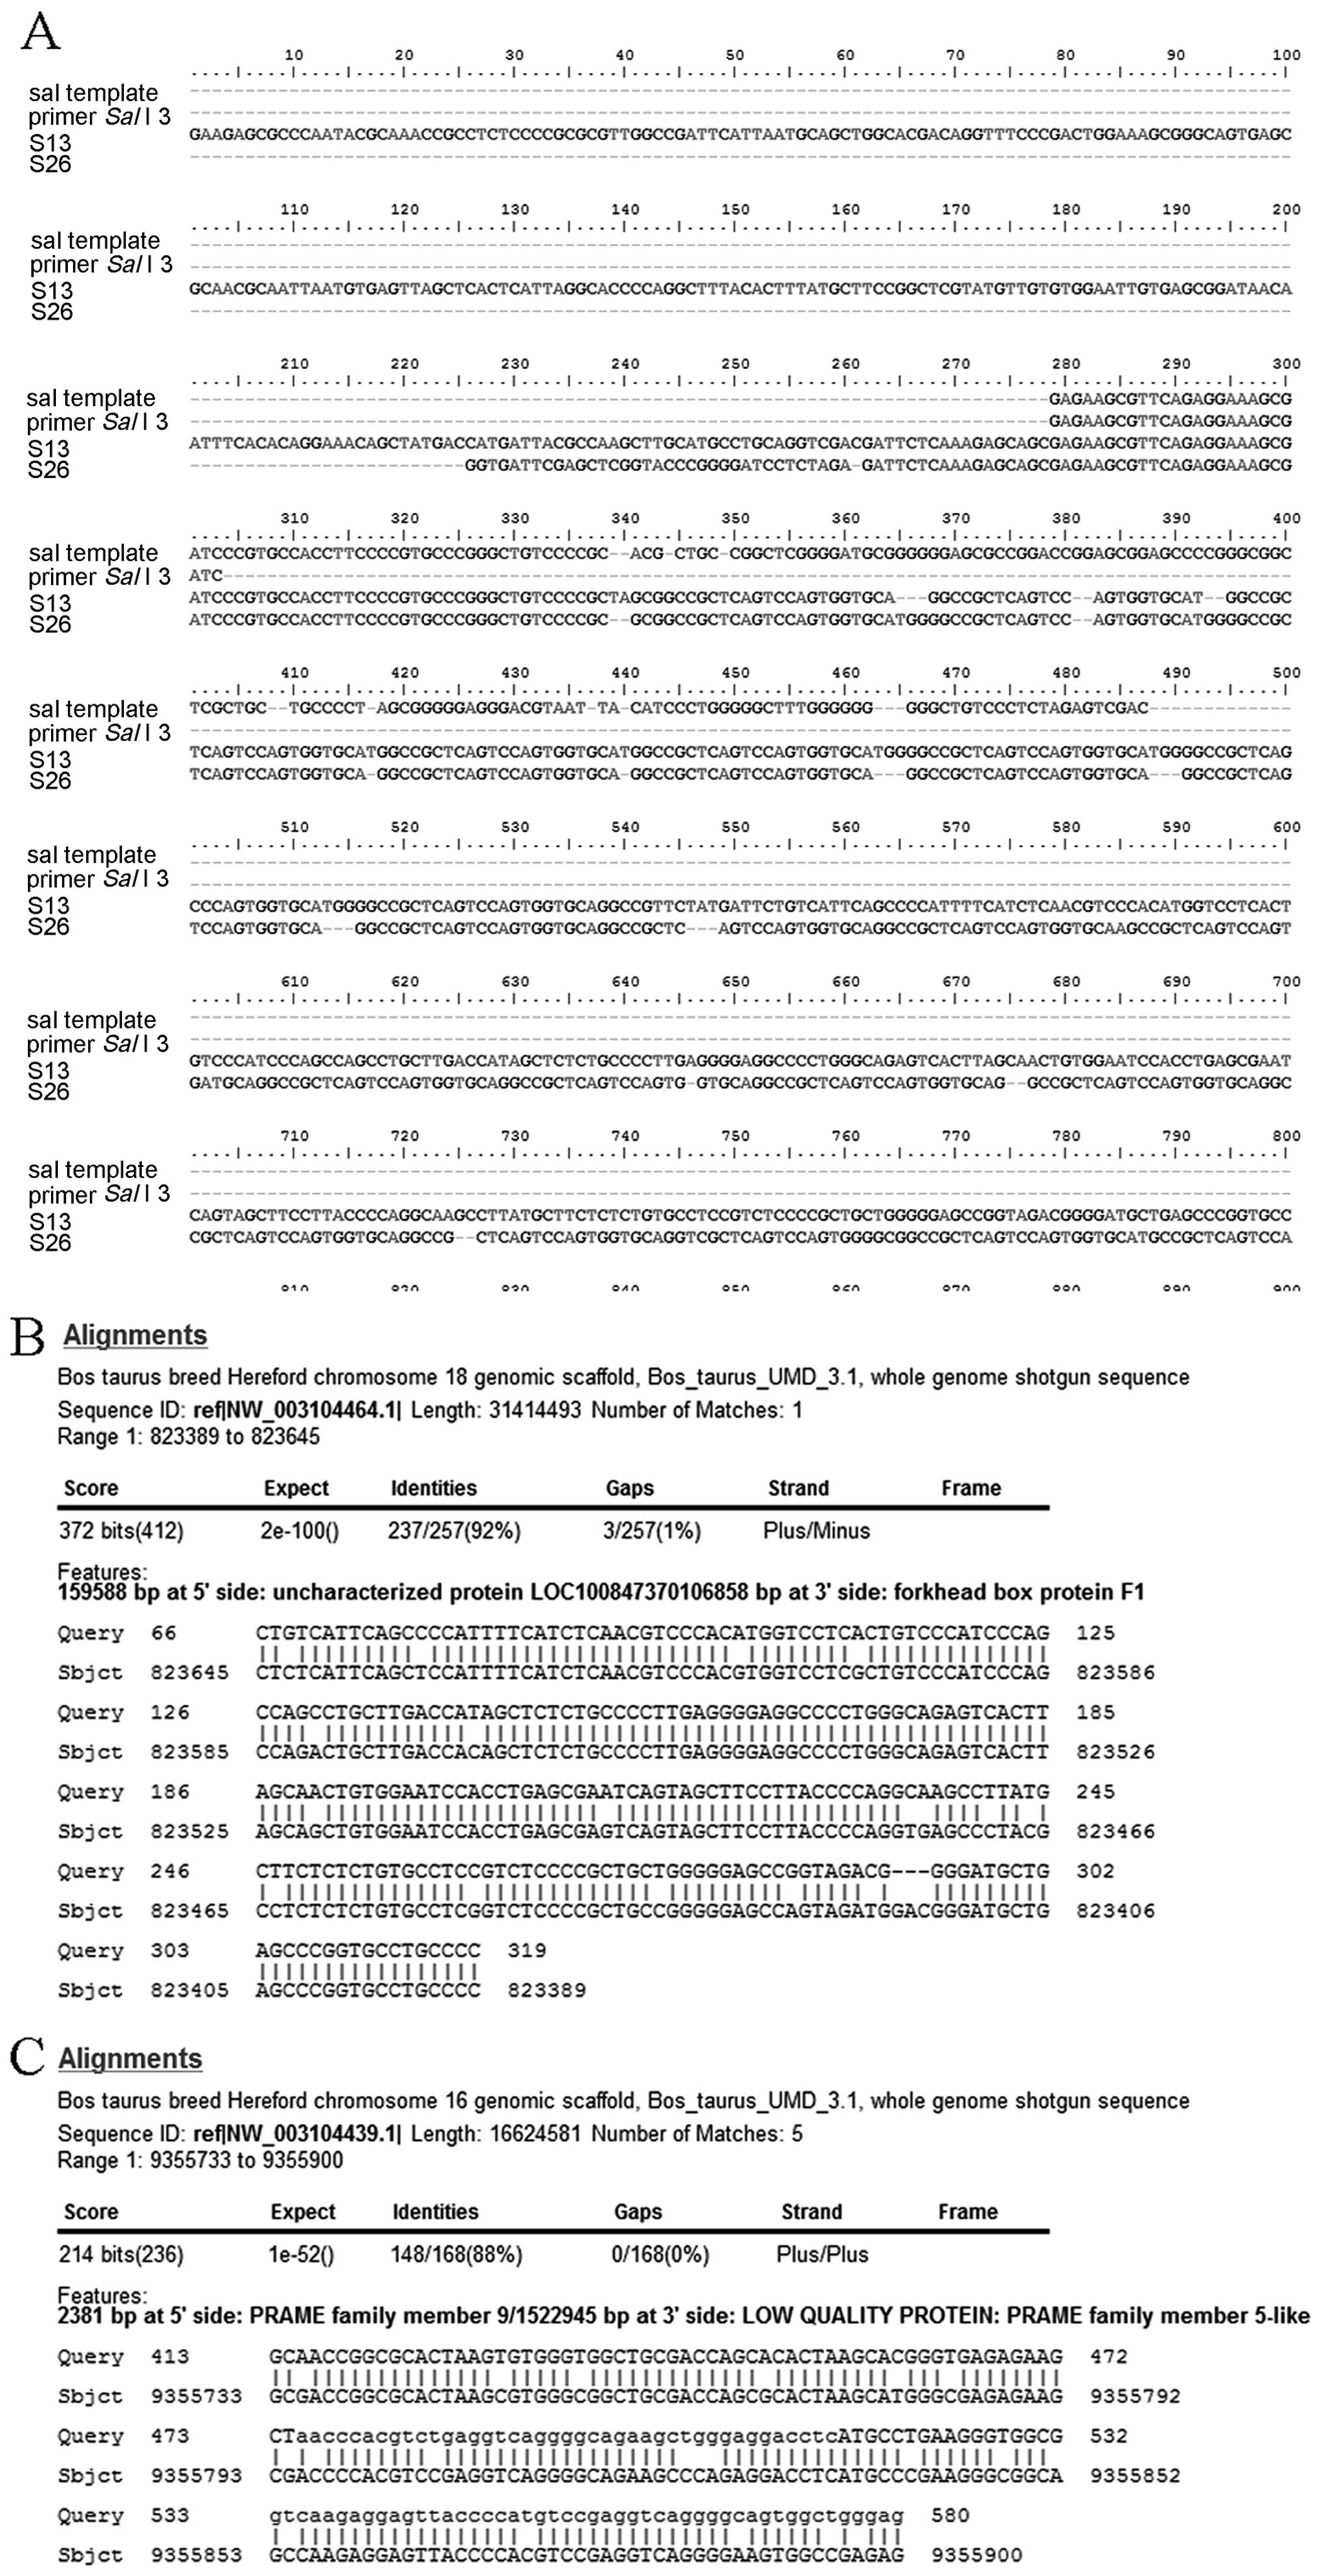
The BLAST results showed that two distinct sites of
integration were identified on the SalI border region, one
each on chromosomes 18 (GenBank ID: NM-3104464.1; range,
823,389–823,645, 92%) and 16 (GenBank ID: NM-003104439.1; range,
9,355,733–9,355,900, 88%) (Fig.
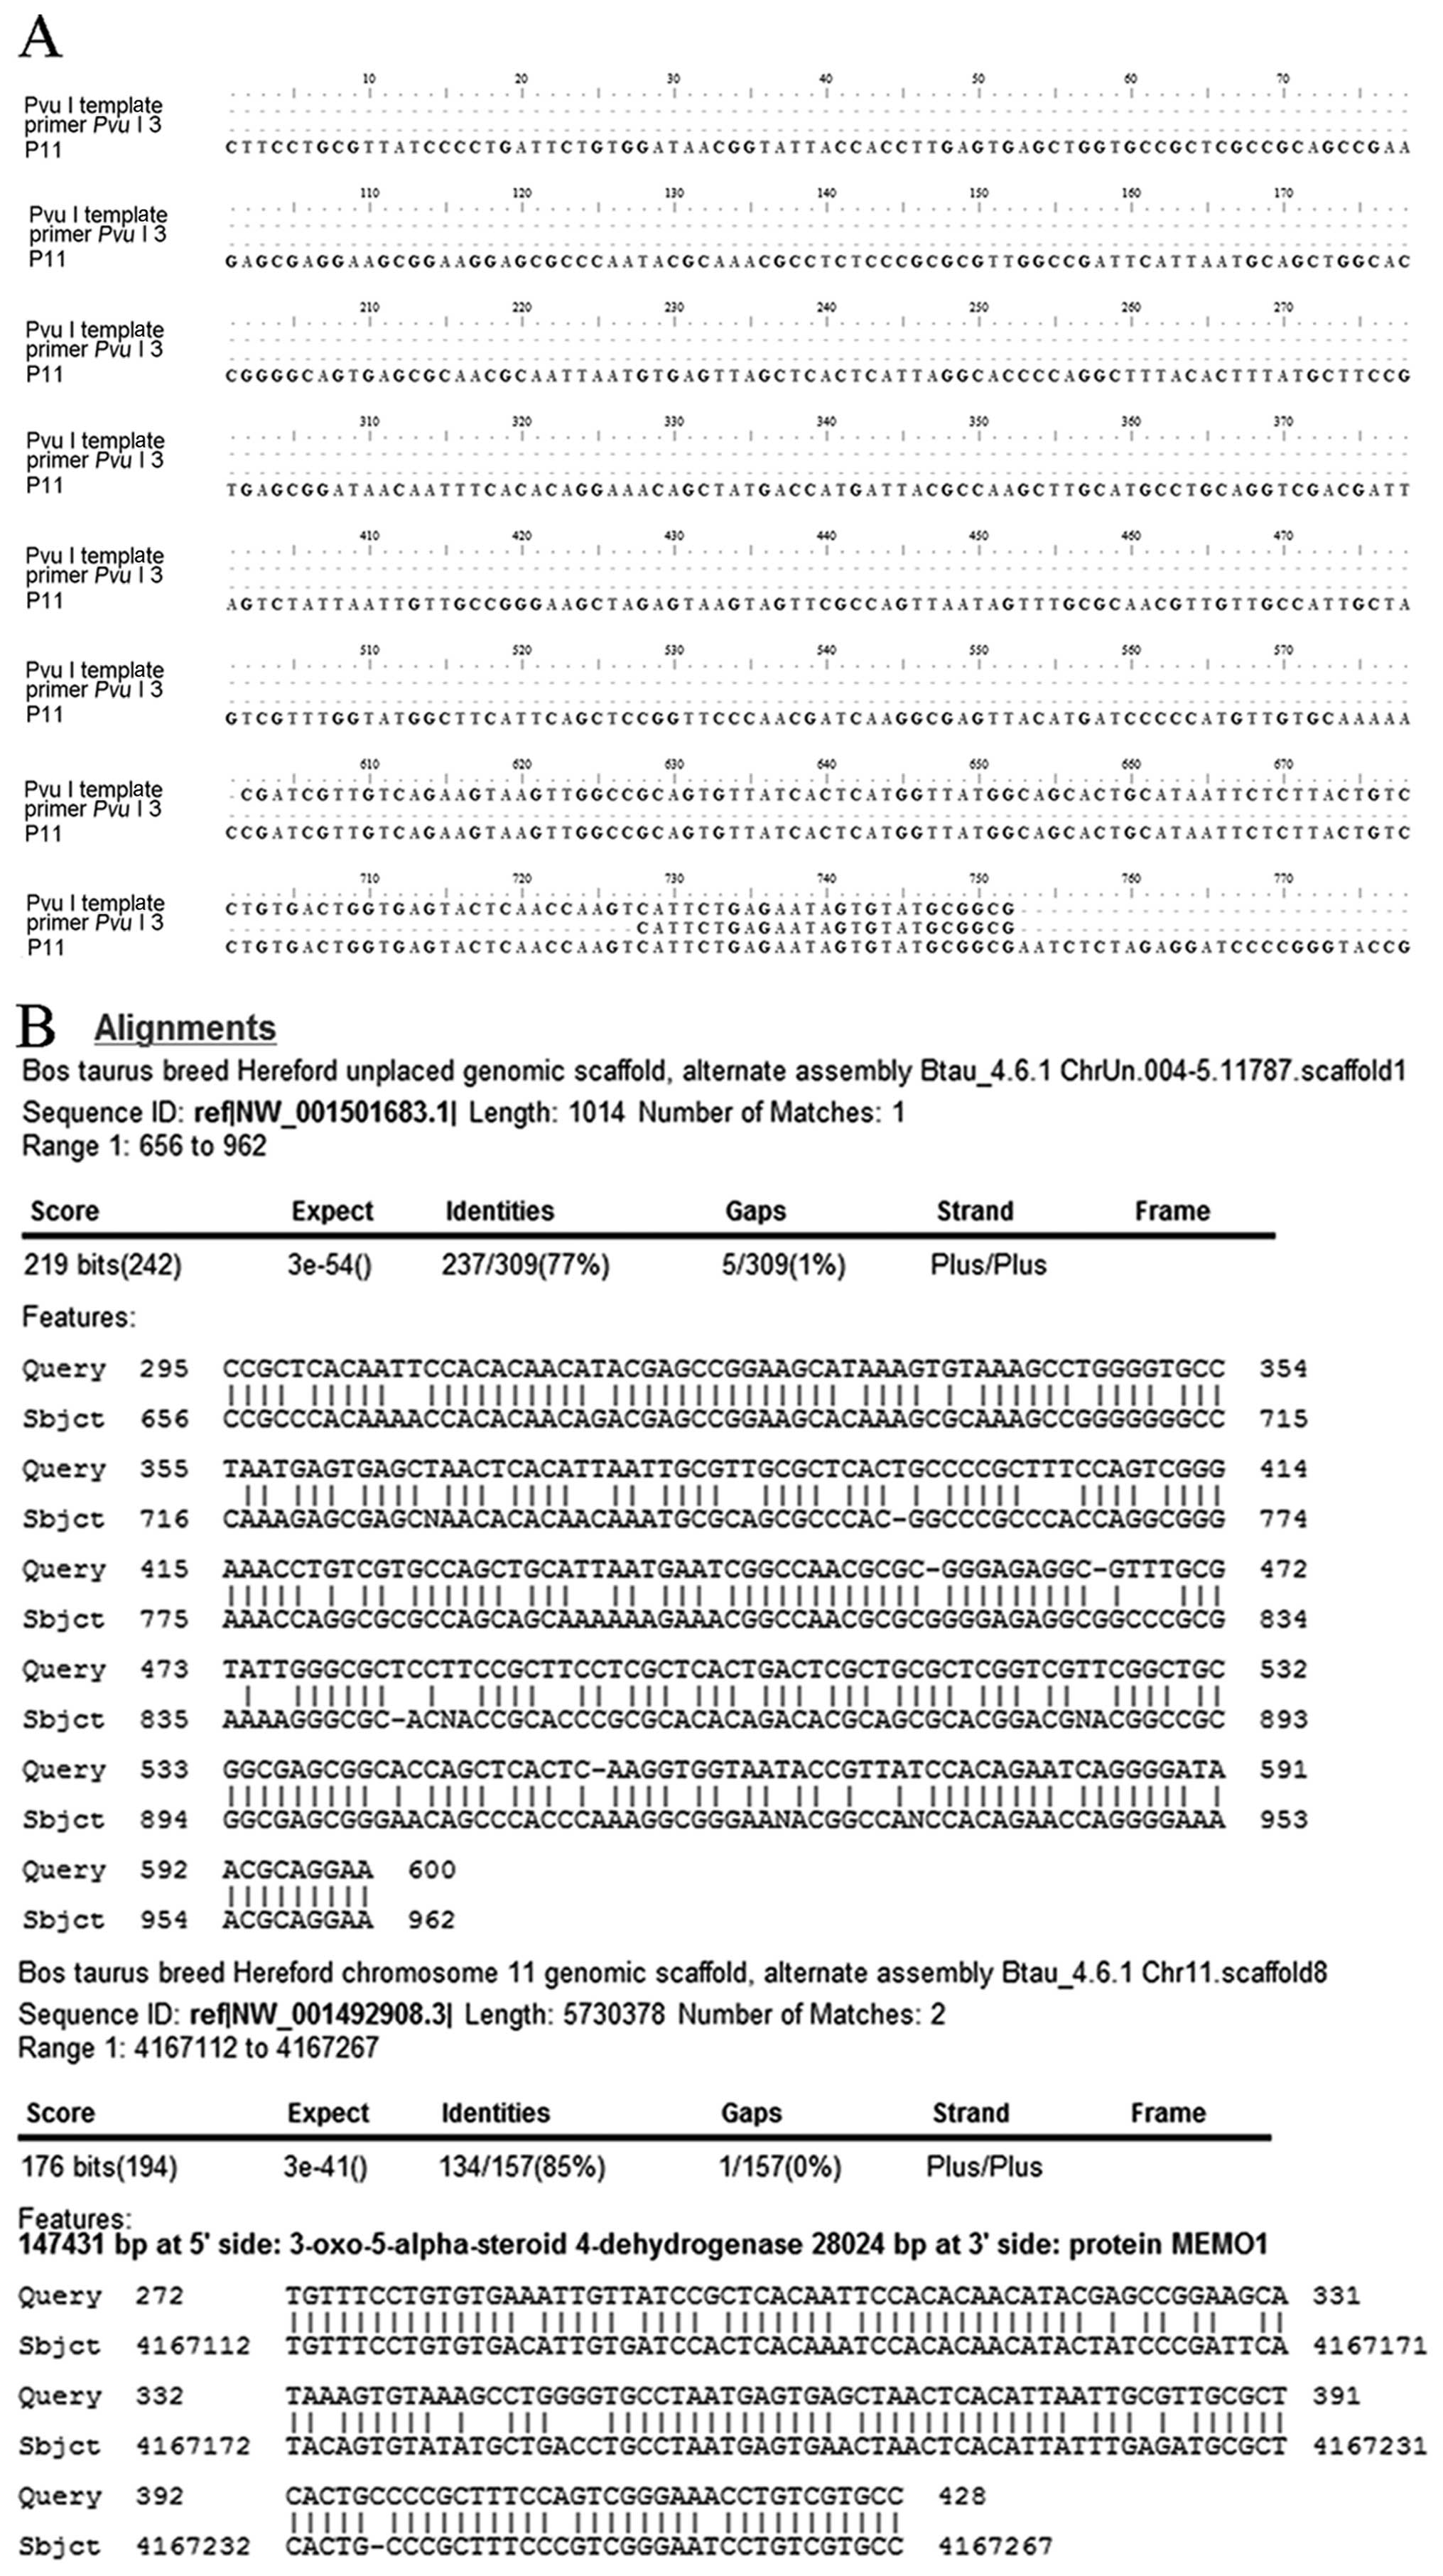
4). For the PvuI border region, we identified another
two distinct integration sites mapped to chromosome 11 (GenBank ID:
NM-001492908.3; range, 4,167,112–4,167,267, 85%) and 2 (GenBank ID:
NM-003103851.1; range, 11,847,579–11,847,774, 91%) (Fig. 5).
Discussion
The first transgenic livestock was generated almost
30 years ago (28). Currently, a
common method for producing transgenic livestock involves using
genetically modified cells in SCNT. Compared with conventional
transgenic technology, SCNT technology allows the evaluation of the
transferred gene in vitro, which may greatly improve the
safety of genetically modified animal by assessing positive donor
cells, and markedly reduce the probability of the transgene being
silenced in offspring (29–31). In this study, we obtained four
IGF-1 transgenic goats, which were developed to adolescence and
expected to be bred in September 2013. The four goats have suitably
developed in body and mammary gland, without any disease.
To evaluate the transgenically cloned goat for
commercial use, the transgene copies and integration sites should
be identified. The transgene in the present study was a 465 bp
IGF-1 fragment in the pBC1 vector. PCR and southern blotting
results demonstrated that all four goats were IGF-1 transgenic
goats. It is known that the transgene may randomly integrate into
any site of the genome, the integration site and copies may be
influenced by the insert time, plasmid form and insert position
(32). Both the number of copies
are presently known to integrate and the genomic context of the
transgene has been proven to influence the phenotype of the
transgenic animal (7,33,34). The high copy number tandem
integration was thought to lead to transgene silencing (35,36) and the high copy number may
decrease with aging in transgenic animals. Ballester et al
and Vaisman detected the copies of transgenic animal using qPCR
methods (11,37). The study by Kong et al
suggested that the transgene expression level is associated with
the copy number in transgenic pigs (7). In this study, we aimed to identify
the copy numbers in IGF-1 transgenic goats with qPCR. qPCR is
considered a simple, rapid and accurate method to estimate the
transgene copy number in transgenic animals. By using this method,
we revealed that four transgenic goats contained almost the same
copy numbers of the transferred IGF-1 gene in goat genome
(from 7.89 to 9 copies). For a similar copy number of the four
transgenic goats, the same donor cell may be an appropriate
explanation.
Following evaluation of the copy numbers of IGF-1
transgenic goats, we detected the integration sites of the
transgenic goats, which primarily affect the transgene expression.
The integration site has been proven to affect the level and time
of transgene expression (38,39). In transgenic mouse, the same
transferred gene would be transcribed in different time periods for
their different insert location (40). However, results of recent studies
have suggested that the integration site may not always be random
(42). Previously it was found
that in certain sites the transgene was inclined to integrate by
random transfection, such as LINE elements (41). However, random transfection may
not result in random integration but in some hot integration sites
and these hot integration sites may have a common character
allowing the transgene to integrate. Yan et al demonstrated
that the foreign fad2 behaved similar to an X-linked gene and that
foreign DNA molecules were inserted into the eukaryotic genome
through a homologous illegitimate random integration (42).
Considering the importance of identifying the
integration site, several PCR-based methods have been applied for
the precise determination of the integration site of foreign DNA
into native chromosomes. These methods include I-PCR, interspersed
repetitive sequence PCR (IRS-PCR), linear amplification-mediated
PCR (LAM-PCR) and TAIL-PCR. Of these, TAIL-PCR has obvious
advantages as it may be used to identify homozygous animals
(14,15). TAIL-PCR has been widely used for
genome walking and flanking sequence cloning in transgenic animals.
In TAIL-PCR, enrichment of the target products depends on the
difference in amplification velocity between the target and
non-target products (13,24). In this study, we improved the
TAIL-PCR methods. The performance of TAIL-PCR was strongly
dependent on the PCR efficiency and specificity. The improved
methods entailed one more digestion reaction. When we performed the
TAIL-PCR, we first digested the template goat genome DNA by
HindIII and EcoRI, which was used in southern
blotting identification. The digested genome was run on 0.8%
agarose gel and then recovered; the fragments were >4 or <4
kb. TAIL-PCR with subsequently performed using the two types of
templates as described in a previous section. The digested step was
used to increase the specificity of target genes. Compared with
conventional TAIL-PCR, our methods divided possible integration
site into two sections, increasing the efficiency of TAIL-PCR,
particularly for the template <4 kb. The results suggest that
the improved TAIL-PCR was more efficient than conventional TAIL-PCR
for cloning flanking sequences. Using these modified methods, we
identified the integration sites NM-001492908.3, NM-003103851.1,
NM-003104439.1, NM-3104464.1.
In conclusion, PCR-based techniques have been widely
used for the precise transgene flanking sequence and copy number
identification in molecular biology research. The present study has
demonstrated the successful use of PCR and southern blotting to
characterize four cloned goats as IGF-1 transgenic goats. The qPCR
method clarified the copy numbers of the IGF-1 gene in
transgenic goats. Furthermore, using the TAIL-PCR approach, we
identified four integration sites with high specificity and
provided information on the chromosomal location. The future
application of TAIL-PCR to characterize transgenic animals is
likely to be extremely significant.
Acknowledgements
This study was supported by the National Animal
Transgenic Breeding Grand Project of China (no. 2013ZX08008-004)
and a project funded by the Priority Academic Program Development
of Jiangsu Higher Education Institutions.
References
|
1
|
Houdebine LM: The methods to generate
transgenic animals and to control transgene expression. J
Biotechnol. 98:145–160. 2002. View Article : Google Scholar : PubMed/NCBI
|
|
2
|
Maksimenko OG, Deykin AV, Khodarovich YM
and Georgiev PG: Use of transgenic animals in biotechnology:
prospects and problems. Acta Naturae. 5:33–46. 2013.PubMed/NCBI
|
|
3
|
Ménoret S, Tesson L, Rémy S, et al:
Technical advances in the generation of transgenic animals and in
their applications. Transgenic Res. 22:1065–1072. 2013.PubMed/NCBI
|
|
4
|
Niemann H, Kues W and Carnwath JW:
Transgenic farm animals: present and future. Rev Sci Tech.
24:285–298. 2005.PubMed/NCBI
|
|
5
|
Zhang R, Yin Y, Zhang Y, et al: Molecular
characterization of transgene integration by next-generation
sequencing in transgenic cattle. PLoS One. 7:e503482012. View Article : Google Scholar : PubMed/NCBI
|
|
6
|
Chandler KJ, Chandler RL, Broeckelmann EM,
Hou Y, Southard-Smith EM and Mortlock DP: Relevance of BAC
transgene copy number in mice: transgene copy number variation
across multiple transgenic lines and correlations with transgene
integrity and expression. Mamm Genome. 18:693–708. 2007. View Article : Google Scholar : PubMed/NCBI
|
|
7
|
Kong Q, Wu M, Huan Y, et al: Transgene
expression is associated with copy number and cytomegalovirus
promoter methylation in transgenic pigs. PLoS One. 4:e66792009.
View Article : Google Scholar : PubMed/NCBI
|
|
8
|
Pena RN, Webster J, Kwan S, Korbel J and
Whitelaw BA: Transgene methylation in mice reflects copy number but
not expression level. Mol Biotechnol. 26:215–220. 2004. View Article : Google Scholar : PubMed/NCBI
|
|
9
|
Garrick D, Fiering S, Martin DI and
Whitelaw E: Repeat-induced gene silencing in mammals. Nat Genet.
18:56–59. 1998. View Article : Google Scholar
|
|
10
|
Hogan B: Molecular biology. Enhancers,
chromosome position effects, and transgenic mice. Nature.
306:313–314. 1983. View
Article : Google Scholar : PubMed/NCBI
|
|
11
|
Ballester M, Castelló A, Ibáñez E, Sánchez
A and Folch JM: Real-time quantitative PCR-based system for
determining transgene copy number in transgenic animals.
Biotechniques. 37:610–613. 2004.PubMed/NCBI
|
|
12
|
Mitrecić D, Huzak M, Curlin M and Gajović
S: An improved method for determination of gene copy numbers in
transgenic mice by serial dilution curves obtained by real-time
quantitative PCR assay. J Biochem Biophys Methods. 64:83–98.
2005.PubMed/NCBI
|
|
13
|
Huang H, Wang G, Zhao Y, Shi P, Luo H and
Yao B: Direct and efficient cloning of full-length genes from
environmental DNA by RT-qPCR and modified TAIL-PCR. Appl Microbiol
Biotechnol. 87:1141–1149. 2010. View Article : Google Scholar : PubMed/NCBI
|
|
14
|
Singer T and Burke E: High-throughput
TAIL-PCR as a tool to identify DNA flanking insertions. Methods Mol
Biol. 236:241–272. 2003.PubMed/NCBI
|
|
15
|
Thanh T, Chi VT, Abdullah MP, Omar H and
Napis S: Efficiency of ligation-mediated PCR and TAIL-PCR methods
for isolation of RbcS promoter sequences from green microalgae
Ankistrodesmus convolutus. Mol Biol (Mosk). 46:64–70. 2012.
View Article : Google Scholar : PubMed/NCBI
|
|
16
|
Mason G, Provero P, Vaira AM and Accotto
GP: Estimating the number of integrations in transformed plants by
quantitative real-time PCR. BMC Biotechnol. 2:202002. View Article : Google Scholar : PubMed/NCBI
|
|
17
|
Alexander GM, Erwin KL, Byers N, et al:
Effect of transgene copy number on survival in the G93A SOD1
transgenic mouse model of ALS. Brain Res Mol Brain Res. 130:7–15.
2004. View Article : Google Scholar : PubMed/NCBI
|
|
18
|
Ganss R, Montoliu L, Monaghan AP and
Schutz G: A cell-specific enhancer far upstream of the mouse
tyrosinase gene confers high level and copy number-related
expression in transgenic mice. EMBO J. 13:3083–3093.
1994.PubMed/NCBI
|
|
19
|
Zimonjic DB, Ullmannova-Benson V, Factor
VM, Thorgeirsson SS and Popescu NC: Recurrent and nonrandom DNA
copy number and chromosome alterations in Myc transgenic mouse
model for hepatocellular carcinogenesis: implications for human
disease. Cancer Genet Cytogenet. 191:17–26. 2009. View Article : Google Scholar
|
|
20
|
Pillai MM, Venkataraman GM, Kosak S and
Torok-Storb B: Integration site analysis in transgenic mice by
thermal asymmetric interlaced (TAIL)-PCR: segregating
multiple-integrant founder lines and determining zygosity.
Transgenic Res. 17:749–754. 2008. View Article : Google Scholar : PubMed/NCBI
|
|
21
|
Triglia T, Peterson MG and Kemp DJ: A
procedure for in vitro amplification of DNA segments that lie
outside the boundaries of known sequences. Nucleic Acids Res.
16:81861988. View Article : Google Scholar : PubMed/NCBI
|
|
22
|
Yuanxin Y, Chengcai A, Li L, Jiayu G,
Guihong T and Zhangliang C: T-linker-specific ligation PCR
(T-linker PCR): an advanced PCR technique for chromosome walking or
for isolation of tagged DNA ends. Nucleic Acids Res. 31:e682003.
View Article : Google Scholar : PubMed/NCBI
|
|
23
|
Liu YG and Whittier RF: Thermal asymmetric
interlaced PCR: automatable amplification and sequencing of insert
end fragments from P1 and YAC clones for chromosome walking.
Genomics. 25:674–681. 1995. View Article : Google Scholar : PubMed/NCBI
|
|
24
|
Tonooka Y and Fujishima M: Comparison and
critical evaluation of PCR-mediated methods to walk along the
sequence of genomic DNA. Appl Microbiol Biotechnol. 85:37–43. 2009.
View Article : Google Scholar : PubMed/NCBI
|
|
25
|
Lin J, Yu Q, Zhang Q and Yang Q:
Construction of mammary gland specific expression plasmid pIN and
its expression in vitro and in vivo. Afr J Biotechnol.
11:6946–6955. 2012.
|
|
26
|
Zou X, Wang Y, Cheng Y, et al: Generation
of cloned goats (Capra hircus) from transfected foetal
fibroblast cells, the effect of donor cell cycle. Mol Reprod Dev.
61:164–172. 2002.
|
|
27
|
Liu YG, Mitsukawa N, Oosumi T and Whittier
RF: Efficient isolation and mapping of Arabidopsis thaliana
T-DNA insert junctions by thermal asymmetric interlaced PCR. Plant
J. 8:457–463. 1995.
|
|
28
|
Hammer RE, Pursel VG, Rexroad CE Jr, et
al: Production of transgenic rabbits, sheep and pigs by
microinjection. Nature. 315:680–683. 1985. View Article : Google Scholar : PubMed/NCBI
|
|
29
|
Goissis MD, Suhr ST and Cibelli JB:
Effects of donor fibroblasts expressing OCT4 on bovine embryos
generated by somatic cell nuclear transfer. Cell Reprogram.
15:24–34. 2013.PubMed/NCBI
|
|
30
|
Niemann H and Lucas-Hahn A: Somatic cell
nuclear transfer cloning: practical applications and current
legislation. Reprod Domest Anim. 47(Suppl 5): 2–10. 2012.
View Article : Google Scholar : PubMed/NCBI
|
|
31
|
Zhao MT, Lin H, Liu FJ, et al: Efficiency
of human lactoferrin transgenic donor cell preparation for SCNT.
Theriogenology. 71:376–384. 2009. View Article : Google Scholar : PubMed/NCBI
|
|
32
|
Eszterhas SK, Bouhassira EE, Martin DI and
Fiering S: Transcriptional interference by independently regulated
genes occurs in any relative arrangement of the genes and is
influenced by chromosomal integration position. Mol Cell Biol.
22:469–479. 2002. View Article : Google Scholar
|
|
33
|
Bender B, Bodrogi L, Mayer B, et al:
Position independent and copy-number-related expression of the
bovine neonatal Fc receptor alpha-chain in transgenic mice carrying
a 102 kb BAC genomic fragment. Transgenic Res. 16:613–627. 2007.
View Article : Google Scholar
|
|
34
|
Rahman MA, Hwang GL, Razak SA, Sohm F and
Maclean N: Copy number related transgene expression and mosaic
somatic expression in hemizygous and homozygous transgenic tilapia
(Oreochromis niloticus). Transgenic Res. 9:417–427. 2000.
View Article : Google Scholar : PubMed/NCBI
|
|
35
|
Smith CJ, Nedwell DB, Dong LF and Osborn
AM: Evaluation of quantitative polymerase chain reaction-based
approaches for determining gene copy and gene transcript numbers in
environmental samples. Environ Microbiol. 8:804–815. 2006.
View Article : Google Scholar
|
|
36
|
Tang W, Newton RJ and Weidner DA: Genetic
transformation and gene silencing mediated by multiple copies of a
transgene in eastern white pine. J Exp Bot. 58:545–554. 2007.
View Article : Google Scholar : PubMed/NCBI
|
|
37
|
Vaisman BL: Genotyping of transgenic
animals by real-time quantitative PCR with TaqMan probes. Methods
Mol Biol. 1027:233–251. 2013. View Article : Google Scholar : PubMed/NCBI
|
|
38
|
Bressan FF, Dos Santos Miranda M, Perecin
F, et al: Improved production of genetically modified fetuses with
homogeneous transgene expression after transgene integration site
analysis and recloning in cattle. Cell Reprogram. 13:29–36. 2011.
View Article : Google Scholar
|
|
39
|
Chawla R, Ariza-Nieto M, Wilson AJ, Moore
SK and Srivastava V: Transgene expression produced by
biolistic-mediated, site-specific gene integration is consistently
inherited by the subsequent generations. Plant Biotechnol J.
4:209–218. 2006. View Article : Google Scholar : PubMed/NCBI
|
|
40
|
Woychik RP and Alagramam K: Insertional
mutagenesis in transgenic mice generated by the pronuclear
microinjection procedure. Int J Dev Biol. 42:1009–1017.
1998.PubMed/NCBI
|
|
41
|
Migliaccio AR, Bengra C, Ling J, et al:
Stable and unstable transgene integration sites in the human
genome: extinction of the green fluorescent protein transgene in
K562 cells. Gene. 256:197–214. 2000. View Article : Google Scholar
|
|
42
|
Yan B, Li D and Gou K: Homologous
illegitimate random integration of foreign DNA into the X
chromosome of a transgenic mouse line. BMC Mol Biol. 11:582010.
View Article : Google Scholar : PubMed/NCBI
|