Introduction
Scar is a generic term that refers to the
histopathological changes in normal skin tissue caused by various
types of trauma, and scars are an inevitable product in the process
of human trauma repair (1). After
skin damage, normal scars are flat, thin and almost invisible.
However, factors such as excessive deposition of extracellular
matrix (ECM) and excessive proliferation of fibroblasts can lead to
the formation of proliferative scars (2-4). A
hypertrophic scar has a protruding surface, and is irregularly
shaped with an uneven appearance, red color and solid texture, with
burning and itching sensations on the skin surface (5). Hypertrophic scars can damage the
function and appearance of the skin and impact the patient's
psychology and physiology (6-9).
Although proliferative scars can be treated with surgery,
radiotherapy, steroid injection and other means, these treatments
have not been optimized, and the molecular mechanisms of
proliferative scars remain unknown (10).
Recent studies have discovered a new class of small
RNAs known as tRNA-derived small RNAs (tsRNAs) that are different
from typical noncoding RNA. tsRNAs are fragments derived from
transfer RNA (tRNA). tsRNAs can be divided into two main types
according to the length of the tRNA and the cleavage site: The
first is the stress-induced tRNA fragment, which is produced by a
specific cut in the 28-36-nucleotide (nt) anticodon ring and is a
mature tRNA, known as tRNA-derived stress-induced RNA or tiRNA; the
other tsRNA is 14-30 nt in length and known as a tRNA-derived
fragment (tRF) (11).
tRFs/tRNA-derived RNAs (tDRs) are derived from mature tRNA or
precursor tRNA, which can be subdivided as follows: i) tRF-5′,
corresponding to the 5′ end of the mature tRNA according to its
corresponding position on the tRNA, obtained by D-loop cleavage;
ii) tRF-3′, corresponding to the 3′ end of the mature tRNA and
containing a CCA tail sequence, obtained by T-loop cleavage; and
iii) tRF-1, which is the 3′-tail sequence of the precursor tRNA and
contains a poly T sequence at the 3′ end (12-14).
tsRNA is not only a by-product of random tRNA
cleavage but also a small noncoding RNA that has crucial roles in
numerous specific physiological and pathological processes
(11). Additionally, tsRNA has an
impact on the function of various types of cells. Studies have
demonstrated that tsRNAs are present in a variety of organisms and
affect different biological processes, such as the growth and
metastasis of cancer cells, tumor inhibition, regulation of gene
and protein expression, initiation of viral reverse transcriptase,
RNA processing, the DNA damage response and neurodegeneration
(15-18). However, the role of tsRNAs in
hypertrophic scar fibroblasts has not yet been reported.
Therefore, the present study investigated
differentially expressed tsRNAs in human hypertrophic scar
fibroblasts and normal skin fibroblasts via high-throughput
sequencing. tsRNAs with partial differential expression were
confirmed by reverse transcription-quantitative polymerase chain
reaction (RT-qPCR). Bioinformatics techniques such as target gene
prediction, Gene Ontology (GO) and Kyoto Encyclopedia of Genes and
Genomes (KEGG) pathway enrichment were then used to investigate the
role of tsRNA differential expression. Some of the differentially
expressed tsRNAs were selected to generate coexpression and
competing endogenous RNA (ceRNA) networks. The main purpose of the
study was to elucidate the potential molecular mechanism of tsRNAs
in proliferative scars and to lay a foundation for the treatment of
such scars.
Materials and methods
Preparation of fibroblasts
The present study was approved by the Ethics
Committee of the First Affiliated Hospital of Nanchang University
(Nanchang, China). Written informed consent was obtained from the
adult participants and from the parent of the child participant.
Hypertrophic scars and adjacent normal skin tissues were harvested
from three female patients (aged 6, 20 and 26 years) who were
admitted to the First Affiliated Hospital of Nanchang University
from April to October 2018. A typical manifestation of hypertrophic
scar is a bulging, erythematous, itching and thickened scar
restricted to the site of injury (19,20). Samples were obtained from patients
with hypertrophic scars following perineal burns that had not been
treated with drugs or radiotherapy prior to sample collection. The
samples were washed three times with PBS, and the subcutaneous
tissue was removed. The tissue was placed in a Petri dish and
digested with 0.25% trypsin-EDTA (Gibco; Thermo Fisher Scientific,
Inc.) at 4°C for 10-12 h. The dermal layer of the tissue was
retained; the tissue epidermis was completely removed to avoid
contamination of the epidermal cells, and the dermis was cut into
1×1-mm pieces with ophthalmic scissors (21). The cut dermal tissue pieces were
plated in a Petri dish, and DMEM containing 10% fetal calf serum
(Gibco; Thermo Fisher Scientific, Inc.) was added. The cells were
incubated at 37°C under 5% CO2, and the medium was
changed every 3 days. The cells disintegrated, expanded and fused
into sheets covering 80% of the bottom of the culture dish; they
were then digested and passaged. Fibroblasts of the third
generation were used in the study. The fibroblasts derived from
hypertrophic scar tissue were designated as the experimental group,
and those derived from normal skin were designated as the control
group.
RNA isolation and quality control
Total RNA was extracted using TRIzol reagent
according to the manufacturer's protocol (Invitrogen; Thermo Fisher
Scientific, Inc.). The quantity of extracted RNA was measured using
a NanoDrop ONE spectrophotometer (Thermo Fisher Scientific, Inc.),
and the quality of the extracted RNA, specifically, its integrity
and purity, was assessed by standard denaturing agarose gel
electrophoresis. The optical density ratio at wavelengths of 260
and 280 nm (OD260/280) was measured as an indicator of RNA
concentration and was used to determine RNA purity; an OD260/280
ratio of between 1.8 and 2.1 is considered to indicate acceptable
RNA quality (22,23).
Library preparation for RNA sequencing
(RNA-seq)
The library was created by first adding a 3′ linker
sequence and sequentially adding 1 µl SR RT Primer, 4.5
µl nuclease-free H2O for reverse transcription
primer hybridization, and the 5′ adaptor sequence. RNA fragments
were used to synthesize cDNA strands as follows: Degeneration at
94°C for 15 sec, annealing at 62°C for 30 sec, and extension at
70°C for 15 sec. The library was then examined on an 8% SDS-PAGE
Tris-borate-EDTA gel after 1 h at 120 V. The library was
constructed using a HiSeq X Reagent kit v2.5 (FC-501-2501;
Illumina, Inc.). Library quality was assessed using an Agilent 2200
TapeStation system (Agilent Technologies, Inc.) prior to
sequencing. Total concentrations were determined using a Qubit 3.0
Fluorometer (Thermo Fisher Scientific, Inc.). Libraries were
sequenced using a HiSeq X Ten high-throughput sequencer (Illumina,
Inc.) with 2×150-bp paired-end reads. Purified cDNA libraries were
used for cluster generation (cBot Cluster Generator; Illumina,
Inc.). The library was sequenced and constructed by Shanghai
Personal Biotechnology Co., Ltd. (www.personalbio.cn/).
Data quality control
First, tsRNA sequences that did not match sequences
in miRBase (http://www.mirbase.org) were matched
to sequences in the GtRNA database version 18.1 (24). The tsRNA sequences that matched to
the GtRNA database were then searched against the tRFdb 2012
(25) and tRF MINTbase v2.0
(26) databases. The expressed
tsRNAs in the tissue were identified. In the miRNA analysis, the
filtered clean reads were compared with the human miRNA database
22.1 (http://www.mirbase.org/) to obtain miRNA
expression data. Levels of tsRNA and miRNA gene expression were
obtained by RNA-seq. The level of gene expression is closely
associated with the following two aspects: i) The level of gene
expression and the number of reads in the mapping reference
sequence, that is, the effective sequencing amount; ii) the sum of
the length of all exons of the gene, as increased gene
transcription generates more sequencing fragment results (27). The number of reads of each gene
was then obtained. According to the known small RNA data, the
differences in small RNAs between the hypertrophic scar fibroblasts
and normal skin fibroblasts were determined. Differentially
expressed genes were obtained using DEGseq Software (version
1.18.0) (28). The selection
criteria were fold change >2.0, P<0.05 and false discovery
rate (FDR) <0.05.
Target prediction
TargetScan software (www.targetscan.org/) was used to predict the potential
binding targets of mRNAs, and target genes were predicted by
searching for conserved 8- and 7-mer sites that matched each miRNA
seed region. The miRanda (http://www.microrna.org) and RNAhybrid (https://bibiserv.cebitec.uni-bielefeld.de/) algorithms
were employed to predict mRNAs targeted by differentially expressed
tsRNAs (screening criteria: miRanda, score ≥150 and energy <−20;
RNAhybrid, energy <−25). The intersection of the two algorithms
was taken as the final result of the target gene prediction. The
miRanda score is a binding score of the tsRNA and its target gene,
with a higher score indicating a more accurate target gene
prediction.
GO analysis
The predicted target genes were subjected to GO
analysis (www.geneontology.org/), and all involved GO genes were
evaluated. The significance level (P-value) of each GO gene was
calculated by Fisher's test, the results were corrected using the
FDR method of multiple hypothesis testing to identify significant
GO genes from differential gene enrichment at P<0.05. The
P-values for the enrichment of GO terms were calculated by the
default statistical algorithm of the GO analysis database. A
smaller P-value indicates a more significant role of a GO term, and
terms with P<0.05 were considered statistically significant.
Under the same P-value, a larger enrichment score indicates a more
specific effect of a gene.
Pathway analysis
KEGG pathway (www.kegg.jp/)
enrichment analysis of the differentially expressed tsRNAs was
performed. All pathways in which the genes are involved were
determined based on the hypergeometric distribution of Fisher's
test calculation of each pathway significance level (P-value), the
results of multiple hypothesis correction tests and the FDR. Thus,
significant pathways embodied by differential genes were
identified. The standard for significance screening was P<0.05;
biological pathways with P<0.05 were considered significant.
Validation by RT-qPCR
To confirm the RNA-seq data, three tsRNAs were
selected for verification by RT-qPCR. First, cDNA was synthesized
using an ABI Q6 RT-qPCR system (Applied Biosystems; Thermo Fisher
Scientific, Inc.). RT-qPCR was performed in a 12-µl reaction
mixture containing 1 ng total RNA, 1 µl RT primer and 2
µl dNTP mix (HyTest Ltd.), 4 µl 5X buffer, 1
µl Protector RNase Inhibitor and 1 µl transcriptase
(all from Epicentre; Illumina Inc.). The stem-loop RT reaction was
performed at 65°C for 5 min, followed by 42°C for 60 min and 70°C
for 5 min. RT-qPCR was performed with the 2X FastStart Universal
SYBR-Green Master mix kit (Roche) with the following amplification
procedure: 95°C for 10 min, followed by 45 cycles of 95°C for 15
sec and 60°C for 60 sec for fluorescence collection. After the
amplification reaction was complete, a melting curve of the RT-qPCR
product was established during fluorescence collection (95°C for 10
sec; 60°C for 60 sec; and 95°C for 15 sec) by slowly heating from
60 to 99°C (+0.05°C/sec). The target gene and internal reference
gene of each sample were subjected to RT-qPCR. Primers were
synthesized by Shanghai Bioligo Biotechnology Co., Ltd., as listed
in Table I. The U6 gene was used
as an internal reference for primer design. RT-qPCR quantification
was performed using the 2−ΔΔCq method (29).
 | Table IPrimer sequences of tsRNAs used for
reverse transcription-quantitative PCR. |
Table I
Primer sequences of tsRNAs used for
reverse transcription-quantitative PCR.
| Primer ID | Primer sequence
(5′-3′) | Length (bp) | Annealing
temperature (°C) |
|---|
| U6 | F:
CGATACAGAGAAGATTAGCATGGC | 61 | 60 |
| R:
AACGCTTCACGAATTTGCGT | | |
| tsRNA-23678 | F:
GGGGGTATAGCTCAGGGGTAGA | 72 | 60 |
| R:
GTCGTATCCAGTGCGTGTCGTGGAGTCGGCAATTGCACTGGATACGACAGTCAAA | | |
| tsRNA-23727 | F:
GGGGGTATAGCTCAGTGGTAGAG | 71 | 60 |
| R:
GTCGTATCCAGTGCGTGTCGTGGAGTCGGCAATTGCACTGGATACGACAGTCAAA | | |
| tsRNA-23761 | F:
GGGGGTGTAGCTCAGTGGTAGAG | 71 | 60 |
| R:
GTCGTATCCAGTGCGTGTCGTGGAGTCGGCAATTGCACTGGATACGACAGTCAAA | | |
Expression of several tsRNAs and miRNAs
in hypertrophic scar tissue and normal skin tissue
Detection of tsRNA-23678, tsRNA-23761, tsRNA-23727,
miR 29b-1-5p and miR-3135b gene expression was performed using
RT-qPCR. The hypertrophic scar and normal skin tissue were cut into
small pieces and ground into fine powder in liquid nitrogen, using
a mortar and pestle. Total RNA was extracted using TRIzol reagent.
The Rayscript cDNA Synthesis kit (cat. no. GK8030; Shanghai Generay
Biotech Co., Ltd.) was used to synthesize cDNA via reverse
transcription using the following temperature protocol: 95°C for 10
min, followed by 45 cycles of 95°C for 15 sec and 60°C for 60 sec
for fluorescence collection. The specific cDNA fragments were
amplified using a RT-qPCR detection system and primers from
Shanghai Bioligo Biotechnology Co., Ltd., as described above. Data
are expressed as expression relative to the U6 gene. All reactions
were analyzed using the 2−ΔΔCq method.
Statistical analysis
Differences in tsRNA levels between hypertrophic
scars and adjacent normal skin samples were analysed using a paired
Student's t-test The FDR was calculated to correct the P-values.
Differential expression of tsRNAs was defined by a fold-change
threshold of >2.0 and P<0.05. P<0.05 was considered to
indicate statistical significance. Statistical analyses were
performed using SPSS version 19 software (IBM Corp).
tsRNA-miRNA coexpression network and
ceRNA network analyses
The differentially expressed tsRNAs contain miRNA
binding sites. Three differentially expressed tsRNAs were selected
and networks containing them were established. High-throughput
sequencing results indicated that tsRNA-23678, tsRNA-23727 and
tsRNA-23761 were upregulated in the hypertrophic scar fibroblasts.
The tsRNAs and miRNAs associated with the same target gene were
obtained. The miRNAs with the same expression trends as the tsRNAs
were identified, and significant target genes were screened on the
basis of their P-values (P<0.05). First, Cytoscape 3.6.1
(www.cytoscape.org/) was used to
construct a tsRNA-miRNA coexpression network and a ceRNA network.
The purpose of constructing these networks was to discover
potential miRNA reaction elements. The overlap of a binding site
for both the tsRNA and miRNA on the same mRNA may aid in the
prediction of tsRNA-miRNA-mRNA interactions. The intersections of
results from the commonly used software miRanda, Targetscan and
psRobot (omicslab.genetics.ac.cn/psRobot/) were used to predict
tsRNA-miRNA-mRNA interactions.
Results
Extraction of total RNA
Denaturing gel electrophoresis revealed intense and
distinct 28S and 18S ribosomal RNA bands. A smaller, slightly
diffuse band consisting of low molecular weight RNA (tRNA and 5S
ribosomal RNA) was also observed (Fig. S1). As shown in Table II, the extracted RNAs were
acceptable for subsequent tsRNA experiments.
| Table IIRNA quantification and quality
assurance by spectrophotometry. |
Table II
RNA quantification and quality
assurance by spectrophotometry.
| Group | OD260/280 C
ratio | oncentration
(ng/µl) | Quantity (ng) | Result |
|---|
| HA | 2.10 | 653.4 | 13.07 | Qualified |
| HB | 2.05 | 681.6 | 13.63 | Qualified |
Differential tsRNA and miRNA expression
profiles
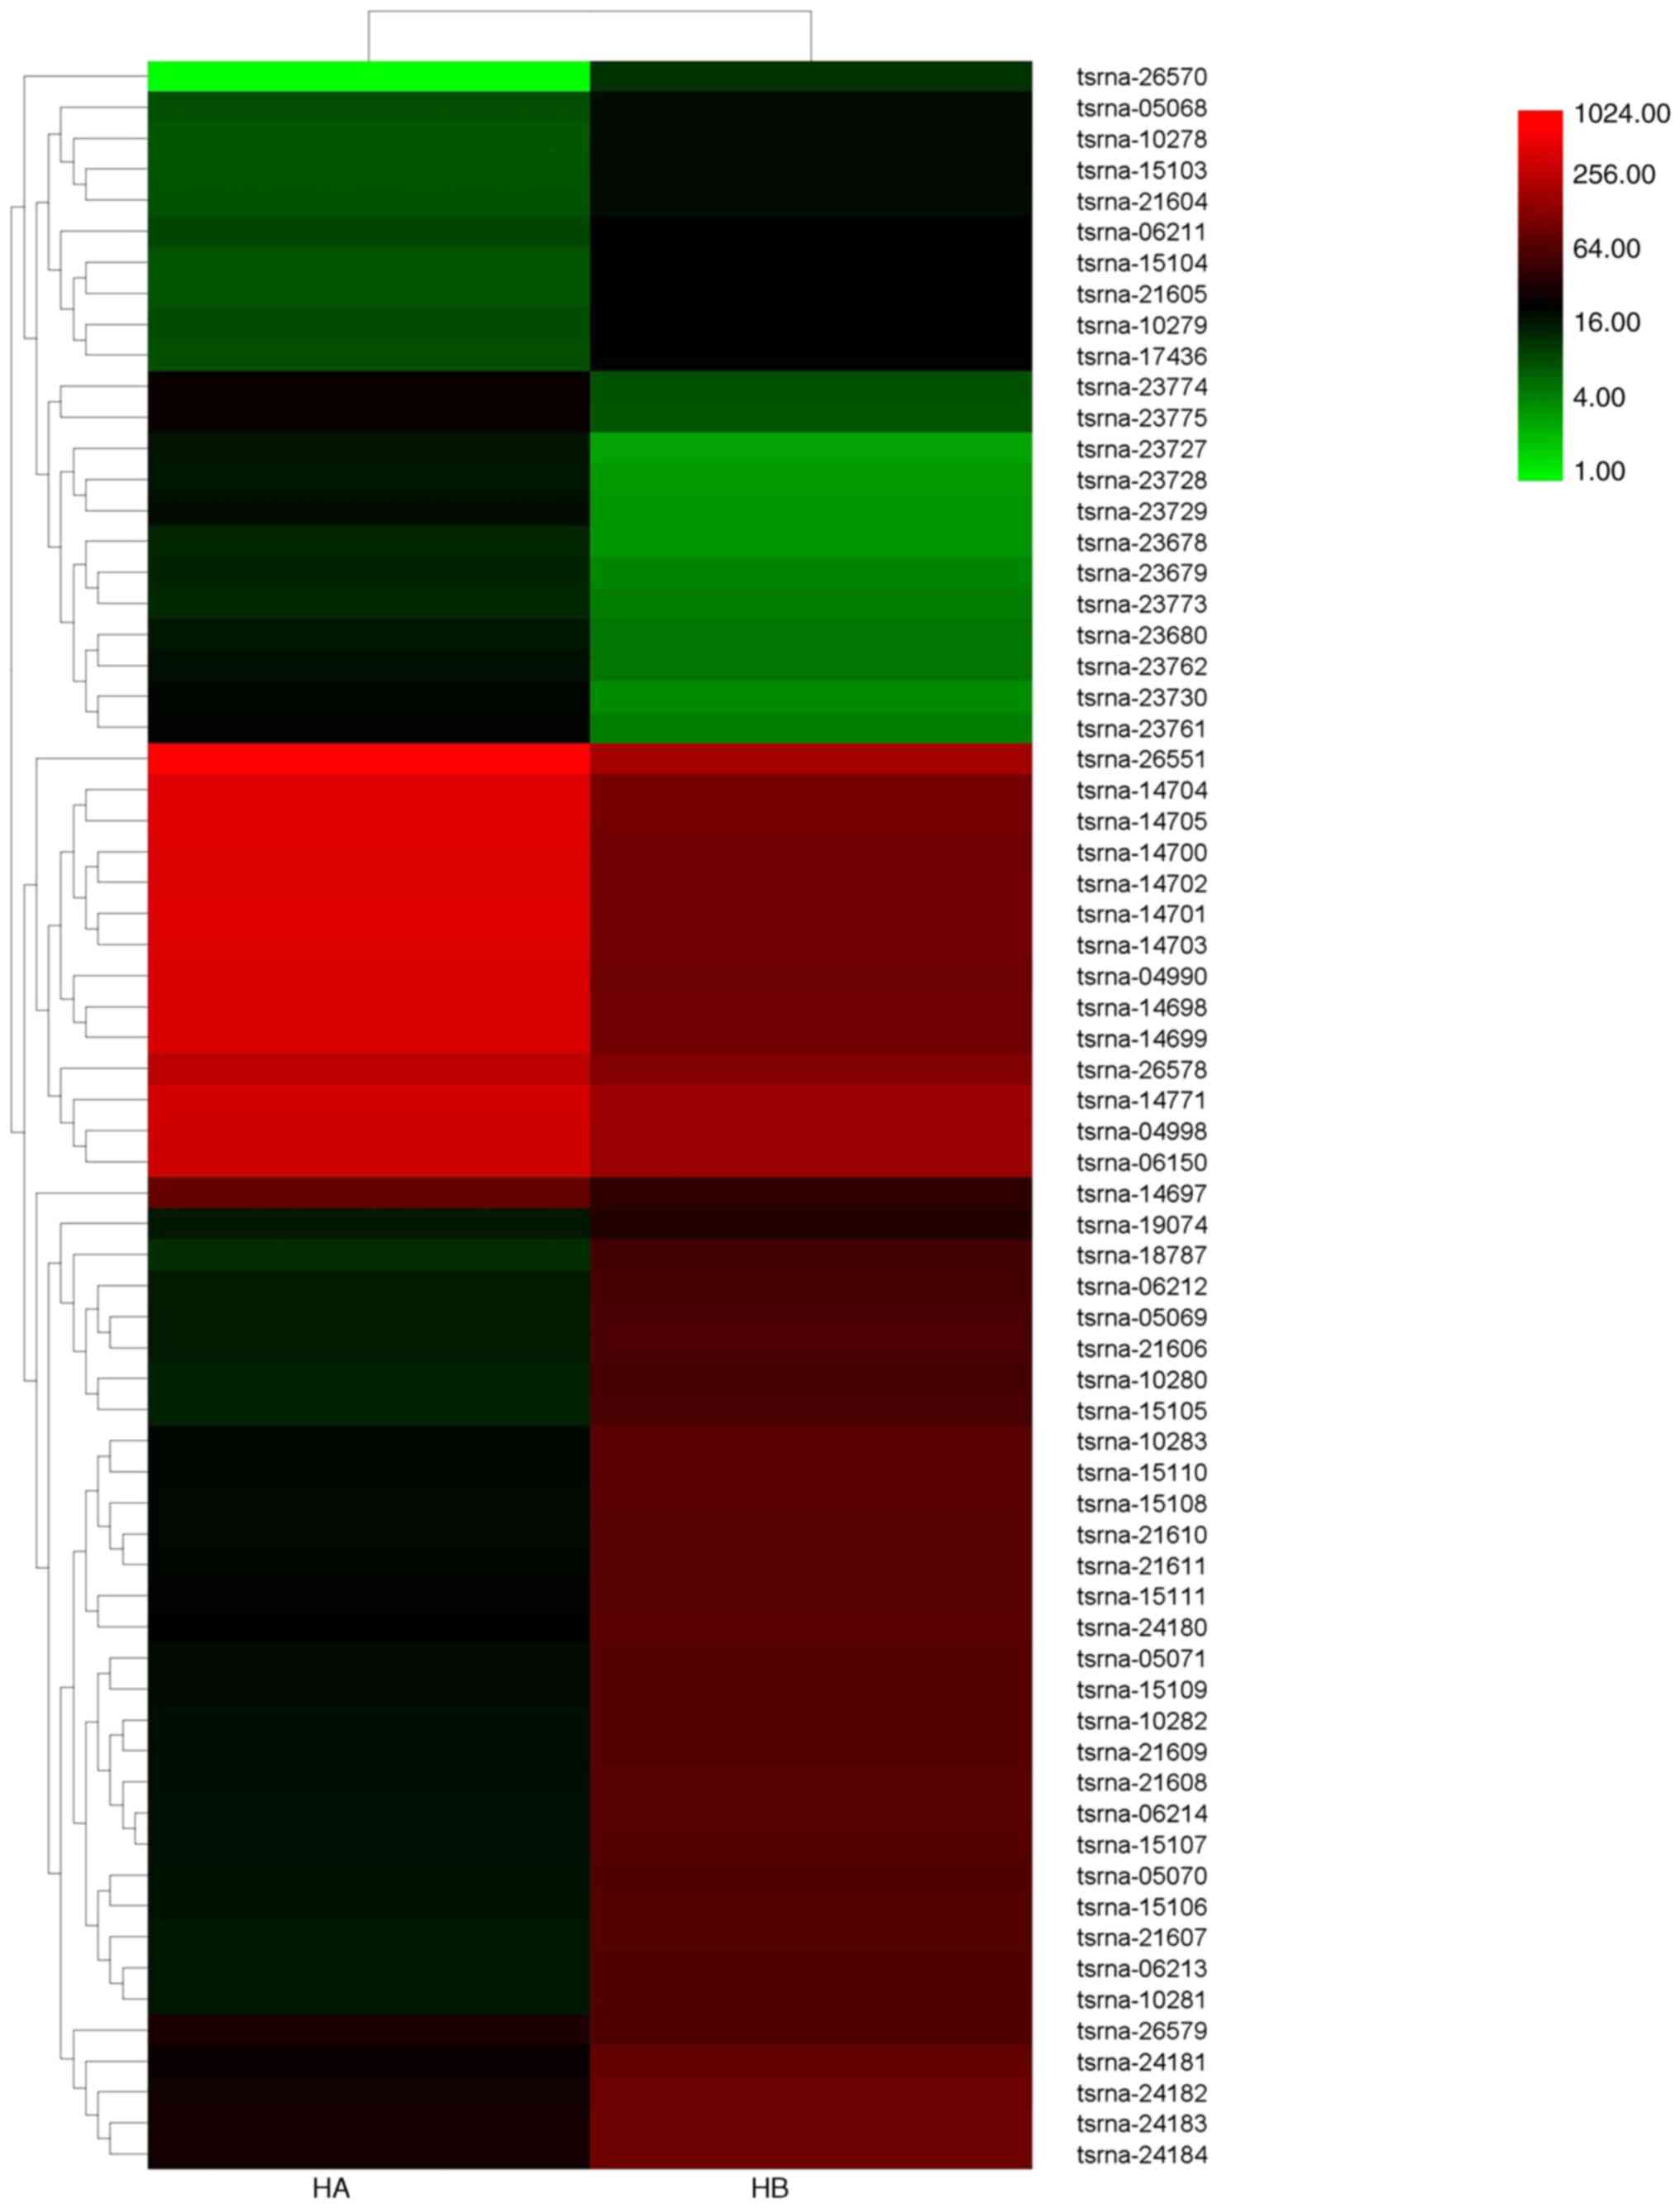
High-throughput sequencing is an efficient method
for studying the biological function of RNAs. tsRNA expression
profiles in fibroblasts were obtained by RNA-seq. Thousands of
transcripts were detected in the hypertrophic scars and normal
tissues by RNA-seq. Among them, 67 differentially expressed tsRNAs
were detected (Tables III and
IV), of which 27 were
upregulated and 40 downregulated in hypertrophic scar fibroblasts.
The heatmap of intersample association (Fig. 1) showed an evident difference in
transcript levels between hypertrophic scar and normal skin
fibroblasts. A total of 149 miRNAs were significantly
differentially expressed (fold change >2.0, P<0.05). Of
these, 120 miRNAs were upregulated and 29 downregulated. The top 15
upregulated and top 15 downregulated significantly differentially
expressed miRNAs are shown Table
V. These results reveal that the expression profiles of tsRNAs
and miRNAs in hypertrophic scar fibroblasts differed from those in
normal skin fibroblasts.
| Table IIIData for significant differentially
expressed upregulated tsRNAs of hypertrophic scar compared with
normal skin. |
Table III
Data for significant differentially
expressed upregulated tsRNAs of hypertrophic scar compared with
normal skin.
| Yingbio ID | Fold change | Database ID |
Log2FC | Anticodons | Type |
|---|
| tsRNA-04990 | 4.2733 |
tRF-33-LQR47673FEWSD3 | 2.0953 | GlyGCC | 5′-half |
| tsRNA-04998 | 2.0229 |
tRF-33-LQ947673FEWSD3 | 1.0164 | GlyCCC | 5′-half |
| tsRNA-06150 | 2.0243 |
tRF-33-FQ947673FEWSD3 | 1.0174 | GlyCCC | 5′-half |
| tsRNA-14697 | 2.0476 |
tRF-31-P4R8YP9LON4VD | 1.0339 | GlyCCC | 5′-half |
| tsRNA-14698 | 4.1770 |
tRF-32-P4R8YP9LON4V3 | 2.0624 | GlyCCC | 5′-half |
| tsRNA-14699 | 4.1187 |
tRF-33-P4R8YP9LON4VDP | 2.0421 | GlyCCC | 5′-half |
| tsRNA-14700 | 4.0846 |
tRF-34-P4R8YP9LON4VHM | 2.0302 | GlyCCC | 5′-half |
| tsRNA-14701 | 4.1227 |
tRF-35-P4R8YP9LON4VN1 | 2.0435 | GlyCCC | tRF-5 |
| tsRNA-14702 | 4.0472 |
tRF-36-P4R8YP9LON4VN1B | 2.0169 | GlyCCC | tRF-5 |
| tsRNA-14703 | 3.9967 |
tRF-38-P4R8YP9LON4VN18 | 1.9988 | GlyCCC | tRF-5 |
| tsRNA-14704 | 3.9166 |
tRF-40-P4R8YP9LON4VN1EH | 1.9696 | GlyCCC | tRF-5 |
| tsRNA-14705 | 3.9591 |
tRF-43-P4R8YP9LON4VN1EH | 1.9851 | GlyCCC | tRF-5 |
| tsRNA-14771 | 2.0016 |
tRF-37-PNR8YP9LON4V4R1 | 1.0012 | GlyCCC | tRF-5 |
| tsRNA-23678 | 5.2361 |
tRF-32-RKVP4PRL5FZU3 | 2.3885 | CysGCA | 5′-half |
| tsRNA-23679 | 4.3826 |
tRF-33-RKVP4PRL5FZUDP | 2.1317 | CysGCA | 5′-half |
| tsRNA-23680 | 3.9089 |
tRF-34-RKVP4PRL5FZUHM | 1.9667 | CysGCA | 5′-half |
| tsRNA-23727 | 8.8052 |
tRF-32-RKVP4P9L5FZU3 | 3.1383 | CysGCA | 5′-half |
| tsRNA-23728 | 7.1609 |
tRF-33-RKVP4P9L5FZUDP | 2.8401 | CysGCA | 5′-half |
| tsRNA-23729 | 7.3594 |
tRF-33-RKVP4P9L5FZUDP | 2.8795 | CysGCA | 5′-half |
| tsRNA-23730 | 7.1105 |
tRF-34-RKVP4P9L5FZUHM | 2.8299 | CysGCA | tRF-5 |
| tsRNA-23761 | 5.9145 |
tRF-35-RKVP4P9L5FZUNF | 2.5642 | CysGCA | 5′-half |
| tsRNA-23762 | 4.3390 |
tRF-32-RK9P4P9L5FZU3 | 2.1173 | CysGCA | 5′-half |
| tsRNA-23772 | 3.4717 |
tRF-33-RK9P4P9L5FZUDP | 1.7956 | AlaCGC | 5′-half |
| tsRNA-23774 | 3.5778 |
tRF-31-RK9P4P9L5HMVE | 1.8391 | AlaCGC | 5′-half |
| tsRNA-23775 | 3.9072 |
tRF-32-RK9P4P9L5HMVQ | 1.9661 | AlaCGC | 5′-half |
| tsRNA-26551 | 3.3115 |
tRF-33-RK9P4P9L5HMV05 | 1.7274 | SerGCT | tRF-1 |
| tsRNA-26578 | 2.1116 | tsRNA-1005 | 1.0783 | GlyTCC | tRF-1 |
| Table IVData for significant differentially
expressed downregulated tsRNAs of hypertrophic scar compared with
normal skin. |
Table IV
Data for significant differentially
expressed downregulated tsRNAs of hypertrophic scar compared with
normal skin.
| Yingbio_ID | Fold change | Database_ID |
Log2FC | Anticodons |
|---|
| tsRNA-05068 | 0.3915 |
tRF-34-LSXMSL73VL4YHE | −1.3527 | HisGTG |
| tsRNA-05069 | 0.2660 |
tRF-34-LSXMSL73VL4YHE | −1.9100 | HisGTG |
| tsRNA-05070 | 0.2673 |
tRF-35-LSXMSL73VL4YMY | −1.9033 | HisGTG |
| tsRNA-05071 | 0.2711 |
tRF-36-LSXMSL73VL4YMYE | −1.8828 | HisGTG |
| tsRNA-06211 | 0.3743 |
tRF-33-FSXMSL73VL4YDN | −1.4174 | HisGTG |
| tsRNA-06212 | 0.2695 |
tRF-34-FSXMSL73VL4YHE | −1.8916 | HisGTG |
| tsRNA-06213 | 0.2575 |
tRF-35-FSXMSL73VL4YMY | −1.9569 | HisGTG |
| tsRNA-06214 | 0.2562 |
tRF-36-FSXMSL73VL4YMYE | −1.9642 | HisGTG |
| tsRNA-10278 | 0.3460 |
tRF-32-6SXMSL73VL4YK | −1.5309 | HisGTG |
| tsRNA-10279 | 0.3335 |
tRF-33-6SXMSL73VL4YDN | −1.5840 | HisGTG |
| tsRNA-10280 | 0.2544 |
tRF-34-6SXMSL73VL4YHE | −1.9747 | HisGTG |
| tsRNA-10281 | 0.2471 |
tRF-35-6SXMSL73VL4YMY | −2.0162 | HisGTG |
| tsRNA-10282 | 0.2668 |
tRF-36-6SXMSL73VL4YMYE | −1.9057 | HisGTG |
| tsRNA-10283 | 0.2766 |
tRF-37-6SXMSL73VL4YMYP | −1.8538 | HisGTG |
| tsRNA-15103 | 0.3519 |
tRF-31-PW5SVP9N15WV0 | −1.5064 | HisGTG |
| tsRNA-15104 | 0.3098 |
tRF-32-PW5SVP9N15WVN | −1.6902 | HisGTG |
| tsRNA-15105 | 0.2369 |
tRF-33-PW5SVP9N15WV0E | −2.0770 | HisGTG |
| tsRNA-15106 | 0.2555 |
tRF-34-PW5SVP9N15WV2P | −1.9682 | HisGTG |
| tsRNA-15107 | 0.2545 |
tRF-35-PW5SVP9N15WV7W | −1.9739 | HisGTG |
| tsRNA-15108 | 0.2731 |
tRF-36-PW5SVP9N15WV7W0 | −1.8720 | HisGTG |
| tsRNA-15109 | 0.2728 |
tRF-39-PW5SVP9N15WV7WIV | −1.8737 | HisGTG |
| tsRNA-15110 | 0.2806 |
tRF-40-PW5SVP9N15WV7W6S | −1.8331 | HisGTG |
| tsRNA-15111 | 0.2966 |
tRF-45-PW5SVP9N15WV7W6SJF | −1.7533 | HisGTG |
| tsRNA-17436 | 0.3188 |
tRF-34-94U47P299DZUFJ | −1.6489 | GlnTTG |
| tsRNA-18787 | 0.2153 |
tRF-35-VHJYOZ4E8BRY93 | −2.2149 | ArgTCT |
| tsRNA-19074 | 0.4575 |
tRF-37-V4QP596VZ631QJJ | −1.1279 | GluTTC |
| tsRNA-21604 | 0.3724 |
tRF-32-XSXMSL73VL4YK | −1.4247 | HisGTG |
| tsRNA-21605 | 0.2994 |
tRF-33-XSXMSL73VL4YDN | −1.7395 | HisGTG |
| tsRNA-21606 | 0.2578 |
tRF-34-XSXMSL73VL4YHE | −1.9551 | HisGTG |
| tsRNA-21607 | 0.2407 |
tRF-35-XSXMSL73VL4YMY | −2.0546 | HisGTG |
| tsRNA-21608 | 0.2578 |
tRF-36-XSXMSL73VL4YMYE | −1.9551 | HisGTG |
| tsRNA-21609 | 0.2653 |
tRF-37-XSXMSL73VL4YMYP | −1.9141 | HisGTG |
| tsRNA-21610 | 0.2803 |
tRF-40-XSXMSL73VL4YMY91 | −1.8348 | HisGTG |
| tsRNA-21611 | 0.2802 |
tRF-42-XSXMSL73VL4YMY91M - | 1.8350 | HisGTG |
| tsRNA-24180 | 0.3091 |
tRF-32-ROD8N0X0JYOYO | −1.6937 | TyrGTA |
| tsRNA-24181 | 0.2991 |
tRF-33-ROD8N0X0JYOY0F | −1.7411 | TyrGTA |
| tsRNA-24182 | 0.2995 |
tRF-34-ROD8N0X0JYOY26 | −1.7389 | TyrGTA |
| tsRNA-24183 | 0.3123 |
tRF-36-ROD8N0X0JYOYUED | −1.6787 | TyrGTA |
| tsRNA-24184 | 0.3030 |
tRF-37-ROD8N0X0JYOYUE3 | −1.7222 | TyrGTA |
| tsRNA-26579 | 0.4958 | tsRNA-1042 | −1.0121 | ThrAGT |
| Table VData of significant differentially
expressed miRNAs of hypertrophic scar compared with normal skin
(log2FC >1.0, P<0.05). |
Table V
Data of significant differentially
expressed miRNAs of hypertrophic scar compared with normal skin
(log2FC >1.0, P<0.05).
| AccID | Fold change |
Log2FC | Regulation |
|---|
| miR-29b-1-5p | 0.3214 | −1.6373 | Down |
| miR-1275 | 0.4445 | −1.7057 | Down |
| miR-148b-5p | 0.3617 | −1.4671 | Down |
| miR-151b | 0.3072 | −1.7025 | Down |
| miR-18a-5p | 0.3044 | −1.7156 | Down |
| miR-200a-3p | 0.4043 | −1.3064 | Down |
| miR-215-5p | 0.2924 | −1.7736 | Down |
| hsa-miR-222-5p | 0.4006 | −1.3196 | Down |
| miR-25-5p | 0.4175 | −1.2601 | Down |
| miR-324-5p | 0.4280 | −1.2242 | Down |
| miR-335-5p | 0.2566 | −1.9623 | Down |
| miR-491-5p | 0.3522 | −1.5054 | Down |
| miR-590-3p | 0.3644 | −1.4563 | Down |
| miR-664a-3p | 0.4117 | −1.2802 | Down |
| miR-7-1-3p | 0.3386 | −1.5621 | Down |
| miR-3135b | 2.5475 | 1.3491 | Up |
| miR-10a-5p | 39.3914 | 5.2998 | Up |
| miR-10b-5p | 57.0105 | 5.8331 | Up |
| miR-129-5p | 2.4527 | 1.2944 | Up |
| miR-133a-3p | 4.0421 | 2.0151 | Up |
| miR-137 | 2.8405 | 1.5061 | Up |
| miR-1-3p | 4.1297 | 2.0460 | Up |
| miR-140-3p | 3.5733 | 1.8372 | Up |
| miR-140-5p | 2.3318 | 1.2215 | Up |
| miR-142-3p | 10.0859 | 3.3342 | Up |
| miR-142-5p | 7.4310 | 2.8935 | Up |
| miR-143-3p | 4.9665 | 2.3122 | Up |
| miR-143-5p | 8.9891 | 3.1681 | Up |
| miR-145-3p | 4.5983 | 2.2011 | Up |
| miR-200b-3p | 3.2765 | 1.7121 | Up |
GO analysis
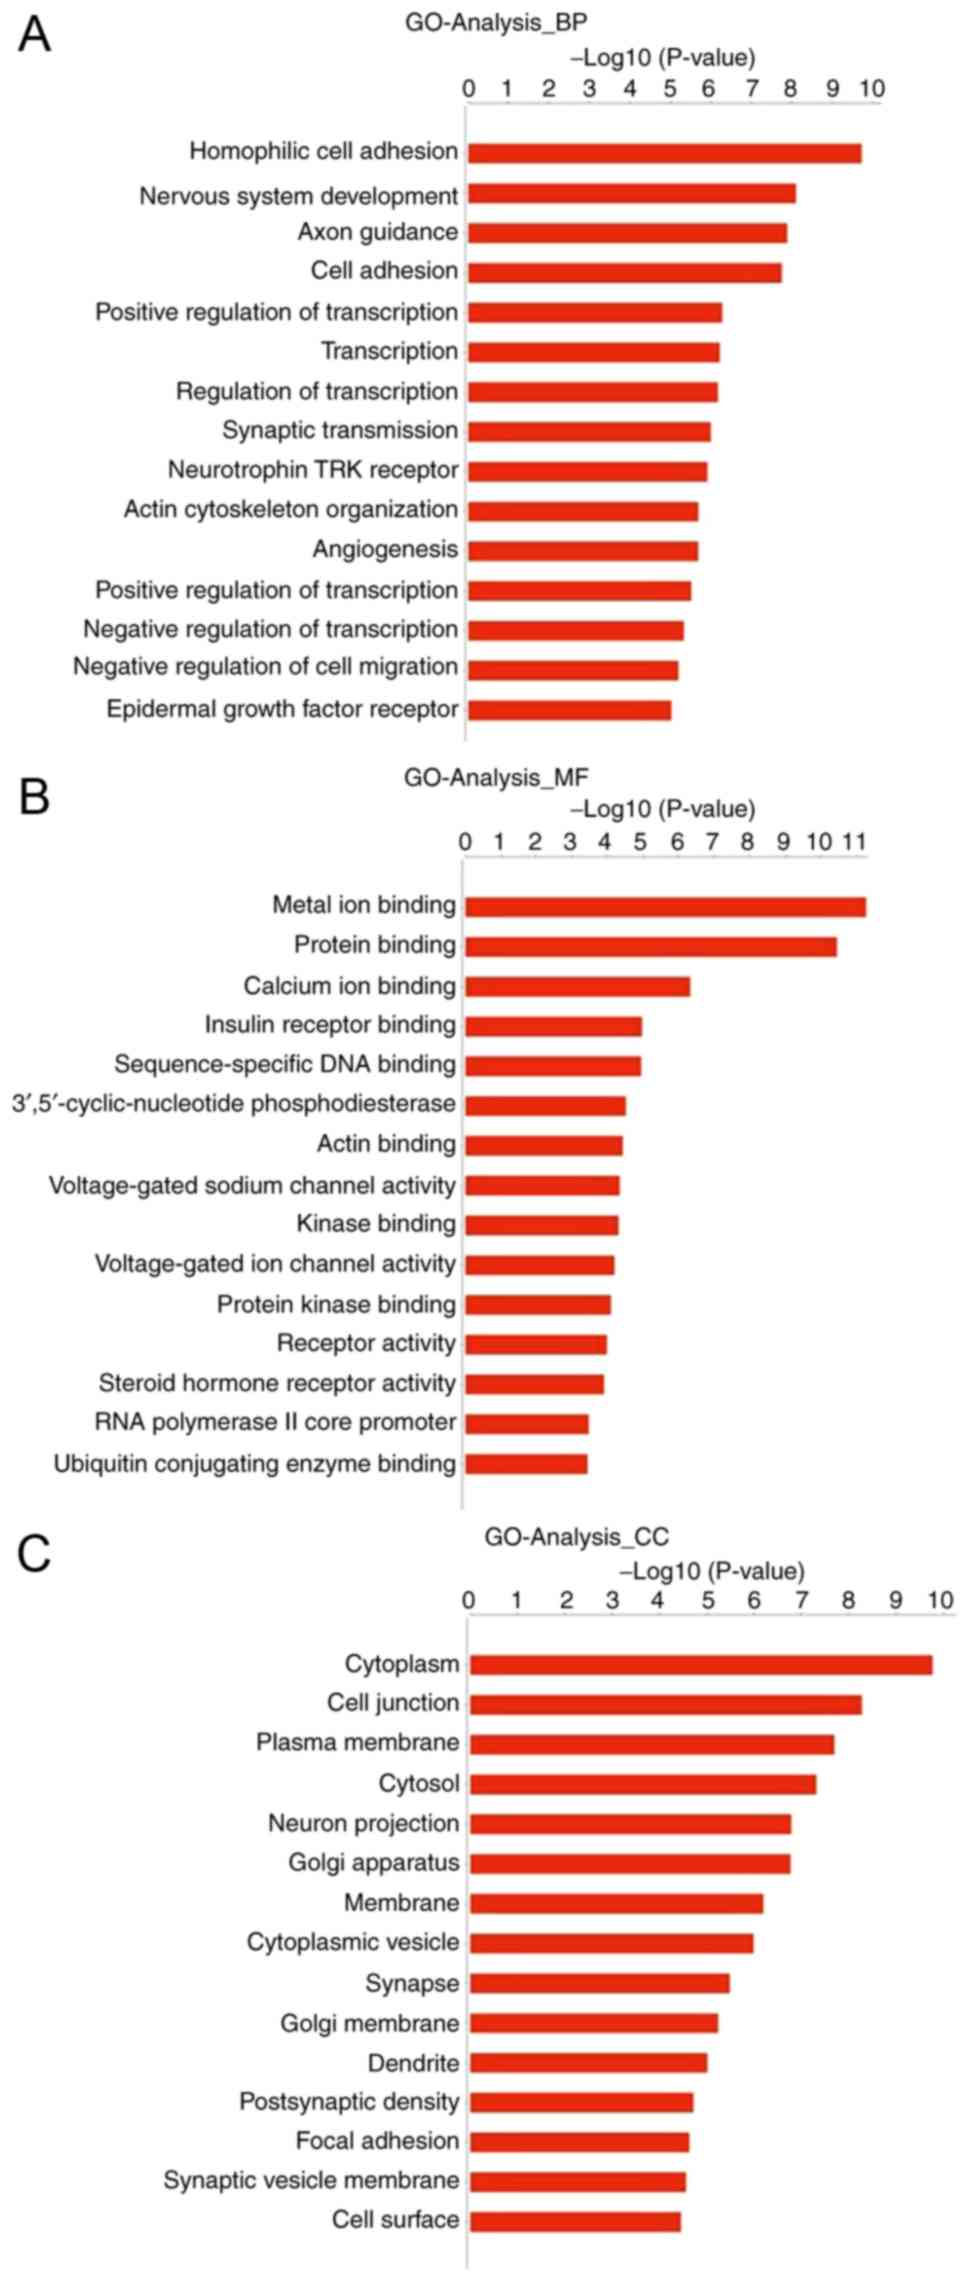
To explore the potential functions of tsRNAs in
hypertrophic scars, GO analysis of differentially expressed tsRNAs
was performed. The important GO terms and the genes involved were
obtained via the gene function analysis of target genes. Fig. 2 shows the degree of enrichment of
the top 15 genes identified, with the enrichment degree listed in
descending order. In the −log10 calculation of the
P-value, a smaller P-value corresponds to a greater
−log10 P-value. The GO project covers three main
domains, namely biological processes (BP), molecular function (MF)
and cellular component (CC). In total, 5,891 genes showed
differences in the GO analysis. The data indicate that genes in the
BP category are mainly associated with the following: 'Homophilic
cell adhesion' via plasma membrane adhesion molecules; 'cell
adhesion'; 'positive regulation of transcription,' DNA-templated;
'epidermal growth factor receptor'; and 'negative regulation of
cell migration'. Genes in the MF category are mainly associated
with 'metal ion binding', 'protein binding' and 'calcium ion
binding'; genes in the CC category are mainly associated with
'cytoplasm', 'cell junction', 'plasma membrane' and 'cytosol'. In
summary, these data indicate that differentially expressed target
gene tsRNAs may be involved in cell division and proliferation.
KEGG pathway analysis
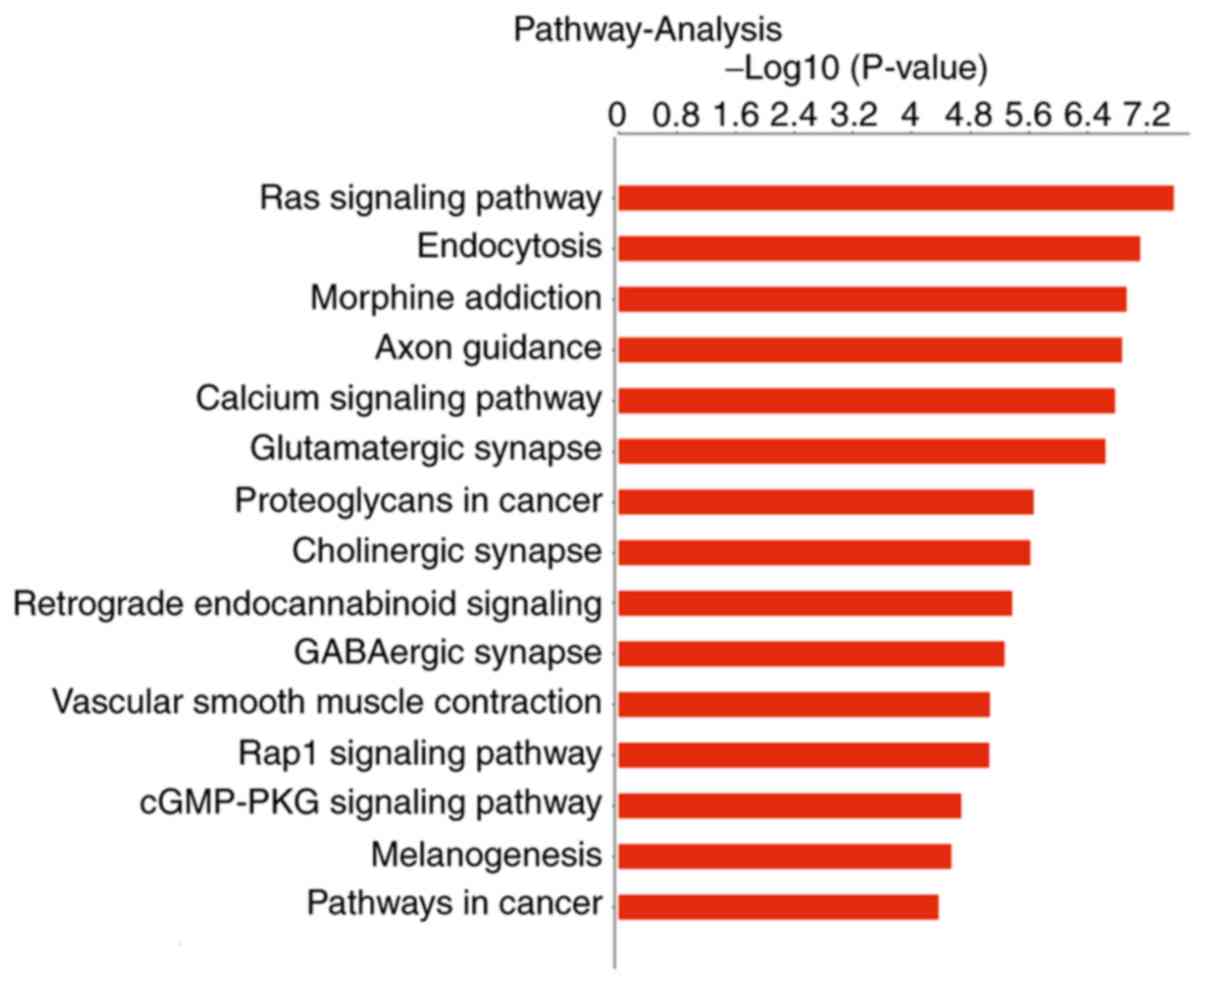
KEGG pathway analysis indicated that the
dysregulated tsRNAs are involved in numerous signaling pathways,
with 283 KEGG pathways associated with the differentially expressed
tsRNAs. A histogram showing the -log10 P-values of KEGG
pathways is shown in Fig. 3. The
−log10 (P-value) denotes an enrichment score for the
significance of pathway correlations. The histogram shows the top
15 enriched pathways, and the most significantly altered pathways
included the 'Ras signaling pathway', 'Rap1 signaling pathway' and
the 'cGMP-PKG signaling pathway'. These genes may serve important
roles in cell proliferation, differentiation, metastasis and
apoptosis.
mRNA-target prediction of tsRNA
The results showed that one tsRNA can target
multiple mRNAs and that one mRNA can also be a target gene for
multiple tsRNAs. As shown in Table
VI, the target genes of tsRNA-23678 were predicted to be FAS,
SMAD2, ABCA1, ABCCB, ABHDS, ABL2, AIPL1 and BB59. Predicted target
genes of tsRNA-23761 were COL1A, A1CF, ABI3, BEST1, ABCA1, ACAP3,
ACE and B3GNT7, and those of tsRNA-23727 were SMAD2, TGFBR1, ABCC8,
ABHD5, ABL2, BEAN1, AIPH and BAALC. SMAD2 was a target gene for
both tsRNA-23678 and tsRNA-23727. In the target gene prediction,
the miRanda scores of tsRNA23727, tsRNA23761 and tsRNA23678 were
165, 150 and 157, respectively.
| Table VITarget genes for the three
differentially expressed tsRNAs. |
Table VI
Target genes for the three
differentially expressed tsRNAs.
| Yingbio_ID | Target gene |
|---|
| tsRNA-23678 | FAS, SMAD2, ABCA1,
ABCCB, ABHDS, ABL2, AIPL1, BB59 |
| tsRNA-23727 | SMAD2, TGFBR1,
ABCC8, ABHD5, ABL2, BEAN1, AIPH, BAALC |
| tsRNA-23761 | COL1A1, A1CF, ABI3,
BEST1, ABCA1, ACAP3, ACE, B3GNT7 |
Validation with RT-qPCR
The differentially expressed tsRNA-23678,
tsRNA-23727 and tsRNA-23761 were chosen for further analysis to
verify the RNA-seq results. Amplification and dissociation curves
for these tsRNAs were generated (Fig.
4), and the 2−ΔΔCq values of the tsRNAs were
calculated according to the relative quantitative method. The
2−ΔΔCq analysis revealed upregulation of tsRNA-23678
(1.9452-fold), tsRNA-23727 (1.6684-fold) and tsRNA-23761
(1.6997-fold) in hypertrophic scar, which is consistent with the
RNA-seq results (Fig. 5; Table VII).
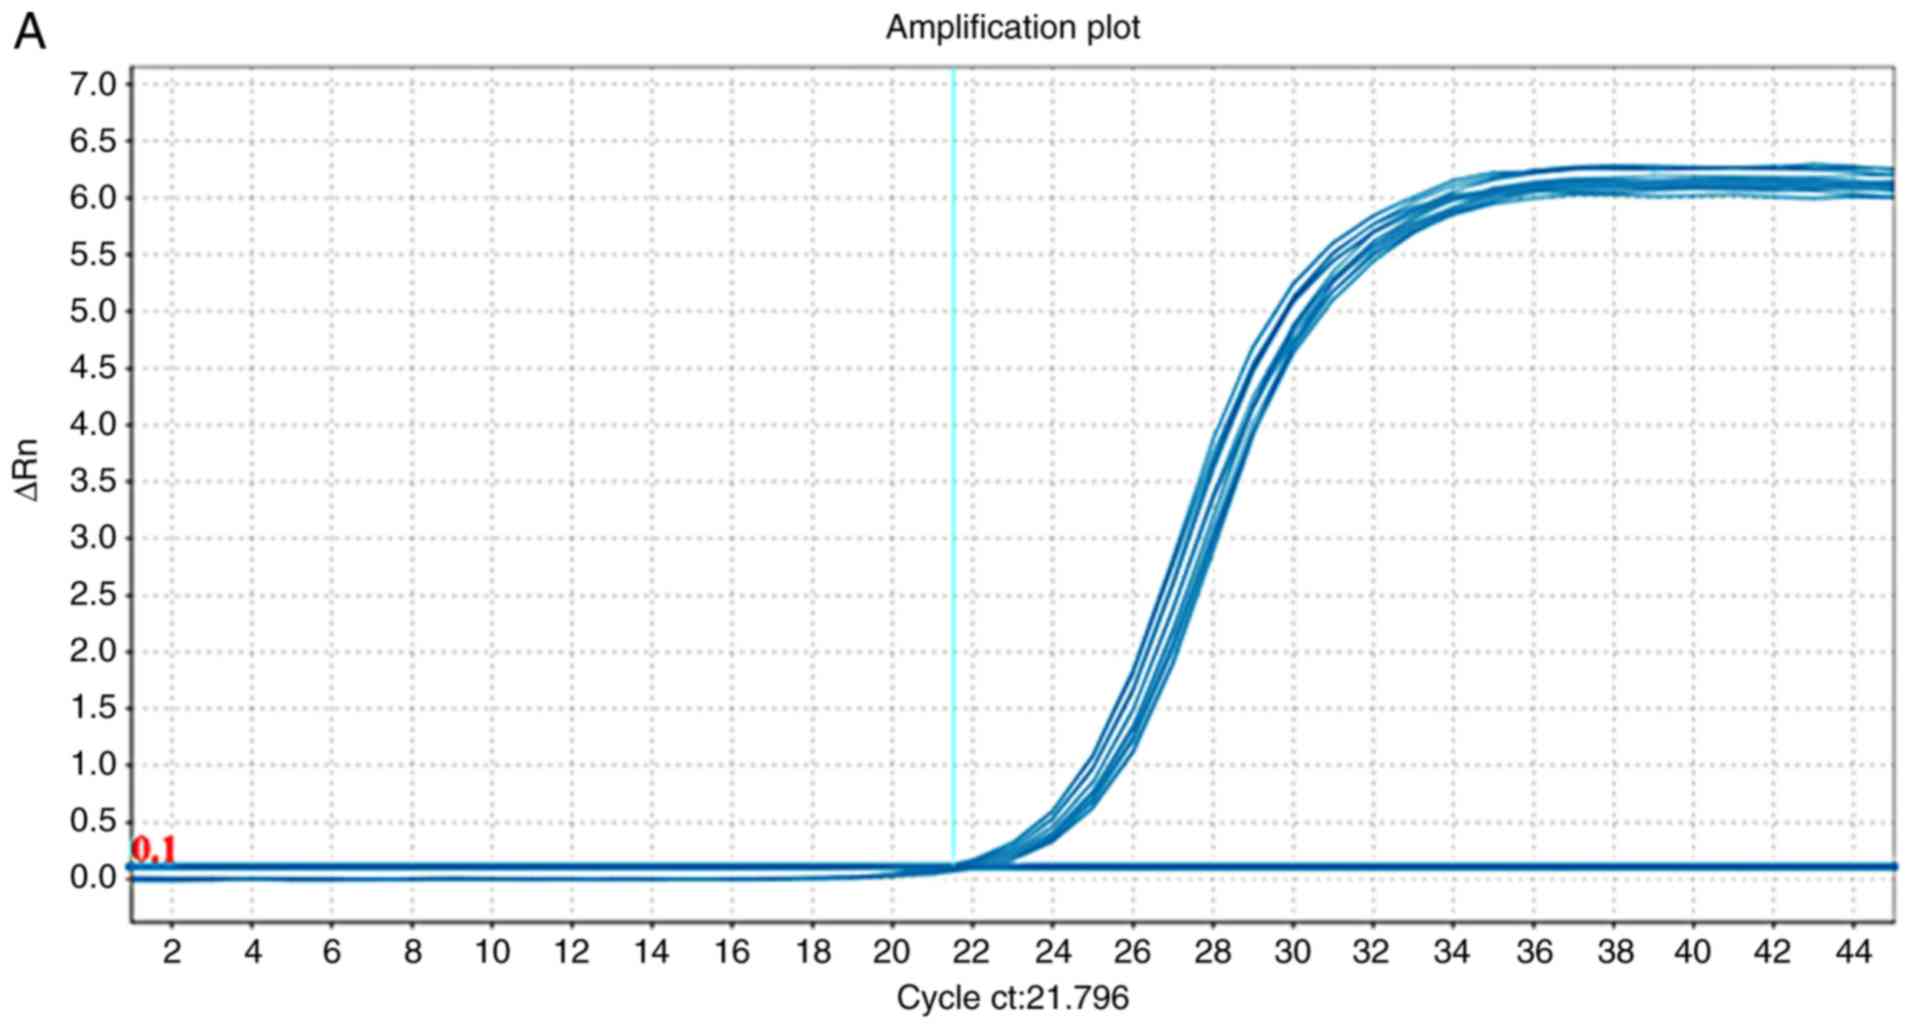 | Figure 4Amplification plots and dissociation
curves for selected tsRNAs. Amplification plots for (A)
tsRNA-23678, (B) tsRNA-23727, (C) tsRNA-23761. In the amplification
curves, the x-axis represents the cycle number, and the y-axis
represents the real-time fluorescence signal intensity of the
corresponding cycle number. In the dissociation curves, the x-axis
represents the temperature of the RT-qPCR products, and the y-axis
represents the real-time fluorescence-signal-intensity change rate
with increasing temperature. Differently colored curves correspond
to different RT-qPCRs. tsRNAs, tRNA-derived small RNA; RT-qPCR,
reverse transcription-quantitative PCR. Amplification plots and
dissociation curves for selected tsRNAs. Amplification plots for
(D) U6. Dissociation curves for (E) tsRNA-23678, (F) tsRNA-23727.
In the amplification curves, the x-axis represents the cycle
number, and the y-axis represents the real-time fluorescence signal
intensity of the corresponding cycle number. In the dissociation
curves, the x-axis represents the temperature of the RT-qPCR
products, and the y-axis represents the real-time
fluorescence-signal-intensity change rate with increasing
temperature. Differently colored curves correspond to different
RT-qPCRs. tsRNAs, tRNA-derived small RNA; RT-qPCR, reverse
transcription-quantitative PCR. Amplification plots and
dissociation curves for selected tsRNAs. Amplification plots for
(G) tsRNA-23761 and (H) U6. In the amplification curves, the x-axis
represents the cycle number, and the y-axis represents the
real-time fluorescence signal intensity of the corresponding cycle
number. In the dissociation curves, the x-axis represents the
temperature of the RT-qPCR products, and the y-axis represents the
real-time fluorescence-signal-intensity change rate with increasing
temperature. Differently colored curves correspond to different
RT-qPCRs. tsRNAs, tRNA-derived small RNA; RT-qPCR, reverse
transcription-quantitative PCR. |
| Table VIIComparison of RT-qPCR data with
RNA-seq data for tsRNAs. |
Table VII
Comparison of RT-qPCR data with
RNA-seq data for tsRNAs.
| Method | HA/HB ratio |
|---|
| tsRNA-23678 | tsRNA-23727 | tsRNA-23761 |
|---|
| RT-qPCR | 1.9452 | 1.6684 | 1.6997 |
| RNA-seq | 5.2361 | 8.8052 | 5.9145 |
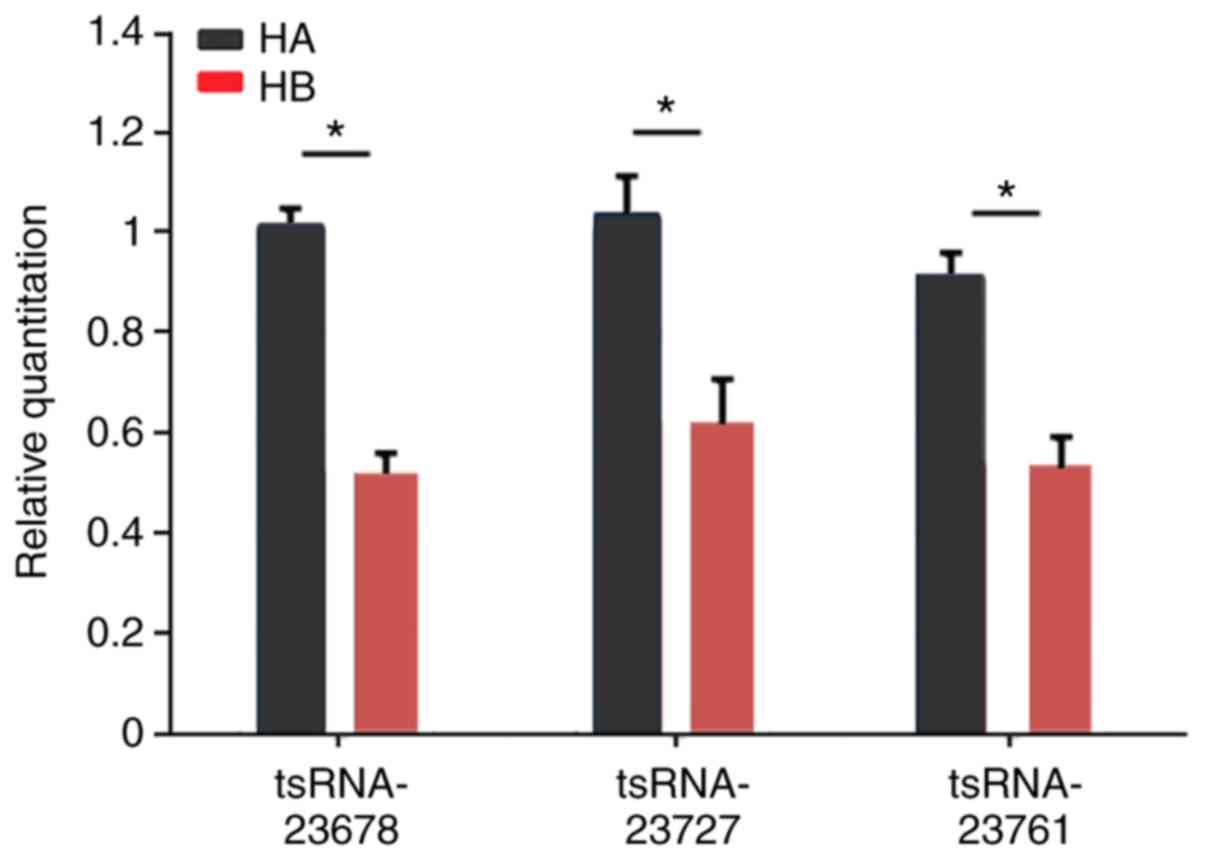
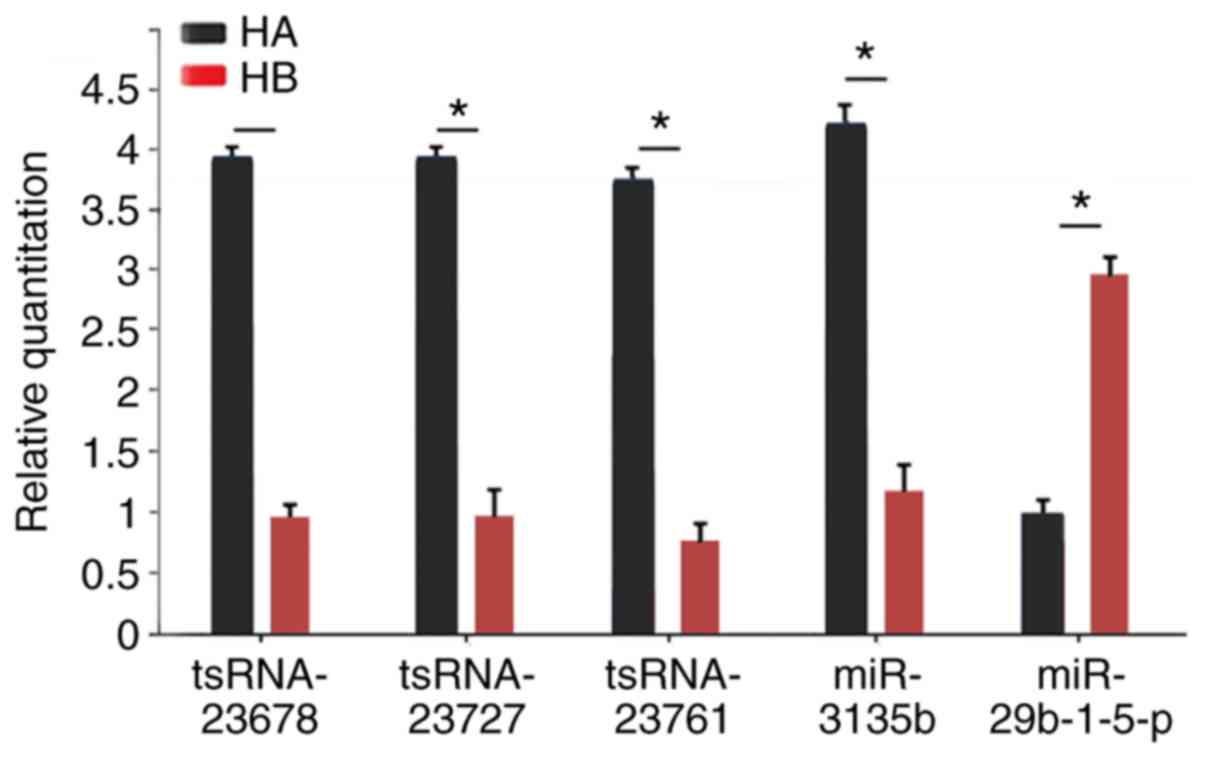
Expression of the several tsRNAs and
miRNAs between hypertrophic scar tissue and normal skin tissue
In order to verify the aforementioned results,
RT-qPCR assays were performed on selected tsRNAs (tsRNA-23678,
tsRNA-23727 and tsRNA-23761) and miRNAs (miR-3135b and
miR-29b-1-5p). Compared with normal skin tissue, the expression
levels of tsRNA-23678, tsRNA-23727, tsRNA-23761 and miR-3135b were
significantly upregulated in hypertrophic scar tissue, whereas the
expression of miR-29b-1-5p was significantly downregulated in
hypertrophic scar tissue (Fig.
6). These results demonstrate that the changes observed in
tissue were consistent with the bioinformatics results.
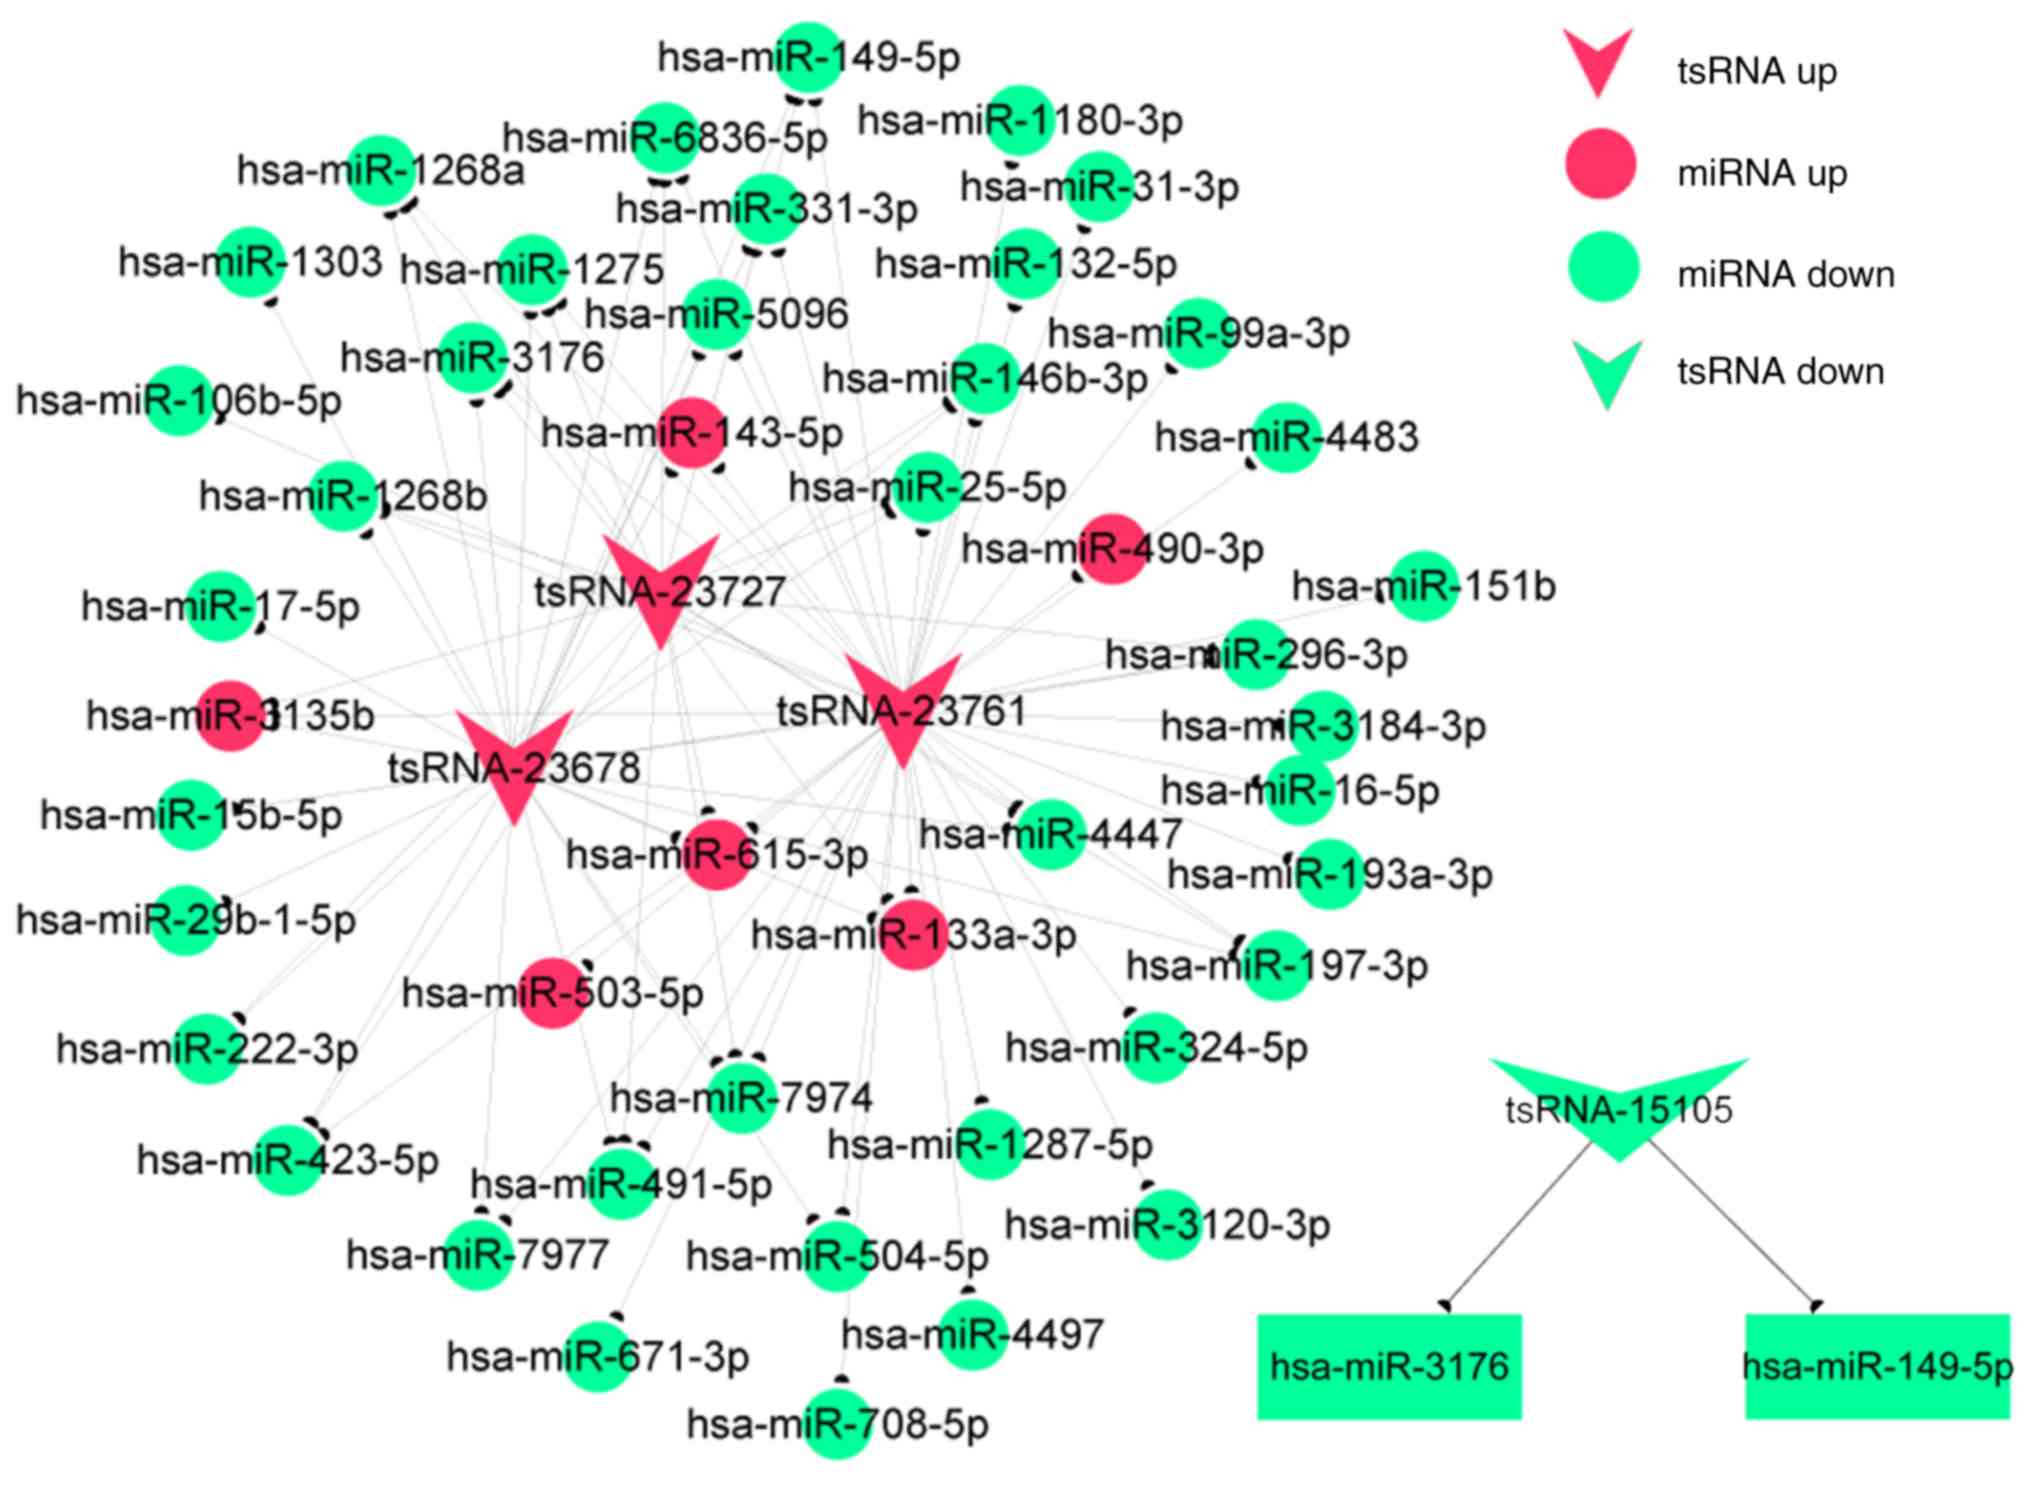
Construction of coexpression
networks
The functions of most tsRNAs are not currently
annotated. The functional prediction of tsRNAs is based on the
annotation of coexpressed miRNAs, and three differentially
expressed tsRNAs in fibroblasts were chosen in the present study
according to the degree of correlation. The coexpression network
(Fig. 7) showed that one tsRNA
might be associated with one or more miRNAs. A total of 40 miRNAs
were associated with the three tsRNAs. Furthermore, the
coexpression networks indicated these tsRNAs to be involved in a
number of biological processes, including cell adhesion,
proliferation, differentiation and metastasis. The network analysis
also demonstrated that tsRNA-23678 is associated with miR-29b-1-5p,
miR-222-3p and miR-423-5p, which had the same trends in expression.
This finding aids in the identification of regulatory relationships
between tsRNAs and miRNAs in hypertrophic scars.
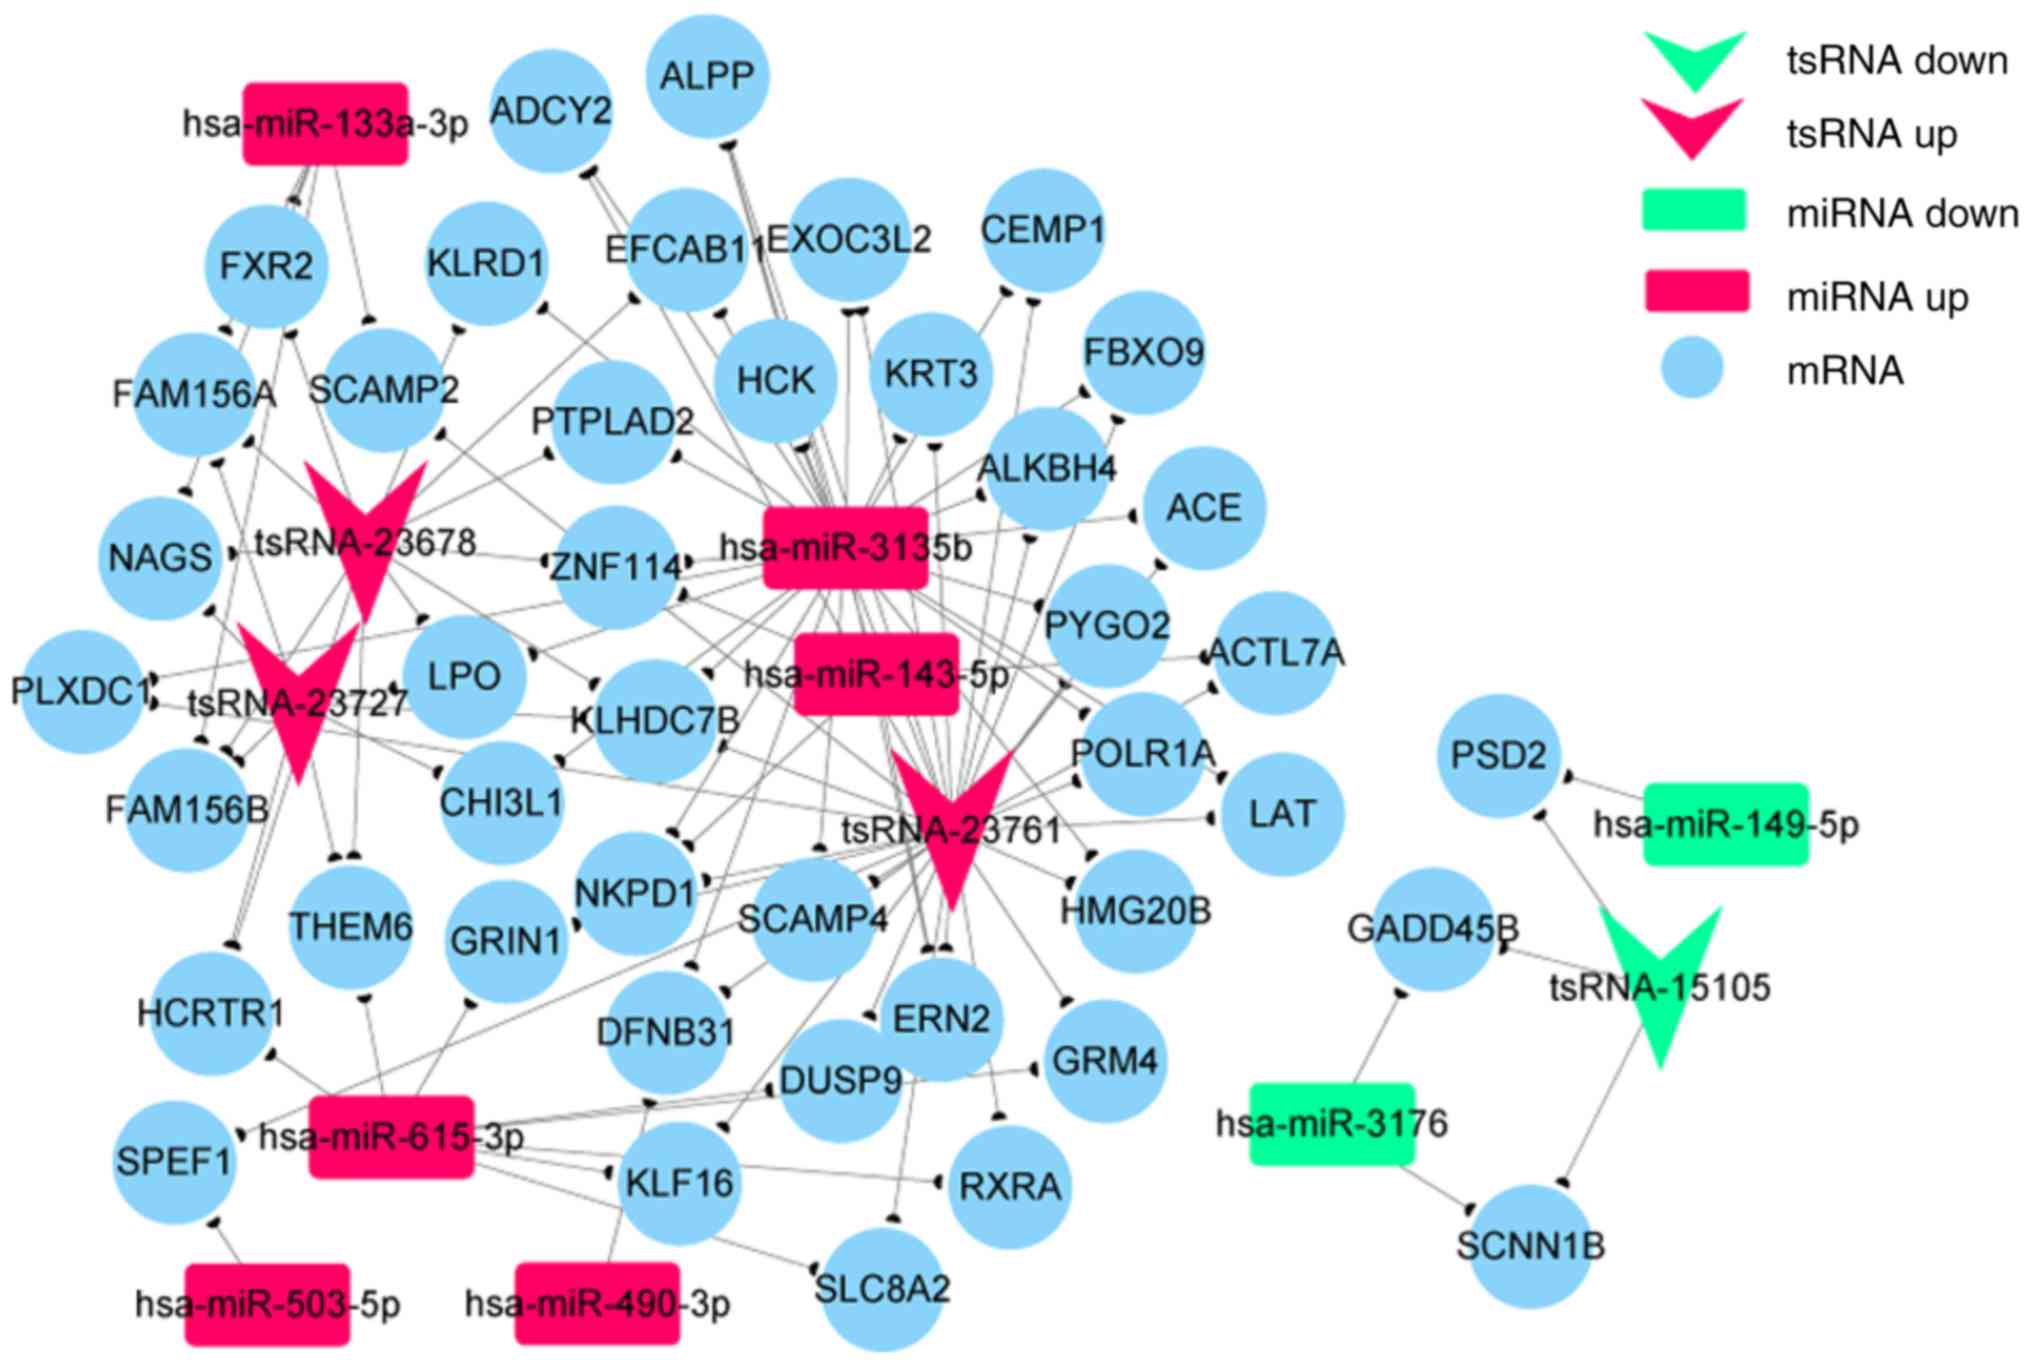
Construction of ceRNA networks
The ceRNA network hypothesis provides a new
mechanism for tsRNA-miRNA-mRNA interactions. miRNAs are known to
cause gene silencing by binding to mRNA, and tsRNAs may regulate
gene expression by competitively binding to miRNAs. Thus, tsRNAs
can be considered as ceRNAs. According to the ceRNA hypothesis,
numerous non-coding RNAs may function as ceRNAs, which compete for
the same microRNA response elements (MREs) and regulate each other
(21). The analysis of ceRNA
interactions aids in the functional characterization of such
noncoding transcripts. A tsRNA-miRNA-mRNA network associated with
hypertrophic scars was established in the present study using
high-throughput sequencing data (Fig.
8). In this network, tsRNA-23761 was positively associated with
miR-3135b. Furthermore, the network indicates that tsRNA-23761 is a
ceRNA of miR-3135b that targets angiotensin-converting enzyme (ACE)
and PYGO2, and tsRNA-23678 is a ceRNA of miR-133a-3p that targets
FXR2 and PNAGS.
Discussion
tsRNA, which is derived from tRNA, is a newly
discovered class of small molecular RNAs that are produced by the
cleavage of the tRNA ring by Dicer or angiogenin enzymes (11,30). tsRNA can be classified into five
different types: 5′- and 3′-tRNA fragments (tRFs); 5′-and
3′-halves; and 3′U tRFs (31,32). There is growing evidence that that
tsRNAs are associated with the development of tumors, cell
proliferation and viral replication (16), regulation of cell viability
(33), inhibition of protein
translation (34,35), regulation of cancer progression
(36), offspring metabolism
(37,38) and numerous other processes. It has
also been reported that tsRNA may have a regulatory function
similar to that of miRNA, which can act like a sponge to regulate
mRNA stability and participate in gene transcription and
translation (33). However, the
role of tsRNA in hypertrophic scars has not yet been reported.
Hypertrophic scar is a fibrotic disorder, mainly due to the
response of the body to injury, and caused by the excessive
proliferation of fibroblasts and excessive production of ECM
(39). Understanding the
relationship between hypertrophic scars and tsRNA may help to
elucidate the pathogenesis and pathophysiology of hypertrophic
scars and identify potential therapeutic targets for their clinical
treatment.
In the present study, high-throughput sequencing was
first applied to evaluate the differentially expressed profiles of
tsRNAs and miRNAs between hypertrophic scar fibroblasts and normal
skin fibroblasts. Differentially expressed tsRNAs and miRNAs were
identified, including 27 upregulated tsRNAs, such as tsRNA-23678,
tsRNA-23727, tsRNA-23761, tsRNA-04998, tsRNA-06150 and tsRNA-14697,
and 40 downregulated tsRNAs, such as tsRNA-05068, tsRNA-05070,
tsRNA-06213, tsRNA-06214, tsRNA-10278 and tsRNA-10279. In addition,
120 upregulated miRNAs, including miR-3135b, miR-10a-5p,
miR-10b-5p, miR-129-5p and miR-133a-3p, and 29 downregulated
miRNAs, including miR-29b-1-5p, miR-1275, miR-148b-5p, miR-151b and
miR-18a-5p were identified. Furthermore, GO functional enrichment
and KEGG pathway enrichment analyses were performed. These
differentially expressed tsRNAs were found to be enriched in a
number of important biological processes, including 'nervous system
development', 'cell adhesion', 'focal adhesion', 'protein binding',
'angiogenesis' and 'actin binding'. Some biological signaling
pathways, such as the 'Ras signaling pathway', the 'Rap1 signaling
pathway' and the 'cGMP-PKG signaling pathway' were also
significantly enriched. These pathways are associated with the
formation of new tissue, remodeling and inflammation, which are
important processes in wound healing (40-43). Subsequently, tissue experiments
were performed to detect the expression of several tsRNAs
(tsRNA-23678, tsRNA-23727 and tsRNA-23761) and miRNAs (miR-3135b
and miR-29b-1-5p). The present study revealed that tsRNAs-23678,
tsRNA-23727, tsRNA-23761 and miR-3135b were upregulated while
miR-29b-1-5p was downregulated in hypertrophic scar compared with
normal skin tissue, which is consistent with the in vitro
cell experiments. Our data showed that tsRNAs-23678, tsRNA-23727
and tsRNA-23761 belong to the 5′-tsRNA class of tsRNAs. Previous
studies have found that 5′-tsRNAs can regulate the differentiation
of stem cells and are involved in translational repression
(44). Subsequently, the possible
roles of tsRNAs-23678 and tsRNA-23761 in hypertrophic scars were
revealed by target prediction, coexpression network and ceRNA
analyses.
The results showed a significant upregulation of
tsRNA-23761, which targets collagen type I alpha 1 chain (COL1A1).
COL1A1 encodes the pro-a1 chains of type I collagen, the triple
helix of which comprises two a1 chains and one a2 chain. COL1 is a
fibril-forming collagen that is found in most connective tissues
and is abundant in tendons and dermis (45). Previous studies have confirmed
that COL1 is the main structural element of the ECM and that its
dysregulated accumulation leads to scarring (45-47). COL1 serves a critical role in the
development and progression of hypertrophic scars, and its
expression is increased in hypertrophic scars (46,47). The present study revealed that
tsRNA-23761 and COL1A1 exhibit common expression trends in
hypertrophic scarring. Overall, the dysregulation of tsRNA-23761
may contribute to the formation of hypertrophic scars.
In addition, TargetScan was used to predict
potential targets of tsRNA-23727, which included SMAD2. A previous
study has reported that SMAD2 gene expression in hyper-trophic scar
fibroblasts is significantly upregulated (48), and the present study revealed that
the expression of SMAD2 was positively associated with that of
tsRNA-23727. The SMAD protein family is homologous to the gene
products of the Drosophila mothers against decapentaplegic
(Mad) and the Caenorhabditis elegans Sma genes (49). SMAD proteins are signal
transducers and transcriptional modulators that mediate multiple
signaling pathways (50). In a
previous study, enhancement of SMAD expression promoted
transforming growth factor (TGF)-β1 secretion, and TGF-β1 induced
α-smooth muscle actin (α-SMA) expression, collagen synthesis and
the formation of hypertrophic scars (51). SMAD2 regulates numerous cellular
processes, including proliferation, survival, apoptosis and
dormancy (52-55). Altogether, the results of the
present study suggest that increased expression of tsRNA-23727
promotes the development of hypertrophic scars by targeting SMAD2.
This finding provides suggests that the function of tsRNAs in
hypertrophic scar fibroblasts may involve the regulation of key
mRNAs.
Significantly differentially expressed tsRNAs, such
as tsRNA-23678, tsRNA-23761 and tsRNA-23727, in hypertrophic scars
were selected for construction of an miRNA-tsRNA coexpression
network in the present study according to the degree of
correlation. Functional prediction of tsRNAs can be based on
annotation of the function of coexpressed miRNAs. In the present
study, analyses using TargetScan and miRanda databases were
performed to identify miRNAs with complementarity to the selected
tsRNAs. tsRNA-23678 was complementary to multiple miRNAs, including
miR-1268b, miR-1303, miR-1275, miR-17-5p, miR-15b-5p, miR-29b-1-5p,
miR-222-3p, miR-423-5p, miR-491-5p, miR-423-5p, miR-3135b,
miR-143-5p and miR-133a-3p. These miRNAs are implicated in a number
of biological processes, such as cell proliferation, the cell
cycle, apoptosis and angiogenesis. Some important related miRNAs
are known to be associated with hypertrophic scars, such as
miR-29b. Indeed, a previous study reported that miR-29b has
anti-fibrosis activity, and demonstrated that the overexpression of
miR-29b significantly reduced the expression levels of COL1A1 and
α-SMA, inhibited cell proliferation and induced apoptosis in
hypertrophic scar fibroblasts compared with normal fibroblasts
(56). The miR-29b mimic
remlarsen may be an effective treatment for preventing fibrotic
scars (hypertrophic scars or keloids) from forming, or for
preventing skin fibrosis such as scleroderma (57). miR-29 can directly inhibit YY1 and
TGF-β3, improve skeletal muscle atrophy and reduce renal fibrosis
by the lowering levels of YY1 and TGF-β pathway proteins (58). Consistent with this, Bi et
al (45) reported that the
miR-29 family plays a role in hypertrophic scars by regulating the
translation of ECM mRNA. In addition, the data from the present
study demonstrated that tsRNA-23678 was upregulated in hypertrophic
scar compared with normal skin, while the expression of
miR-29b-1-5p, a member of the miR-29b family, was markedly lower,
which indicated opposing effects. The coexpression network of
miRNA-tsRNA indicated that tsRNA-23678 was complementary to
miR-29b-1-5p. Functional prediction of tsRNA-23678 can be based on
annotation of the function of the coexpressed miR-29b-1-5p. These
findings suggest that tsRNA-23678 may be an important regulator of
hypertrophic scars. A tsRNA-miRNA-mRNA expression network based on
RNA-seq data was constructed to further investigate the mechanisms
underlying tsRNAs. This network indicated the predicted
tsRNA-miRNA-mRNA associations in hypertrophic scars and included
three tsRNAs, six miRNAs and 40 mRNAs. Recent studies have shown
that tsRNAs can be used directly as miRNAs to identify target mRNA,
both acting on mRNA and inhibiting target genes through translation
(59,60). The present study indicated that
tsRNA acts as a ceRNA. It is known that miRNA can lead to gene
silencing by binding to mRNA, whereas ceRNA regulates gene
expression by competing with miRNA (61). The ceRNA hypothesis indicates that
RNA molecules harboring MREs can communicate with each other by
competing with miRNA. Understanding this novel RNA crosstalk may
provide insight into the function of tsRNAs (62). The ceRNA network in the present
study showed that tsRNA-23761 may act as a competing endogenous RNA
that binds miR-3135b to regulate the expression of miR targets,
including ACE. The present high-throughput sequencing analysis
demonstrated tsRNA-23761 to be upregulated in hypertrophic scars;
associated miR-3135b and ACE were also upregulated, indicating a
similar trend. The ACE gene, located in the 17q23.3 position of
chromosome 17, encodes angiotensin I-converting enzyme. The
full-length ACE gene comprises 44,769 bp, and the full-length ACE
mRNA comprises 4,195 nt; the ACE gene harbors a total of 48 exons
and encodes 1,306 amino acid residues. Angiotensin II activation by
ACE is a significant mediator in wound healing and collagen
production. Previous studies have shown that the expression of ACE
in scars is significantly higher than that in normal skin, inducing
the conversion of angiotensin I to angiotensin II, leading to
excessive deposition of ECM and fibrosis, and regulating the
activity and proliferation of fibroblasts in proliferative scars
(63). ACE is an important
regulatory factor for the renin angiotensin aldosterone system and
the bradykinin system, which affect many physiological functions of
the human body (64). tsRNA-23761
competes with the miRNA pool to regulate ACE expression. It is
speculated that tsRNA-23761 may also affect the activity and
proliferation of fibroblasts in hypertrophic scars via the
regulation of certain mechanisms of ACE (63-65).
In summary, with the development of bioinformatics
technology, it has been discovered that tsRNAs serve important
roles in the occurrence and development of disease. However, the
functions of the majority of tsRNAs have not been annotated to
date. In the present study, tsRNAs that were differentially
expressed in fibroblasts and tissue derived from hypertrophic scar
tissue compared with normal skin tissue were identified. The data
indicate that tsRNA-23678, tsRNA-23727 and tsRNA-23761 were
significantly upregulated in fibroblasts and tissue derived from
hypertrophic scar compared with normal skin tissue. tsRNA-23678 may
serve critical functions through interaction with miR-29b-1-5p to
modulate hypertrophic scars. In addition, tsRNA-23761 may interact
with mRNA, such as ACE, to affect the activity and proliferation of
fibroblasts in hypertrophic scars. As hypertrophic scar development
is a dynamic process that is affected by many factors, the results
of the present study are preliminary and limited. Further in
vivo experiments are required to confirmed the results. The
significantly differentially expressed tsRNAs identified in the
present study may contribute to our understanding of the potential
mechanisms of hypertrophic scars, as well as therapeutic
strategies.
Supplementary Data
Acknowledgments
The authors would like to thank Professor Jianhua Fu
from the First Affiliated Hospital of Nanchang University for
providing samples for analysis in this study.
Funding
The present study was supported by grants from the
National Natural Science Foundation of China (grant no. 81860340)
and the special fund for the Graduate Innovation Project of
Nanchang University (grant no. CX2019166).
Availability of data and materials
The datasets used during the current study are
available from the corresponding author on reasonable request.
Authors' contributions
YZ and DL designed the study. YZ, QD, LT and DL
performed the experiments. YZ was also involved in data analysis
and completed the manuscript editing with the help of DL. All
authors read and approved the final version of the manuscript.
Ethics approval and consent to
participate
This study was approved by the Ethics Committee of
the First Affiliated Hospital of Nanchang University, and written
informed consent was obtained from all participants or their
parents/legal guardians.
Patient consent for publication
Not applicable.
Competing interests
The authors declare that they have no competing
interests.
References
|
1
|
Bayat A, McGrouther DA and Ferguson MW:
Skin scarring. BMJ. 326:88–92. 2003. View Article : Google Scholar : PubMed/NCBI
|
|
2
|
Sidgwick GP, Iqbal SA and Bayat A: Altered
expression of hyaluronan synthase and hyaluronidase mRNA may affect
hyaluronic acid distribution in keloid disease compared with normal
skin. Exp Dermatol. 22:377–379. 2013. View Article : Google Scholar : PubMed/NCBI
|
|
3
|
Syed F, Ahmadi E, Iqbal SA, Singh S,
McGrouther DA and Bayat A: Fibroblasts from the growing margin of
keloid scars produce higher levels of collagen I and III compared
with intral-esional and extralesional sites: Clinical implications
for lesional site-directed therapy. Br J Dermatol. 164:83–96. 2011.
View Article : Google Scholar
|
|
4
|
Wolfram D, Tzankov A, Pulzl P and
Piza-Katzer H: Hypertrophic scars and keloids-a review of their
pathophysiology, risk factors, and therapeutic management. Dermatol
Surg. 35:171–181. 2009. View Article : Google Scholar : PubMed/NCBI
|
|
5
|
Qi J, Liu Y, Hu K, Zhang Y, Wu Y and Zhang
X: MicroRNA-26a inhibits hyperplastic scar formation by targeting
Smad2. Exp Ther Med. 15:4332–4338. 2018.PubMed/NCBI
|
|
6
|
Zhu Z, Ding J, Shankowsky HA and Tredget
EE: The molecular mechanism of hypertrophic scar. J Cell Commun
Signal. 7:239–252. 2013. View Article : Google Scholar : PubMed/NCBI
|
|
7
|
van der Veer WM, Bloemen MC, Ulrich MM,
Molema G, van Zuijlen PP, Middelkoop E and Miessen FB: Potential
cellular and molecular causes of hypertrophic scar formation.
Burns. 35:15–29. 2009. View Article : Google Scholar
|
|
8
|
Rumsey N, Clarke A and White P: Exploring
the psychosocial concerns of outpatients with disfiguring
conditions. J Wound Care. 12:247–252. 2003. View Article : Google Scholar : PubMed/NCBI
|
|
9
|
Leblebici B, Adam M, Bagis S, Tarim AM,
Noyan T, Akman MN and Haberal MA: Quality of life after burn
injury: The impact of joint contracture. J Burn Care Res.
27:864–868. 2006. View Article : Google Scholar : PubMed/NCBI
|
|
10
|
Zuccaro J, Ziolkowski N and Fish J: A
systematic review of the effectiveness of laser therapy for
hypertrophic burn scars. Clin Plast Surg. 44:767–779. 2017.
View Article : Google Scholar : PubMed/NCBI
|
|
11
|
Li S, Xu Z and Sheng J: tRNA-Derived small
RNA: A novel regulatory small non-coding RNA. Genes (Basel).
9:E2462018. View Article : Google Scholar
|
|
12
|
Anderson P and Ivanov P: tRNA fragments in
human health and diease. FEBS Lett. 588:4297–4304. 2014. View Article : Google Scholar : PubMed/NCBI
|
|
13
|
Pliatsika V, Loher P, Telonis AG and
Rigoutsos I: MINTbase: A framework for the interactive exploration
of mitochondrial and nucleartRNA fragments. Bioinformatics.
32:2481–2489. 2016. View Article : Google Scholar : PubMed/NCBI
|
|
14
|
Zheng LL, Xu WL, Liu S, Sun WJ, Li JH, Wu
J, Yang JH and Qu LH: tRFCancer: A web server to detect
tRNA-derived small RNA fragments (tRFs) and their expression in
multiple cancers. Nucleic Acids Res. 44:W185–W193. 2016. View Article : Google Scholar : PubMed/NCBI
|
|
15
|
Lee YS, Shibata Y, Malhotra A and Dutta A:
A novel class of small RNAs: tRNA-derived RNA fragments (tRFs).
Genes Dev. 23:2639–2649. 2009. View Article : Google Scholar : PubMed/NCBI
|
|
16
|
Wang Q, Lee I, Ren J, Ajay SS, Lee YS and
Bao X: Identification and functional characterization of
tRNA-derived RNA fragments (tRFs) in respiratory syncytial virus
infection. Mol Ther. 21:368–379. 2013. View Article : Google Scholar :
|
|
17
|
Tomita K, Ogawa T, Uozumi T, Watanabe K
and Masaki H: A cytotoxic ribonuclease which specifically cleaves
four isoac-cepting arginine tRNAs at their anticodon loops. Proc
Natl Acad Sci USA. 97:8278–8283. 2000. View Article : Google Scholar
|
|
18
|
Deng J, Ptashkin RN, Wang Q, Liu G, Zhang
G, Lee I, Lee YS and Bao X: Human metapneumovirus infection induces
significant changes in small noncoding RNA expression in airway
epithelial cells. Mol Ther Nucleic Acids. 3:e1632014. View Article : Google Scholar : PubMed/NCBI
|
|
19
|
Gonzale N and Goleberg DJ: Update on the
treatment of scars. J Drugs Dermatol. 18:5502019.
|
|
20
|
Ault P, Plaza A and Paratz J: Scar massage
for hypertrophic burns scarring-A systematic review. Burns.
44:24–38. 2018. View Article : Google Scholar
|
|
21
|
Tu L, Huang Q, Fu S and Liu D: Aberrantly
expressed long noncoding RNAs in hypertrophic scar fibroblast in
vitro: A microarray study. Int J Mol Med. 41:1917–1930.
2018.PubMed/NCBI
|
|
22
|
Liu Y, Zhong L, Liu D, Ye H, Mao Y and Hu
Y: Differential miRNA expression profiles in human keratinocytes in
response to protein kinase C inhibitor. Mol Med Rep. 16:6608–6619.
2017. View Article : Google Scholar : PubMed/NCBI
|
|
23
|
Chen MH, Chen YJ, Ye YQ, Su Y and Li CY:
The factors affecting analysis of gene expression level by semi
qRT-PCR technique. Guzhou Agricultural Sciences. 29:28–30.
332009.
|
|
24
|
Lowe TM and Eddy SR: tRNAscan-SE: A
program for improved detection of transfer RNA genes in genomic
sequence. Nucleic Acids Res. 25:955–964. 1997. View Article : Google Scholar : PubMed/NCBI
|
|
25
|
Kumar P, Mudunuri SB, Anaya J and Dutta A:
tRFdb: A database for transfer RNA fragments. Nucleic Acids Res.
43:D114–D115. 2015. View Article : Google Scholar
|
|
26
|
Pliatsika V, Loher P, Magee R, Telonis AG,
Londin E, Shigematsu M, Kirino Y and Rigoutsos I: MINTbase v2.0: A
comprehensive database for tRNA-derived fragments that includes
nuclear and mitochondrial fragments from all The Cancer Genome
Atlas projects. Nucleic Acids Res. 46:D152–D159. 2018. View Article : Google Scholar :
|
|
27
|
Conesa A, Madrigal P, Tarazona S,
Gomez-Cabrero D, Cervera A, McPherson A, Szcześniak MW, Gaffney DJ,
Elo LL, Zhang X and Mortazavi A: A survey of best practices for
RNA-seq data analysis. Genome Biol. 17:132016. View Article : Google Scholar : PubMed/NCBI
|
|
28
|
Wang L, Feng Z, Wang X and Zhang X:
DEGseq: An R package for identifying differentially expressed genes
for RAN-seq data. Bioinformatics. 26:136–138. 2009. View Article : Google Scholar
|
|
29
|
Adnan M, Morton G and Hadi S: Analysis of
rpoS and bolA gene expression under various 0stress-induced
environments in planktoic and biofilm phase using 2(-ΔΔCT) method.
Mol Cell Biochem. 357:275–282. 2011. View Article : Google Scholar : PubMed/NCBI
|
|
30
|
Kim HK, Fuchs G, Wang S, Wei W, Zhang Y,
Park H, Roy-chaudhuri B, Li P, Xu J, Chu K, et al: A
transfer-RNA-derived small RNA regulates ribosome biogenesis.
Nature. 552:57–62. 2017. View Article : Google Scholar : PubMed/NCBI
|
|
31
|
Kumar P, Anaya J, Mudunuri SB and Dutta A:
Meta-analysis of tRNA derived RNA fragments reveals that they are
analysis of tRNA derived RNA fragments reveals that they are
evolutionarily conserved and associate with AGO proteins to
recognize specific RNA targets. BMC Biol. 12:782014. View Article : Google Scholar
|
|
32
|
Keam SP and Hutvagner G: tRNA-Derived
fragments (tRFs): Emerging new roles for an ancient RNA in the
regulation of gene expression. Life (Basel). 5:1638–1651. 2015.
|
|
33
|
Balatti V, Pekarsky Y and Croce CM: Role
of the tRNA-derived Small RNAs in cancer: New potential biomarkers
and target for therapy. Adv Cancer Res. 135:173–187. 2017.
View Article : Google Scholar : PubMed/NCBI
|
|
34
|
Maute RL, Schneider C, Sumazin P, Holmes
A, Califano A, Basso K and Dalla-Favera R: tRNA-derived microRNA
modulates proliferation and the DNA damage response and is
down-regulated in B cell lymphoma. Proc Natl Acad Sci USA.
110:1404–1409. 2013. View Article : Google Scholar : PubMed/NCBI
|
|
35
|
Sobala A and Hutvagner G: Small RNAs
derived from the 5′ end of tRNA can inhibit protein translation in
human cells. RNA Biol. 10:553–563. 2013. View Article : Google Scholar : PubMed/NCBI
|
|
36
|
Gebetsberger J, Zywicki M, Kunzi A and
Polacek N: tRNA-derived fragments target the ribosome and function
as regulatory non-coding RNA in Haloferax volcanii. Archaea.
2012:2609092012. View Article : Google Scholar
|
|
37
|
Goodarzi H, Liu X, Nguyen HC, Zhang S,
Fish L and Tavazoie SF: Endogenous tRNA-derived fragments suppress
breast cancer progression via YBX1 displacement. Cell. 161:790–802.
2015. View Article : Google Scholar : PubMed/NCBI
|
|
38
|
Kumar P, Kuscu C and Dutta A: Biogenesis
and function of transfer RNA-related fragments (tRFs). Trends
Biochem Sci. 41:679–689. 2016. View Article : Google Scholar : PubMed/NCBI
|
|
39
|
Atiyeh BS: Nonsurgical management of
hypertrophic scars: Evidence-based therapies, standardpractices,
and emerging methods. Aesthetic Plast Surg. 31:468–492. 2007.
View Article : Google Scholar
|
|
40
|
Nehme A, Cerutti C, Dhaouadi N, Gustin MP,
Courand PY, Zibara K and Bricca G: Atlas of tissue
renin-angiotensin-aldo-sterone system in human: A transcriptomic
meta-analysis. Sci Rep. 5:100352015. View Article : Google Scholar
|
|
41
|
Slack C: Ras signaling in aging and
metabolic regulation. Nutr Healthy Aging. 4:195–205. 2017.
View Article : Google Scholar : PubMed/NCBI
|
|
42
|
Koul HK, Pal M and Koul S: Role of p38 MAP
kinase signal transduction in solid tumors. Genes Cancer.
4:342–359. 2013. View Article : Google Scholar : PubMed/NCBI
|
|
43
|
Coelho MA, de Carne Trecesson S, Rana S,
Zecchin D, Moore C, Molina-Arcas M, East P, Spencer-Dene B, Nye E,
Barnouin K, et al: Oncogenic RAS signaling promotes tumor
immunoresistance by stabilizing PD-L1 mRNA. Immunity.
47:1083–1099.e6. 2017. View Article : Google Scholar : PubMed/NCBI
|
|
44
|
Krishna S, Yim DG, Lakshmanan V, Tirumalai
V, Koh JL, Park JE, Cheong JK, Low JL, Lim MJ, Sze SK, et al:
Dynamic expression of tRNA-derived small RNAs define cellular
states. EMBO Rep. 20:e477892019. View Article : Google Scholar : PubMed/NCBI
|
|
45
|
Bi S, Cao C, Chai LL, Li SR and Yang DY:
Regulatory mechanism of miR-29 over TGF-β1 and COL1 in scar cells.
Eur Rev Med Pharmacol Sci. 21:2512–2517. 2017.PubMed/NCBI
|
|
46
|
Xiao K, Luo X, Wang X and Gao Z:
MicroRNA185 regulates transforming growth factor-β1 and collagen1
in hypertrophic scar fibroblasts. Mol Med Rep. 15:1489–1496. 2017.
View Article : Google Scholar : PubMed/NCBI
|
|
47
|
Zeng G, Zhong F, Li J, Luo S and Zhang P:
Resveratrol-mediated reduction of collagen by inhibiting
proliferation and producing apoptosis in human hypertrophic scar
fibroblasts. Biosci Biotechnol Biochem. 77:2389–2396. 2013.
View Article : Google Scholar : PubMed/NCBI
|
|
48
|
Qi J, Liu Y, Hu K, Zhang Y, Wu Y and Zhang
X: MicroRNA-205-5p regulates extracellular matrix production in
hyperplastic scars by targeting Smad2. Exp Ther Med. 17:2284–2290.
2019.
|
|
49
|
Li Q: Inhibitory SMADs: Potential
regulators of ovarian function. Biol Reprod. 92:502015. View Article : Google Scholar : PubMed/NCBI
|
|
50
|
Zhang Y, Alexander PB and Wang XF: TGF-β
family signaling in the control of cell proliferation and survival.
Cold Spring Harb Perspect Biol. 9:a0221452017. View Article : Google Scholar
|
|
51
|
Zhang Z, Kuang F, Liu CL, Chen B, Tang WB
and Li XJ: Effects of silencing Smad ubiquitination regulatory
factor 2 on the function of human hypertrophic scar-derived
fibroblasts. Zhonghua Shao Shang Za Zhi. 33:145–151. 2017.In
Chinese. PubMed/NCBI
|
|
52
|
Asnaghi L, White DT, Key N, Choi J, Mahale
A, Alkatan H, Edward DP, Elkhamary SM, Al-Mesfer S, Maktabi A, et
al: ACVR1C/SMAD2 signaling promotes invasion and growth in
retinoblastoma. Oncogene. 38:2056–2075. 2019. View Article : Google Scholar :
|
|
53
|
Huang C, Wu XF and Wang XL: Trichostatin
Ainhibits phenotypic transition and induces apoptosis of the
TAF-treated normal colonic epithelial cells through regulation of
TGF-β pathway. Int J Biochem Cell Biol. 114:1055652019. View Article : Google Scholar
|
|
54
|
Yamazaki S and Nakauchi H: Bone marrow
Schwann cells induce hematopoietic stem cell hibernation. Int J
Hematol. 99:695–698. 2014. View Article : Google Scholar : PubMed/NCBI
|
|
55
|
LIU N, Li Y, SUN L, JIANG J and ZHANG J:
Expressions of Smad2 and Smad4 proteins in breast carcinoma tissue
and significances. J Jilin University (Medicine Edition).
42:763–767. 2016.
|
|
56
|
Li J, Cen B, Chen S and He Y: MicroRNA-29b
inhibits TGF-β1-induced fibrosis via regulation of the TGF-β1/Smad
pathway in primary human endometrial stromal cells. Mol Med Rep.
13:4229–4237. 2016. View Article : Google Scholar : PubMed/NCBI
|
|
57
|
Gallant-Behm CL, Piper J, Lynch JM, Seto
AG, Hong SJ, Mustoe TA, Maari C, Pestano LA, Dalby CM, Jackson AL,
et al: A MicroRNA-29 mimic (Remlarsen) represses extracellular
matrix expression and fibroplasia in the skin. J Invest Dermatol.
139:1073–1081. 2019. View Article : Google Scholar
|
|
58
|
Wang H, Wang B, Zhang A, Hassounah F, Seow
Y, Wood M, Ma F, Klein JD, Price SR and Wang XH: Exosome-mediated
miR-29 transfer reduces muscle atrophy and kidney fibrosis in mice.
Mol Ther. 27:571–583. 2019. View Article : Google Scholar : PubMed/NCBI
|
|
59
|
Luo S, He F, Luo J, Dou S, Wang Y, Guo A
and Lu J: Drosophila tsRNAs preferentially suppress general
translation machinery via antisense pairing and participate in
cellular starvation response. Nucleic Acids Res. 46:5250–5268.
2018. View Article : Google Scholar : PubMed/NCBI
|
|
60
|
Schopman NC, Heynen S, Haasnoot J and
Berkhout B: A miRNA-tRNA mix-up: TRNA origin of proposed miRNA. RNA
Biol. 7:573–576. 2010. View Article : Google Scholar : PubMed/NCBI
|
|
61
|
Li M, Liu DW and Lei W: Advances in the
research of effects of competing endogenous RNAs and their
regulatory networks in pathological scars of skin. Zhonghua Shao
Shang Za Zhi. 35:701–704. 2019.In Chinese. PubMed/NCBI
|
|
62
|
Tay Y, Rinn J and Pandolfi PP: The
multilayered complexity of ceRNA crosstalk and competition. Nature.
505:344–352. 2014. View Article : Google Scholar : PubMed/NCBI
|
|
63
|
Zhang YJ, Yang XS, Wu PS, Li X, Zhang XF,
Chen XQ and YU ZX: Effects of angiotensin II and losartan on the
growth and proliferation of hepatic stellate cells. Di Yi Jun Yi Da
Xue Xue Bao. 23:219–221. 2003.PubMed/NCBI
|
|
64
|
Wang R, Chen J, Zhang Z and Cen Y: Role of
chymase in the local renin-angiotensin system in keloids:
Inhibition of chymase may be an effective therapeutic approach to
treat keloids. Drug Des Devel Ther. 9:4979–4988. 2015.PubMed/NCBI
|
|
65
|
Demir CY, Ersoz ME, Erten R, Kocak OF,
Sultanoglu Y and Basbugan Y: Comparison of enalapril, candesartan
and intralesional triamcinolone in reducing hypertrophic scar
development: An experimental study. Aesthetic Plast Surg.
42:352–361. 2018. View Article : Google Scholar : PubMed/NCBI
|