Introduction
Colorectal cancer is the third most frequently
diagnosed type of cancer in humans and is a major cause of
cancer-related mortality worldwide (1). Despite the considerable progress in
colorectal cancer treatment, its mortality rate remains high and
the prognosis remains poor due to the lack of early diagnostic
techniques and efficient therapies (2). The majority of colorectal cancers
start as benign polyps and are not associated with distinct
symptoms until the tumor reaches an advanced stage (3,4).
Therefore, the early detection of colorectal cancer or benign polyp
is crucial for improving the prognosis or even preventing the
occurrence of colorectal cancer. The occurrence of colorectal
cancer is a complex multistep process involving multiple genes:
Some genetic mutations may be present in the colorectal epithelial
cells at birth, but most mutations result from the effects of
acquired environmental factors or DNA replication mismatches
(5). The process includes changes
from normal epithelium to abnormal hyperplasia, adenoma,
cancerization and cancer metastasis, and a series of mutations,
mismatches, activation of oncogenes and identification of tumor
suppressor genes occur during this process (6). Although some molecular biomarkers
for the early detection of the incidence and development of
colorectal cancer have been identified, their clinical application
is currently limited (7,8). Therefore, there is an urgent need to
identify novel biomarkers for colorectal cancer and its
prognosis.
Synaptotagmins (SYTs) are a family of
membrane-associated synaptic vesicle transport proteins that
largely serve as Ca2+ sensors in vesicular trafficking
and exocytosis (9,10). SYTs are characterized by a short
extracellular N-terminal, a transmembrane domain, two tandem C2
domains and a short C-terminal region (11,12). SYTs are found primarily in tissues
that possess regulatory secretory pathways. At least 16 isoforms of
SYTs have been identified according to biochemical and phylogenetic
analyses (9,13). SYT13 is an atypical member of the
SYT family (14). The most
conserved function across the protein family appears to be
Ca2+-independent binding to target SNARE heterodimers
during membrane fusion, while SYT13 is one of the only two SYTs
(including SYT12) that cannot bind to this complex (15,16). Additionally, SYT13 lacks the
Ca2+-dependent phospholipid-binding properties conserved
in several of the family members (16). However, the function of SYT13,
particularly the association between SYT13 and human cancers,
remains largely unknown and is rarely reported. Grønborg et
al reported reduced expression of SYT13 in a genome-wide
analysis of pancreatic ductal adenocarcinoma compared with normal
cells (17). Moreover, Jahn et
al reported that human SYT13 acts as a liver tumor suppressor
gene by complementing the molecular defect in GN6TF rat liver tumor
cells to achieve normalized cellular phenotype and suppression of
tumorigenicity (18).
Despite these results, however, research on the
association between SYT13 and colorectal cancer is lacking.
Therefore, the aim of the present study was to investigate the role
of SYT13 in the development and progression of colorectal cancer.
Immunohistochemical (IHC) staining was used to detect the
difference in expression of SYT13 between colorectal cancer tissues
and paracancerous tissues. SYT13 knockdown cell lines were
constructed through infection of shSYT13 lentivirus plasmid and
verified by western blot analysis and reverse
transcription-quantitative PCR (RT-qPCR). MTT, colony formation,
wound healing and Transwell assays were used to evaluate the effect
of SYT13 knockdown on the biological behaviors of RKO and HCT116
cells. Cell apoptosis and cell cycle profiles were detected by
fluorescence-activated cell sorting (FACS) to investigate the
association between SYT13 knockdown and cell apoptosis. Finally, a
mouse xenograft model was constructed to further verify the role of
SYT13 in colorectal cancer.
Materials and methods
Target shRNA sequence design, shRNA
lentiviral vector construction and cell infection
The human colorectal cancer cell lines RKO, HCT116,
HT-29 and Caco2 were purchased from BeNa Culture Collection and
cultured with DMEM (Corning Inc.) supplemented with 10% FBS
(Invitrogen; Thermo Fisher Scientific, Inc.) at 37°C with 5%
CO2. The medium was changed every 72 h.
Short hairpin RNAs (shRNAs) targeting SYT13-RNAi
sequences (shSYT13-1: 5′-ATG TCT CTG TCA AGG TGA CCT-3′, shSYT13-2:
5′-ACC TCC ACT CTA ACC AGT CCA-3′, shSYT13-3: 5′-CCT GGA CTA TGA
CTG TCA GAA-3′) were designed and synthesized (Generay Biotech Co.
Ltd.). The shRNA was then cloned into lentiviral vector [with green
fluorescent protein (GFP), Shanghai Biosciences] to form
recombinant lentiviral shRNA expression vector. ShRNA-expressing
lentiviruses were packaged and amplified by PCR and lentivirus
plasmids were purified using ultracentrifugation. RKO, HCT116 cell
suspensions were formed by trypsinization. Suspensions were
cultured in six-well plates at 50,000 cells per well and incubated
at 37°C, 5% CO2 for 24 h. Subsequently, the suspensions
were infected with shRNA-containing lentiviruses and, 24 h later,
the culture medium was replaced. The cells were cultured for a
further 48 h, and the fluorescence of GFP was observed under a
fluorescence microscope to ensure that >80% cells were
infected.
Immunohistochemical (IHC) staining
Paraffin-embedded human colorectal cancer and
adjacent tissue microarray (TMA) was purchased from Shanghai Outdo
Biotech Co., Ltd. (HCoA180Su15-M). All patients provided written
informed consent prior to sample collection. The sections were
deparaffinized. After citrate antigen repair and blocking, the
samples were incubated with the anti-SYT13 antibody (1;100, Abcam,
cat. no. ab110520) at 4°C overnight in an incubator. Tissue
sections were stained with DAB, and again stained with hematoxylin.
Images were captured using a photomicroscope (Olympus Corporation)
and analyzed. Anti-Ki-67 antibody was purchased from Abcam (1:200,
cat. no. ab16667) and used in IHC analysis of xenograft tumors.
RNA extraction and RT-qPCR
Target gene shSYT13 expression levels were measured
by RT-qPCR. Briefly, TRIzol reagent (Invitrogen; Thermo Fisher
Scientific, Inc.) was used to extract the RNA according to the
manufacturer's instructions. Reverse Transcription kit (Takara) was
used to synthesize cDNAs. The qPCR was carried out using Power
SYBR-Green (Takara). GAPDH was used as an internal control. The PCR
cycling conditions were as follows: Initial denaturation at 95°C
for 30 sec, followed by 45 cycles at 95°C for 5 sec, 60°C for 30
sec, 95°C for 15 sec, 55°C for 30 sec and 95°C for 15 sec. RT-qPCR
and data collection were carried out. Nanodrop 2000/2000C
spectrophotometers (Thermo Fisher Scientific, Inc.) were used to
analyze the relative levels of mRNAs and the quality of extracted
RNA.
The primers used in qPCR were as follows: SYT13
forward: 5′-CCA AGG GAG TGT GGC CAA TA-3′ and reverse: 5′-CAC AGA
TGT CCC GTC CAG G-3′; and GAPDH forward: 5′-TGA CTT CAA CAG CGA CAC
CCA-3′ and reverse: 5′-CAC CCT GTT GCT GTA GCC AAA-3′.
Western blot analysis
Cells were collected and lysed by using RIPA lysis
buffer (Cell Signaling Technology, Inc.) including protease
inhibitors on ice according to the manufacturer's instruction. The
extracted protein was quantified by the BCA Protein Assay kit
(Pierce; Thermo Fisher Scientific, Inc., cat. no. 23225). Then, the
total protein was subjected to SDS-PAGE (10%) for western blot
analysis (20 µg per lane). After transferring to
polyvinylidene difluoride (PVDF) membranes, blots were incubated
with 5% BSA in Tris-buffered saline containing 0.5% Tween-20 for 60
min and incubated overnight at 4°C on a rocker with the following
primary antibodies: SYT13 (1:1,000, Abcam, cat. no. ab110520),
N-cadherin (1:1,000; Abcam, cat. no. ab18203), vimentin (1:2,000;
Abcam, cat. no. ab92547), Snail (1:1,000; Cell Signaling
Technology, Inc., cat. no. 3879S), Bad (1:1,000; Abcam, cat. no.
ab32445), Bcl-2 (1:1,000; Abcam, cat. no. ab194583), P53 (1:1,000;
Abcam, cat. no. ab26), Survivin (1:2,000; Abcam, cat. no. ab469)
and GAPDH (1:3,000; Bioworld, cat. no. AP0063). After washing three
times with TBST for 5 min, the sections were incubated with
horseradish peroxidase (HRP) conjugated goat anti-rabbit IgG
polyclonal secondary antibody (1:3,000; Beyotime Institute of
Biotechnology, cat. no. A0208) at room temperature for 1 h. An ECL
Plus™ western blotting system kit (GE Healthcare) was operated for
color developing.
MTT assay
Cell viability was assessed using an MTT assay.
After the trypsinization of cells in the logarithmic growth phase
in each experimental group, 2,000 cells/well were seeded into a
96-well (100 µl/well) plate (Corning Inc., cat. no. 3599)
overnight. A total of 20 µl MTT (5 mg/ml) (Genview, cat. no.
JT343) was added to each well 4 h prior to culture termination.
DMSO (100 µl) was added to dissolve formazan crystals.
Absorbance values at 490 nm were determined for each well using
enzyme-connected immunodetector and the reference wavelength was
570 nm. The absorbance is associated with the percentage of living
cells. The cell viability ratio was calculated using optical
density (OD) as follows: Cell viability (%)=OD (treated)/OD
(control) ×100%.
Celigo cell counting assay
RKO and HCT116 cells infected with shSYT13 or shCtrl
were seeded into 96-well plates at a density of 1,000 cells/well.
The cells were cultured in a 5% CO2 incubator at 37°C
for 1 day. Then cell images were captured using Celigo image
cytometer (Nexcelom Bioscience) once per day for 5 days. The cell
numbers were also quantified by using Celigo image cytometer.
Colony formation assay
Four days after RKO and HCT116 cells were infected,
cells in the logarithmic growth phase were digested by trypsin,
resuspended, counted and seeded in 6-well plates at 400-1,000 cells
per well. The cells were incubated for 14 days to form colonies.
Then, the cells were washed by PBS, fixed in paraformaldehyde for 1
h, stained with Giemsa for 20 min, washed three times by
ddH2O and then photographed with a digital camera. The
number of colonies (>50 cells/colony) was counted under a
fluorescence microscope (MicroPublisher 3.3RTV, Olympus
Corporation).
Wound healing assay
RKO and HCT116 infected cells were spread at the
bottom of 96-well plates. A linear wound was created by scraping
with a 100-µl pipette tip across the confluent cell layer.
After washing the cells three times to remove detached cells and
debris, serum-free medium was added into the 96-well plates and
incubated under the usual culture conditions (37°C, 5%
CO2) for 48 h. Wound closure photographs were captured
using a light microscope (DFC500, Leica Microsystems GmbH) at
indicated time points and the outcomes were analyzed.
Transwell assay
Under aseptic conditions, Transwell assay was
conducted by Polycarbonate Membrane Corning Transwell experimental
kit (Corning Inc.) in an empty 24-well plate. For migration
detection, 10,000 cells were cultured in the upper chambers with
serum-free medium. For invasion detection, the same number of cells
were cultured in the upper chambers of Matrigel-coated inserts with
serum-free medium. A total of 600 µl of medium supplemented
with 30% FBS was added to the lower chamber as the chemoattractant.
After cell culture for the indicated time, the medium and cells
remaining on the upper chamber were removed. Cells that had
migrated to the lower chamber were stained by Giemsa for 20 min,
washed several times, and images were captured during microscopic
inspection (MicroPublisher 3.3RTV, Olympus Corporation) according
to the manufacturer's instructions.
Apoptotic assay
Cell apoptosis was detected by using Annexin V
Apoptosis Detection kit APC (88-8007-74, eBioscience). Briefly,
lentivirus-infected cells were seeded in 6-cm dishes and then the
cells were digested by trypsin and resuspended, followed by the
addition of 10 µl Annexin V-APC for cell staining for 15 min
in the dark. The percentage of apoptotic cells was measured using
FACScan (Merck KGaA) to assess the apoptotic rate, and the results
were analyzed. Notably, the green fluorescence of GFP on the
lentivirus vector was detected simultaneously, ensuring that only
cells successfully infected with lentivirus were detected in the
apoptotic assay.
Detection of cell cycle by
fluorescence-activated cell sorting (FACS)
RKO and HCT116 cells were washed by D-Hanks,
digested by trypsin and centrifuged at 320 × g at 4°C for 5 min
when cells had grown to ~80% confluence after infection. Then,
cells were washed twice with cold PBS, fixed with cold 70% ethanol
for 1 h, centrifuged at 320 × g at 4°C for 5 min to discard ethanol
and then resuspended in PBS. Finally, the cells were stained by
propidium iodide (PI) (Sigma-Aldrich; Merck KGaA, cat. no. P4170)
(PI 2 mg/ml, RNase 10 mg/ml and PBS) and a total of 10,000 fixed
cells were analyzed by BD FACSCalibur flow cytometer (BD
Biosciences) with the throughput of cells ~200-350 cell/sec.
Tumorigenesis in vivo
Animal experiments were approved by the Ethics
Committee of Shanghai Tongji University and were carried out in
accordance with the institutional guidelines for animal care and
protection. A total of 10 BALB/c male nude mice (10-15 g, 6 weeks
old) were purchased from Shanghai Jiesijie Experimental Animals
Co., Ltd., housed under SPF conditions in the laboratory with a
12/12 day/night cycle and fed with a standard diet. RKO cells
(5×10⁶ per mouse) transduced with shSYT13 (n=5) or the
negative control (n=5) were subcutaneously injected into BALB/c
male nude mice. Tumor growth was monitored and the volume was
measured (length x height x width) at 4, 7, 11, 14 and 17 days
post-inoculation by a caliper. At 17 days after injection, the mice
were euthanized by injecting 1% pentobarbital sodium (100 mg/kg
body weight) and xenograft tumors were weighed.
Statistical analysis
The data are expressed as mean ± standard deviation
(n≥3) and analyzed using GraphPad Prism 6 software (GraphPad
Software, Inc.). The results of qPCR were analyzed by the
2−∆∆Cq method (19)
and the ∆Cq method was used in background expression detection.
Chi-squared test was used for categorical variables. Continuous
variables were compared with Student's t-test (two groups). One-way
ANOVA followed by Bonferroni post hoc test was performed to
evaluate the significance of the differences among 3 or more
groups. P-values <0.05 were considered to indicate statistically
significant differences.
Results
High expression of SYT13 in tumor tissues
and construction of SYT13 knockdown RKO and HCT116 cell lines
First, IHC analysis was applied to investigate
whether SYT13 is differentially expressed between colorectal tumor
tissues and paracancerous tissues. As shown in Fig. 1A, the IHC results demonstrated
distinctly higher expression of SYT13 in tumor tissues compared
with that in paracancerous tissues. The percentage of high SYT13
expression was 80% in colorectal cancer tissues and 48% in adjacent
non-cancerous tissues (P<0.001; Table I). Moreover, the background
expression of SYT13 in human colorectal cancer cell lines,
including RKO, HCT116, HT-29 and Caco2, was detected by qPCR and
western blot analysis and revealed relatively high expression of
SYT13 in RKO and HCT116 cells (Fig.
1B). Therefore, the RKO and HCT116 cell lines were selected as
the cell model and infected with the artificially prepared shSYT13
lentivirus plasmid, which was tagged by GFP, for SYT13 knockdown.
The infection efficiency was evaluated through observation and
analysis of the GFP expression at 72 h post-infection in the cells,
with >80% knockdown efficiencies for both cell lines proving
successful infection (Fig. 1C).
Subsequently, RNAi sequence screening was performed by RT-qPCR and
verified by western blot analysis, demonstrating the efficacy of
SYT13 knockdown by shSYT13-3 (Fig. 1D
and E), which was used in all the subsequent experiments. The
results demonstrated that, compared with the negative control, the
protein levels of SYT13 in both cell lines were obviously
suppressed and the mRNA levels of SYT13 in RKO and HCT116 cells
were downregulated by 62.7 and 65.5%, respectively (both
P<0.05). Therefore, based on the high expression of SYT13 in
colorectal cancer, cell models of SYT13 knockdown were successfully
established.
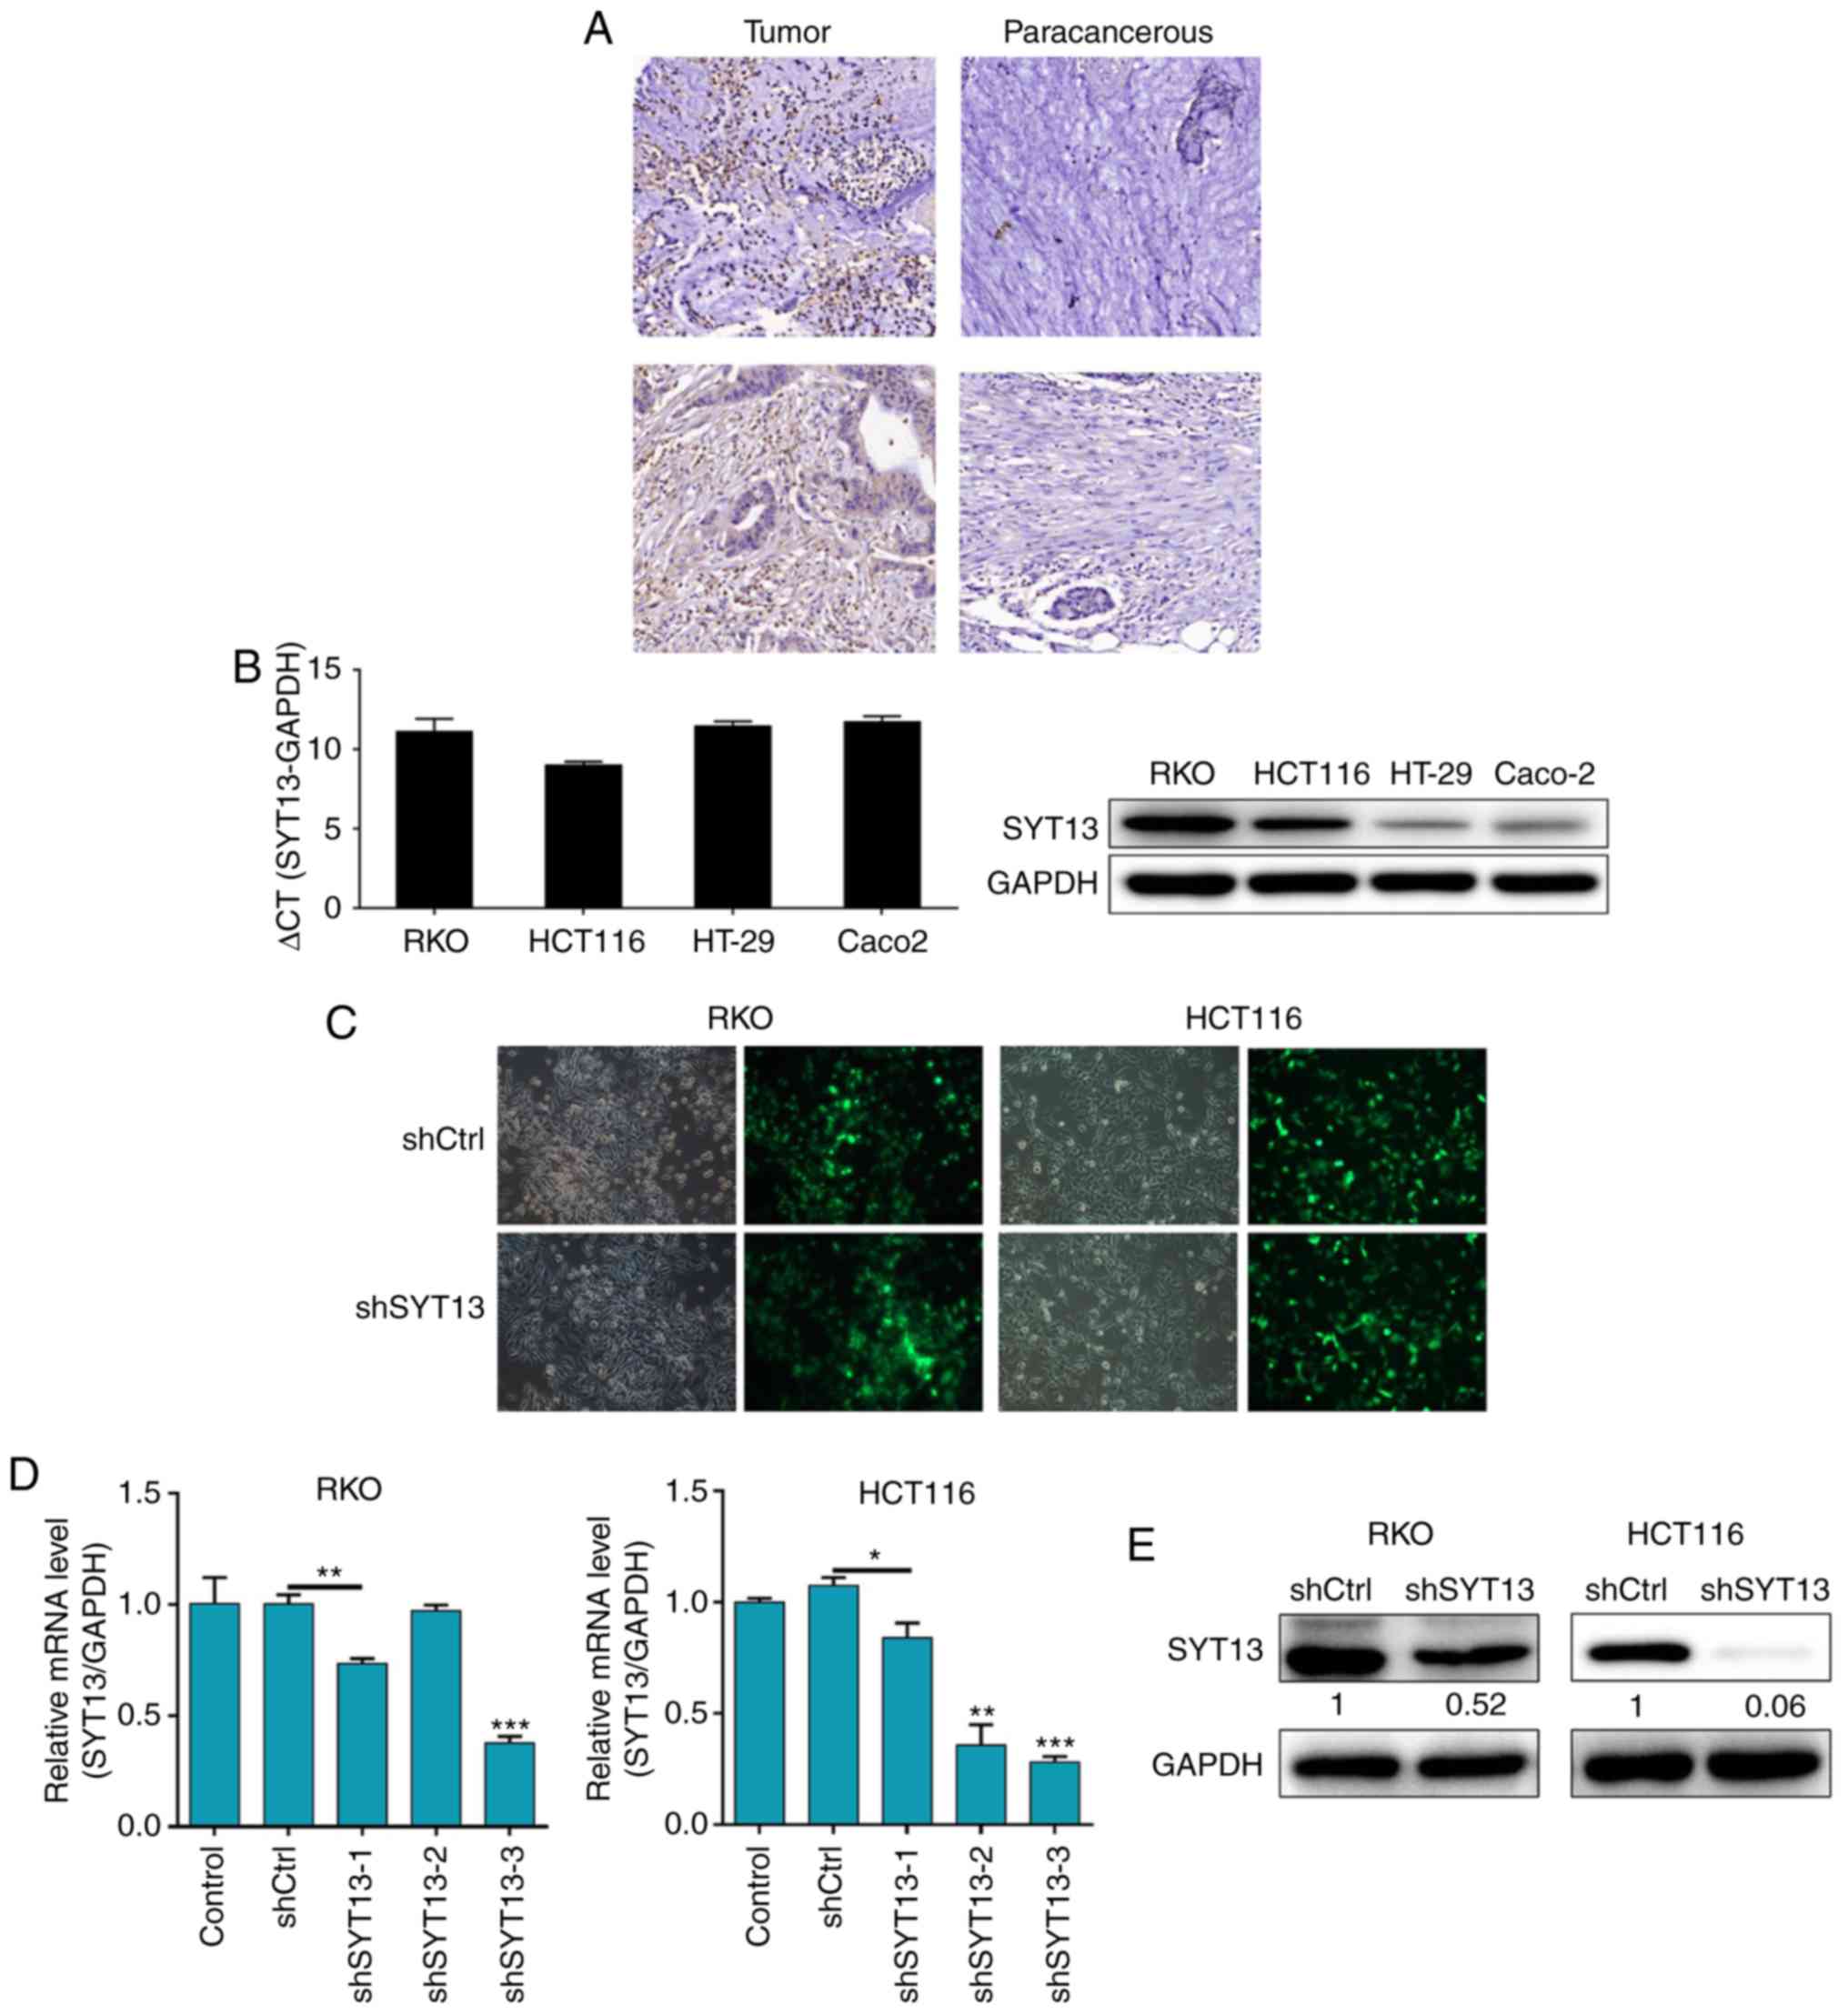 | Figure 1High expression of SYT13 in tumor
tissues and construction of SYT13 knockdown cell models. (A) The
expression levels of SYT13 in colorectal tumor tissues and
paracancerous tissues were detected by immunohistochemical staining
(magnification, ×200). (B) The background expression of SYT13 in
human colorectal cancer cell lines, including RKO, HCT116, HT-29
and Caco2, was detected by qPCR and western blot analyses,
respectively. (C) The infection efficiencies for both cell lines
were evaluated by the expression of green fluorescent protein at 72
h post-infection (magnification, ×200). (D and E) The validity and
efficiency of SYT13 knockdown were evaluated by (D) RT-qPCR and (E)
western blot analysis. Data are presented as the mean ± standard
deviation (n≥3). *P<0.05, **P<0.01,
***P<0.001. SYT, synaptotagmin; RT-qPCR, reverse
transcription-quantitative polymerase chain reaction. |
 | Table IExpression patterns of SYT13 in
colorectal cancer tissues and paracancerous tissues as determined
by immunohisto-chemical analysis. |
Table I
Expression patterns of SYT13 in
colorectal cancer tissues and paracancerous tissues as determined
by immunohisto-chemical analysis.
| SYT13
expression | Tumor tissues
| Paracancerous
tissues
|
|---|
| Cases, n | Percentage, % | Cases, n | Percentage, % |
|---|
| Low | 10 | 20 | 26 | 52 |
| High | 40 | 80 | 24 | 48 |
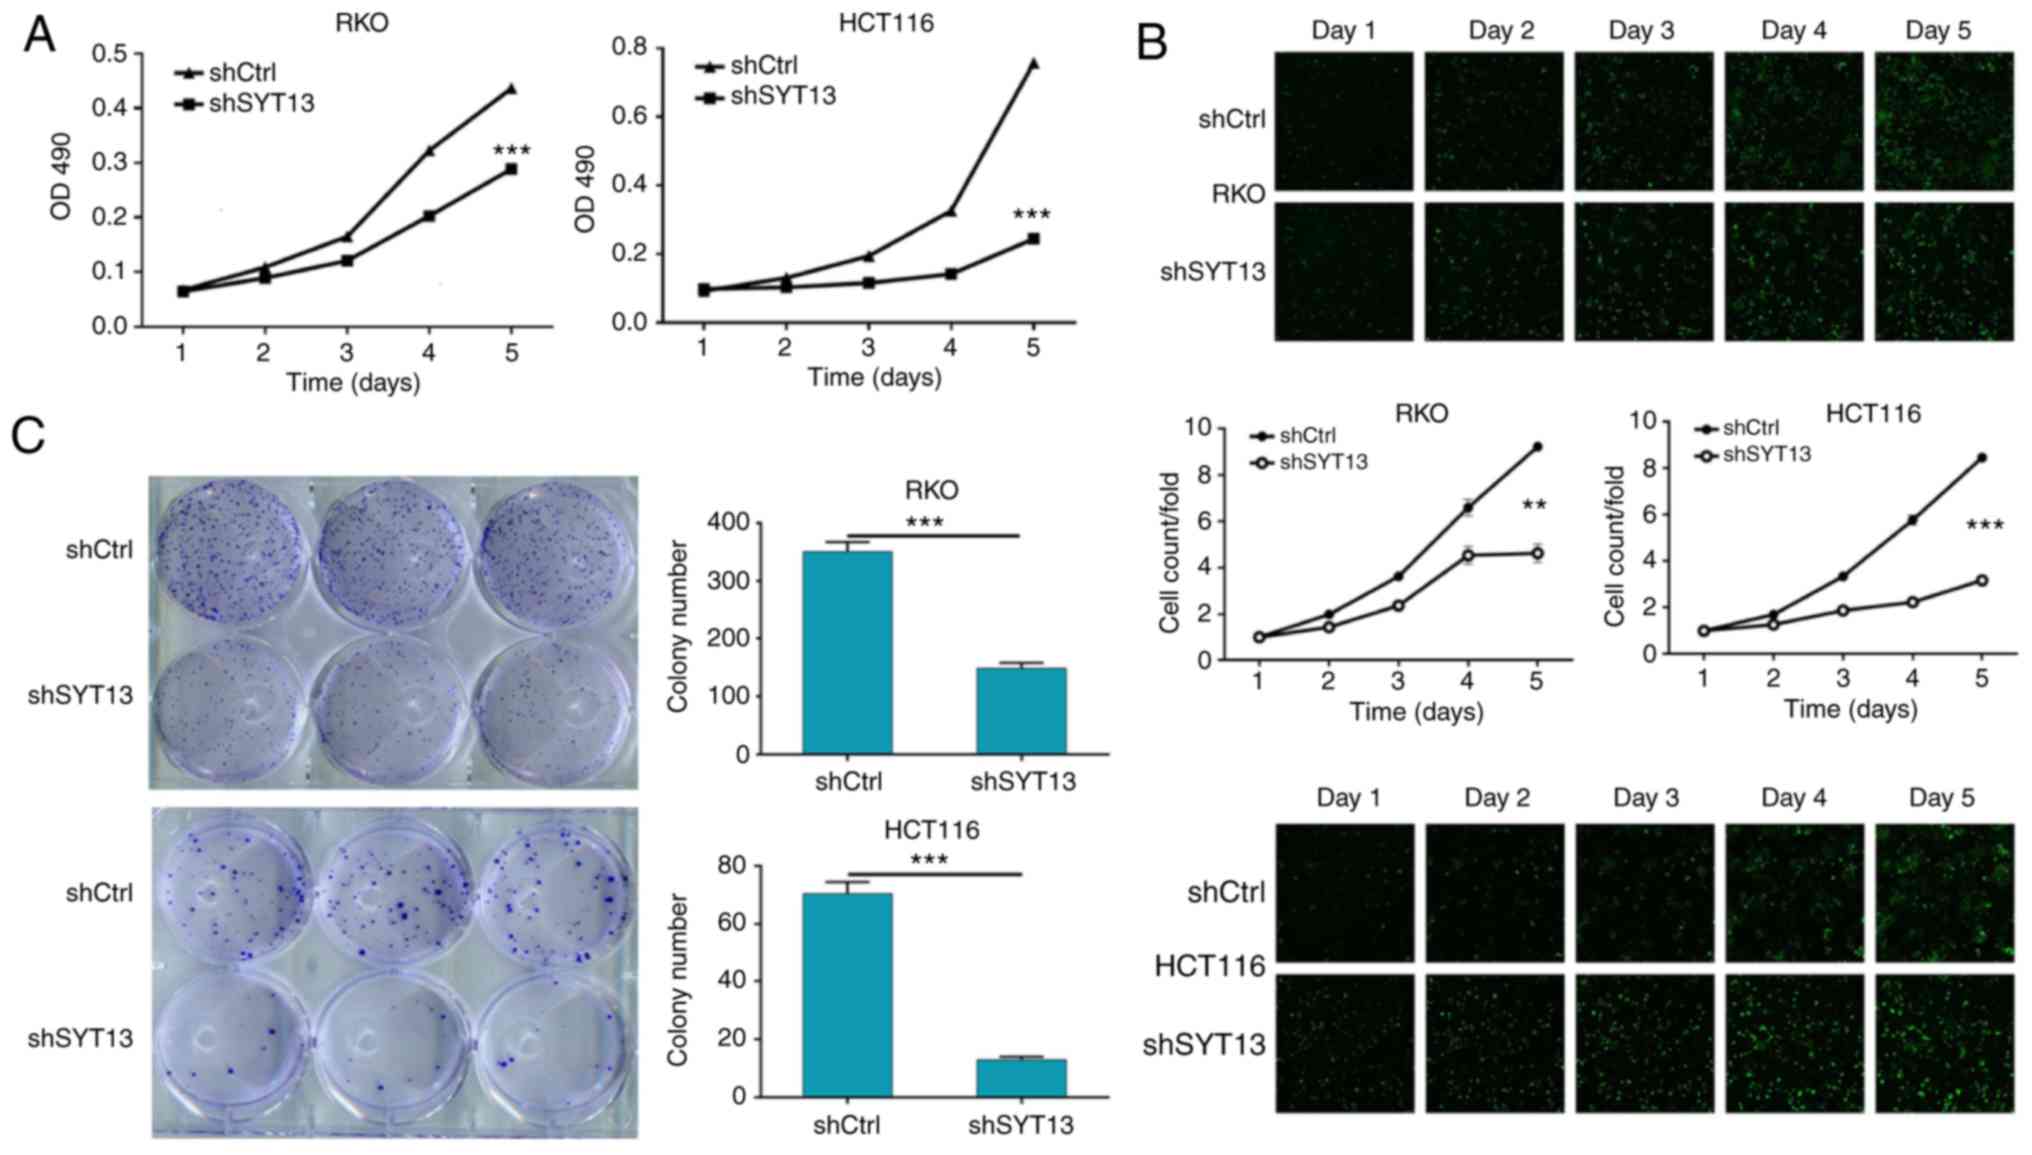
Knockdown of SYT13 inhibits the
proliferation, migration and invasion of RKO and HCT116 cells
Since the involvement of SYT13 in colorectal cancer
has been suggested by its relatively high expression in tumor
tissues, the role of SYT13 in biological cell behavior was
subsequently investigated. As shown in Fig. 2A and B, RKO and HCT116 cells with
SYT13 knockdown were subjected to MTT assay and Celigo cell
counting assay to evaluate the cell proliferation, which revealed
that knockdown of SYT13 significantly inhibited the proliferation
of RKO and HCT116 cells compared with the negative control.
Moreover, the long-term effect of SYT13 knockdown on cell
proliferation was studied by colony formation assay, allowing cells
with or without SYT13 knockdown to grow for 14 days. As shown in
Fig. 2C, the number of colonies,
as well as the colony formation ability of both cell lines, was
significantly inhibited by the knockdown of SYT13, which was
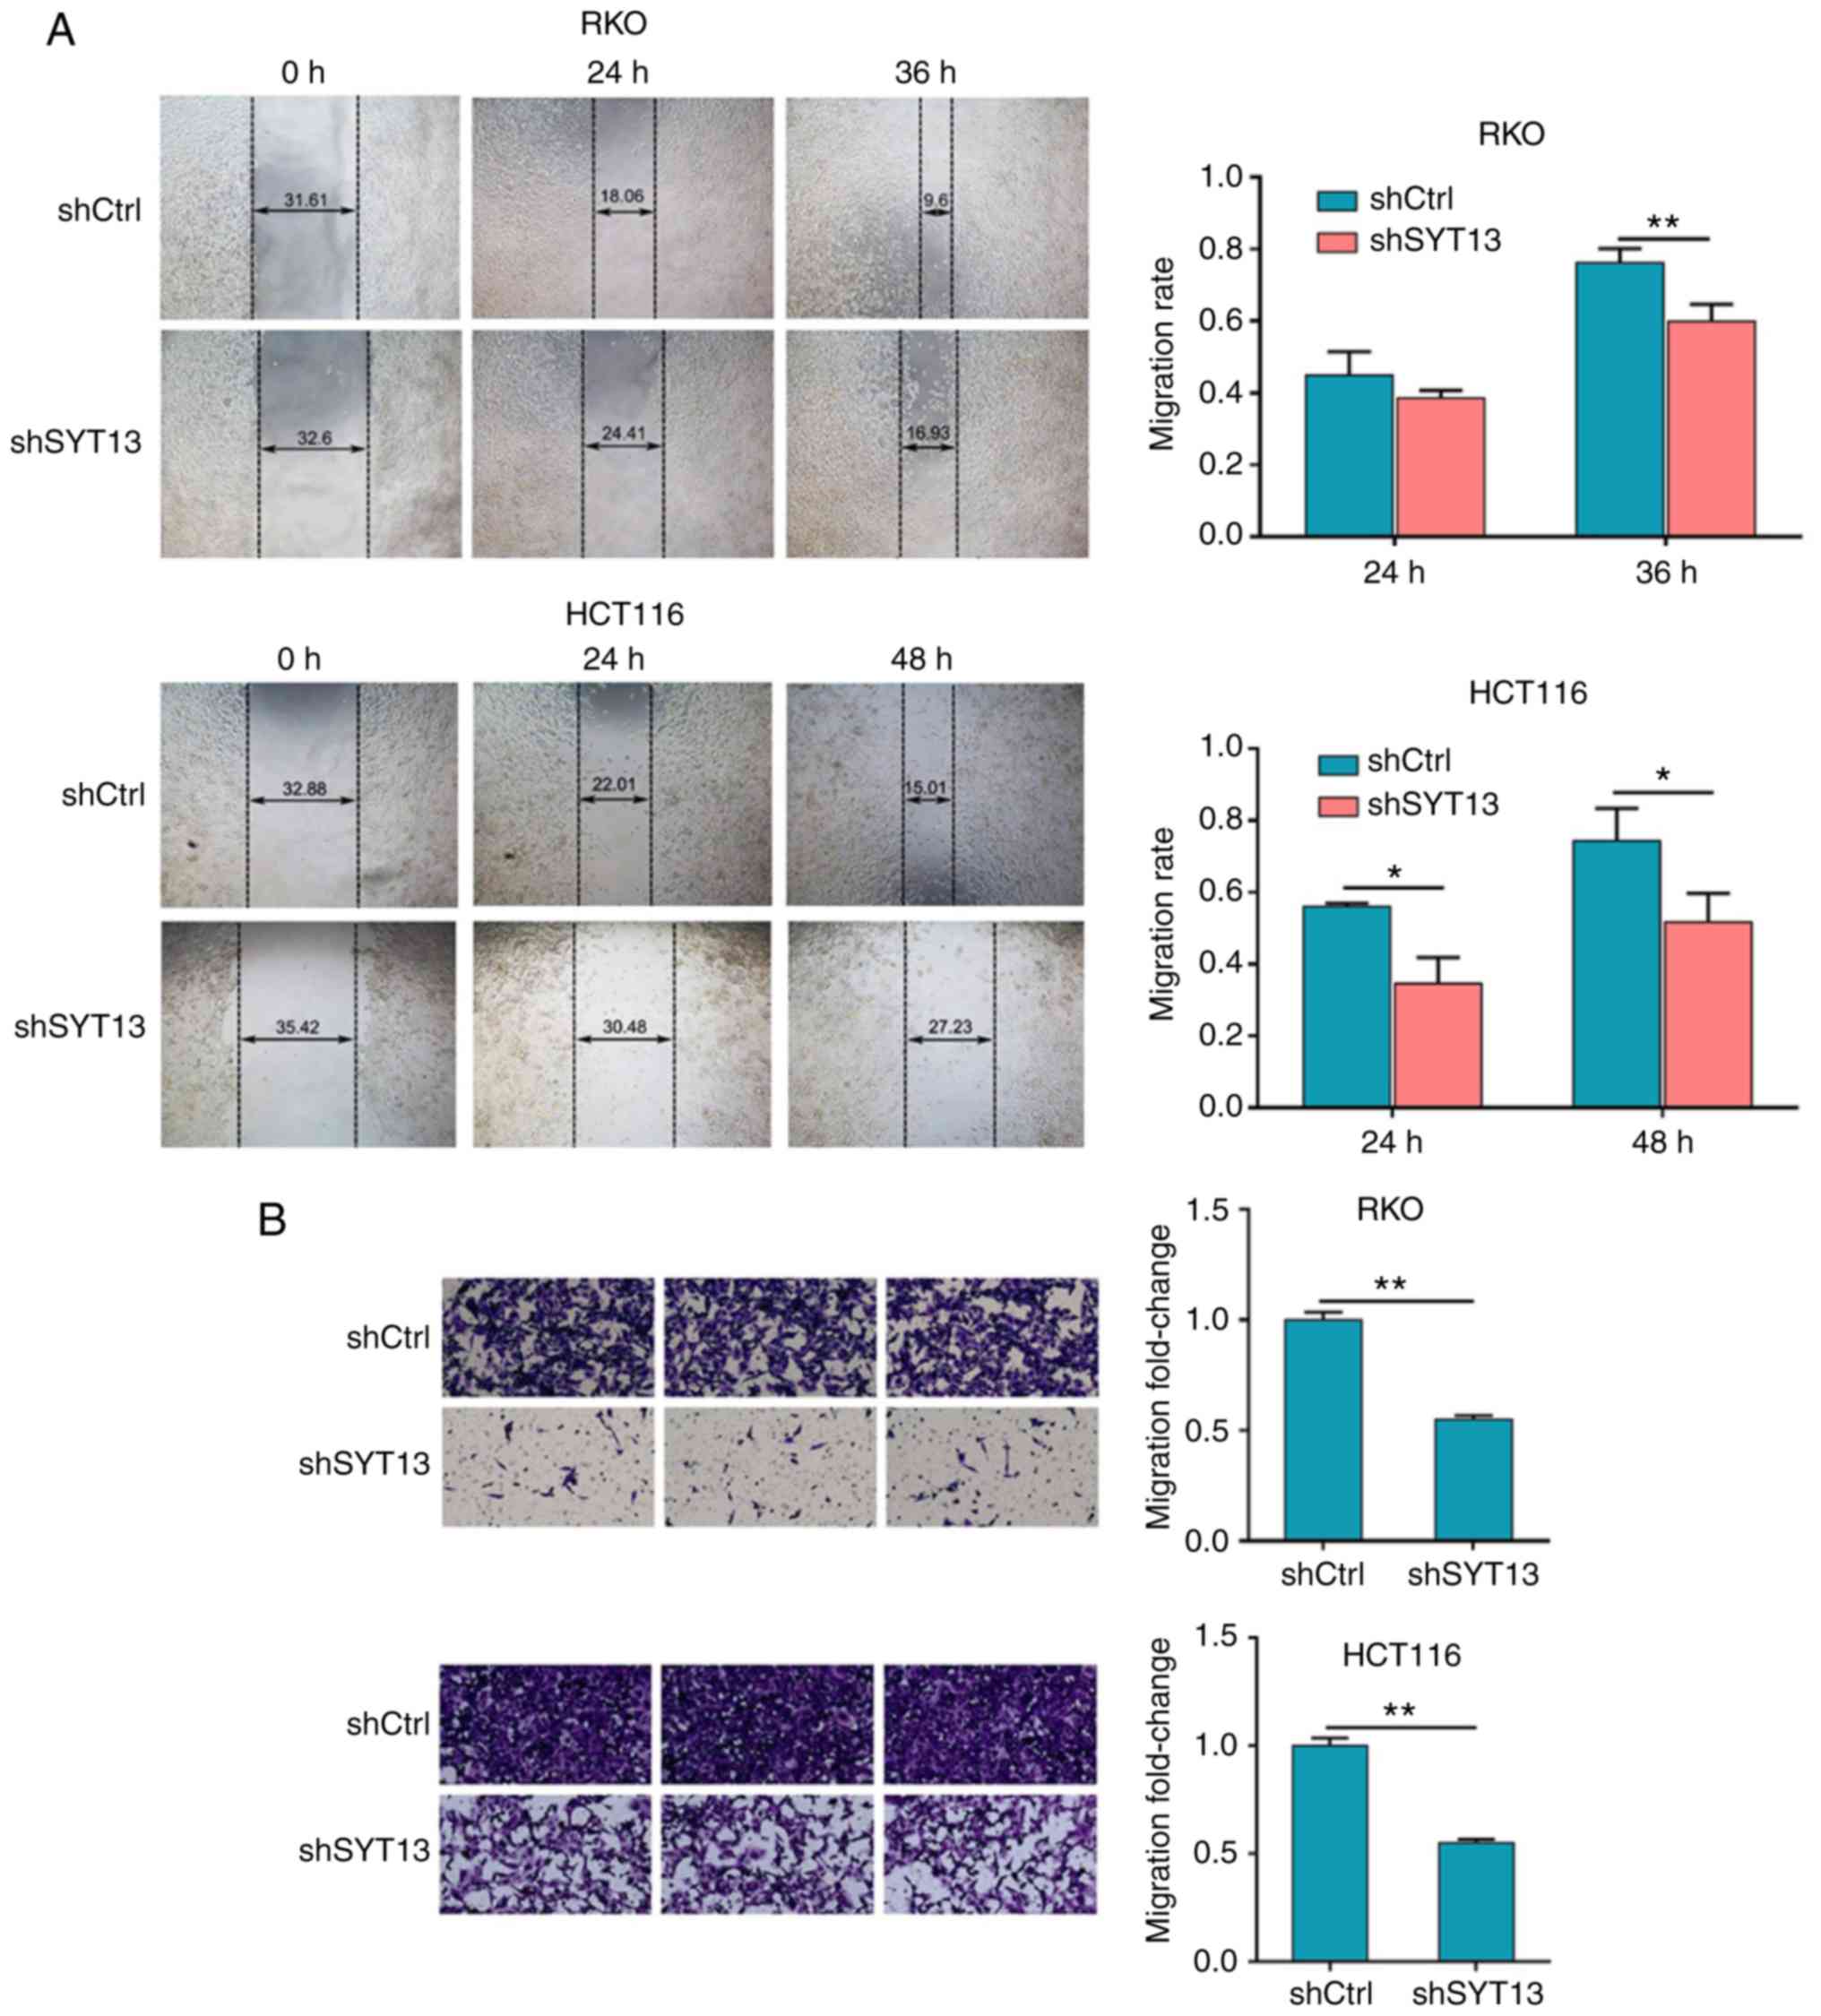
consistent with the results of the MTT assay. In addition, the
wound healing and Transwell assays were used to estimate the
migration ability of RKO and HCT116 cells with SYT13 knockdown
compared with the negative control. As shown in Fig. 3A and B, the results obtained from
both assays proved that the migration ability of cancer cells was
drastically inhibited by the knockdown of SYT13. Moreover, cell
invasion ability was assessed by Transwell assay, which also
indicated suppressed invasion ability of RKO and HCT116 cells in
the shSYT13 group (Fig. 3C).
Furthermore, the results of the detection of
epithelial-to-mesenchymal transition (EMT)-related proteins,
including N-cadherin, vimentin and Snail, by western blotting were
also consistent with the results of the wound healing and Transwell
assays (Fig. 3D). Taken together,
these results demonstrated the possible involvement of SYT13 in the
development and progression of colorectal cancer.
Knockdown of SYT13 induces apoptosis of
RKO and HCT116 cells
In order to further investigate the effect of SYT13
knockdown on cell apoptosis, flow cytometry analysis was utilized
to detect the apoptosis percentage. As shown in Fig. 4A, the knockdown of SYT13 induced
an apoptosis ratio of RKO and HCT116 cells more than 2-fold higher
compared with the negative control, indicating the ability of SYT13
knockdown to induce apoptosis in colorectal cancer cells.
Furthermore, a comparison of the cell cycle profiles of RKO and
HCT116 cells with SYT13 knockdown and the negative control
(Fig. 4B) demonstrated that,
compared with the negative control, the percentage of cells in the
G2 phase was notably increased by SYT13 knockdown; a corresponding
decrease in the percentage of cells in the S phase was observed
simultaneously, indicating that cells were arrested in the G2 phase
after SYT13 knockdown. Therefore, it may be concluded that SYT13
knockdown exerts an inhibitory effect on cell proliferation through
arrest of the cells in the G1 phase of the cell cycle.
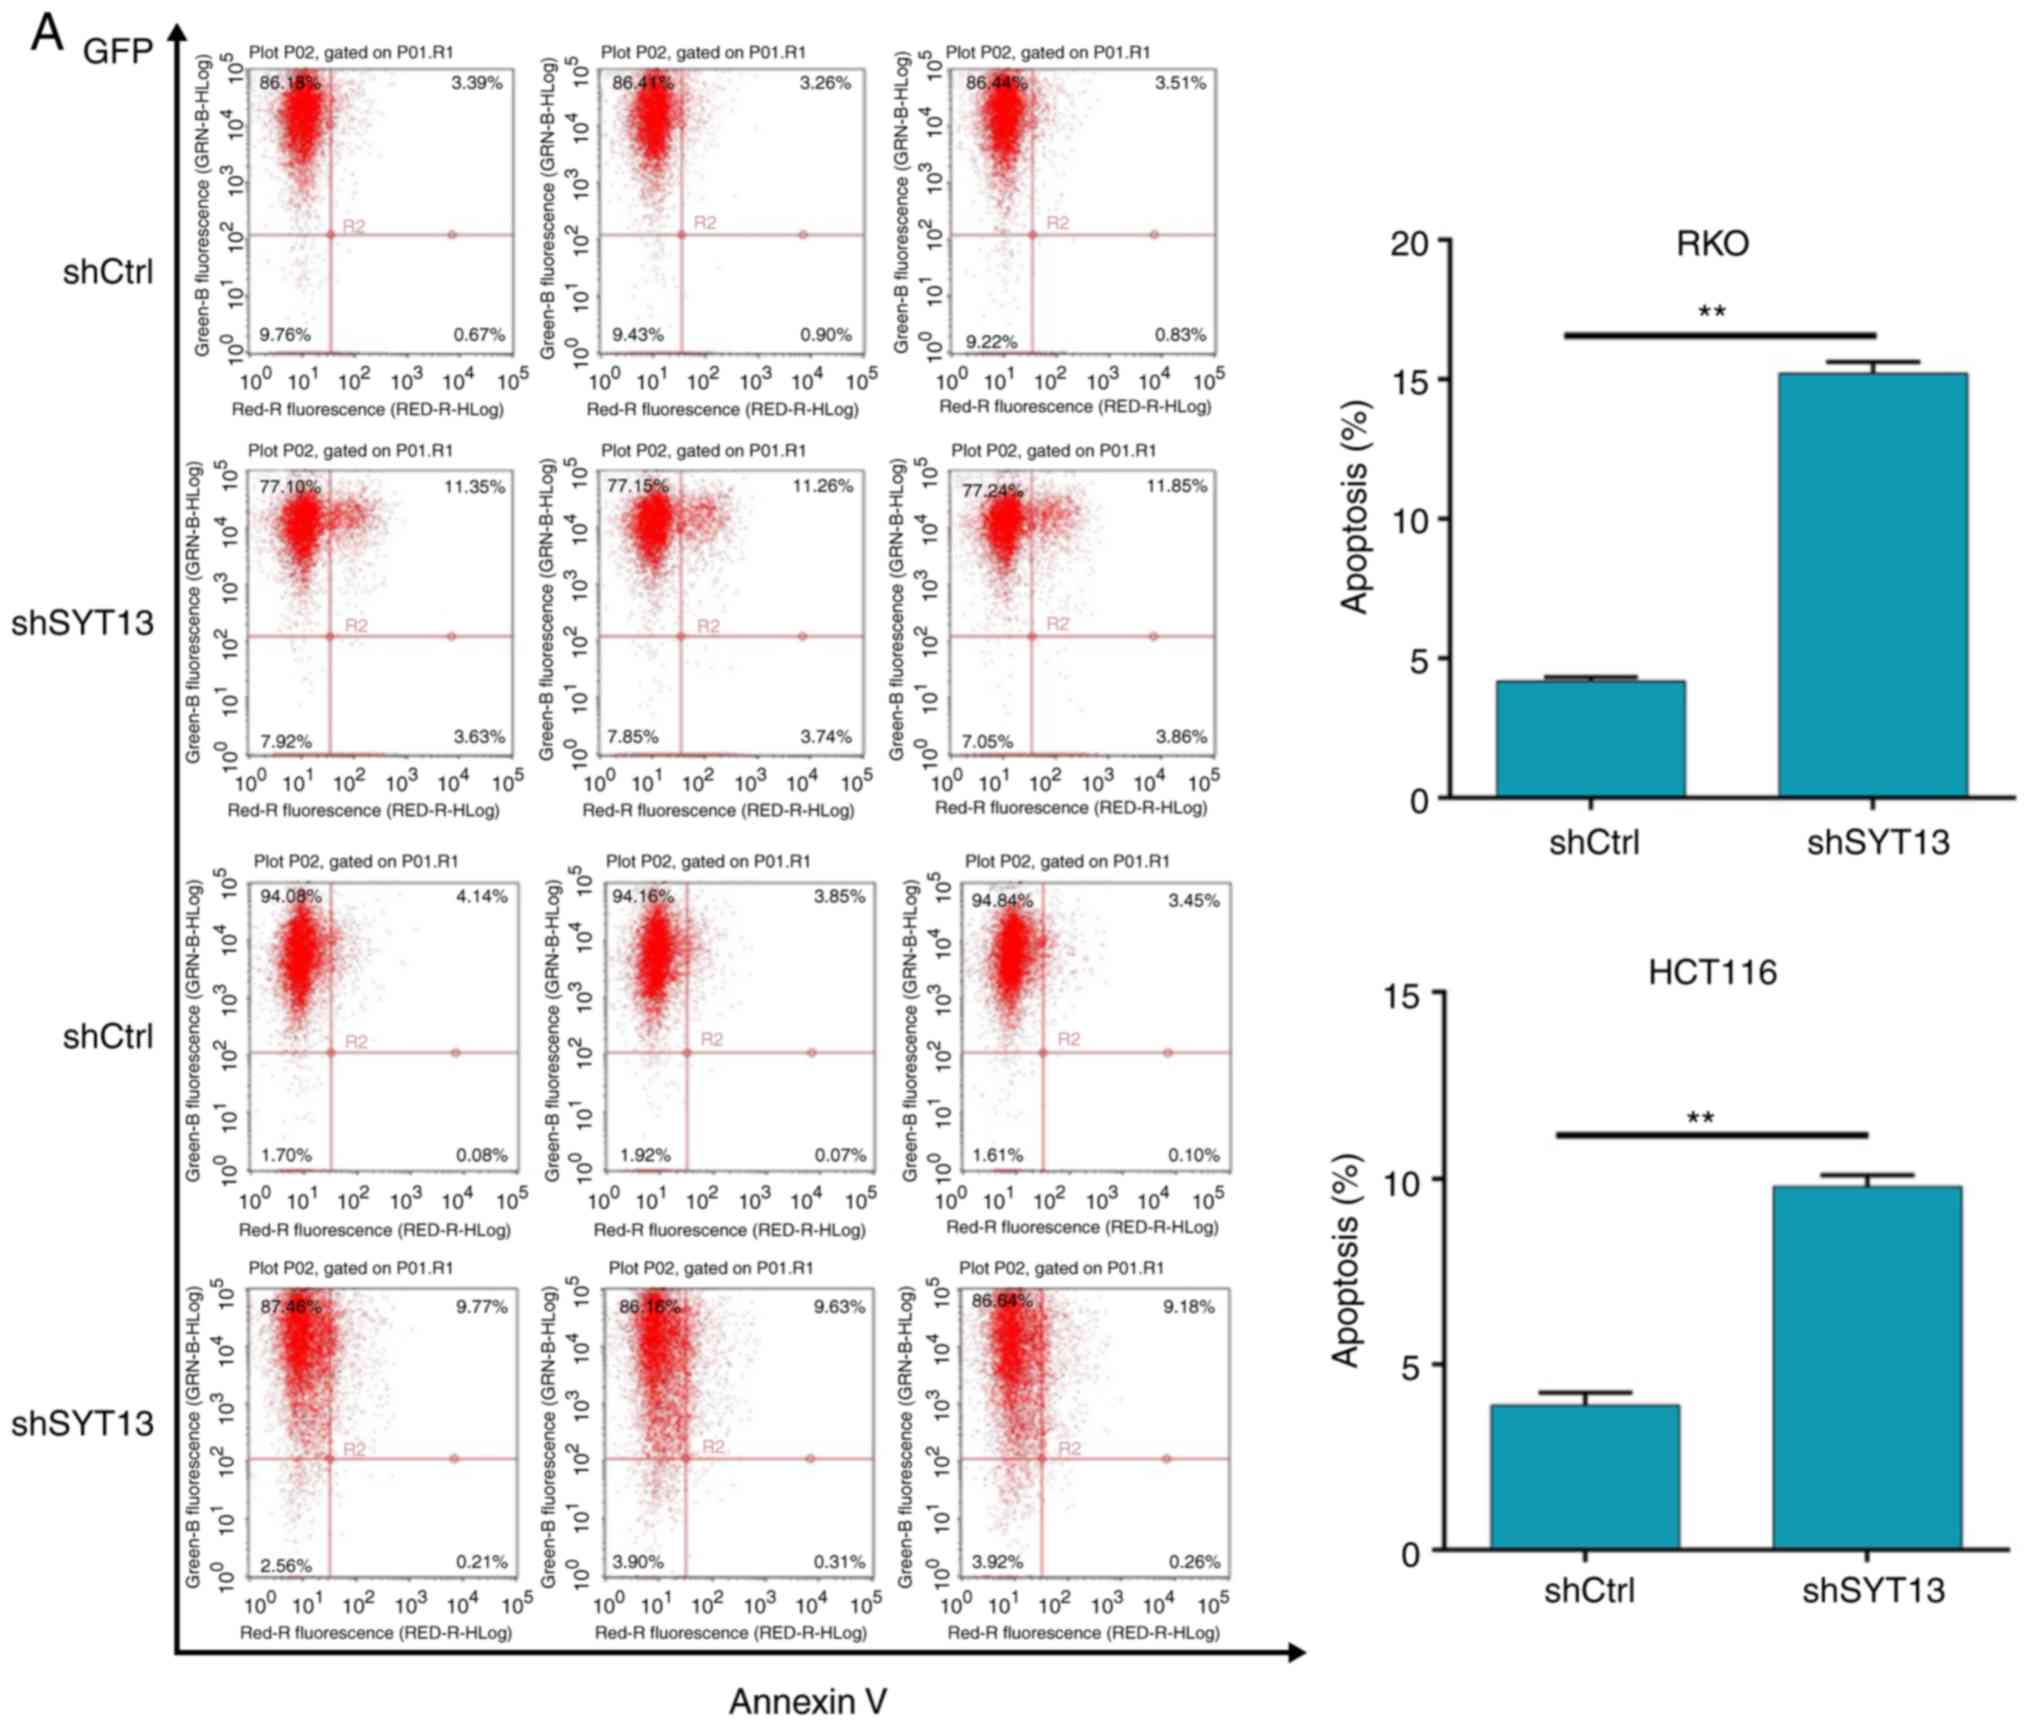 | Figure 4Knockdown of SYT13 induces cell
apoptosis. (A) Flow cytometry analysis was employed to detect the
percentage of apoptotic cells among RKO and HCT116 cells with SYT13
knockdown compared with the negative control. Data are presented as
the mean ± standard deviation (n≥3). **P<0.01. SYT,
synaptotagmin. Knockdown of SYT13 induces cell apoptosis. (B) Cell
cycle analysis of RKO and HCT116 cells with SYT13 knockdown and the
negative control, and the percentage of cells in the G1, S and G2
phase of the cell cycle. (C) The expression levels of several
apoptosis-related proteins, including Bad, Bcl-2, P53 and survivin,
were detected by western blot analysis. Data are presented as the
mean ± standard deviation (n≥3). *P<0.05,
**P<0.01, ***P<0.001. SYT,
synaptotagmin. |
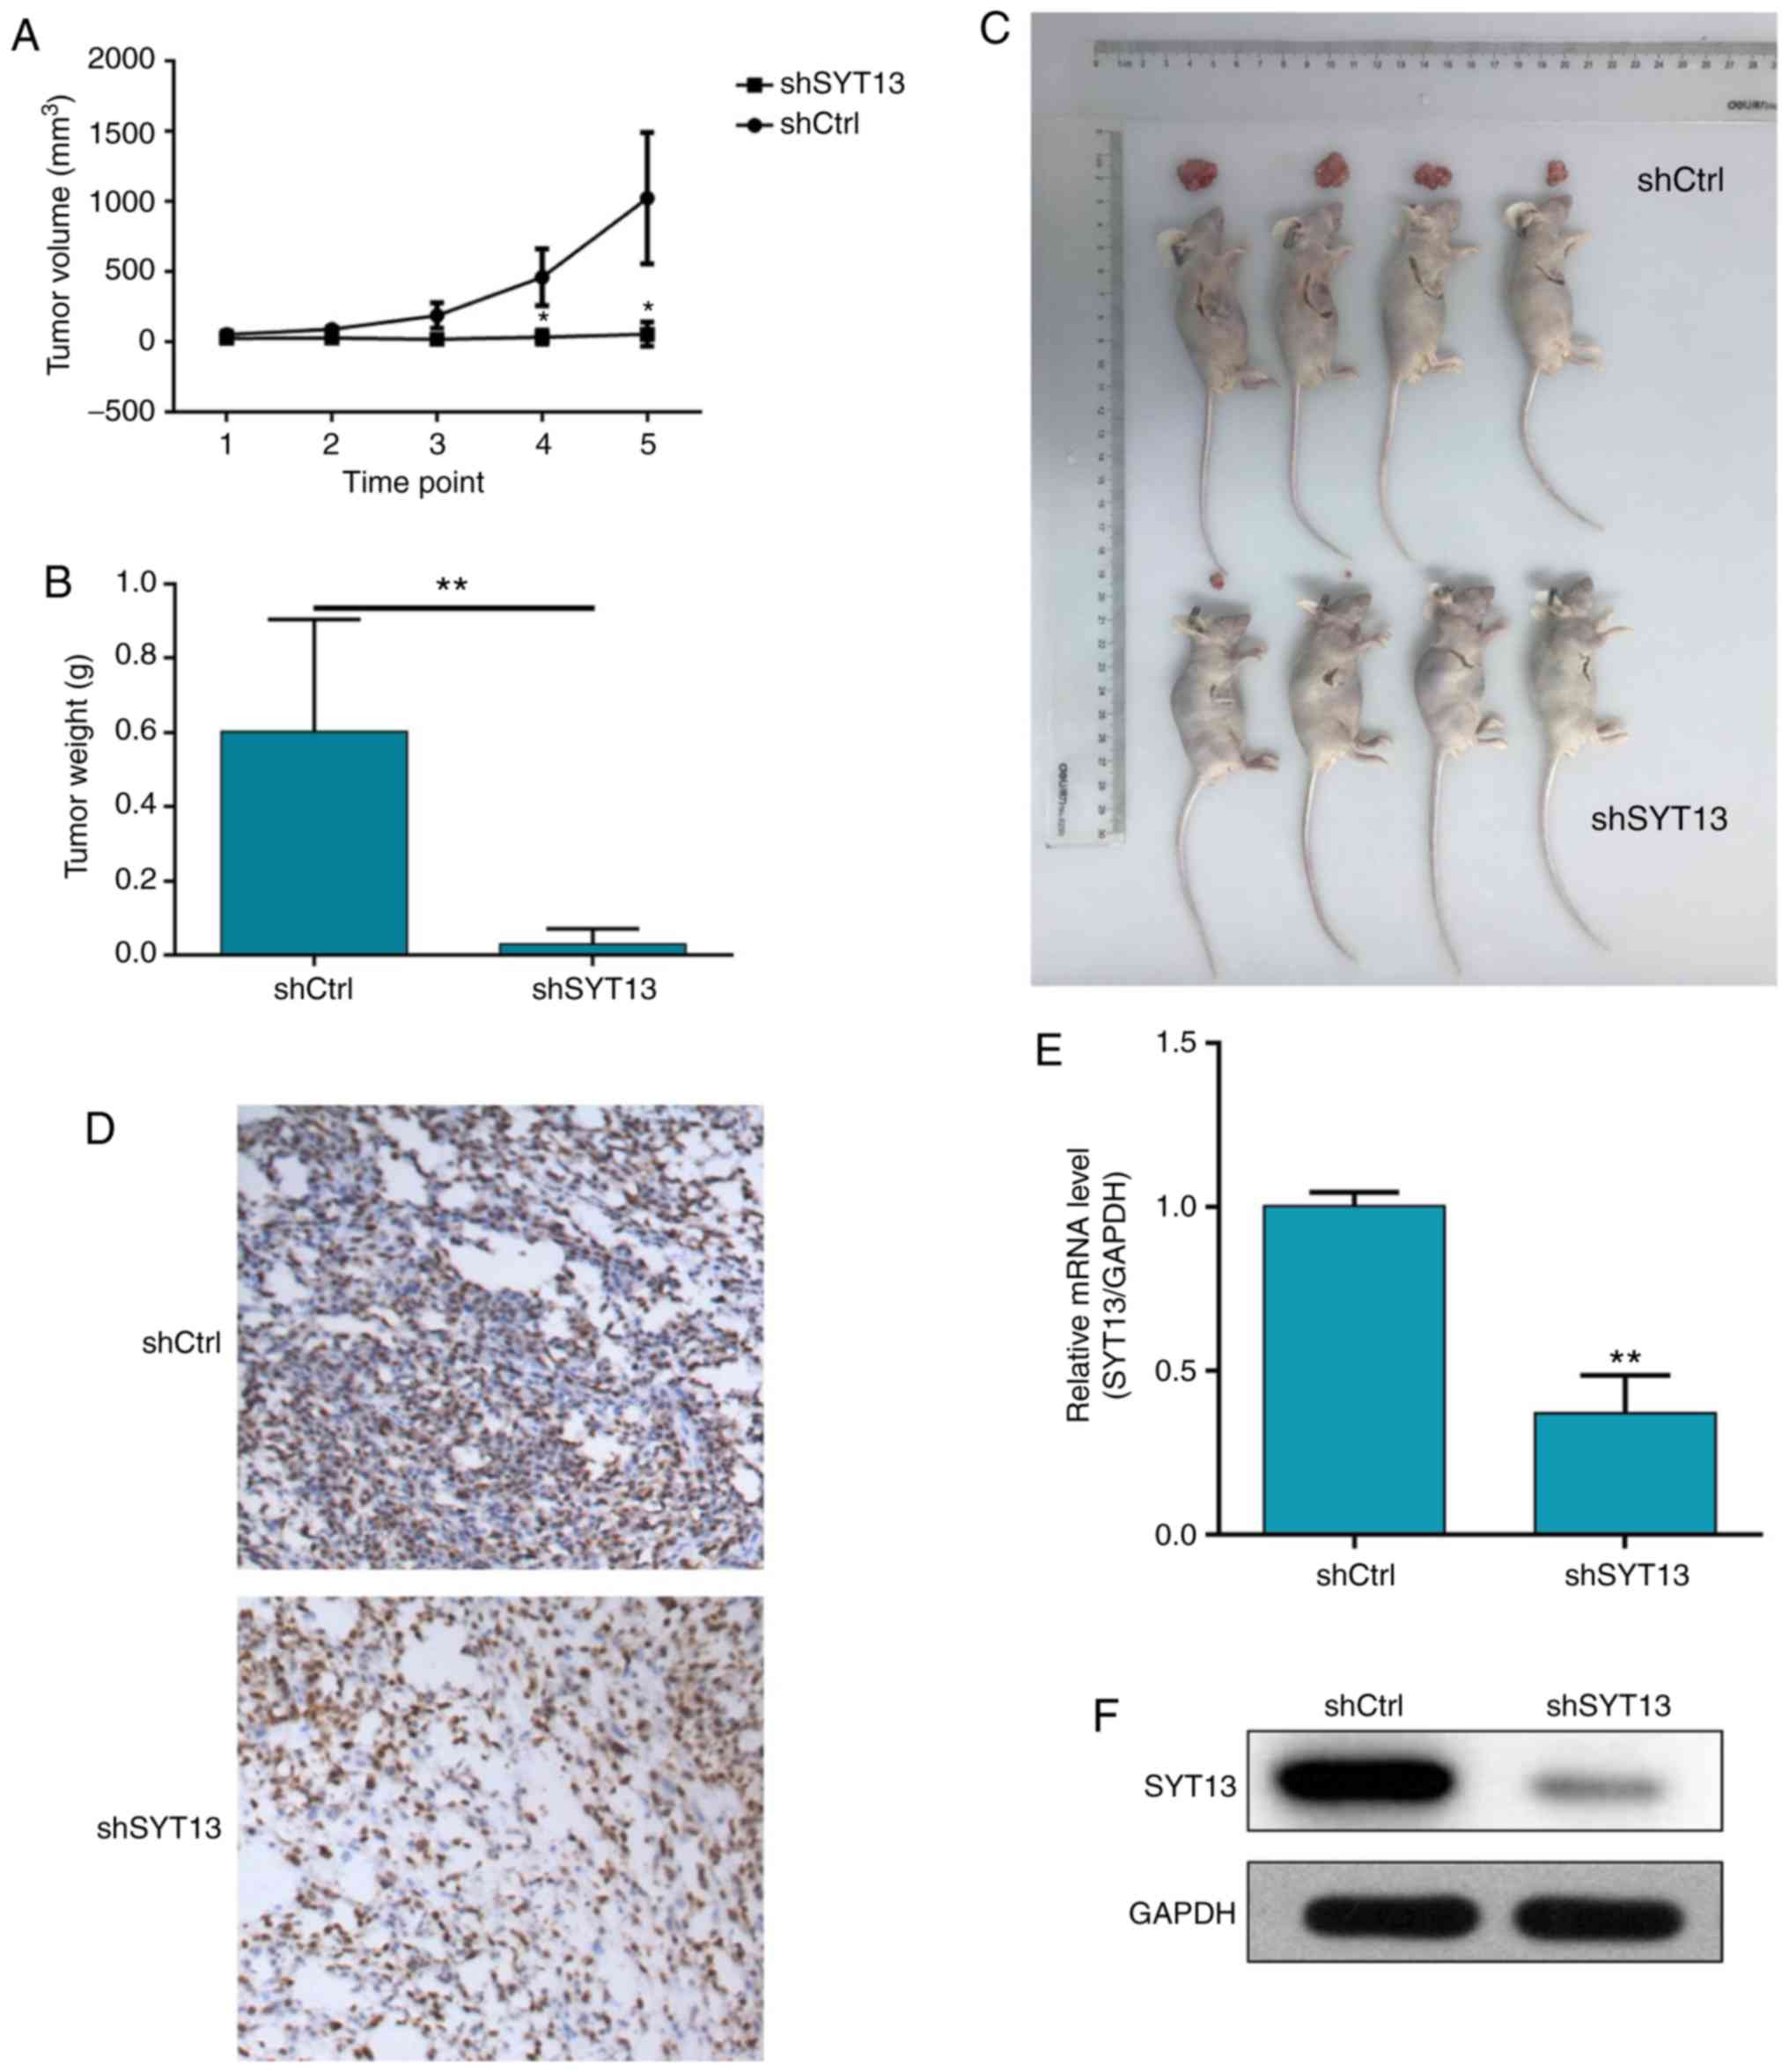
Knockdown of SYT13 impairs tumorigenesis
in vivo
To confirm whether knockdown of SYT13 can impair
tumor growth in vivo, a mouse xenograft model was
constructed by subcutaneously injecting cancer cells into nude
mice. After 17 days, the mice were euthanized and the tumors were
weighed. The results demonstrated that tumor growth was distinctly
slower in mice of the shSYT13 group compared with the shCtrl group
(Fig. 5A and B). The weight of
the tumors formed by SYT13 knockdown RKO cells was also
significantly lower compared with that in the negative control
group (P<0.001, Fig. 5B and
C). In addition to the difference in tumor size, we also
observed that the tumors formed by shCtrl cells displayed a higher
Ki-67 index compared with tumors formed by shSYT13 cells, as
determined by IHC analysis (Fig.
5D). Finally, the expression of SYT13 in the resected tumors
was also detected by qPCR and western blotting to confirm knockdown
of SYT13 (Fig. 5E and F). Taken
together, these results indicate that knockdown of SYT13 impairs
tumorigenicity, which was consistent with the data obtained by the
proliferation and apoptosis assays in vitro.
Discussion
Colorectal cancer is the third most commonly
diagnosed cancer worldwide and one of the leading causes of
cancer-related mortality. It has been estimated that, in 2012, ~1.3
million new colorectal cancer cases were diagnosed and nearly
700,000 patients succumbed to the disease (20). Colorectal cancer is a polygenic
disease, which is caused by genetic and epigenetic changes in
oncogenes, tumor suppressor genes, mismatched repair genes, and
cell cycle regulation genes in colonic mucosal cells (5). In order to achieve early detection,
thereby improving prognosis and reducing mortality, scientists have
been exploring and validating molecular markers as treatment
targets. Gene mutation is a key factor in the incidence and
development of colorectal cancer. It has been reported that the
inactivation of adenomatous polyposis coli (APC) plays an important
role in the early stages of colorectal cancer (21). The high expression and mutation of
APC may be used as a prognostic indicator for the clinical outcomes
of colorectal cancer (22).
Similarly, vascular endothelial growth factor is also more highly
expressed in colorectal cancer, which may provide valuable
prognostic information (23).
Although colonoscopy remains the standard screening test for
colorectal cancer diagnosis, the assessment of microRNAs (miRNAs)
in the plasma has opened up a new field in biomarker research
(24). For example, miR-21,
miR-106a, miR-135 and miR-1792 were found to be overexpressed in
the serum of colorectal cancer patients. In addition, serum miR29a
and miR-92a may provide practical information for the diagnosis of
colorectal cancer patients (25,26). Furthermore, various types of
oncoproteins have been reported to be associated with the diagnosis
and prognosis of colorectal cancer. Lin et al reported that
the abnormal upregulation of the expression of insulin-like growth
factor-II mRNA-binding protein 3 (IMP3) may promote lymph node
metastasis, which is associated with poor prognosis and short
survival time of colorectal cancer patients (27). Therefore, IMP3 may be a potential
biomarker for evaluating the progression and prognosis of
colorectal cancer (28).
SYTs are type III Ca2+-dependent membrane
proteins characterized by tandem cytoplasmic repeats homologous to
protein kinase C (29). Among the
SYT family isoforms, SYT1-6 and 9-13 have been reported to be
mainly expressed in brain tissue, while SYT5, 9 and 13 may also be
detected in primary β-cells. On the other hand, SYT7, 8, 14 and 15
are mainly expressed in the heart, kidney, and pancreas (30,31). With the advances in research, the
association between SYT and human diseases, particularly cancer,
has been gradually uncovered. Andersson et al demonstrated
that the reduced expression of exocytotic genes, including SYT4, 7,
11 and 13, contributes to impaired insulin secretion, indicating
the possible involvement of these genes in the pathogenesis of type
2 diabetes (32). Moreover,
Sreenath et al reported that the glutathione
S-transferase-SYT complex, which may be observed in human breast
tumors but not in adjacent non-cancerous tissues, possesses the
potential to be a marker for breast cancer (33).
The human SYT13 gene is composed of 6 coding exons
and 5 gt-ag introns distributed over 42 kb of genomic DNA (34). As an atypical member of the SYT
family, SYT13 is highly expressed in the brain and lacks essential
amino acid residues in the C2 terminal for Ca2+ binding
and, thus, the accompanying Ca2+-dependent regulation of
phospholipid-binding activity, which are important properties of
several other isoforms (15). The
function of SYT13 is largely unknown and only occasionally
reported. Han et al indicated that contextual fear
conditioning test could regulate the mRNA expression levels of
SYT13 within various brain regions during both acquisition and
retrieval sessions, suggesting the likely involvement of SYT13 in
the process of contextual fear memory (35). Identification of the serial
differential expression of genes from normal tissues to primary
tumors to metastases indicated that various genes, including PMP22,
SYT13 and SERPINA10, are associated with the progression of small
bowel neuroendocrine tumors (36). Jahn et al demonstrated that
the human SYT13 gene acts as a liver tumor suppressor gene and its
function may be mediated through pathways implicated in
mesenchymal-to-epithelial transition (37). Importantly, Zhu et al
observed differential expression of SYT13 between left- and
right-sided colon carcinomas by microarray analysis (38), suggesting the possible involvement
of SYT13 in colorectal cancer. Therefore, the aim of the present
study was to conduct a pioneer research on the association between
SYT13 and the development and progression of colorectal cancer.
In the present study, the relatively upregulated
expression of SYT13 in colorectal cancer tissues compared with
paracancerous tissues was first evidenced by IHC. Based on these
results, SYT13 knockdown cell lines were constructed through the
infection of RKO and HCT116 cells with shSYT13 lentivirus plasmid.
The efficiencies of infection and SYT13 knockdown were evaluated by
observation of fluorescence intensity and western blot analysis
combined with RT-qPCR, respectively, which demonstrated >80%
infection efficiency, and 62.7% (RKO, P<0.05) and 65.5% (HCT116,
P<0.05) knockdown efficiency. Subsequently, MTT and Celigo cell
counting assays demonstrated a markedly slower proliferation rate
of RKO and HCT116 cells with SYT13 knockdown compared with the
negative control. Colony formation assay also revealed that
distinctly fewer colonies were formed from cells with SYT13
knockdown compared with the negative control. Transwell assay
demonstrated that knockdown of SYT13 reduced the migration and
invasion ability of RKO and HCT116 cells compared with the negative
control, which was consistent with the results of the wound healing
assay. Although the IHC analysis of E-cadherin in colorectal cancer
tissues failed to reveal the difference due to the non-sufficient
signal strength, the detection of EMT-related proteins in RKO and
HCT116 cells indicated the inhibition of EMT by SYT13 knockdown.
Moreover, the significantly enhanced apoptosis of RKO and HCT116
cells induced by SYT13 knockdown were revealed by flow cytometric
analysis and proven by detection of apoptosis-related proteins. The
cell cycle profiles measured by FACS also proved that knockdown of
SYT13 arrested RKO cells in the G2 phase. More importantly, the
investigation of a mouse xenograft model demonstrated that the
knockdown of SYT13 markedly inhibited the growth of the xenograft
tumor compared with the negative control group, which was also
consistent with the results of the cell experiments.
In conclusion, all the abovementioned results
demonstrated that SYT13 may act as tumor promoter in colorectal
cancer, and may serve as a future target for developing novel
treatments for colorectal cancer. Further studies focusing on the
regulatory mechanism of SYT13 may enable a better understanding of
colorectal carcinogenesis.
Acknowledgments
Not applicable.
Funding
The present study was supported by the Shanghai
Pudong New Area Science and Technology Development Fund Innovation
Fund Project (grant no. PKJ2014-Y12) and the Top-Level Clinical
Discipline Project of Shanghai Pudong (grant no. PWYgf2018-04).
Availability of data and materials
The datasets used and/or analyzed during the present
study are available from the corresponding author on reasonable
request.
Authors' contributions
MX and XJ conceived and designed the experiments. QL
performed the experiments. SZ and MH conducted data analysis. QL
wrote the manuscript. All authors read and approved the final
manuscript.
Ethics approval and consent to
participate
All animal experiments were approved by the Ethics
Committee of Shanghai Tongji University and were carried out in
accordance with the institutional guidelines for animal care and
protection.
Patient consent for publication
Not applicable.
Competing interests
The authors declare that they have no competing
interests.
References
|
1
|
Haggar FA and Boushey RP: Colorectal
cancer epidemiology: Incidence, mortality, survival, and risk
factors. Clin Colon Rectal Surg. 22:191–197. 2009. View Article : Google Scholar :
|
|
2
|
Lao VV and Grady WM: Epigenetics and
colorectal cancer. Nat Rev Gastro Hepat. 8:686–700. 2011.
View Article : Google Scholar
|
|
3
|
Martenson JA, Haddock MG and Gunderson LL:
Cancers of the Colon, Rectum, and Anus. Springer Berlin Heidelberg.
34:545–559. 2006.
|
|
4
|
Weitz J, Koch M, Debus J, Höhler T, Galle
PR and Büchler MW: Colorectal cancer. Lancet. 365:153–165. 2005.
View Article : Google Scholar : PubMed/NCBI
|
|
5
|
Migliore L, Migheli F, Spisni R and
Coppedè F: Genetics, cytogenetics, and epigenetics of colorectal
cancer. J Biomed Biotechnol. 2011:7923622011. View Article : Google Scholar : PubMed/NCBI
|
|
6
|
Pox CP: Controversies in colorectal cancer
screening. Digestion. 89:274–281. 2014. View Article : Google Scholar : PubMed/NCBI
|
|
7
|
Lieu C and Kopetz S: The SRC family of
protein tyrosine kinases: A new and promising target for colorectal
cancer therapy. Clin Colorectal Cancer. 9:89–94. 2010. View Article : Google Scholar : PubMed/NCBI
|
|
8
|
Lin JS, Piper MA, Perdue LA, Rutter CM,
Webber EM, O'Connor E, Smith N and Whitlock EP: Screening for
colorectal cancer: Updated evidence report and systematic review
for the US preventive services task force. JAMA. 315:2576–2594.
2016. View Article : Google Scholar : PubMed/NCBI
|
|
9
|
Pang ZP and Südhof TC: Cell biology of
Ca2+-triggered exocytosis. Curr Opin Cell Biol.
22:496–505. 2010. View Article : Google Scholar : PubMed/NCBI
|
|
10
|
Fernández-Chacón R, Königstorfer A, Gerber
SH, García J, Matos MF, Stevens CF, Brose N, Rizo J, Rosenmund C
and Südhof TC: Synaptotagmin I functions as a calcium regulator of
release probability. Nature. 410:41–49. 2001. View Article : Google Scholar : PubMed/NCBI
|
|
11
|
Brose N, Petrenko AG, Südhof TC and Jahn
R: Synaptotagmin: A calcium sensor on the synaptic vesicle surface.
Science. 256:1021–1025. 1992. View Article : Google Scholar : PubMed/NCBI
|
|
12
|
Sutton RB, Davletov BA, Berghuis AM,
Sudhof TC and Sprang SR: Structure of the first C2 domain of
synaptotagmin I: A novel Ca2+/phospholipid-binding fold.
Cell. 80:929–938. 1995. View Article : Google Scholar : PubMed/NCBI
|
|
13
|
Perin MS, Fried VA, Mignery GA, Jahn R and
Südhof TC: Phospholipid binding by a synaptic vesicle protein
homologous to the regulatory region of protein kinase C. Nature.
345:260–263. 1990. View
Article : Google Scholar : PubMed/NCBI
|
|
14
|
Fukuda M and Mikoshiba K: Characterization
of KIAA1427 protein as an atypical synaptotagmin (Syt XIII).
Biochem J. 354:249–257. 2001. View Article : Google Scholar : PubMed/NCBI
|
|
15
|
Von CP and Südhof TC: Synaptotagmin 13:
Structure and expression of a novel synaptotagmin. Eur J Cell Biol.
80:41–47. 2001. View Article : Google Scholar
|
|
16
|
Rickman C, Craxton M, Osborne S and
Davletov B: Comparative analysis of tandem C2 domains from the
mammalian synaptotagmin family. Biochem J. 378:681–686. 2004.
View Article : Google Scholar : PubMed/NCBI
|
|
17
|
Grønborg M, Kristiansen TZ, Iwahori A,
Chang R, Reddy R, Sato N, Molina H, Jensen ON, Hruban RH, Goggins
MG, et al: Biomarker discovery from pancreatic cancer secretome
using a differential proteomic approach. Mol Cell Proteomics.
5:157–171. 2006. View Article : Google Scholar
|
|
18
|
Jahn JE and Coleman WB: Re-expression of
tumorigenicity after attenuation of human synaptotagmin 13 in a
suppressed micro-cell hybrid cell line. Int J Oncol. 32:441–449.
2008.PubMed/NCBI
|
|
19
|
Livak KJ and Schmittgen TD: Analysis of
relative gene expression data using real-time quantitative PCR and
the 2(-Delta Delta C(T)) method. Methods. 25:402–408. 2001.
View Article : Google Scholar
|
|
20
|
László L: Predictive and prognostic
factors in the complex treatment of patients with colorectal
cancer. Magy Onkol. 54:383–394. 2010. View Article : Google Scholar : PubMed/NCBI
|
|
21
|
Kulendran M, Stebbing JF, Marks CG and
Rockall TA: Predictive and prognostic factors in colorectal cancer:
A personalized approach. Cancers (Basel). 3:1622–1638. 2011.
View Article : Google Scholar
|
|
22
|
Chen TH, Chang SW, Huang CC, Wang KL, Yeh
KT, Liu CN, Lee H, Lin CC and Cheng YW: The prognostic significance
of APC gene mutation and miR-21 expression in advanced-stage
colorectal cancer. Colorectal Dis. 15:1367–1374. 2013. View Article : Google Scholar : PubMed/NCBI
|
|
23
|
Falchook GS and Kurzrock R: VEGF and
dual-EGFR inhibition in colorectal cancer. Cell Cycle.
14:1129–1130. 2015. View Article : Google Scholar : PubMed/NCBI
|
|
24
|
Xiao J, Lv D, Zhou J, Bei Y, Chen T, Hu M,
Zhou Q, Fu S and Huang Q: Therapeutic inhibition of miR-4260
suppresses colorectal cancer via targeting MCC and SMAD4.
Theranostics. 7:1901–1913. 2017. View Article : Google Scholar : PubMed/NCBI
|
|
25
|
Koga Y, Yasunaga M, Takahashi A, Kuroda J,
Moriya Y, Akasu T, Fujita S, Yamamoto S, Baba H and Matsumura Y:
MicroRNA expression profiling of exfoliated colonocytes isolated
from feces for colorectal cancer screening. Cancer Prev Res
(Phila). 3:1435–1442. 2010. View Article : Google Scholar
|
|
26
|
Huang Z, Huang DS, Ni S, Peng Z, Sheng W
and Du X: Plasma microRNAs are promising novel biomarkers for early
detection of colorectal cancer. Int J Cancer. 127:118–126. 2010.
View Article : Google Scholar
|
|
27
|
Li D, Yan D, Tang H, Zhou C, Fan J, Li S,
Wang X, Xia J, Huang F, Qiu G and Peng Z: IMP3 is a novel
prognostic marker that correlates with colon cancer progression and
pathogenesis. Ann Surg Oncol. 16:3499–3506. 2009. View Article : Google Scholar : PubMed/NCBI
|
|
28
|
Lin L, Zhang J, Wang Y, Ju W, Ma Y, Li L
and Chen L: Insulin-like growth factor-II mRNA-binding protein 3
predicts a poor prognosis for colorectal adenocarcinoma. Oncol
Lett. 6:740–744. 2013. View Article : Google Scholar : PubMed/NCBI
|
|
29
|
Johnson CP: Emerging functional
differences between the synaptotagmin and ferlin calcium sensor
families. Biochemistry. 56:6413–6417. 2017. View Article : Google Scholar : PubMed/NCBI
|
|
30
|
Mizuta M, Inagaki N, Nemoto Y, Matsukura
S, Takahashi M and Seino S: Synaptotagmin III is a novel isoform of
rat synaptotagmin expressed in endocrine and neuronal cells. J Biol
Chem. 269:11675–11678. 1994.PubMed/NCBI
|
|
31
|
Grise F, Taib N, Monterrat C, Lagrée V and
Lang J: Distinct roles of the C(2)A and the C2B domain of the
vesicular Ca2+ sensor synaptotagmin 9 in endocrine
beta-cells. Biochem J. 403:483–492. 2007. View Article : Google Scholar : PubMed/NCBI
|
|
32
|
Andersson SA, Olsson AH, Esguerra JL,
Heimann E, Ladenvall C, Edlund A, Salehi A, Taneera J, Degerman E,
Groop L, et al: Reduced insulin secretion correlates with decreased
expression of exocytotic genes in pancreatic islets from patients
with type 2 diabetes. Mol Cell Endocrinol. 364:36–45. 2012.
View Article : Google Scholar : PubMed/NCBI
|
|
33
|
Sreenath AS, Kumar KR, Reddy GV, Sreedevi
B, Praveen D, Monika S, Sudha S, Reddy MG and Reddanna P: Evidence
for the association of synaptotagmin with glutathione
S-transferases: Implications for a novel function in human breast
cancer. Clin Biochem. 38:436–443. 2005. View Article : Google Scholar : PubMed/NCBI
|
|
34
|
Thierry-Mieg D and Thierry-Mieg J:
AceView: A comprehensive cDNA-supported gene and transcripts
annotation. Genome Biol. 7(Suppl 1): S122006. View Article : Google Scholar : PubMed/NCBI
|
|
35
|
Han S, Hong S, Lee D, Lee MH, Choi JS, Koh
MJ, Sun W, Kim H and Lee HW: Altered expression of synaptotagmin 13
mRNA in adult mouse brain after contextual fear conditioning.
Biochem Biophys Res Commun. 425:880–885. 2012. View Article : Google Scholar : PubMed/NCBI
|
|
36
|
Keck KJ, Breheny P, Braun TA, Darbro B, Li
G, Dillon JS, Bellizzi AM, O'Dorisio TM and Howe JR: Changes in
gene expression in small bowel neuroendocrine tumors associated
with progression to metastases. Surgery. 163:232–239. 2018.
View Article : Google Scholar
|
|
37
|
Jahn JE, Best DH and Coleman WB: Exogenous
expression of synaptotagmin XIII suppresses the neoplastic
phenotype of a rat liver tumor cell line through molecular pathways
related to mesenchymal to epithelial transition. Exp Mol Pathol.
89:209–216. 2010. View Article : Google Scholar : PubMed/NCBI
|
|
38
|
Zhu H, Wu TC, Chen WQ, Zhou LJ, Wu Y, Zeng
L and Pei HP: Screening for differentially expressed genes between
left- and right-sided colon carcinoma by microarray analysis. Oncol
Lett. 6:353–358. 2013. View Article : Google Scholar : PubMed/NCBI
|