Introduction
Ligamentum flavum (LF) hypertrophy (LFH) is an
important cause of spinal canal stenosis and posterior longitudinal
ligament ossification, which are diseases that lead to sensory and
motor impairments in the upper and lower limbs due to the
compression of the spinal cord and spinal nerve root or cauda
equina nerve (1,2). Spinal stenosis and posterior
longitudinal ligament ossification are common spinal diseases
affecting the elderly, and Ciol et al estimated that by the
year 2025, the number of such cases will reach 64 million (3).
In normal ligamentum tissue, 60-70% of the
extracellular matrix (ECM) consists of elastic fibers, while only
20% is composed of collagen fibers. In the LF, elastic fibers are
arranged neatly and parallel to the long axis and the ECM is filled
with a higher amount of collagen fibers and ligamentum cells. When
the ligamentum has a high proportion of elastic fibers, the
ligamentum presents high elasticity and flexibility, which can
maintain the stability of the spine. Conversely, the hypertrophied
LF tissue exhibits a loss of elastic fibers, an increased presence
of collagen fibers, calcification, ossification and dysplasia of
the cartilage (4-6). Losing its unique strength and
elasticity, the LF becomes wrinkled and further protrudes into the
spinal canal, which leads to various symptoms, such as lumbar
spinal stenosis (7).
Researchers have suggested that the repeated
mechanical stretching of the LF caused by degenerative lumbar spine
instability will cause the elastic fibers to become broken and
disordered, and can ultimately lead to a sharp decrease in the
number of elastic fibers (6). It
has been reported that this repeated mechanical stretching may
cause ligamentum damage and lead to fibrotic scars and hypertrophy
of the ligaments, which are the main reasons for LFH. However,
studies have also reported that mechanical stress is only the
initiating factor that causes LFH. Nakatani et al (8) conducted continuous mechanical
stretching of LF cells and found that LF cells secreted a large
amount of transforming growth factor-β1 (TGF-β1) during the
stretching process, with the secreted amount presenting a linear
relationship with the stress intensity. Further experiments found
that TGF-β1 induced the synthesis of type I and type III collagen
fibers, which leads to LH. Therefore, LF cells may play an
important role in LFH.
A number of studies have also reported that the
proliferation of LF cells may lead to the secretion of numerous
inflammatory factors, such as cyclooxygenase (COX)-2, tumor
necrosis factor (TNF)-α, interleukin (IL)-1β, IL-8, IL-1α and IL-6
which causes the formation of scar tissue (4,5,9,10).
Sairyo et al reported that the formation of scar tissue
caused by inflammatory reactions was one of the important causes of
LFH and that the degree of hypertrophy was closely related to the
degree of fibrosis (11,12). In addition, studies have
demonstrated that LF cells can promote fibrin proliferation, which
induces the accumulation of collagen fibers and ultimately leads to
LFH (5,13,14).
However, the precise cellular mechanisms of LF cell
proliferation and LFH remain unclear (6,9).
Thus, the present study analyzed the mRNA expression profiles of
the hypertrophic and normal LF, and explored the possible
mechanisms responsible for LFH through bioinformatics analyses. In
addition, the mechanism responsible for LFH were further validated
by molecular biology experiments. On the whole, the results of the
present study enhance the current understanding of LFH, provide a
direction for further studies clarifying the mechanisms of LFH, and
provide potential therapeutic targets for diseases caused by LFH,
such as spinal stenosis and ossification of the posterior
longitudinal ligament.
Materials and methods
Collection of microarray data
mRNA microarray data were downloaded from the Gene
Expression Omnibus (GEO) database (http://www.ncbi.nlm.nih.gov/geo/) under the accession
number GSE113212. An Agilent-039494 SurePrint G3 Human GE v2 8x60K
Microarray 039381 (Probe Name version; Agilent Technologies, Inc.)
platform was used. A total of 4 LFH samples derived from elderly
individuals and 4 non-hypertrophic specimens from young individuals
were included in this dataset.
Data preprocessing and differentially
expressed gene (DEG) screening
The limma R package (version 3.36.5) of Bioconductor
3.8 (https://www.bioconductor.org/pack-ages/release/bioc/html/limma.html)
was adopted to conduct the quantile normalization of the raw data
and subsequent data processing to identify the DEGs between the LFH
samples and the normal controls, as previously described (5,14).
The DEGs between the 2 groups were evaluated using t-tests, and the
P-values were corrected for the false discovery rate (FDR) by the
Benjamini-Hochberg (BH) procedure. Only genes with a
|log2fold change (FC)|>1 and FDR <0.05 were
selected. Volcano plot filtering was applied to visualize the
significant DEGs. The differential gene expression patterns between
the two sample groups was analyzed by hierarchical clustering.
Functional and pathway enrichment
analysis of the DEGs
clusterProfiler V3.8 is a Bioconductor-dependent R
software package that not only automates the biological term
classification process and gene cluster enrichment analysis, but
also provides a visualization module that displays the results of
the analysis (15). In the
present study, the clusterProfiler package was used for Gene
Ontology (GO) and Kyoto Encyclopedia of Genes and Genomes (KEGG)
enrichment analyses of the identified DEGs.
Protein-protein interaction (PPI)
network
The STRING database (www.string-db.org) is an online database that has been
designed to identify PPI pairs and construct PPI networks from
large functional groups of proteins. The PPIs obtained for the DEGs
were searched using the STRING database, and PPI pairs with a
combined score >0.9 were selected. A PPI network of the DEGs was
then constructed using Cytoscape software (16-18). In the network, each node is a
protein and the number of edges corresponds to the degree of
interaction. CytoNCA V2.16 is a Cytoscape plugin for network
centrality analysis that can be used to identify critical nodes
(genes) in a network (19). In
the present study, critical genes were identified based on 4
typical centrality measures as follows: Eigenvector centrality,
degree centrality, betweenness centrality and closeness centrality.
Finally, the top 10 genes in the PPI network were identified as
critical genes according to their centrality values.
Isolation, culture and identification of
ligamentum cells
According to a previously described method,
ligamentum cells were isolated and cultured from patients with
lumbar spine stenosis (20). The
study was approved by the Ethics Committee of Xuzhou Medical
University Affiliated Hospital and written consent was obtained
from all patients. Briefly, fresh LF tissue was washed with PBS,
cut and digested with type I collagenase, and the digested tissue
sections were then plated in a culture dish, as previously
described (21). The dish was
placed into an incubator for cultivation (5% CO2, 37°C).
After 8 h, DMEM containing fetal bovine serum was added to the
culture dish and culturing was continued. When the primary cells
migrated out and grew to 80% confluence, they were digested and
passaged with cell digestion solution (trypsin + EDTA). LF cells
were cultured in a cell culture incubator containing 5%
CO2 at a constant temperature of 37°C in RPMI-1640
medium containing 10% fetal bovine serum, 50 µg/ml
penicillin and 50 µg/ml streptomycin. The cultured cells
were observed for fibroblast morphology and identified by vimentin
immunostaining and DAPI staining. For immunofluorescence analysis,
monolayers of cells were grown on glass coverslips inserted in
6-well plates. After rinsing with PBS, the cells were fixed in 4%
paraformaldehyde in PBS for 10 min and permeabilized with PBS
containing 0.5% Triton X-100 for 5 min at room temperature.
Blocking was performed with 5% bovine serum albumin (BSA) in PBS
for 30 min, and the cells were subsequently incubated overnight at
4°C with anti-vimentin monoclonal antibody (dilution 1:100; #5741,
Cell Signaling Technology, Inc.). Following 3 washes in PBS (5 min
each), the cells were incubated for 60 min at room temperature with
a 1:100 dilution of the FITC-conjugated goat anti-rabbit IgG
(dilution 1:500; #4412, Cell Signaling Technology, Inc.)
respectively. After washing with sterile PBS, the cell nuclei were
stained with DAPI, followed by mounting on coverslips using
mounting solution overnight at room temperature. Images were
obtained and analyzed using the LSM-510 laser confocal microscope
system (Carl Zeiss CMP GmbH).
RNA transfection
The sequences of the target gene A disintegrin and
metalloproteinase 10 (ADAM10) and a corresponding empty plasmid
were obtained from Sangon Biotech (Shanghai) Co., Ltd. The sequence
of the human ADAM10 siRNA was 5′-AGA CAU UAU GAA GGA UUA UTT-3′,
and that of the negative control siRNA was 5′-AGG UAG UGU AAU CGC
CUU GTT-3′. LF cells were seeded in 24-well plates and transfected
when the cell confluence reached 30-50%. Cell transfection was then
performed using 5 µl Lipofectamine 2000 (Invitrogen; Thermo
Fisher Scientific, Inc.) according to the manufacturer's
instructions, and 5 µl each of ADAM10 siRNA and negative
control siRNA to were prepared to a final concentration of 100 nM;
the transfected cells were collected 48 h later and used to detect
the protein of interest and applied in subsequent experiments. The
groups of untreated LF cells, negative control siRNA-transfected
cells and ADAM10 siRNA-transfected cells were named the control1,
sham1 and ADAM10(-) groups, respectively.
ADAM10 overexpression
LF cells were collected and treated with recombinant
lentivirus containing pcDNA3.1-ADAM10 or negative control
lentivirus [Sangon Biotech (Shanghai) Co., Ltd.], and the medium
was changed following 24 h of culture. The infection efficiency was
>90%, which was acceptable and indicated that the cells could be
used in subsequent experiments. The groups of cells treated with
recombinant lentiviruses containing pcDNA3.1-ADAM10 and negative
control lentiviruses were named the ADAM10(+) group and the sham2
group, respectively, and a group of cells without lentivirus
treatment was named the control2 group.
Reverse transcription-quantitative PCR
(RT-qPCR)
All groups of cells were subjected to RT-qPCR.
TRIzol (Invitrogen; Thermo Fisher Scientific, Inc.) was added to
each culture dish containing cells (1 ml of TRIzol per
106 cells). According to Universal column RNA extraction
kit (CWY065, CWBio), total RNA was extracted and subjected to
reverse transcription in a total volume of 20 µl to obtain
cDNA. qPCR (using the UltraSYBR One Step RT-qPCR kit, CW0659,
CWBio) amplification was performed using 0.5 µl of cDNA as a
template. The reaction conditions are as follows: 95°C for 2 min,
85°C for 15 sec and 60°C for 2 min sec, 40 cycles. A total of 1.5
µl of the ADAM10 upstream and downstream primers (5′-CTG CCC
AGC ATC TGA CCC TAA-3′ and 5′-TTG CCA TCA GAA CTG GCA CAC-3′), mix
10 µl, and water to a total volume of 20 µl were used
for PCR. β-actin (5′-GAT CAT TGC TCC TCC TGA GC-3′ and 5′-ACT CCT
GCT TGC TGA TCC AC-3′) served as the internal reference for each
group. The data were calculated using the 2−ΔΔCq method
(22).
Western blot analysis
Total protein was extracted by the lysis of all
groups of cells with RIPA lysis buffer (Sangon Biotech, Shanghai,
China) (including a protease inhibitor and phosphatase inhibitor),
and using a BCA kit (Thermo Fisher Scientific, Inc.) to determine
the protein concentration. A total of 10 µg protein/lane was
separated by 10% SDS-PAGE and transferred to PVDF membranes. The
membranes were blocked with 5% blocking buffer (BSA) for 1 h at
room temperature and incubated with primary antibodies against
ADAM10 (dilution 1:1,000; #14194, Cell Signaling Technology, Inc.),
AKT (dilution 1:1,000; #9272, Cell Signaling Technology, Inc.),
PI3K (dilution 1:1,000; #4255, Cell Signaling Technology, Inc.),
p-AKT (dilution 1:1,000; #4060, Cell Signaling Technology, Inc.)
and p-PI3K (dilution 1:1,000; #4228, Cell Signaling Technology,
Inc.) at 4°C overnight. The membranes were then incubated with
horse-radish peroxidase-conjugated secondary antibodies (dilution
1:1,000; goat anti-mouse IgG, ab205719 and goat anti-rabbit IgG,
ab205718; Abcam) for 1 h at room temperature and finally developed
with an enhanced chemiluminescence (ECL) kit for visualization. The
western blot analysis data were analyzed performed using ImageJ
software (version 6.0; Media Cybernetics, Inc.).
Cell proliferation analysis
To further detect the role of the ADAM10 gene in the
progression of LFH, a PI3K/AKT pathway agonist (740 Y-P, 10
µg/ml) (HY-P0175, MedChemExpress) was added to the ADAM10(−)
cells to form the ADAM10(−)-740 Y-P group, and incubated for 0, 24,
48, 72 and 96 h at 37°C. A PI3K/AKT pathway inhibitor (LY294002, 10
µM) (HY-10108, MedChemExpress) was added to the ADAM10(+)
cells to form the ADAM10(+)-LY294002 group, and incubated for 0,
24, 48, 72 and 96 h at 37°C. The cells were divided into 5 groups
as follows: The control group, ADAM10(+) group, ADAM10(−) group,
ADAM10(−) + 740Y-P group and ADAM10(+)-LY294002 group. An EdU
uptake assay was performed according to the EdU Imaging kit
instructions (Invitrogen; Thermo Fisher Scientific, Inc.). Briefly,
equal numbers of cells were incubated with 50 mM EdU for 2 h at
37°C. The cells were then subjected to EdU staining by fixation
with 4% paraformaldehyde for 15 min and permeabilization with 5%
Triton X-100 at room temperature for 20 min. Images of 5 randomly
selected non-overlapping regions from each group were collected
under a fluorescence microscope (Bio-Rad Laboraroties, Inc.) at a
magnification of ×200, and the proportions of EdU-positive cells
among DAPI-positive cells were calculated. For the Cell Counting
Kit-8 (CCK8) experiment, cells were plated in 6-well plates
(cells/well) in a single cell suspension at a concentration of
3×10⁴ cells/ml. Following cell adherence, 10 µl
of CCK8 reagent were added to each well and incubated for 0, 24,
48, 72 and 96 h at 37°C, after which the OD at 450 nm was detected
using microplate reader (Bio-Rad Laboraroties, Inc.).
Statistical analysis
All experimental data were statistically analyzed by
SPSS 19.0 software. The data are expressed as the means ± standard
deviation. In total, 3 independent experiments were performed for
RT-qPCR analysis, western blot analysis and CCK-8 cell
proliferation assay. Comparisons between 2 groups were analyzed
using the Student's t-test. Multiple sets of groups were analyzed
with one-way analysis of variance (ANOVA) with the Fishers' Least
Significant Difference post hoc test. P-values of <0.05 were
considered to indicate statistical significant differences.
Results
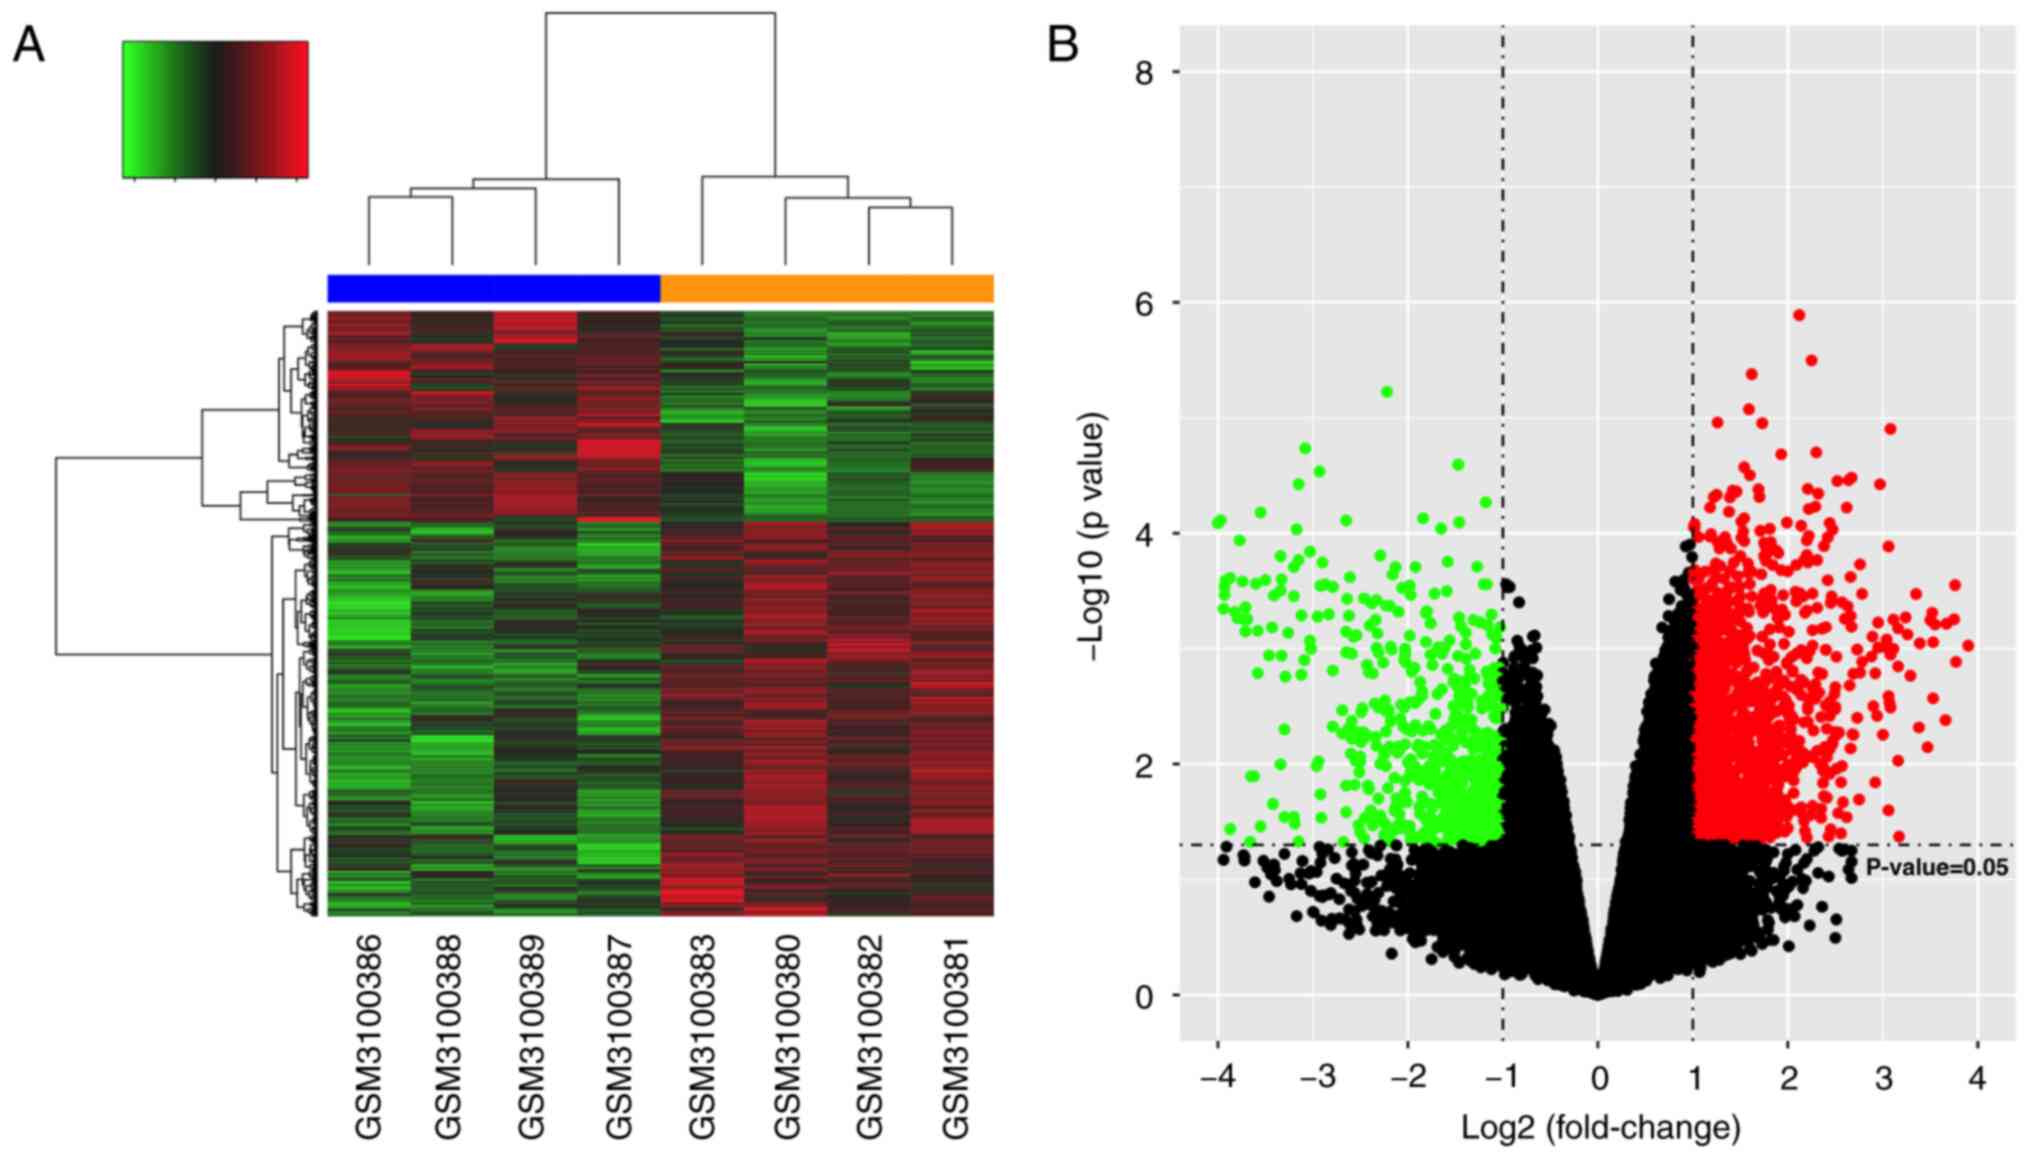
Identification of DEGs
Following data normalization, a differential gene
expression analysis was performed using the dataset that included 4
hypertrophic samples and 4 non-hypertrophic control samples. A
total of 2,123 DEGs were screened based on values of FDR <0.05
and log2 FC >1 as the standard. Among these genes,
1,384 genes were upregulated and 739 genes were downregulated.
Subsequently, hierarchical clustering was performed based on the
DEG expression values from the microarray (Fig. 1A). The differential expression
ratios and P-values of the DEGs between each group were also
compared using a volcano plot (Fig.
1B).
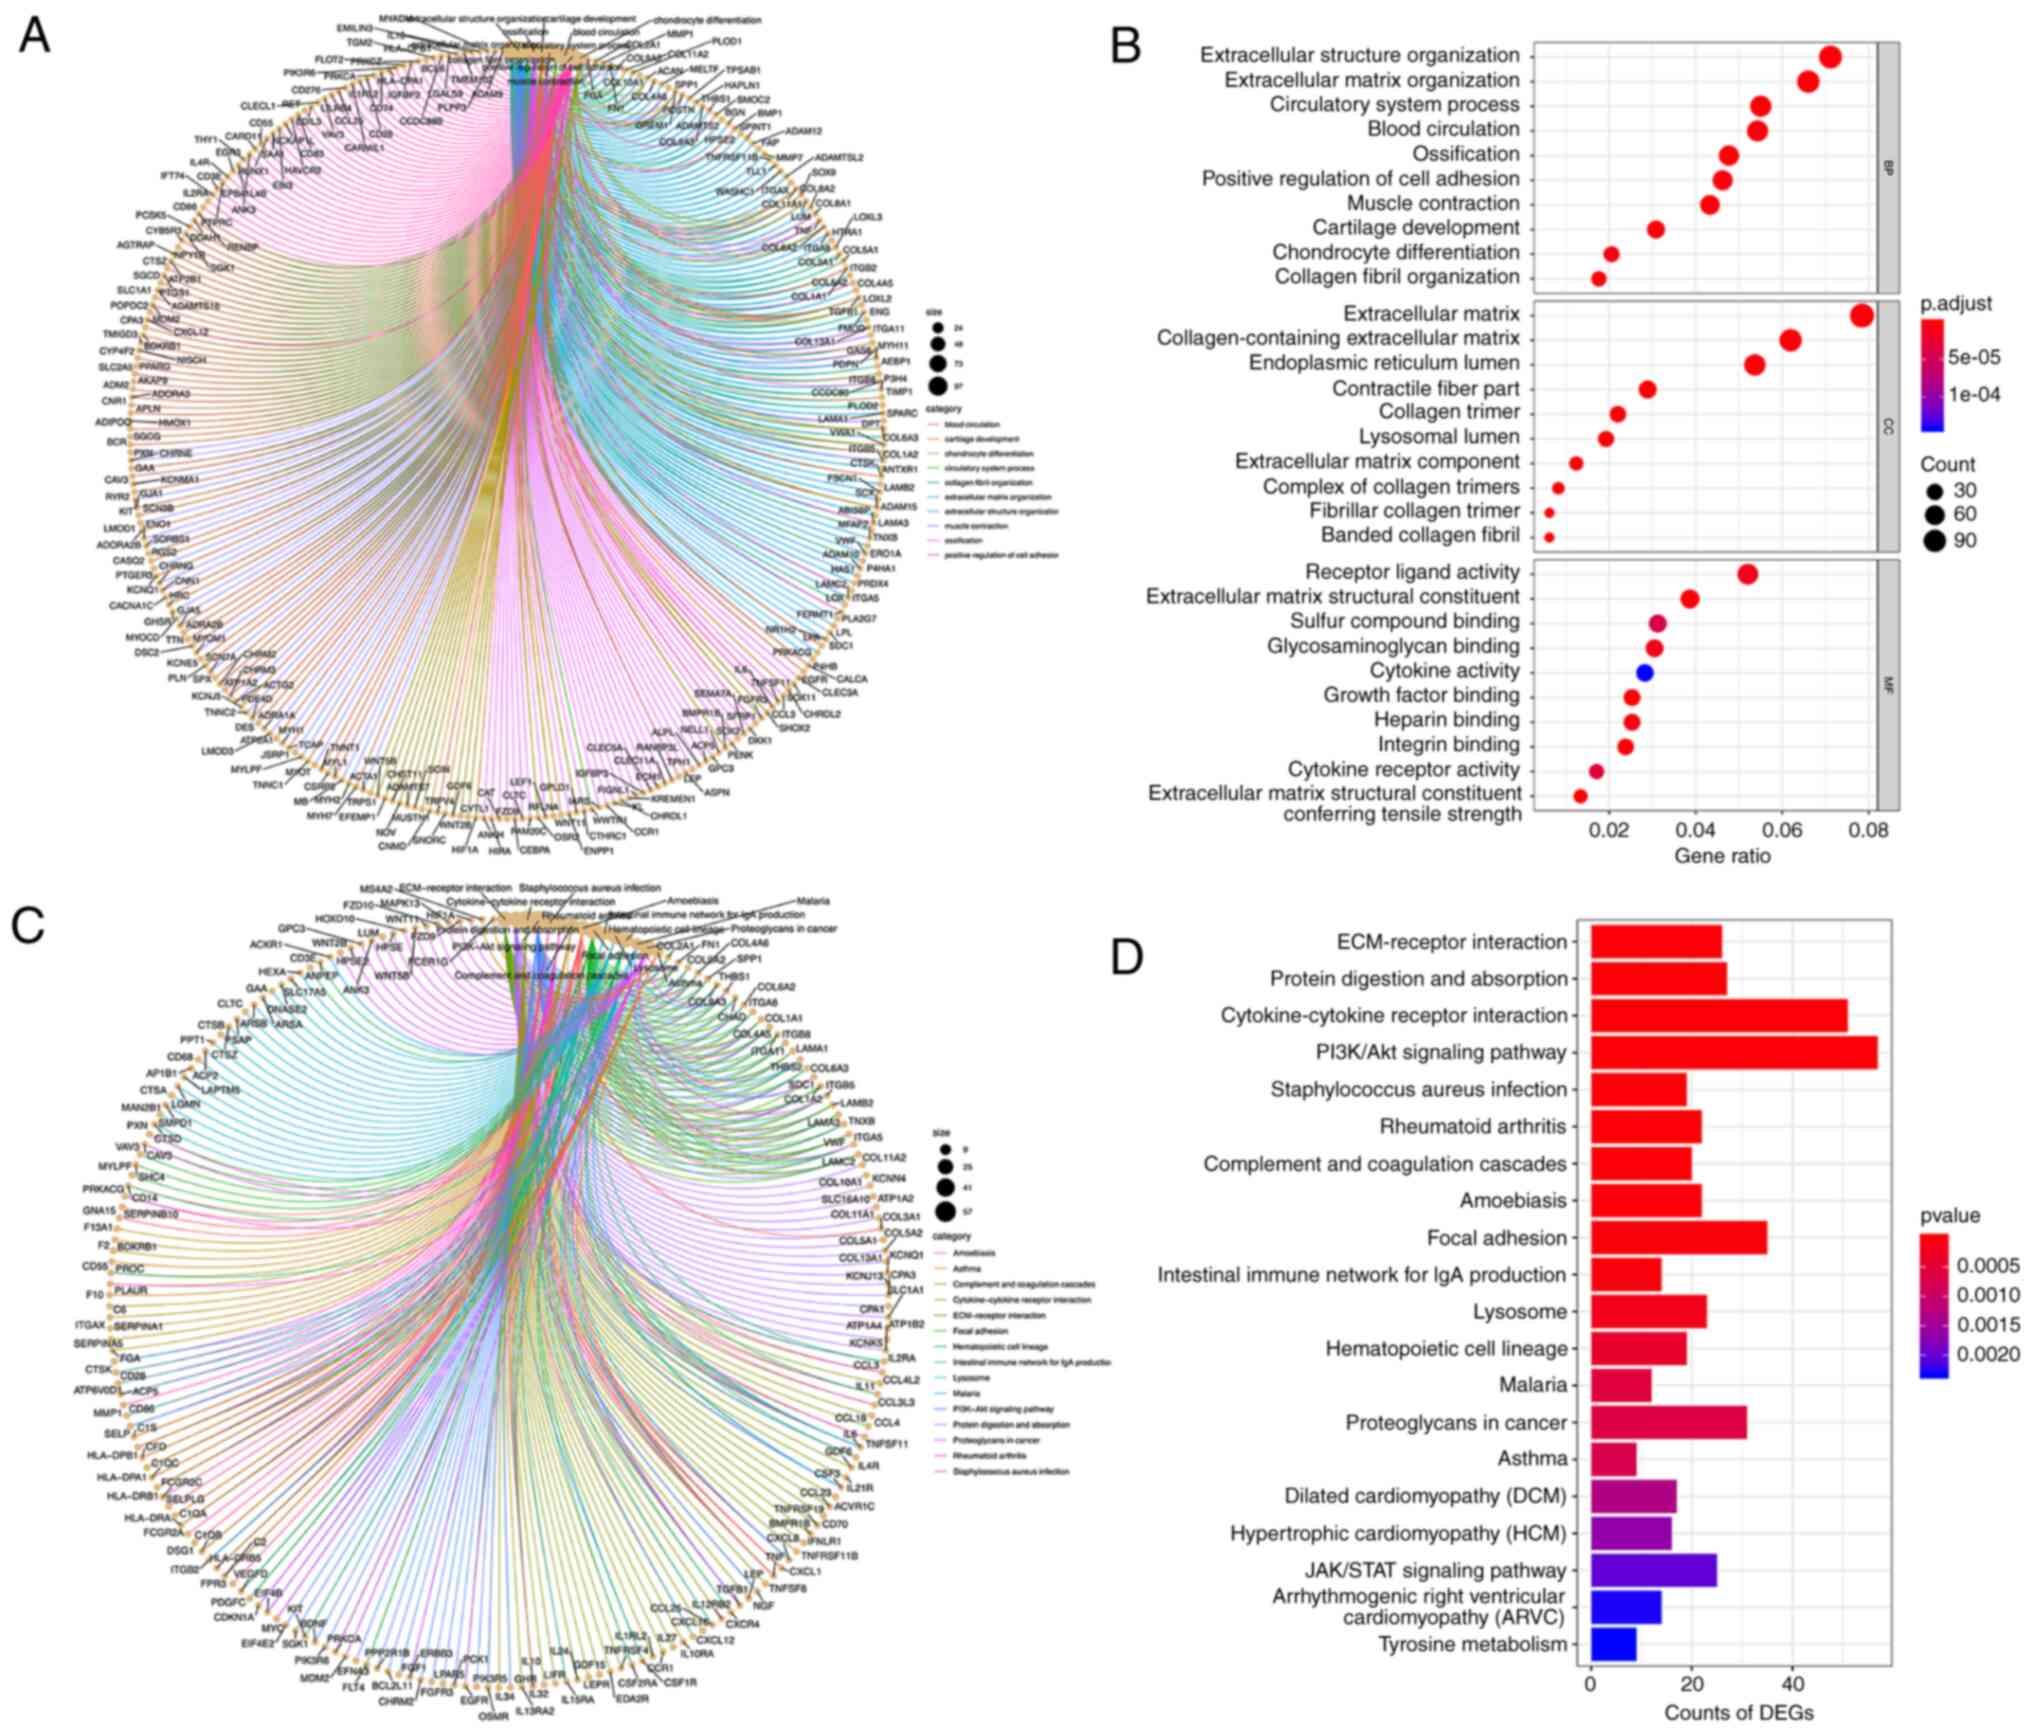
GO term and KEGG pathway enrichment
analysis
To investigate the DEGs on a more functional level,
the most recent versions of the GO and KEGG pathway databases were
used to analyze the gene symbols and determine the potential
functions of the DEGs. GO enrichment analysis revealed that the
DEGs were significantly enriched for 742 biological processes
(BPs), 277 molecular functions (MFs) and 151 cellular components
(CCs). The GO results were mainly associated with collagen in the
ECM and included categories, such as ECM organization,
collagen-containing ECM, and collagen trimer and integrin binding
(Fig. 1A and B). In addition, a
total of 311 pathways were potentially involved in the progression
of LFH according to the screening results. The KEGG results
revealed enrichment mainly in the PI3K/AKT pathway,
cytokine-cytokine receptor interactions, protein digestion and
absorption, and ECM-receptor interactions (Fig. 2C and D). These pathways have a
definite influence on the occurrence and development of LFH, and
the PI3K signaling pathway may be an important pathway leading to
the development of LFH. Previous studies have reported that PI3K
signaling plays an important role in cell proliferation (23,24), which is essential in the
development of LFH.
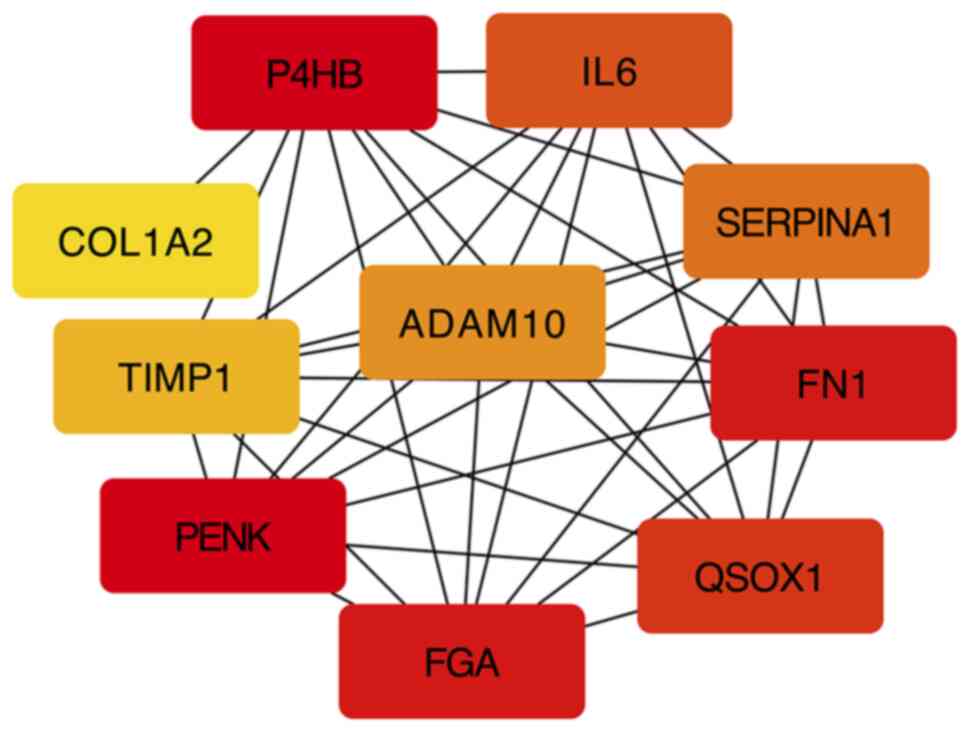
ADAM10 is enriched in the PPI network
analysis
According to the PPI pairs in the STRING database,
an interaction network of the proteins encoded by the DEGs was
constructed. A centrality analysis of the nodes in the PPI network
revealed that proenkephalin (PENK), prolyl 4-hydroxylase (P4HB),
fibronectin 1 (FN1), fibrinogen alpha chain (FGA), quiescin
sulfhydryl oxidase 1 (QSOX1), IL6, serpin family A member 1
(SERPINA1), ADAM10, tissue inhibitor of metalloproteinase 1 (TIMP1)
and collagen type I alpha 2 (COL1A2) were crucial genes (Fig. 3). Among these genes, PENK, P4HB,
FN1, QSOX1, SERPINA1, ADAM10 and TIMP1 were upregulated in LFH,
while FGA, IL6 and COL1A2 were downregulated in LFH. The
dysregulation of these genes may be closely related to LFH. Among
the genes altered, ADAM10 exhibited significant degrees of
correspondence in LFH; this gene has been reported as an important
regulator of cell proliferation (25) and plays a regulatory role that is
closely related to PI3K/AKT (26,27).
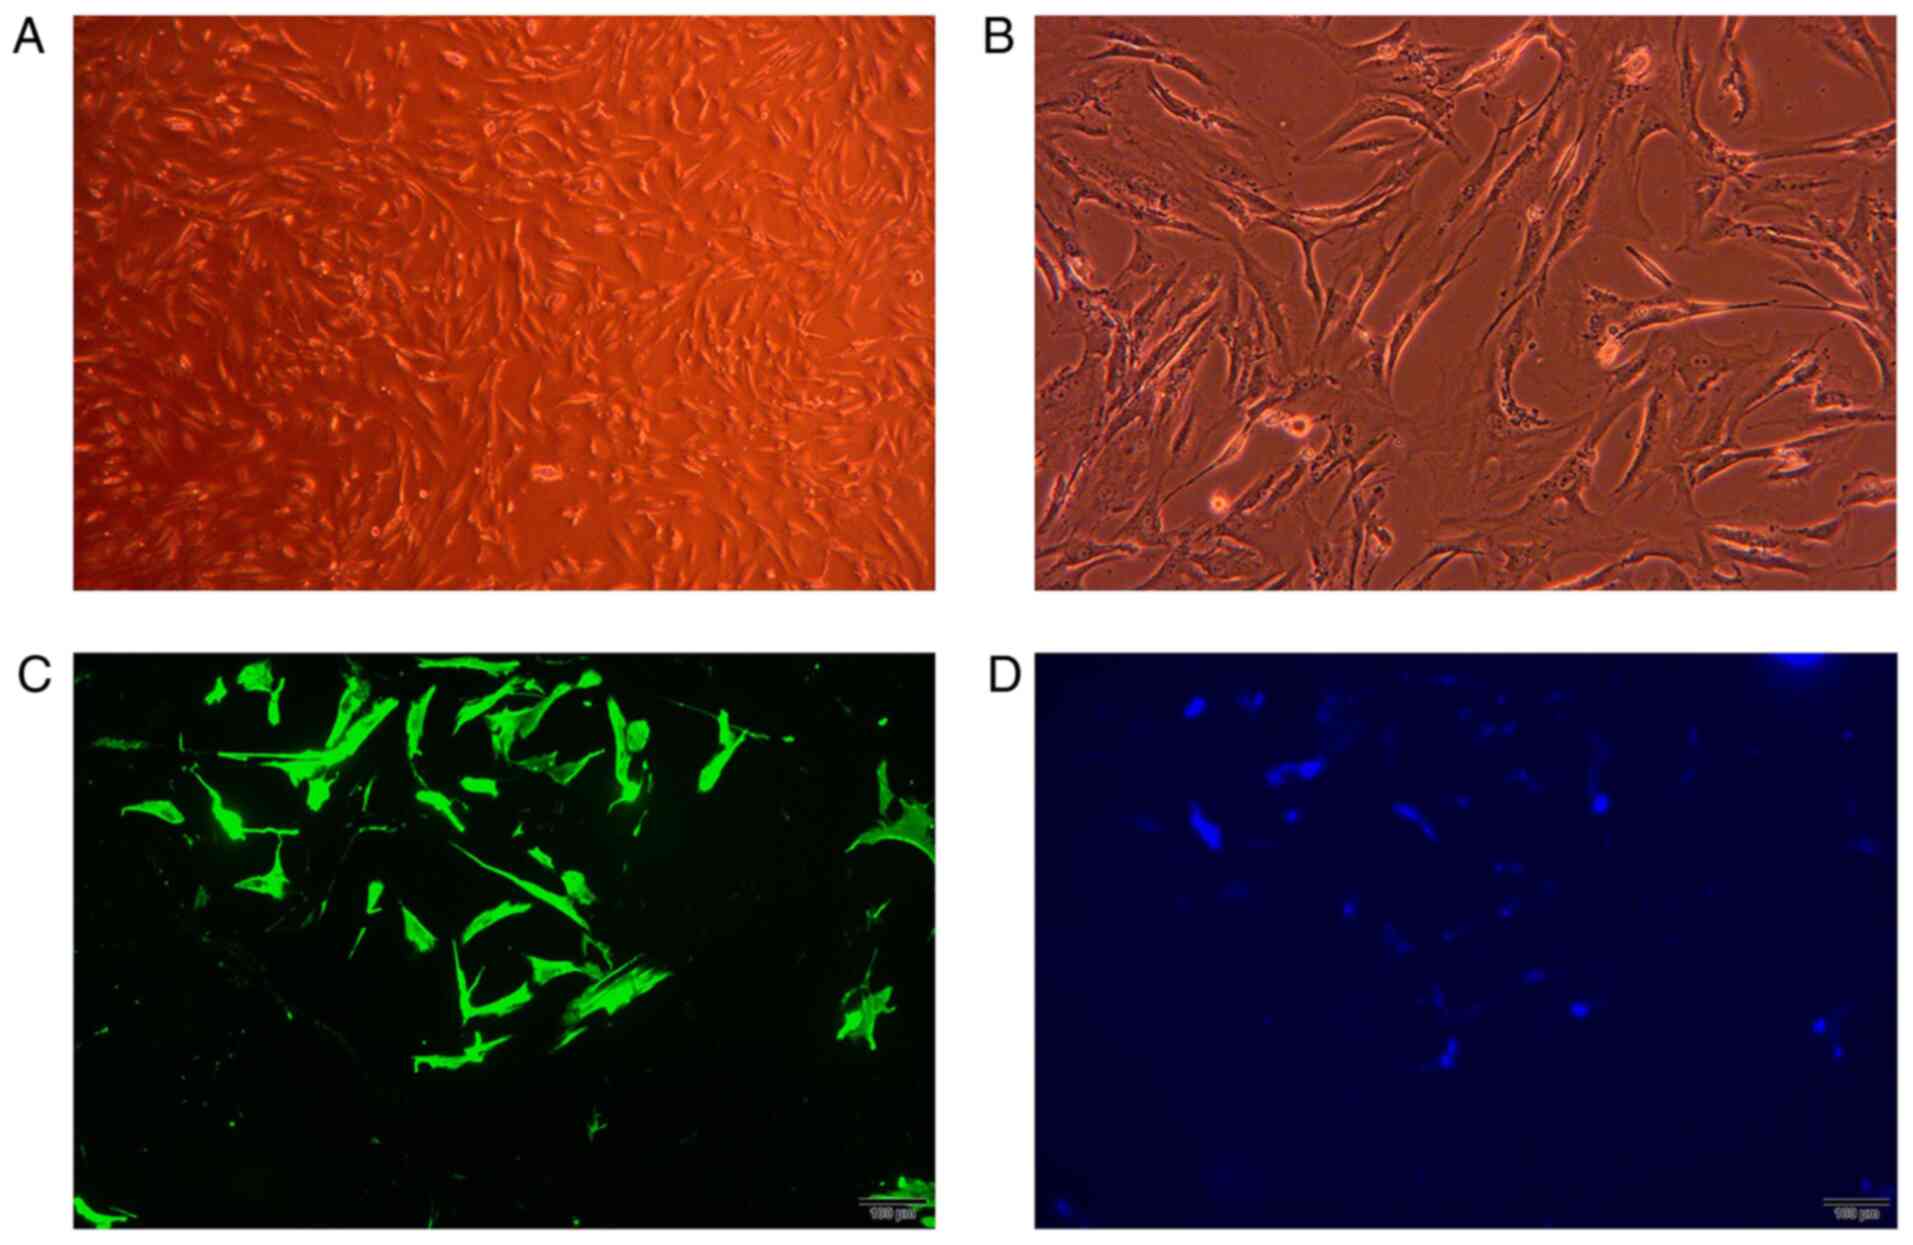
Silencing of ADAM10 inhibits the
proliferation of LF cells via the PI3K/AKT pathway
LF cells were cultured and identified. In the
present study, LF cells were successfully isolated using an explant
method. Within 14 days following explantation, the outgrowth of
cells from ligament tissue was observed and became monolayer.
Morphologically, the LF cells exhibited features of fibroblast-like
cells with a spindle-like shape. As demonstrated by
immunofluorescence, the LF cells were positive for vimentin
(Fig. 4). To further validate the
roles of key genes and pathways in the development and progression
of LFH, mRNA and protein expression was examined by RT-qPCR and
western blot analysis, respectively. The mRNA and protein
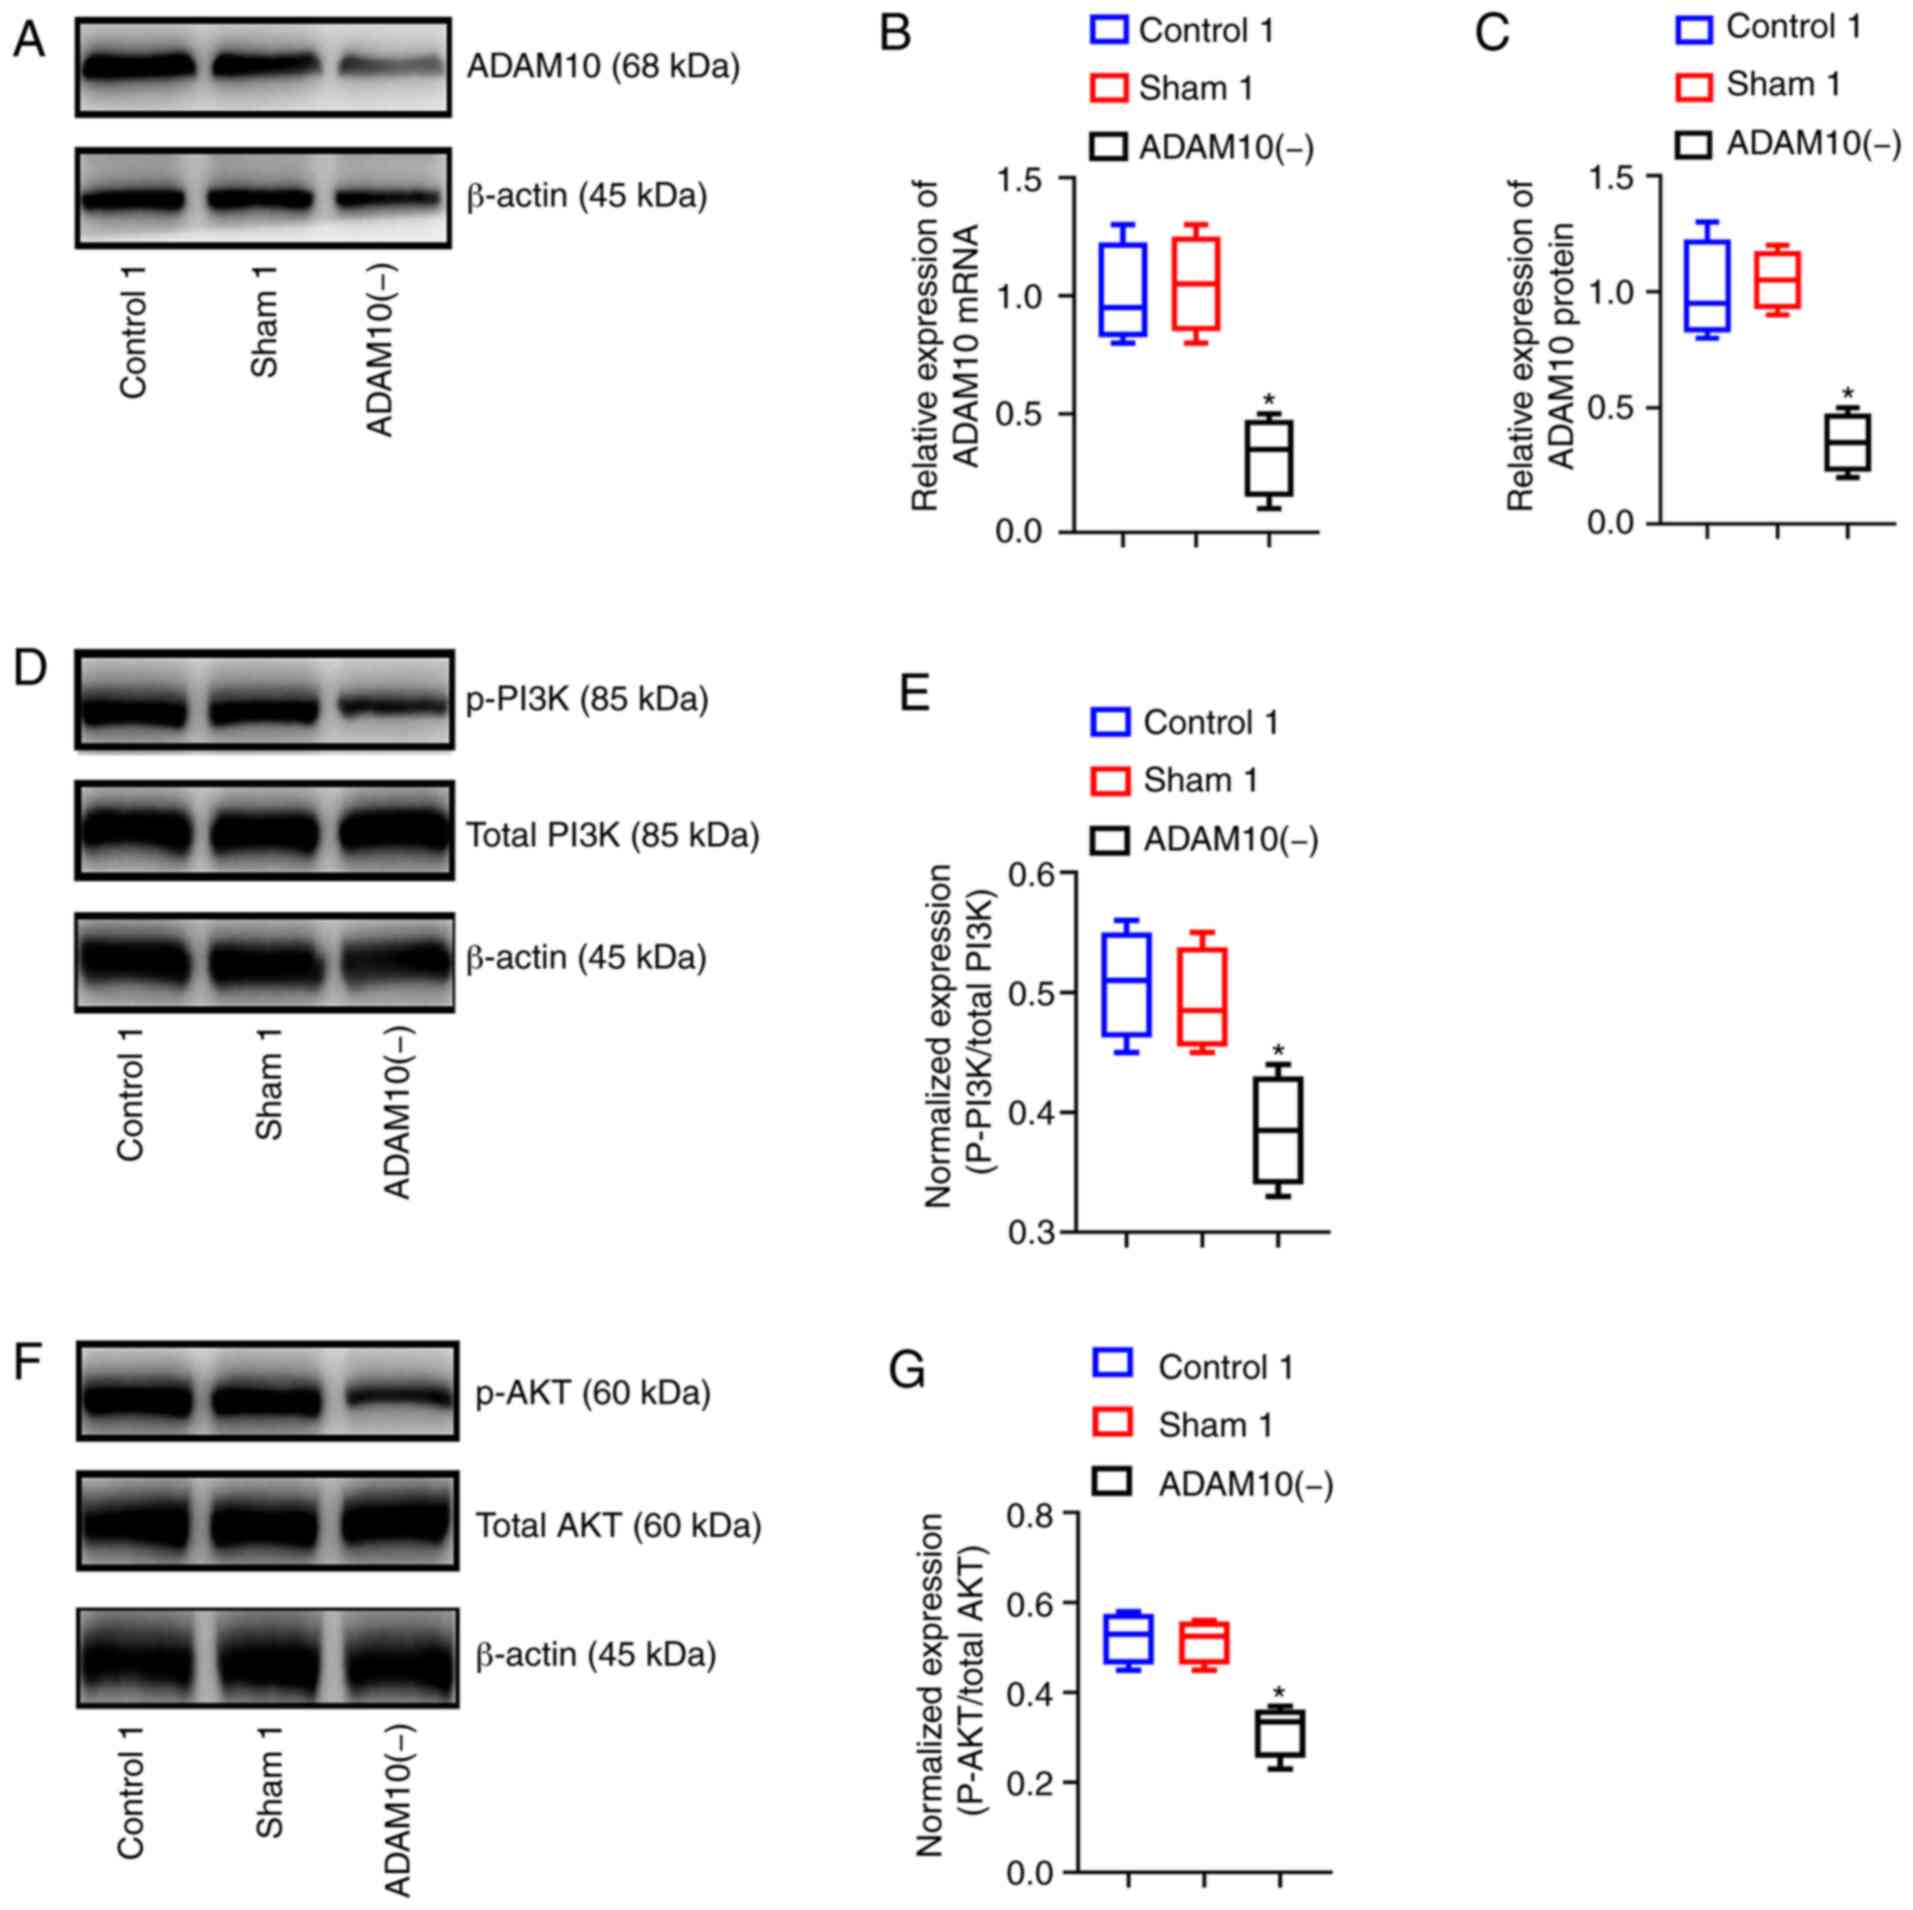
expression levels of ADAM10 in the ADAM10(−) cells were
significantly lower than those in the cells of the control1 and
sham1 groups (P<0.05), although significant differences were not
observed between the control1 and sham1 group (P>0.05). This
result indicated that cell transfection-mediated silencing of
ADAM10 was successful (Fig.
5A-C). In addition, western blot analysis was used to detect
key proteins in the PI3K/AKT signaling pathway. The results
revealed that the expression levels of p-AKT and p-PI3K were
significantly lower in the ADAM10(−) group compared with the other
2 groups (P<0.05; Fig. 5D-G).
Thus, the silencing of ADAM10 downregulated key proteins of the
PI3K/AKT pathway.
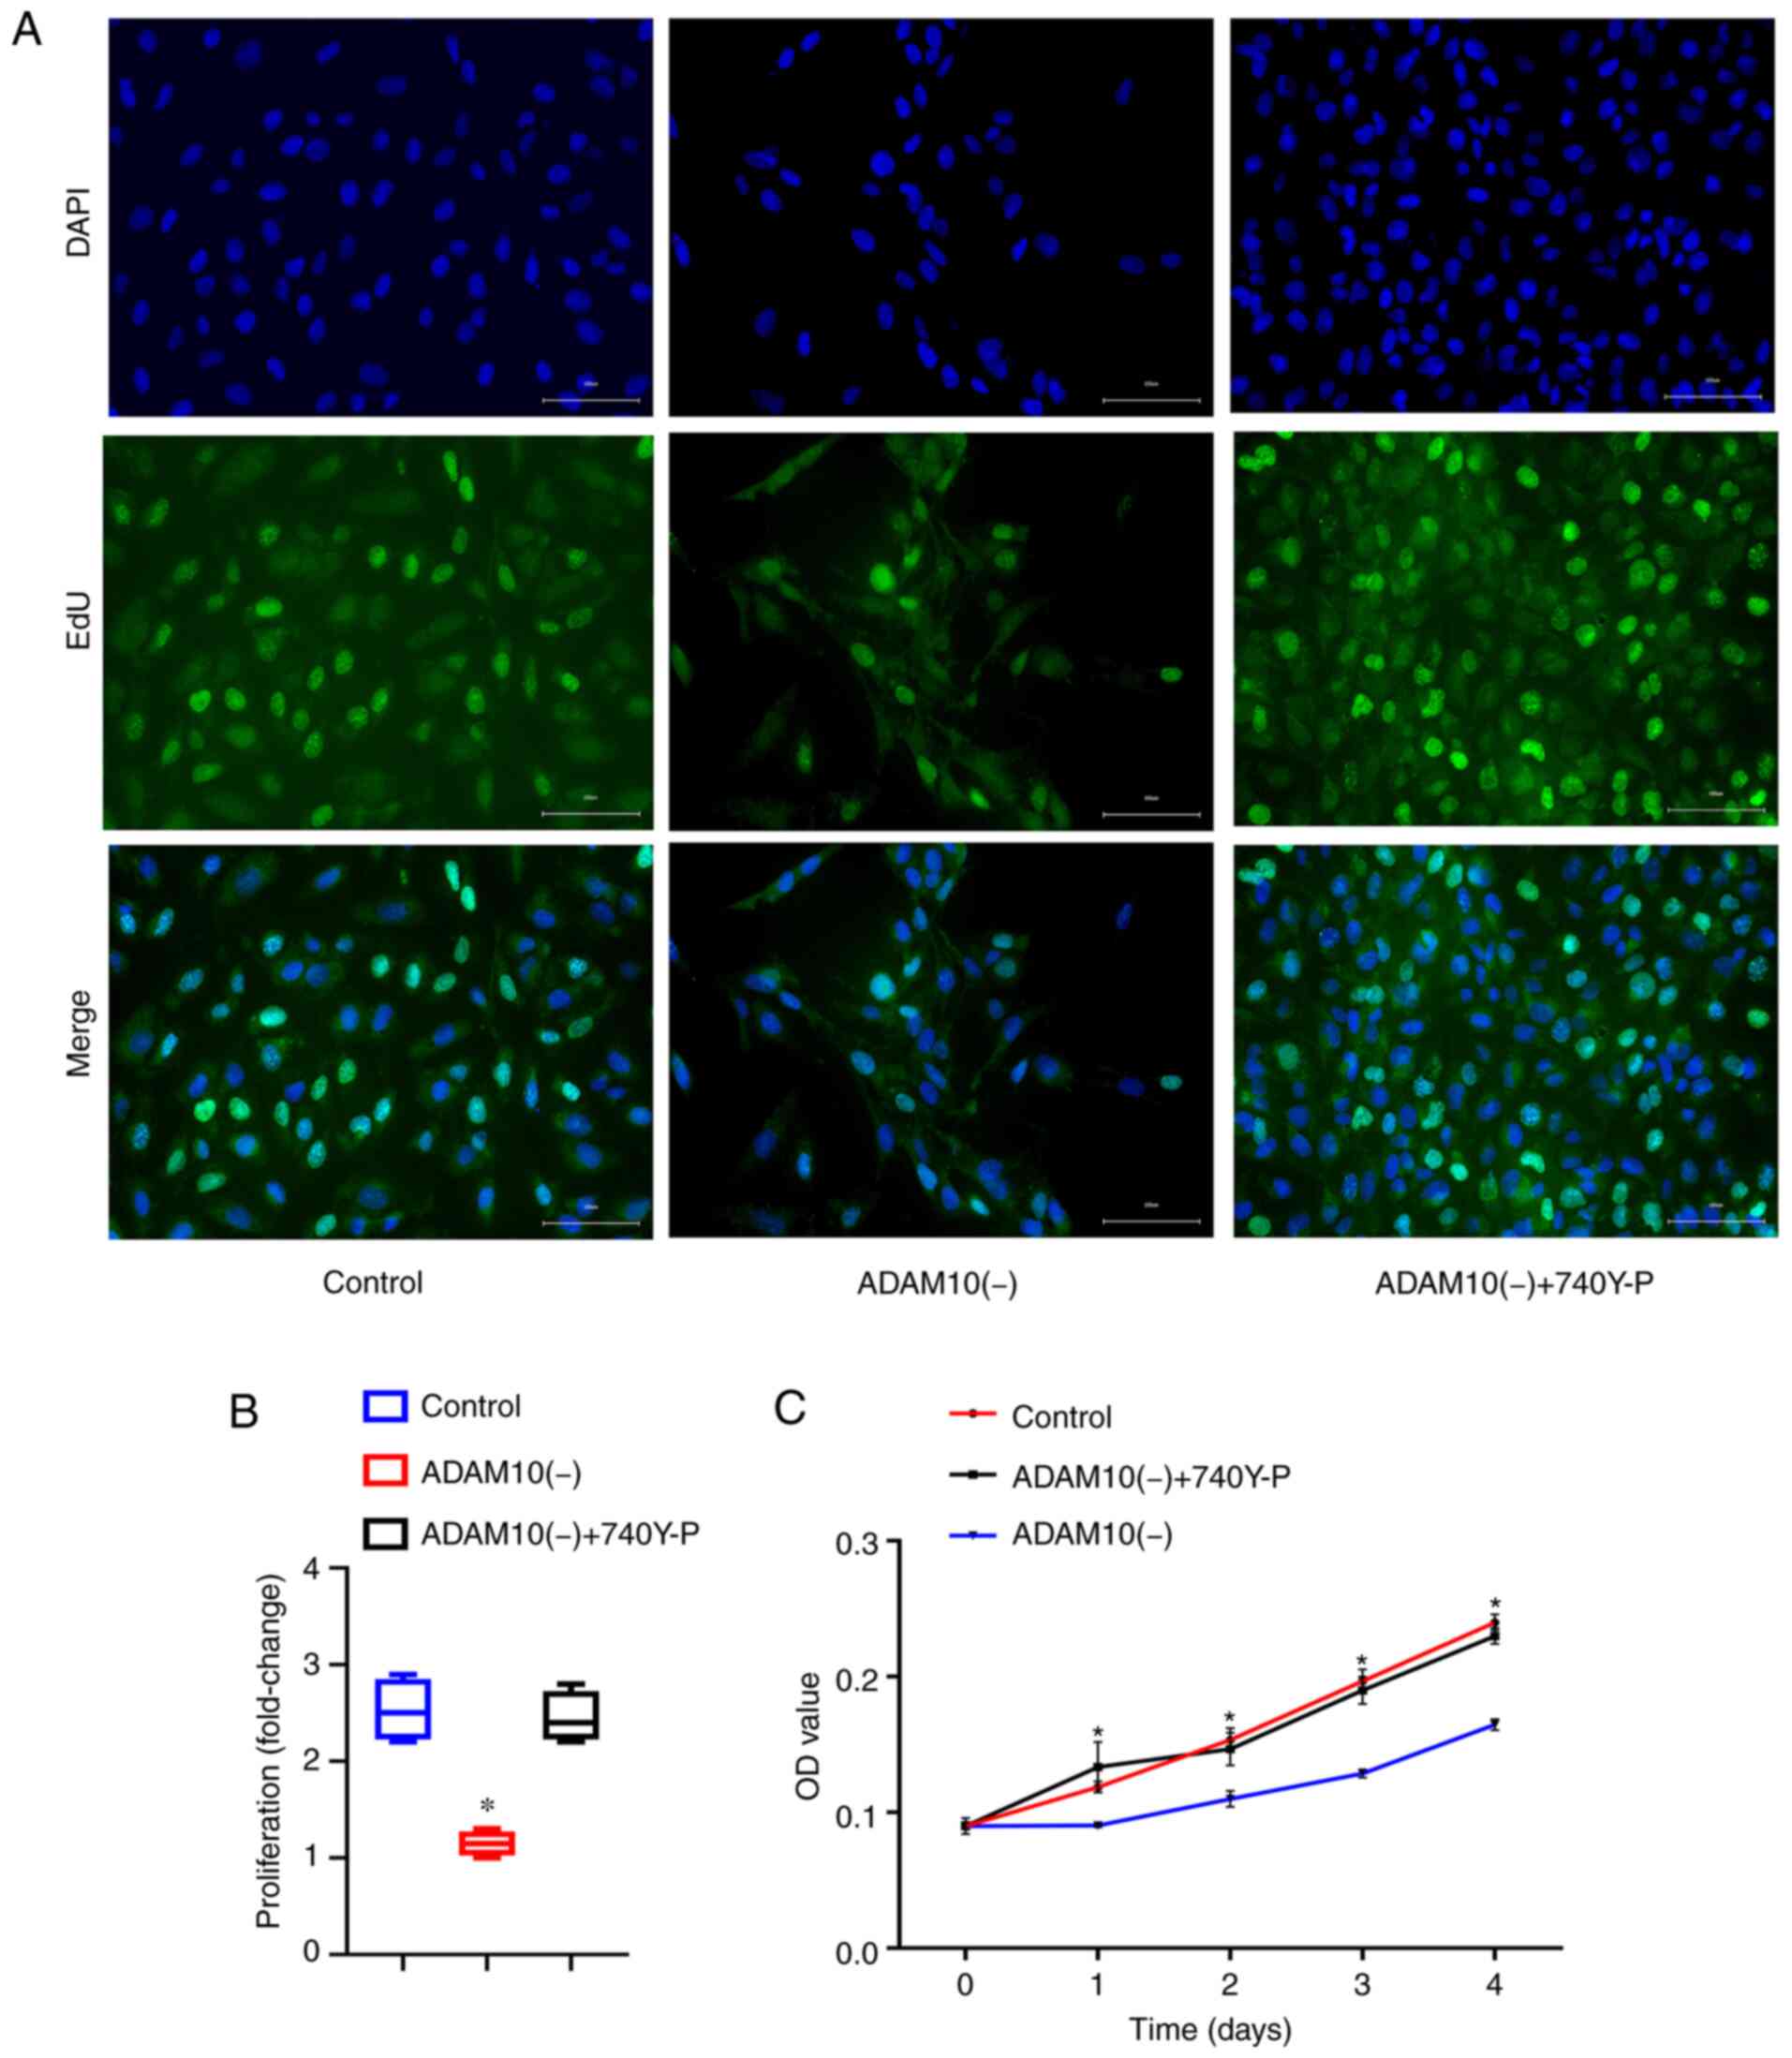
To further explore the role of the ADAM10 gene in
LFH, EdU (Fig. 6A and B) and
CCK-8 assays (Fig. 6C) were
performed to detect the proliferation of the cells in the 3 groups.
In addition, to better verify the role of the PI3K/AKT pathway, the
pathway agonist, 740Y-P, was added to the ADAM10(−) cells and the
effects on cell proliferation were observed. The results revealed
that the proliferation of the ADAM10(−) cells was significantly
inhibited compared with the cells in the control group and
ADAM10(−) + 740Y-P group (P<0.05). Moreover, significant
differences were not observed between the control group and
ADAM10(−) + 740Y-P group. On the whole, the results demonstrated
that the silencing of ADAM10 inhibited the proliferation of LF
cells via the PI3K/AKT pathway.
Overexpression of ADAM10 increases the
proliferation of LF cells via the PI3K/AKT pathway
To further validate the key genes and critical
pathways involved in LFH, overexpression experiments were also
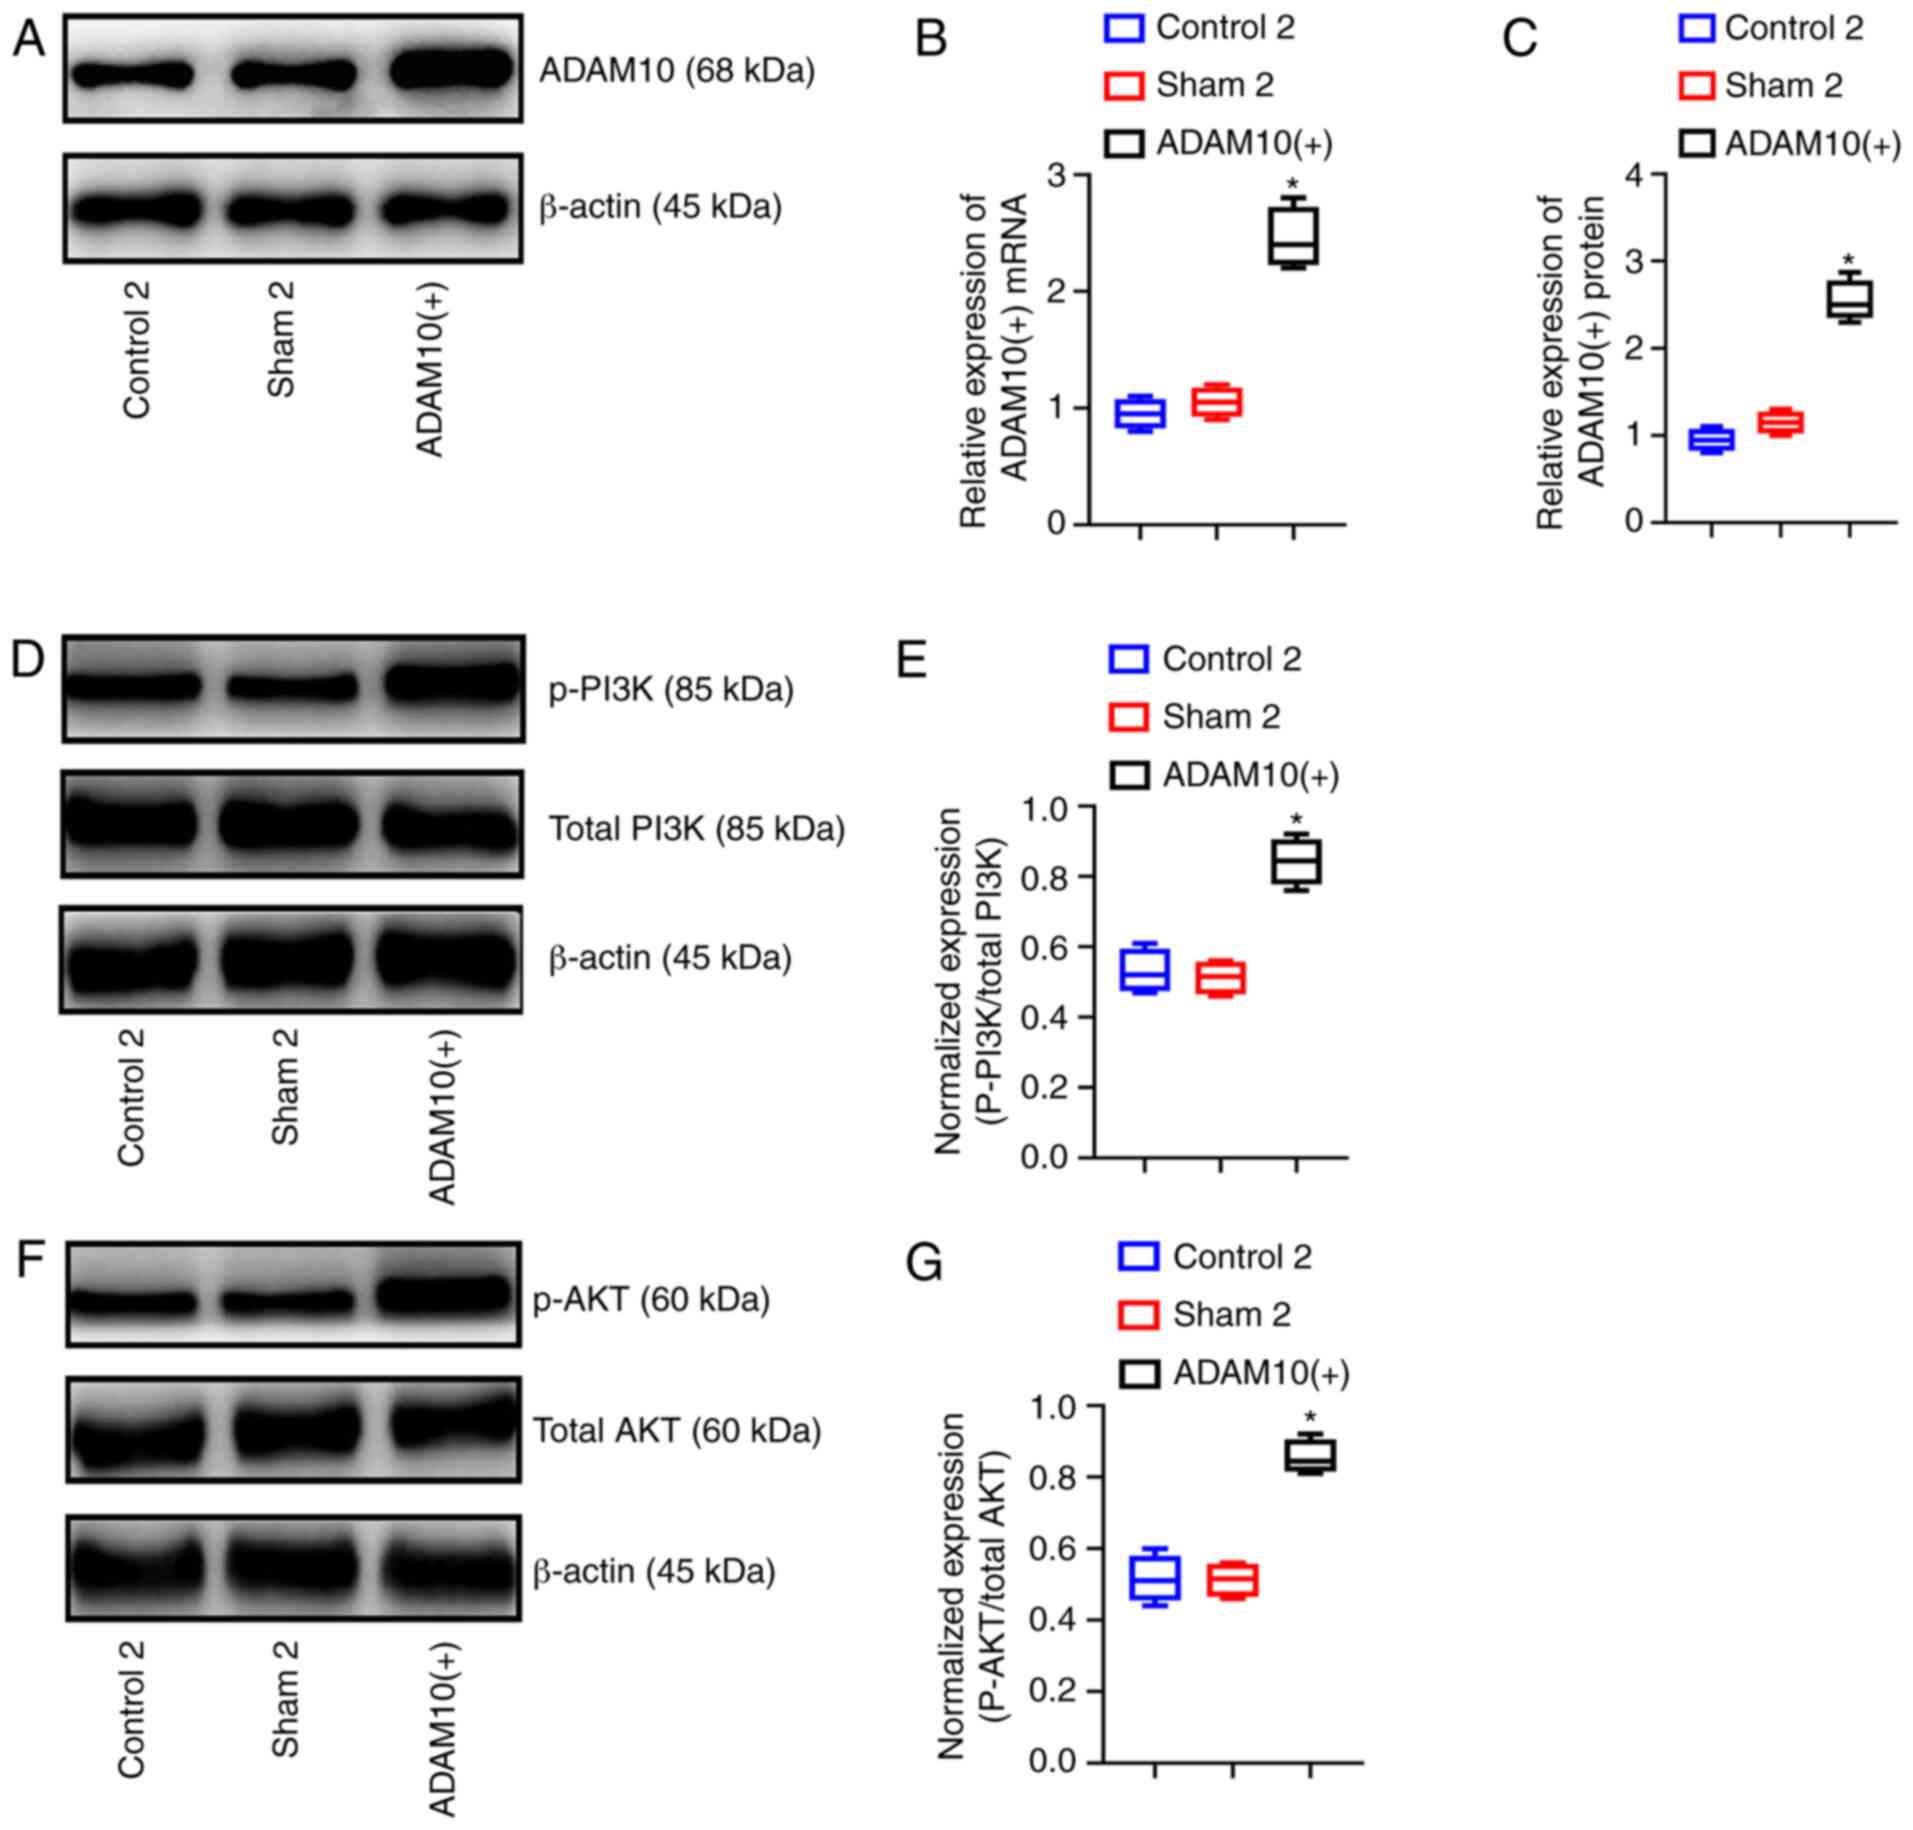
performed. The mRNA and protein expression levels of ADAM10 in the
ADAM10(+) cells were significantly higher than those in the other 2
cell groups (P<0.05). This result indicated that the
overexpression of ADAM10 in LF cells was successful (Fig. 7A-C). Similarly, key proteins in
the PI3K/AKT pathway were also detected. The results revealed that
the expression levels of p-AKT and p-PI3K were significantly higher
in the ADAM10(+) cells than the other 2 groups of cells (P<0.05;
Fig. 7D-G).
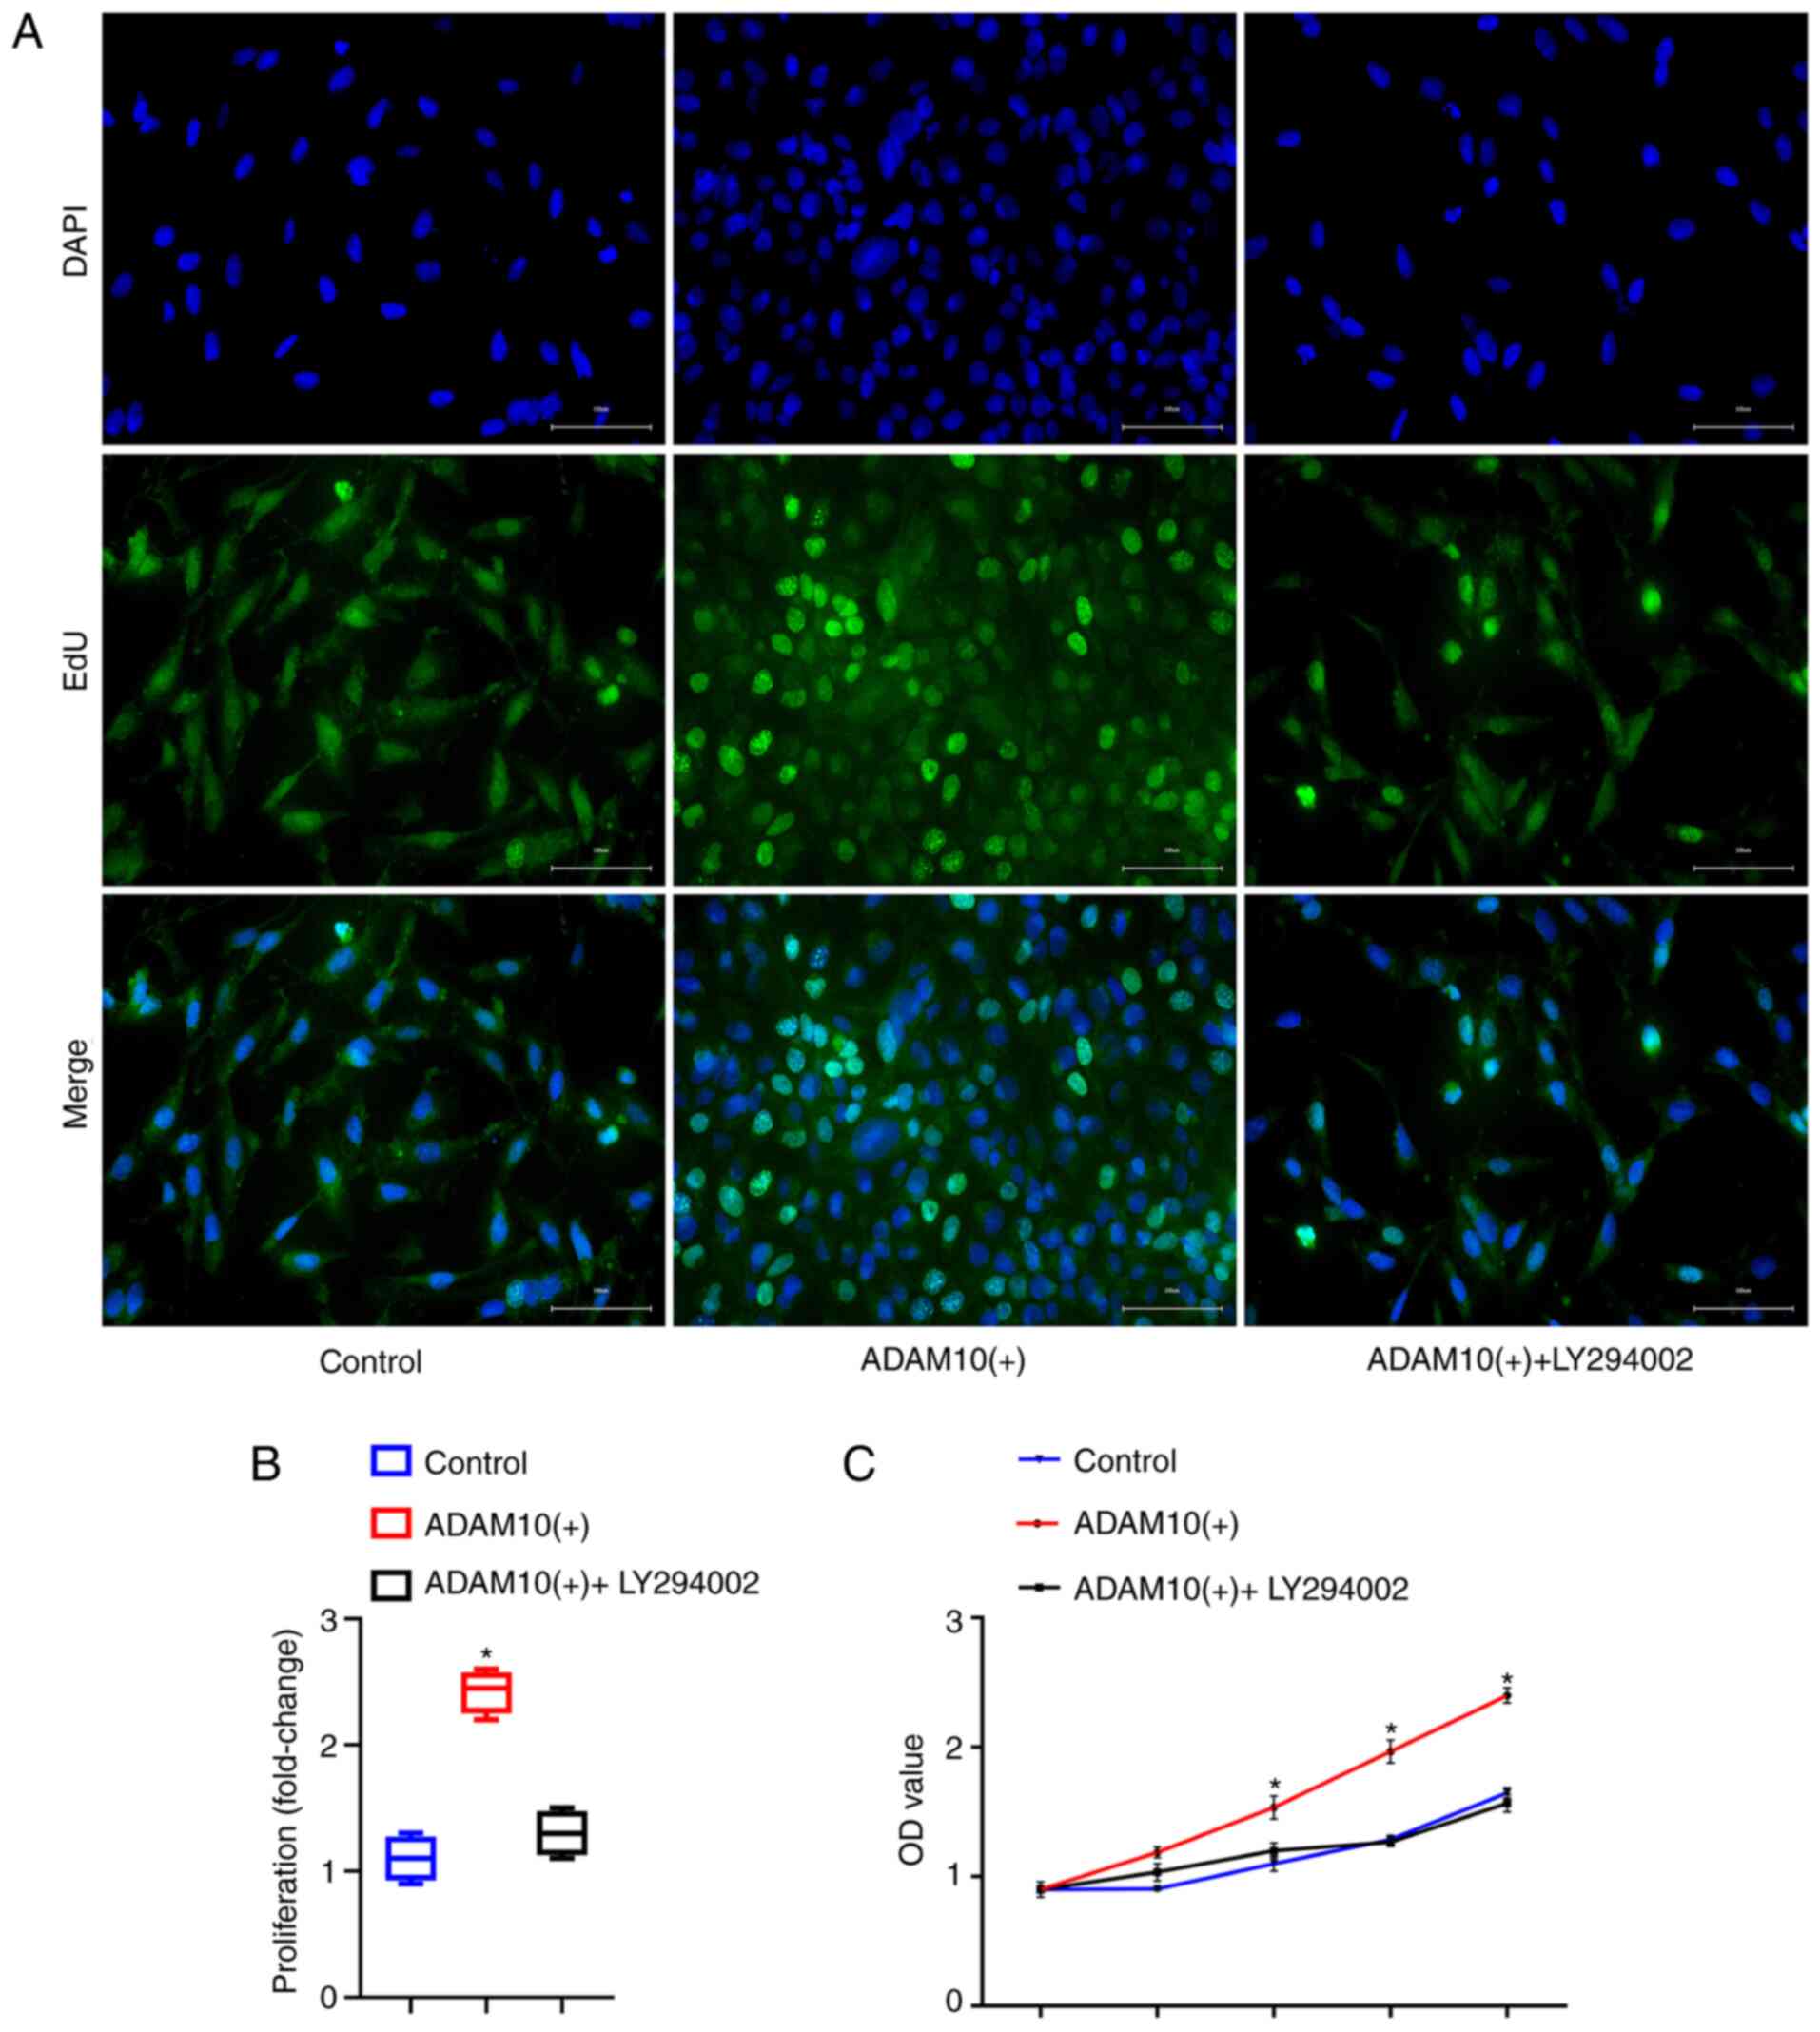
To further explore the role of the ADAM10 gene in
LFH, EdU (Fig. 8A and B) and
CCK-8 assays (Fig. 8C) were
performed to detect the proliferation of the cells in the three
groups. In addition, to better verify the role of the PI3K/AKT
pathway, we added a pathway inhibitor LY294002 to ADAM10(+) cells
and observed the effects on cell proliferation. The results
revealed that the ADAM10(+) cells exhibited significantly a greater
proliferation than the cells in the control and ADAM10(+) +
LY294002 group (P<0.05). Moreover, cell proliferation did not
differ between the control and ADAM10(+) + LY294002 groups
(P>0.05). Therefore, it was concluded that ADAM10 promotes the
proliferation of LF cells, which leads to hyper-trophy of the LF by
activating the PI3K/AKT pathway.
Discussion
Although LF cells are one main factors involved in
the pathogenesis of LFH, the cellular mechanisms are not yet
completely understood. Therefore, the present study explored the
crucial genes and pathways associated with LFH using bioinformatics
methods. By comparing the gene expression profiles between 4 LFH
tissues and the corresponding non-hypertrophic tissues, 2,123
commonly altered DEGs (1,384 upregulated and 739 downregulated)
were identified in LFH tissues.
Furthermore, to better understand the interactions
of the identified DEGs, GO functional enrichment and KEGG pathway
analyses were performed. The GO analysis revealed that the 2,123
DEGs were mainly associated with the collagen in the ECM, collagen
trimer and integrin binding categories. Previous studies have
demonstrated that LF fibrosis is characterized by a progressive
increase in the presence of collagen in the ECM (28,29). During hypertrophy, the composition
of this ECM component is altered and elastic fibers become
increasingly fragmented and disordered, and are eventually reduced
in number by the overreplacement of collagenous tissue, a process
referred to as 'collagen/elastin conversion' (30,31). Fibrosis leads to excessive
fibroblast ECM deposition and tissue remodeling, resulting in a
partial loss of tissue structure and organ function. Some studies
have suggested that this pathological protein accumulation is due
to the excessive recruitment of and increases in the number of
fibroblasts (32-34).
KEGG pathway enrichment analysis revealed that the
identified DEGs were mainly associated with ECM-receptor
interactions, protein digestion and absorption, cytokine-cytokine
receptor interactions, the PI3K/AKT signaling pathway and focal
adhesion. Among these pathways, the PI3K/AKT pathway is of
particular importance for cell membrane receptor signaling. After
specific ligands are bound to the cell membrane, signals are
transmitted through a cascade of AKT, JNK and Ras, which affects
cell proliferation, migration and apoptosis (35). Following PI3K activation, AKT can
activate certain cyclins and quiescent cells to accelerate cell
cycle progression, thus promoting cell proliferation (36,37). In the present study, the PI3K/AKT
pathway was highly associated with LFH tissue compared with normal
LF tissue. This result indicates that the PI3K/AKT pathway plays an
important role in the pathological development of LFH.
According to the centrality of the nodes in the PPI
network, crucial DEGs, including PENK, P4HB, FN1, FGA, QSOX1, IL6,
SERPINA1, ADAM10, TIMP1 and COL1A2 were identified. Among these
genes, PENK, P4HB, FN1, QSOX1, SERPINA1, ADAM10 and TIMP1 were
upregulated in LFH, while FGA, IL6 and COL1A2 were downregulated.
Inhibiting or promoting these genes may be a therapeutic strategy
for the treatment of LH. Among these genes, ADAM10 was upregulated;
the ADAM family is one of the major families of proteases that act
as sheddases, which play crucial roles in activating or inhibiting
some biomolecular processes (38,39). These proteases are characterized
by a modular domain structure consisting of an N-terminal signal
sequence followed by a pro-domain, a metalloprotease (catalytic)
domain, a dissociation domain, an epidermal growth factor-like
(cysteine-rich) domain, a single transmembrane domain and a
cytoplasmic fraction (40,41).
ADAM10 is involved in the shedding of a number of substrates that
are critical for cancer progression, neurological and vascular
diseases, degenerative diseases, and the morphogenesis and the
remodeling of some tissues (42-46). A recent study on pulmonary
fibrosis revealed that ADAM10 is the major metalloproteinase in
human lung fibroblasts and increases in its expression can continue
to activate fibroblast proliferation and muscle formation to
promote organ fibrosis (47).
Research into epithelial tissues has found that ADAM10 plays
important roles in cell development, cell detachment, cell
proliferation and cell survival during development and under
pathological conditions (25). In
addition, ADAM10 is closely related to the PI3K/AKT pathway.
Moreover, studies have demonstrated that ADAM10 can promote cell
proliferation by activating this pathway (26,27,48).
The present study puts forth a number of important
insights. First, microarray and bioinformatics analyses were
applied to analyze whole transcriptome changes between normal LF
and LFH tissue, and the genetic mechanisms underlying LFH was
thoroughly and accurately analyzed. Second, the present study
combined bioinformatics methods and molecular biology experiments
to examine the molecular mechanisms of LFH, which not only reduced
the false-positive rate of bioinformatics methods, but also
compensated for the limitations of molecular biology experiments.
Third, the present study provides a new direction for future
research on the mechanisms of LFH and provides a novel approach for
the clinical treatment and prevention of diseases related to
LFH.
However, there is also a limitation tp the present
study. Datasets, such as the GEO database, The Cancer Genome Atlas
(TCGA) database, the ArrayExpress database and InSilicoDB were
searched. However, there are no data related to LFH apart from the
GEO database used in the current study. As a result, only 4 LFH
samples and 4 normal samples were included in the present cohort.
The authors aim to use more samples and perform further experiments
to confirm the results and conclusions obtained herein in future
studies.
In conclusion, the present study suggests that
ADAM10 promotes the proliferation of LF cells by activating the
PI3K/AKT pathway, which may be a pathogenic mechanism of LFH.
Funding
The present study was supported by grants from the
Youth Program of National Natural Science Foundation of China (no.
81801213), China Postdoctoral Science Foundation, No. 65 General
Fund (no. 2019M651967), Jiangsu Planned Projects for Postdoctoral
Research Funds (no. 2018K176C) and the China Postdoctoral start-up
fund (no. 2018107007).
Availability of data and materials
All data generated or analyzed during this study are
included in this published article.
Authors' contributions
FY and KG designed the present study. BP, TH and MC
performed the experiments. LJ, HF, ZQ and XL analyzed the data and
prepared the figures. BP and TH drafted the initial manuscript. BP
and TH reviewed and revised the manuscript. All authors read and
approved the manuscript and agree to be accountable for all aspects
of the research in ensuring that the accuracy or integrity of any
part of the work are appropriately investigated and resolved.
Ethics approval and consent to
participate
The study was approved by the Ethics Committee of
Xuzhou Medical University Affiliated Hospital and written consent
was obtained from all patients.
Patient consent for publication
Not applicable.
Competing interests
The authors declare that they have no competing
interests.
Acknowledgments
Not applicable.
References
|
1
|
Sakai Y, Ito S, Hida T, Ito K, Harada A
and Watanabe K: Clinical outcome of lumbar spinal stenosis based on
new classification according to hypertrophied ligamentum flavum. J
Orthop Sci. 22:27–33. 2017. View Article : Google Scholar
|
|
2
|
Delen E, Doğanlar O, Delen Ö, Doğanlar ZB
and Kılınçer C: The role of JAK-STAT signaling activation in
hypertrophied ligamentum flavum. World Neurosurg. 137:e506–e516.
2020. View Article : Google Scholar : PubMed/NCBI
|
|
3
|
Ciol MA, Deyo RA, Howell E and Kreif S: An
assessment of surgery for spinal stenosis: Time trends, geographic
variations, complications, and reoperations. J Am Geriatr Soc.
44:285–290. 1996. View Article : Google Scholar : PubMed/NCBI
|
|
4
|
Sun C, Liu X, Guan G and Zhang H:
Increased expression of WISP-1 (CCN4) contributes to fibrosis in
the hypertrophied lumber ligamentum flavum. Int J Clin Exp Pathol.
10:1356–1363. 2017.
|
|
5
|
Park JO, Lee BH, Kang YM, Kim TH, Yoon JY,
Kim H, Kwon UH, Lee KI, Lee HM and Moon SH: Inflammatory cytokines
induce fibrosis and ossification of human ligamentum flavum cells.
J Spinal Disord Tech. 26:E6–E12. 2013. View Article : Google Scholar
|
|
6
|
Hur JW, Bum-Joon K, Jin-Hyun P, Kim JH,
Park YK, Kwon TH and Moon HJ: The mechanism of ligamentum flavum
hypertrophy: Introducing angiogenesis as a critical link that
couples mechanical stress and hypertrophy. Neurosurgery.
77:281–282. 2015. View Article : Google Scholar
|
|
7
|
Kang YM, Suk KS, Lee BH, Kim HS, Lee KI,
Park SY, Lee HM and Moon SH: Herniated intervertebral disk induces
hypertrophy and ossification of ligamentum flavum. J Spinal Disord
Tech. 27:382–389. 2014. View Article : Google Scholar : PubMed/NCBI
|
|
8
|
Nakatani T, Marui T, Hitora T, Doita M,
Nishida K and Kurosaka M: Mechanical stretching force promotes
collagen synthesis by cultured cells from human ligamentum flavum
via transforming growth factor-beta1. J Orthop Res. 20:1380–1386.
2002. View Article : Google Scholar : PubMed/NCBI
|
|
9
|
Amudong A, Muheremu A and Abudourexiti T:
Hypertrophy of the ligamentum flavum and expression of transforming
growth factor beta. J Int Med Res. 45:2036–2041. 2017. View Article : Google Scholar : PubMed/NCBI
|
|
10
|
Sun C, Wang Z, Tian JW and Wang YH:
Leptin-Induced inflammation by activating IL-6 expression
contributes to the fibrosis and hypertrophy of ligamentum flavum in
lumbar spinal canal stenosis. Biosci Rep. 38:BSR201712142018.
View Article : Google Scholar : PubMed/NCBI
|
|
11
|
Sairyo K, Biyani A, Goel V, Leaman D,
Booth R Jr, Thomas J, Gehling D, Vishnubhotla L, Long R and
Ebraheim N: Pathomechanism of ligamentum flavum hypertrophy: A
multi-disciplinary investigation based on clinical, biomechanical,
histologic, and biologic assessments. Spine (Phila Pa 1976).
30:2649–2656. 2005. View Article : Google Scholar
|
|
12
|
Sairyo K, Biyani A, Goel VK, Leaman DW,
Booth R Jr, Thomas J, Ebraheim NA, Cowgill IA and Mohan SE: Lumbar
ligamentum flavum hypertrophy is due to accumulation of
inflammation-related scar tissue. Spine (Phila Pa 1976).
32:E340–E347. 2007. View Article : Google Scholar
|
|
13
|
Yücetaş SC and Çakir T: Decreased catalase
expression is associated with ligamentum flavum hypertrophy due to
lumbar spinal canal stenosis. Medicine (Baltimore). 98:e151922019.
View Article : Google Scholar
|
|
14
|
Chen J, Liu Z, Zhong G, Qian L, Li Z, Qiao
Z, Chen B and Wang H: Hypertrophy of ligamentum flavum in lumbar
spine stenosis is associated with increased miR-155 level. Dis
Markers. 2014:7865432014. View Article : Google Scholar : PubMed/NCBI
|
|
15
|
Diboun I, Wernisch L, Orengo CA and
Koltzenburg M: Microarray analysis after RNA amplification can
detect pronounced differences in gene expression using limma. BMC
Genomics. 7:2522006. View Article : Google Scholar : PubMed/NCBI
|
|
16
|
Irizarry RA, Hobbs B, Collin F,
Beazer-Barclay YD, Antonellis KJ, Scherf U and Speed TP:
Exploration, normalization, and summaries of high density
oligonucleotide array probe level data. Biostatistics. 4:249–264.
2003. View Article : Google Scholar : PubMed/NCBI
|
|
17
|
Yu G, Wang LG, Han Y and He QY:
ClusterProfiler: An R package for comparing biological themes among
gene clusters. Omics. 16:284–287. 2012. View Article : Google Scholar : PubMed/NCBI
|
|
18
|
Shannon P, Markiel A, Ozier O, Baliga NS,
Wang JT, Ramage D, Amin N, Schwikowski B and Ideker T: Cytoscape: A
software environment for integrated models of biomolecular
interaction networks. Genome Res. 13:2498–2504. 2003. View Article : Google Scholar : PubMed/NCBI
|
|
19
|
Tang Y, Li M, Wang J, Pan Y and Wu FX:
CytoNCA: A cyto-scape plugin for centrality analysis and evaluation
of protein interaction networks. Biosystems. 127:67–72. 2015.
View Article : Google Scholar
|
|
20
|
Specchia N, Pagnotta A, Gigante A,
Logroscino G and Toesca A: Characterization of cultured human
ligamentum flavum cells in lumbar spine stenosis. J Orthop Res.
19:294–300. 2001. View Article : Google Scholar : PubMed/NCBI
|
|
21
|
Yan B, Huang M, Zeng C, Yao N, Zhang J,
Yan B, Jiang H, Tian X, Ao X, Zhao H, et al: Locally produced IGF-1
Promotes hypertrophy of the ligamentum flavum via the mTORC1
signaling pathway. Cell Physiol Biochem. 48:293–303. 2018.
View Article : Google Scholar : PubMed/NCBI
|
|
22
|
Livak KJ and Schmittgen TD: Analysis of
relative gene expression data using real-time quantitative PCR and
the 2(-Delta Delta C(T)) method. Methods. 25:402–408. 2001.
View Article : Google Scholar
|
|
23
|
Okada M, Oba Y and Yamawa H: Endostatin
stimulates proliferation and migration of adult rat cardiac
fibroblasts through PI3K/Akt pathway. Eur J Pharmacol. 750:20–26.
2015. View Article : Google Scholar : PubMed/NCBI
|
|
24
|
Feng X, Wu C, Yang M, Liu Q, Li H, Liu J,
Zhang Y, Hao Y, Kang L, Zhang Y and Liu S: Role of PI3K/Akt signal
pathway on proliferation of mesangial cell induced by HMGB1. Tissue
Cell. 48:121–125. 2016. View Article : Google Scholar : PubMed/NCBI
|
|
25
|
Maretzky T, Reiss K, Ludwig A, Buchholz J,
Scholz F, Proksch E, de Strooper B, Hartmann D and Saftig P: ADAM10
mediates E-cadherin shedding and regulates epithelial cell-cell
adhesion, migration, and beta-catenin translocation. Proc Natl Acad
Sci USA. 102:9182–9187. 2005. View Article : Google Scholar : PubMed/NCBI
|
|
26
|
Boccalini G, Sassoli C, Bani D and Nistri
S: Relaxin induces up-regulation of ADAM10 metalloprotease in
RXFP1-expressing cells by PI3K/AKT signaling. Mol Cell Endocrinol.
472:80–86. 2018. View Article : Google Scholar
|
|
27
|
Li D, Xiao Z, Wang G and Song X: Knockdown
of ADAM10 inhibits migration and invasion of fibroblast-like
synoviocytes in rheumatoid arthritis. Mol Med Rep. 12:5517–5523.
2015. View Article : Google Scholar : PubMed/NCBI
|
|
28
|
Zhang K, Sun W, Liu XY, Zhao CQ, Li H, Sun
XJ, You-Zhuan X, Ding W and Zhao J: Hypertrophy and fibrosis of the
ligamentum flavum in lumbar spinal stenosis is associated with
increased expression of LPA and LPAR1. Clin Spine Surg.
30:E189–E191. 2017. View Article : Google Scholar : PubMed/NCBI
|
|
29
|
Adair-Kirk TL and Senior RM: Fragments of
extracellular matrix as mediators of inflammation. Int J Biochem
Cell Biol. 40:1101–1110. 2008. View Article : Google Scholar : PubMed/NCBI
|
|
30
|
Yoshida M, Shima K, Taniguchi Y, Tamaki T
and Tanaka T: Hypertrophied ligamentum flavum in lumbar spinal
canal stenosis. Pathogenesis and morphologic and
immunohistochemical observation. Spine. 17:1353–1360. 1992.
View Article : Google Scholar : PubMed/NCBI
|
|
31
|
Kosaka H, Sairyo K, Biyani A, Leaman D,
Yeasting R, Higashino K, Sakai T, Katoh S, Sano T, Goel VK and
Yasui N: Pathomechanism of loss of elasticity and hypertrophy of
lumbar ligamentum flavum in elderly patients with lumbar spinal
canal stenosis. Spine (Phila Pa 1976). 32:2805–2811. 2007.
View Article : Google Scholar
|
|
32
|
Chambers RC and Mercer PF: Mechanisms of
alveolar epithelial injury, repair, and fibrosis. Ann Am Thorac
Soc. 12(Suppl 1): S16–S20. 2015. View Article : Google Scholar : PubMed/NCBI
|
|
33
|
Duffield JS: Cellular and molecular
mechanisms in kidney fibrosis. J Clin Invest. 124:2299–2306. 2014.
View Article : Google Scholar : PubMed/NCBI
|
|
34
|
Park JB, Lee JK, Park SJ and Riew KD:
Hypertrophy of ligamentum flavum in lumbar spinal stenosis
associated with increased proteinase inhibitor concentration. J
Bone Joint Surg Am. 87:2750–2757. 2005. View Article : Google Scholar : PubMed/NCBI
|
|
35
|
Matsuoka T and Yashiro M: The role of
PI3K/Akt/mTOR signaling in gastric carcinoma. Cancers (Basel).
6:1441–1463. 2014. View Article : Google Scholar
|
|
36
|
Lin Z, Zhou P, von Gise A, Gu F, Ma Q,
Chen J, Guo H, van Gorp PR, Wang DZ and Pu WT: Pi3kcb links
hippo-YAP and PI3K-AKT signaling pathways to promote cardiomyocyte
proliferation and survival. Circ Res. 116:35–45. 2015. View Article : Google Scholar :
|
|
37
|
Meng F, Wang F, Wang L, Wong S, Cho WC and
Chan LW: MiR-30a-5p overexpression may overcome EGFR-inhibitor
resistance through regulating PI3K/AKT signaling pathway in
non-small cell lung cancer cell lines. Front Genet. 7:1972016.
View Article : Google Scholar : PubMed/NCBI
|
|
38
|
Edwards DR, Handsley MM and Pennington CJ:
The ADAM metalloproteinases. Mol Aspects Med. 29:258–289. 2008.
View Article : Google Scholar : PubMed/NCBI
|
|
39
|
Pham DH, Kim JS, Kim SK, Shin DJ, Uong NT,
Hyun H, Yoon MS, Kang SJ, Ryu YJ, Cho JS, et al: Effects of ADAM10
and ADAM17 inhibitors on natural killer cell expansion and
antibody-dependent cellular cytotoxicity against breast cancer
cells in vitro. Anticancer Res. 37:5507–5513. 2017.PubMed/NCBI
|
|
40
|
Klein T and Bischoff R: Active
metalloproteases of the A disintegrin and metalloprotease (ADAM)
family: Biological function and structure. J Proteome Res.
10:17–33. 2011. View Article : Google Scholar
|
|
41
|
Scheller J, Chalaris A, Garbers C and
Rose-John S: ADAM17: A molecular switch to control inflammation and
tissue regeneration. Trends Immunol. 32:380–387. 2011. View Article : Google Scholar : PubMed/NCBI
|
|
42
|
Bae WY, Park SK, Kim DH, Koh TK, Hur DY
and Chueh HW: Expression of ADAM17 and ADAM10 in nasal polyps. Int
Forum Allergy Rhinol. 6:731–736. 2016. View Article : Google Scholar : PubMed/NCBI
|
|
43
|
Matthews AL, Noy PJ, Reyat JS and
Tomlinson MG: Regulation of A disintegrin and metalloproteinase
(ADAM) family sheddases ADAM10 and ADAM17: The emerging role of
tetraspanins and rhomboids. Platelets. 28:333–341. 2017. View Article : Google Scholar :
|
|
44
|
Pruessmeyer J and Ludwig A: The good, the
bad and the ugly substrates for ADAM10 and ADAM17 in brain
pathology, inflammation and cancer. Semin Cell Dev Biol.
20:164–174. 2009. View Article : Google Scholar
|
|
45
|
Chueh HW, Park SK, Hur DY and Bae WY:
Expression profile of ADAM10 and ADAM17 in allergic rhinitis. Int
Forum Allergy Rhinol. 5:1036–1041. 2015. View Article : Google Scholar : PubMed/NCBI
|
|
46
|
Huang WH, Chen W, Jiang LY, Yang YX, Yao
LF and Li KS: Influence of ADAM10 polymorphisms on plasma level of
soluble receptor for advanced glycation end products and the
association with alzheimer's disease risk. Front Genet. 9:5402018.
View Article : Google Scholar : PubMed/NCBI
|
|
47
|
Lagares D, Ghassemi-Kakroodi P, Tremblay
C, Santos A, Probst CK, Franklin A, Santos DM, Grasberger P,
Ahluwalia N, Montesi SB, et al: ADAM10-Mediated ephrin-B2 shedding
promotes myofibroblast activation and organ fibrosis. Nat Med.
23:1405–1415. 2017. View Article : Google Scholar : PubMed/NCBI
|
|
48
|
Liu S, Zhang W, Liu K, Ji B and Wang G:
Silencing ADAM10 inhibits the in vitro and in vivo growth of
hepatocellular carcinoma cancer cells. Mol Med Rep. 11:597–602.
2015. View Article : Google Scholar
|