Introduction
Gliomas, which represent ~70% of all brain tumors,
are the most malignant and common tumors in the human brain
(1) Currently, a combination of
chemotherapy and radiation following maximal safe surgical
resection is the standard treatment for newly diagnosed patients
with glioma (2,3) However, despite these treatments,
the overall survival rate of patients with glioma continues to be
among the lowest of all the main types of cancer (4) Thus, it is important to understand
the molecular mechanism of its pathogenesis to develop effective
therapeutic strategies for glioma
MicroRNAs (miRNAs/miRs) can bind to the
3′-untranslated region (UTR) of target mRNAs and induce
translational suppression, mRNA destabilization or cleavage to
perform post-transcriptional regulation of gene expression
(5-9) Increasing evidence has indicated
that miRNAs, as small non-coding single-stranded RNA molecules, are
critical in the tumorigenesis and development of different types of
cancer, including gliomas (10-13) Among them, downregulated miR-218
expression has been reported in gliomas, but not in normal brain
tissues (14-16), which is closely associated with
poor overall survival and disease-free survival in patients with
glioma (17,18) Notably, miR-218 contains miR-218-1
and miR-218-2, located on chromosome 4p1531 and 5q351,
respectively, which have different 3p sequences, but the same 5p
sequences as miR-218-5p (19)
However, the role of miR-218 in glioma remains unclear
The present study identified tenascin C (TNC) as a
novel target of miR-218, which is a major constituent of the
extracellular matrix in the developing brain, and can be
re-expressed in wound healing, inflammation and tumors (20-23) TNC expression is upregulated in
gliomas, and is significantly associated with poor patient survival
and malignant progression (24)
It has been reported that TNC may be a promising therapeutic target
for glioma (25) miR-218 was
confirmed as a potential tumor suppressor in glioma by blocking the
TNC/AKT/activator protein-1 (AP-1)/transforming growth factor β1
(TGFβ1)-positive feedback loop via a series of in vitro and
in vivo experiments
Materials and methods
The Cancer Genome Atlas (TCGA)
analysis
The miRNAs and TNC expression profiles of
TGCA-low-grade glioma (LGG) dataset and the clinical information
were obtained from TCGA database (https://portal.gdc.cancer.gov/) (26) A total of 5 normal brain tissues
and 526 LGG tissues from the TCGA database were obtained Patients
without clinical information, including age, sex, TNM stage,
histological grades, survival, and without miR-218-1, miR-218-2 and
TNC expression data were excluded An unpaired Student's t-test was
used to compare gene expression in two groups of tissues Survival
analysis was performed using the Kaplan-Meier method and log-rank
test The association between TNC expression and miR-218s expression
was analyzed via linear regression
Reverse transcription-quantitative
(RT-q)PCR
TRIzol reagent (Takara Biotechnology Co, Ltd) was
used to extract total RNA from cell lines and tissues following the
manufacturer's protocol The cDNA was synthesized with 500 ng total
RNA using PrimeScript RT reagent kit (Takara Biotechnology Co, Ltd)
according to the manufacturer's instructions qPCR was carried out
on a CFX96 Thermal Cycler Dice™ real-time PCR system (Bio-Rad
Laboratories, Inc) using SYBR Premix Ex Taq™ (Takara Biotechnology
Co, Ltd), as previously described (27) The amplification conditions were
as follows: Stage 1 (holding 95°C for 10 min); stage 2 (40 cycles
of denaturing at 95°C for 15 sec, annealing at 60°C for 45 sec and
extending at 72°C for 30 sec); stage 3 (extension at 72°C for 7
min) The relative expression levels were calculated using the
2−ΔΔCq method (28)
RT-qPCR analysis was performed using the primer sequences listed in
Table SI Relative expression
levels were normalized to 18S rRNA cDNA The gene-specific RT
primer sequences listed in Table
SII were synthesized to reverse transcribe the indicated miRNAs
into cDNA The primer sequences for miRNAs are listed in Table SIII, and expression levels were
normalized to the internal reference gene U6 All experiments were
performed in triplicate
Cell culture
The human glioma cell lines, U251 and SHG44, were
purchased from the Laboratory Animal Center of Sun Yat-sen
University (Guangzhou, China) Cells were maintained in DMEM
(Invitrogen; Thermo Fisher Scientific, Inc) supplemented with 10%
FBS (Biological Industries), 100 IU/ml penicillin and 100
µg/ml streptomycin, at 37°C in a humidified atmosphere with
5% CO2 All cell lines used in this study were
authenticated by short tandem repeat (STR) analysis using the Cell
ID System (Promega Corporation) in March 2019 with maximum 20
passages before the cells were analyzed Meanwhile, the one-step
Quickcolor Mycoplasma Detection kit (Shanghai Yise Medical
Technology Co, Ltd; http://www.yisemedcom) was used according to the
manufacturer's instructions, to demonstrate that these cell lines
were not contaminated by mycoplasma In some experiments, cells were
treated with recombinant human TGFβ1 proteins (10 ng/ml; Sino
Biological, Inc) for 24 h The control group had the same volume of
a vehicle
Mimics and lentivirus transfection
miR-218 mimics (sense: 5′-UUG UGC UUG AUC UAA CCA
UGU-3′) and negative control (NC) mimics (sense: 5′-UUU GUA CUA CAC
AAA AGU ACU G-3′) (Guangzhou RiboBio, Co, Ltd) (25 nM) were
transfected into a total of 1×10⁵ cells using
Lipofectamine® 3000 (Invitrogen; Thermo Fisher
Scientific, Inc) (at 37°C for 24 h), according to the
manufacturer's protocols, in three replicates Subsequent
experimentation were performed following 48 h of transfection
A lentivirus encoding miR-218 (Ubi-MVC-SV40-
EGFP-IRES-Puro-miR-218) and control lentivirus
(Ubi-MVC-SV40-EGFP-IRES-Puro) were purchased from Shanghai GeneChem
Co, Ltd [obtained from 293T cells (purchased from Cell Bank of
Chinese Academy of Sciences; cat no GNHu17) by transient
transfection of lentivirus construct (20 µg) as well as
helper plasmids pHelper 10 (15 µg) and pHelper 20 (10
µg)] The lentiviruses were transfected into a total of
1×10⁵ U251 cells, with 20-100 final lentivirus
multiplicity of infection at 50% confluence, in the presence of 8
µg/ml polybrene (at 37°C for 24 h), and replaced with fresh
medium after 24 h Following 72 h of infection, the fluorescence
expression was observed by fluorescence microscope at a
magnification of ×100 Then the cells were selected using puromycin
(2 µg/ml) to establish stable cell lines These lentiviruses
were only used in the nude mice tumorigenesis experiment
MTT assay
After 48 h of transfection, cell numbers were
counted with a hemocytometer A total of 5,000 cells/well were then
seeded into per 96-well plates Following incubation for 0, 1, 3, 5
and 7 days, cells were incubated with
3-(4,5-dimethylthiazol-2-yl)-2, 5-diphenylte tetrazolium bromide
(MTT; 200 µl/well Sigma Aldrich; Merck KGaA) for 4 h at 37°C
Subsequently, 150 µl of dimethyl sulfoxide was supplemented
to each well and mixed for 15 min The absorbance of each well was
determined with an ultraviolet spectrophotometer at 490 nm
Soft agar colony formation assay
A bottom layer of 2 ml DMEM supplemented with 07%
agar and 10% FBS and a top layer of 1 ml DMEM supplemented with
035% agar and 10% FBS were added in 6-well plates, which contained
3,000 cells/well and were then incubated for 2-3 weeks at 37°C
Subsequently, with a diameter ≥200 µm, the total number and
sizes of colonies were calculated using a light microscope (Olympus
Corporation) in >5 fields per well for a total of 15 fields in
triplicate experiments
Cell cycle assay
After 48 h of transfection, a total of
1×10⁵cells/well were then seeded into 6-well plates
Cells, which were maintained in DMEM without FBS for 24 h to induce
cell cycle synchronization, and then maintained in DMEM
supplemented with 10% FBS for another 24 h, were digested After
centrifugation at 500 × g for 3 min at 4°C, the cells was washed
once with PBS, and stored in cold 70% ethanol at -20°C overnight
after washed with 4°C PBS Subsequently, the cells were stained with
500 µl PBS supplemented propidium iodide (PI) (50
µg/ml) and RNase A (100 U/ml) (at 4°C for 30 min) and
detected by flow cytometry (FACScan; BD Biosciences) for cell cycle
analysis using the FlowJo software (v105; Tree Star, Inc)
Apoptotic cell assay
After 48 h of transfection, a total of
5×10⁶ cells/well were digested, incubated with 5
µl FITC-Annexin buffer and stained with 5 µl PI at
room temperature for 10 min, using an Annexin V-Fluorescein
isothiocyanate (FITC) Apoptosis Detection kit I (BD Biosciences),
according to the manufacturer's instructions, and detected by flow
cytometry (FACScan; BD Biosciences) for apoptotic cell assays using
the FlowJo software (v105; Tree Star, Inc)
Transwell assays
Transwell chambers (80-µm pore size; Corning
Life Sciences) coated with Matrigel (incubated at 37°C for 4-5 h to
make it dry and gelatinous) (BD Biosciences) or not coated by
Matrigel, on the upper chamber were used to assess cell invasion
and migration abilities, respectively After 48 h of transfection,
5×10⁴ cells were seeded to the upper chamber, which
contained 200 µl serum-free medium (DMEM) The bottom chamber
was filled with 1 ml of medium containing 10% FBS After incubation
for 48 h at 37°C, the number of cells in the bottom chamber were
determined by 1% crystal violet staining (at room temperature for
30 min) and quantified using an inverted light microscope (Olympus
Corporation) in 10 random fields All assays were performed as
previously described (27) All
experiments were performed in triplicate
Western blot analysis
Cells were lysed in prechilled RIPA buffer (Cell
Signaling Technology, Inc) containing protease inhibitors The
protein concentration was determined using A280 absorbance
measurements by NanoDrop2000 Ultra Micro Spectrophotometer (Thermo
Fisher Scientific, Inc) Equal amounts (100 µg per lane) of
protein lysates were separated by 10% SDS-PAGE and transferred to
PVDF membranes (Roche Diagnostics GmbH), and then blocked with 10%
skimmed milk at 37°C for 2 h Next, the membranes were incubated
with the indicated primary antibodies (Table SIV) (TNC, 1:500; phospho-Akt
Ser473, 1:1,000; phospho-Akt Thr308, 1:1,000; total AKT, 1:1,000;
phospho-JNK, 1:500; total JNK, 1:1,000; JUN 1:1,000; FOS, 1:1,000;
TGFβ1, 1:1,000; β-actin, 1:2,000) at 4°C overnight After incubation
of the membranes with species-specific HRP-conjugated secondary
antibodies, goat anti-rabbit antibody (1:3,000; cat no TA130023;
OriGene Technologies, Inc) or goat anti-mouse antibody (1:3,000;
TA130004; OriGene Technologies, Inc), for 2 h at 37°C, the Western
Bright ECL detection system (Advansta, Inc) was used to visualize
the immunoblotting signals
Prediction of miRNA target genes
miR-218-5p-targeted genes were predicted with
different bioinformatic algorithms from various databases,
including miRanda (http://www.microrna.org/microrna/homedo), TargetScan
30 (http://www.targetscan.org/) and miRDB
(http://mirdb.org/) The overlapping genes were
analyzed
Dual-luciferase reporter assay
The wild-type (WT) TNC 3′-UTR was amplified from
cDNA of U251 cells to construct the luciferase reporter plasmids
The TNC 3′-UTR with mutant (MUT) binding site of miR-218 was
synthesized by Sangon Biotech Co, Ltd These two fragments were
inserted into pre-digested pmirGLO luciferase vector (gifted by Dr
Yanke Chen at Xi'an Jiaotong University Health Science Center) to
produce the luciferase reporter plasmids, pmirGLO-TNC 3′-UTR-WT and
pmirGLO-TNC 3′-UTR-MUT The primer sequences for plasmid constructs
are listed in Table SV The 3×AP
in pGL3-Basic luciferase reporter plasmid was purchased from
Addgene, Inc (plasmid no 40342), which contains three canonical
AP-1 binding sites (TGACTCA) upstream of the luciferase reporter
plasmid pGL3-Basic promoter fragment
To assess the 3′-UTR activity of TNC mRNA modulated
by miR-218, U251 and SHG44 cells were transfected with NC or
miR-218-mimics in 6-well plates and subsequently co-transfected
with pmirGLO-TNC 3′-UTR-WT or pmirGLO-TNC 3′-UTR-MUT, using
Lipofectamine® 3000 (Invitrogen; Thermo Fisher
Scientific, Inc) To determine transcriptional activity of AP-1
regulated by miR-218 or TGFβ1, U251 and SHG44 cells were treated
with TGFβ1 (10 ng/ml; at 37°C for 24 h) or transfected with
NC/miR-218-mimics, and were subsequently co-transfected with pRL-TK
plasmids and the 3×AP in pGL3-Basic luciferase reporter plasmid
Following incubation for 36 h, luciferase activities were detected
using a dual-luciferase reporter assay system (Promega Corporation)
on an EnSpire Multimode Plate Reader (PerkinElmer, Inc) Firefly
luciferase activity was normalized to Renilla luciferase
activity All experiments were performed in triplicate
Animal studies
A total of 10 male athymic mice (3-4 weeks-old;
weight 1782±309 g) were obtained from Shanghai SLAC Laboratory
Animal Co, Ltd A total of 5 mice were housed in a cage with a
controlled temperature (22±2°C) and humidity (55±5%), maintained on
a 12-h light/dark cycle, and were given free access to water and
food The mice (5-6 weeks-old) were subcutaneously inoculated into
the root region of the right hind leg with 6×10⁶ U251
cells (suspended in PBS) overexpressed with miR-218 or control
cells to establish tumor xenografts From day 3 post-injection, the
formula, width2 × length × 05, was used to calculate
tumor volumes every 2 days After 13 days, the mice were sacrificed
via cervical dislocation and tumors were harvested according to the
National Institutes of Health (NIH) Guidelines The maximum tumor
size was 2273 mm3 All animal experiments were approved
by The Laboratory Animal Center of Xi'an Jiaotong University
(Xi'an, China)
Immunohistochemistry (IHC)
IHC analysis was performed as previously described
(29) to detect Ki67 expression
in the xenograft tumors, which were fixed in 4% paraformaldehyde at
room temperature for 72 h Briefly, after dewaxing in xylene and
rehydrating in a gradient concentration of ethanol, the
paraffin-embedded tissue slides (with a thickness of 5 µm)
were incubated in 03% hydrogen peroxide in distilled water at room
temperature for 10 min to block endogenous peroxidase activity,
then treated with an antigen retrieval method by heating, and were
then incubated with mouse anti-Ki67 antibody (1:200; cat no 556003;
BD Biosciences) overnight at 4°C Subsequently, the slides were
incubated with biotinylated goat anti-mouse IgG (1:3,000; cat no
TA130009; OriGene Technologies, Inc) at 37°C for 1 h
Immunodetection was performed with the Streptavidin-Peroxidase
system (ZSGB-BIO; OriGene Technologies, Inc) according to the
manufacturer's protocol After washing, diaminobenzidine and
hematoxylin were respectively added at room temperature for ~20 sec
to detect immunoreactive proteins Ki67 protein expression was
scored using a light microscope (magnification, ×400; Olympus
Corporation) in 5 random fields, in double-blinded way (ie, without
knowing the group of the case), and 0, 1, 2, 3 represents negative,
weak positive, positive and strong positive, respectively
Statistical analysis
Statistical analysis was performed using SPSS 115
software (SPSS, Inc) Continuous variables with normal distribution
were analyzed by independent t-test (expressed as the means ± SD) A
one-way analysis of variance (ANOVA) with Tukey's post hoc test was
performed to test for the statistical significance of each
quantified nuclear feature amongst the three groups in analyzing
the effect of TGFβ and miR-218 on AP-1 signaling activity P<005
was considered to indicate a statistically significant
difference
Results
miR-218 expression is frequently
downregulated in gliomas
To investigate miR-218 function in glioma
tumorigenesis, miR-218-1 and miR-218-2 expression was analyzed in
gliomas and normal brain tissues (control subjects) using a dataset
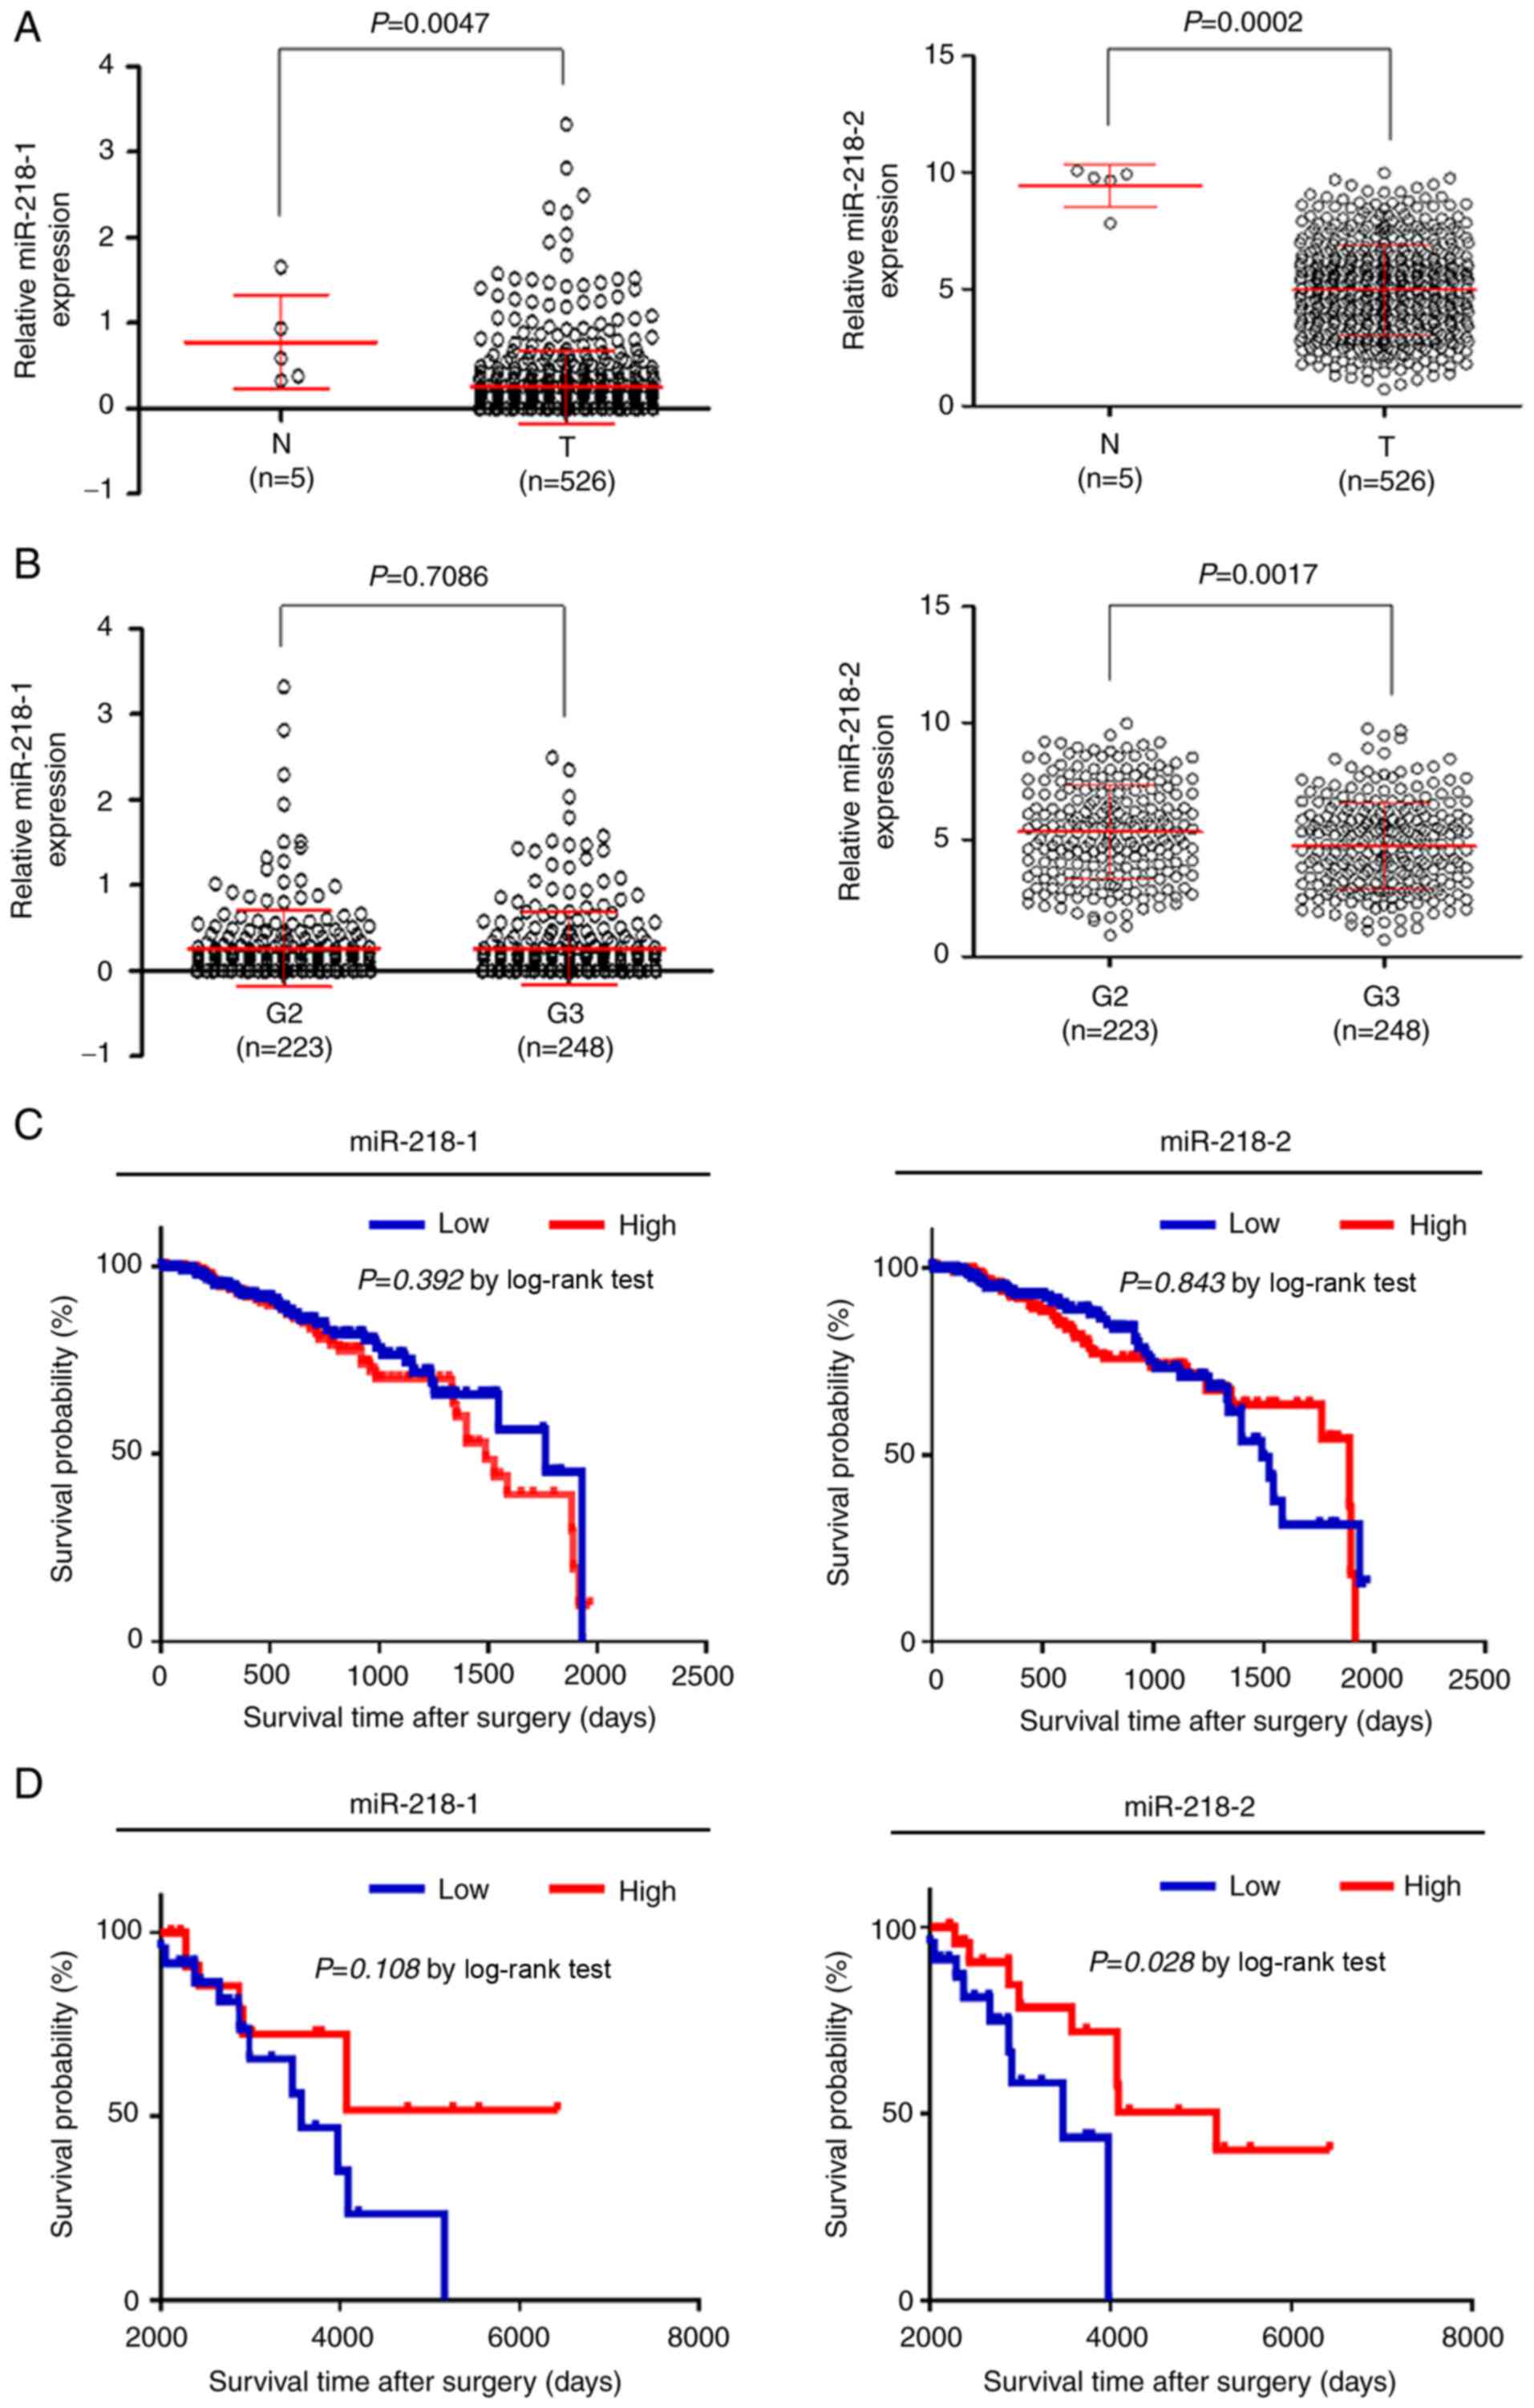
from TCGA As presented in Fig
1A, both miR-218-1 and miR-218-2 expression levels were
significantly downregulated in gliomas compared with the control
subjects In addition, miR-218-2 expression was significantly higher
than miR-218-1 expression in gliomas (499±195 vs 025±043;
P<0001), indicating that mature miR-218 in gliomas is mostly
constituted by miR-218-2, which was consistent with a previous
study in thyroid cancers (30)
miR-218-1 and miR-218-2 expression in gliomas was further analyzed
with different histological grades As revealed in Fig 1B (left panel), miR-218-1
expression levels were not significantly different between gliomas
with histological grade 2 (G2) and grade 3 (G3) (P=071) However,
the gliomas with histological G3 had significantly lower miR-218-2
expression than those with histological G2 (P=0002; Fig 1B, right panel)
A large cohort of gliomas in TCGA dataset was
analyzed via the Kaplan-Meier method As revealed in Fig 1C, the expression levels of
miR-218-1 and miR-218-2 did not affect the survival of patients
with glioma when their survival time was <2,000 days However,
miR-218-2 downregulation but not that of miR-218-1 was
significantly associated with poor patient survival when their
survival time was >2,000 days (Fig 1D) Collectively, these results
indicated that miR-218-2 may be a potential biomarker to predict
long-term survival of patients with glioma
miR-218 inhibits glioma cell
proliferation
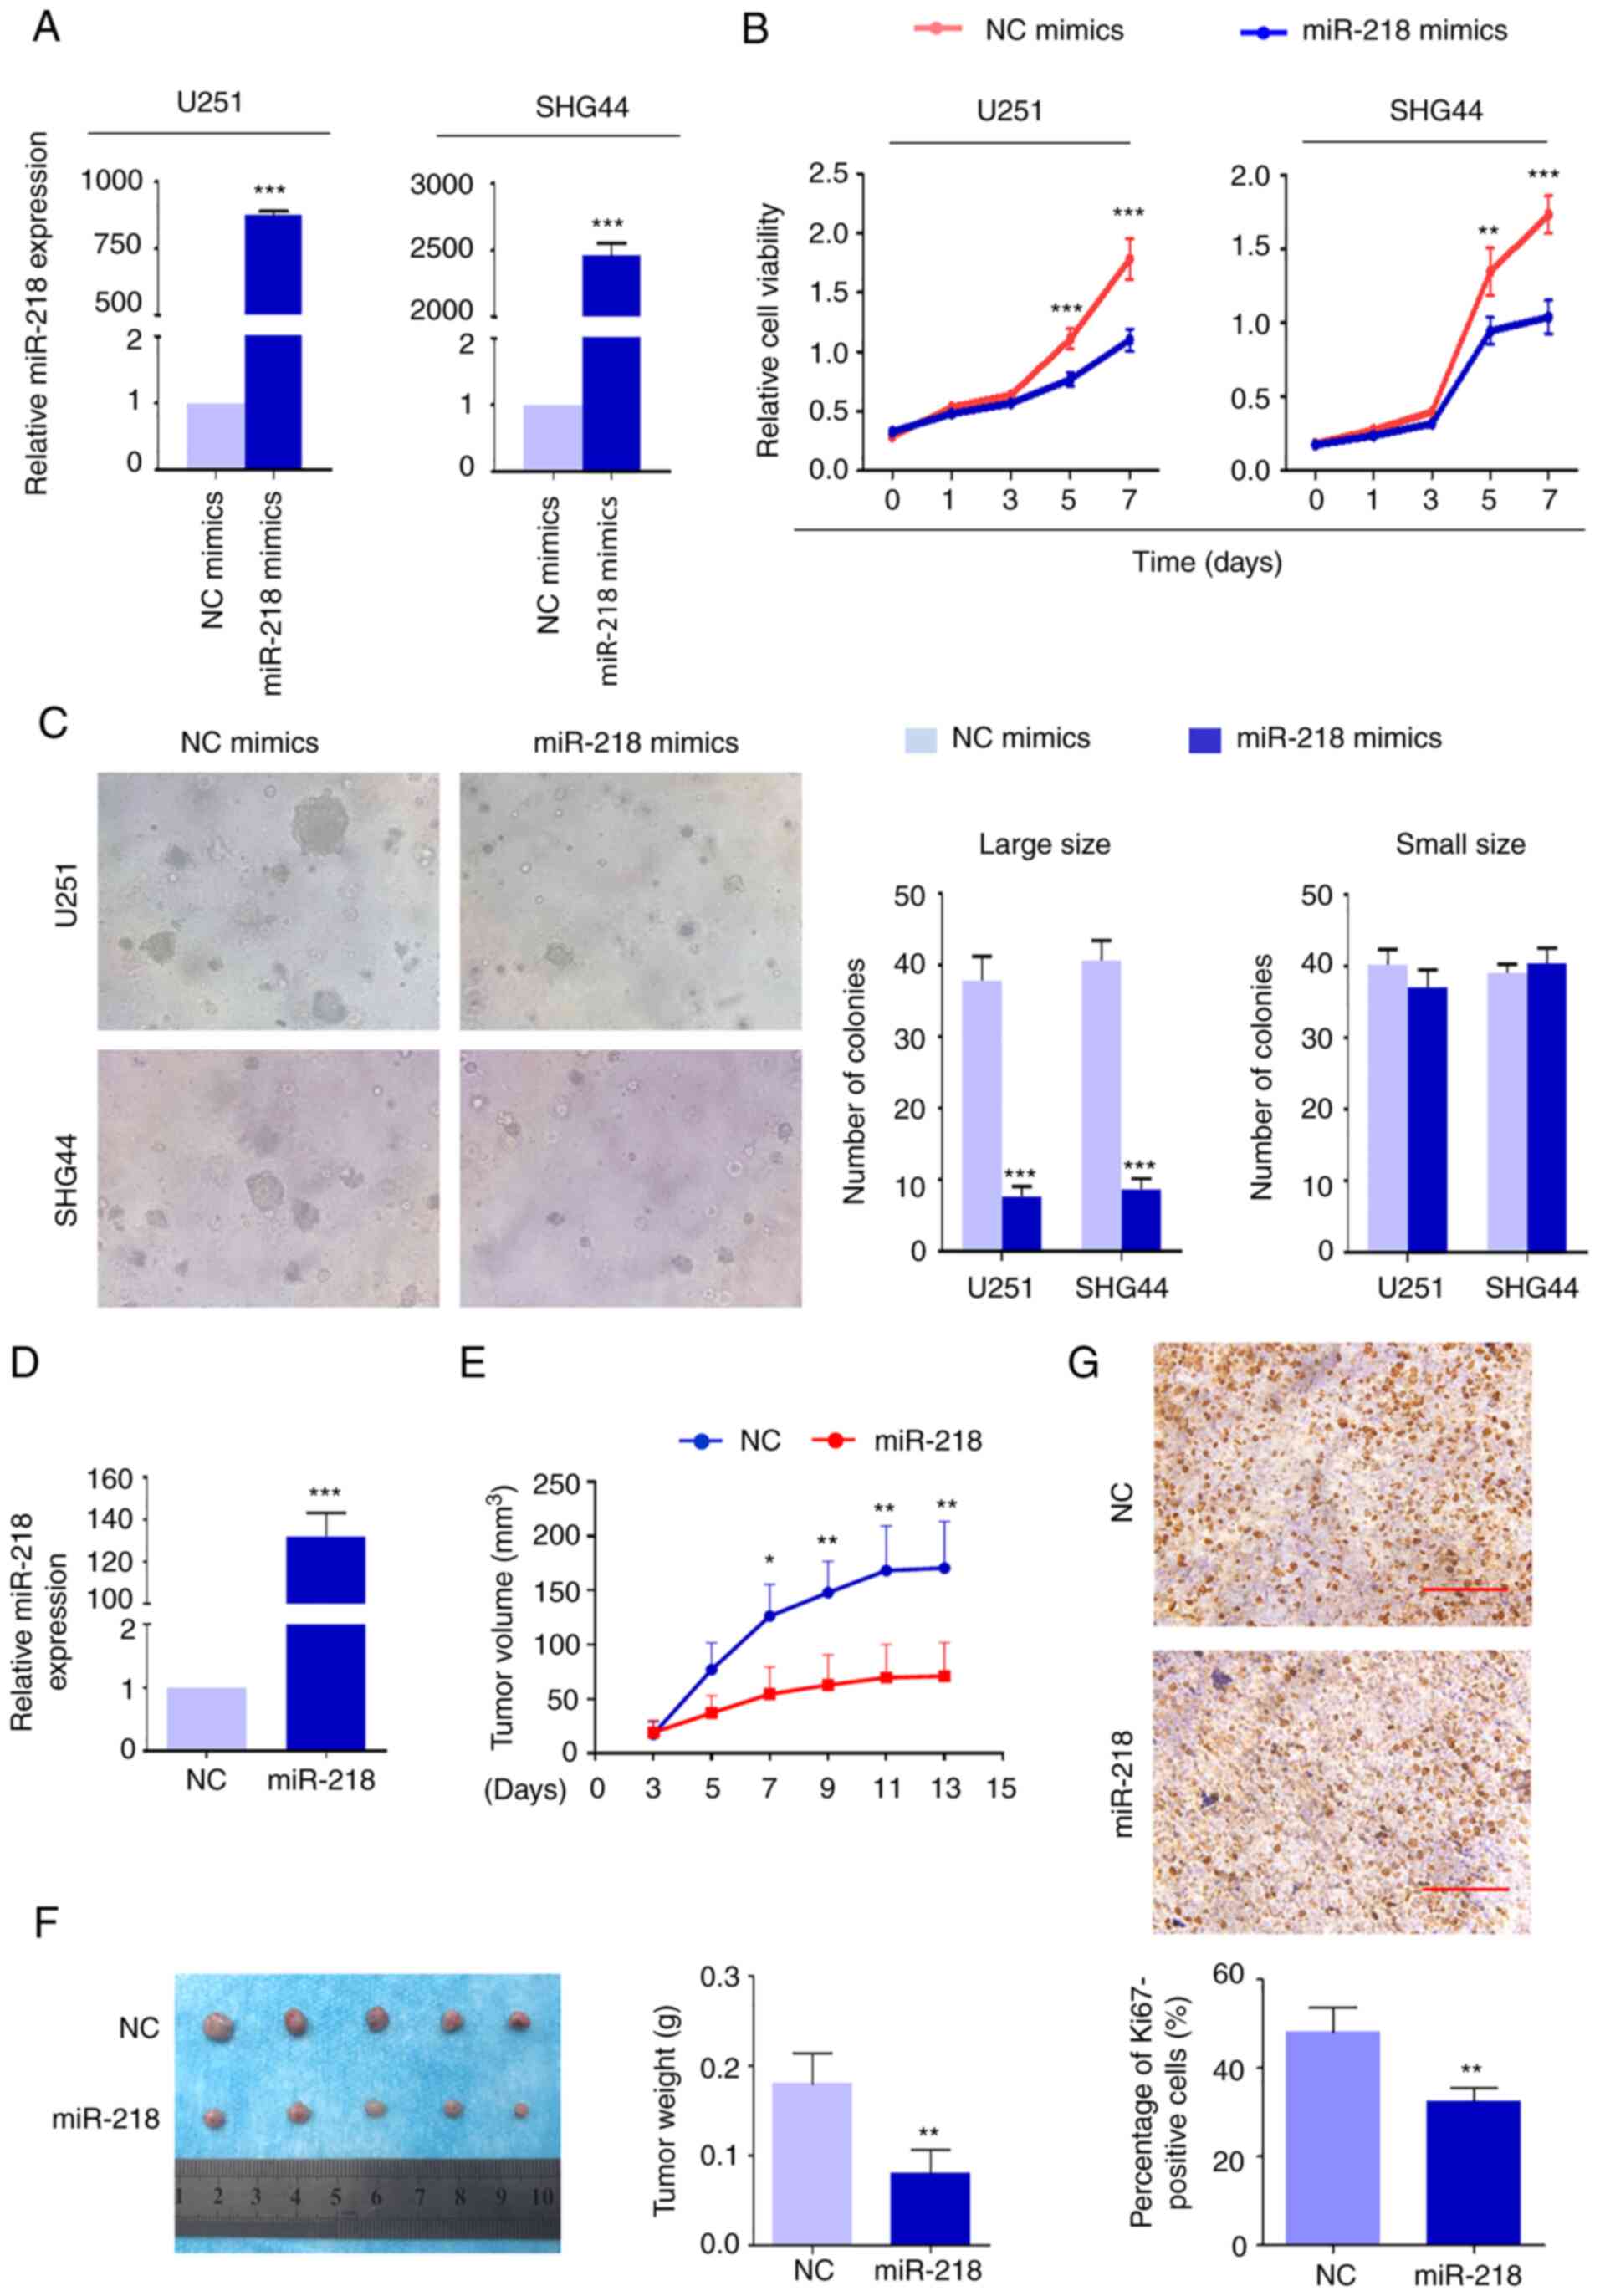
To determine the biological function of miR-218 in
glioma, a series of in vitro experiments with miR-218
gain-of-function in glioma cells were performed using miR-218
mimics and NC mimics (Fig 2A)
The results demonstrated that miR-218 mimics significantly
suppressed the proliferation of U251 and SHG44 cells compared with
the controls (Fig 2B) The effect
of miR-218 mimics on cell proliferation using soft agar colony
formation assay was also assessed The colonies were divided into
different groups by size The results demonstrated that fewer cell
colonies were formed following overexpression of miR-218 compared
with the control cells in the large size group (area of colonies
≥3,000 µm2) (Fig
2C) However, the number of colonies was not significantly
different between overexpression of miR-218 cells and control cells
in the small size group (area of colonies <3,000
µm2) (Fig 2C)
The in vivo tumor-suppressing effect of miR-218 was also
evaluated in nude mice Lentivirus encoding miR-218 and control
lentivirus were transfected into cells to establish tumor
xenografts These lentiviruses were only used in the nude mice
tumorigenesis experiment miR-218 expression was confirmed after
harvesting the tumor tissue (Fig
2D) It was revealed that U251 cells stably expressing miR-218
induced tumors which had significantly smaller mean tumor volumes
and longer latency compared with the control (Fig 2E) The xenograft tumors were
isolated and weighed at the end of the experiments As presented in
Fig 2F, tumors stably expressing
miR-218 weighed significantly less than the control tumors
(P=00009) As anticipated, the percentage of Ki67-positive cells was
significantly lower in cells stably expressing miR-218 (Fig 2G)
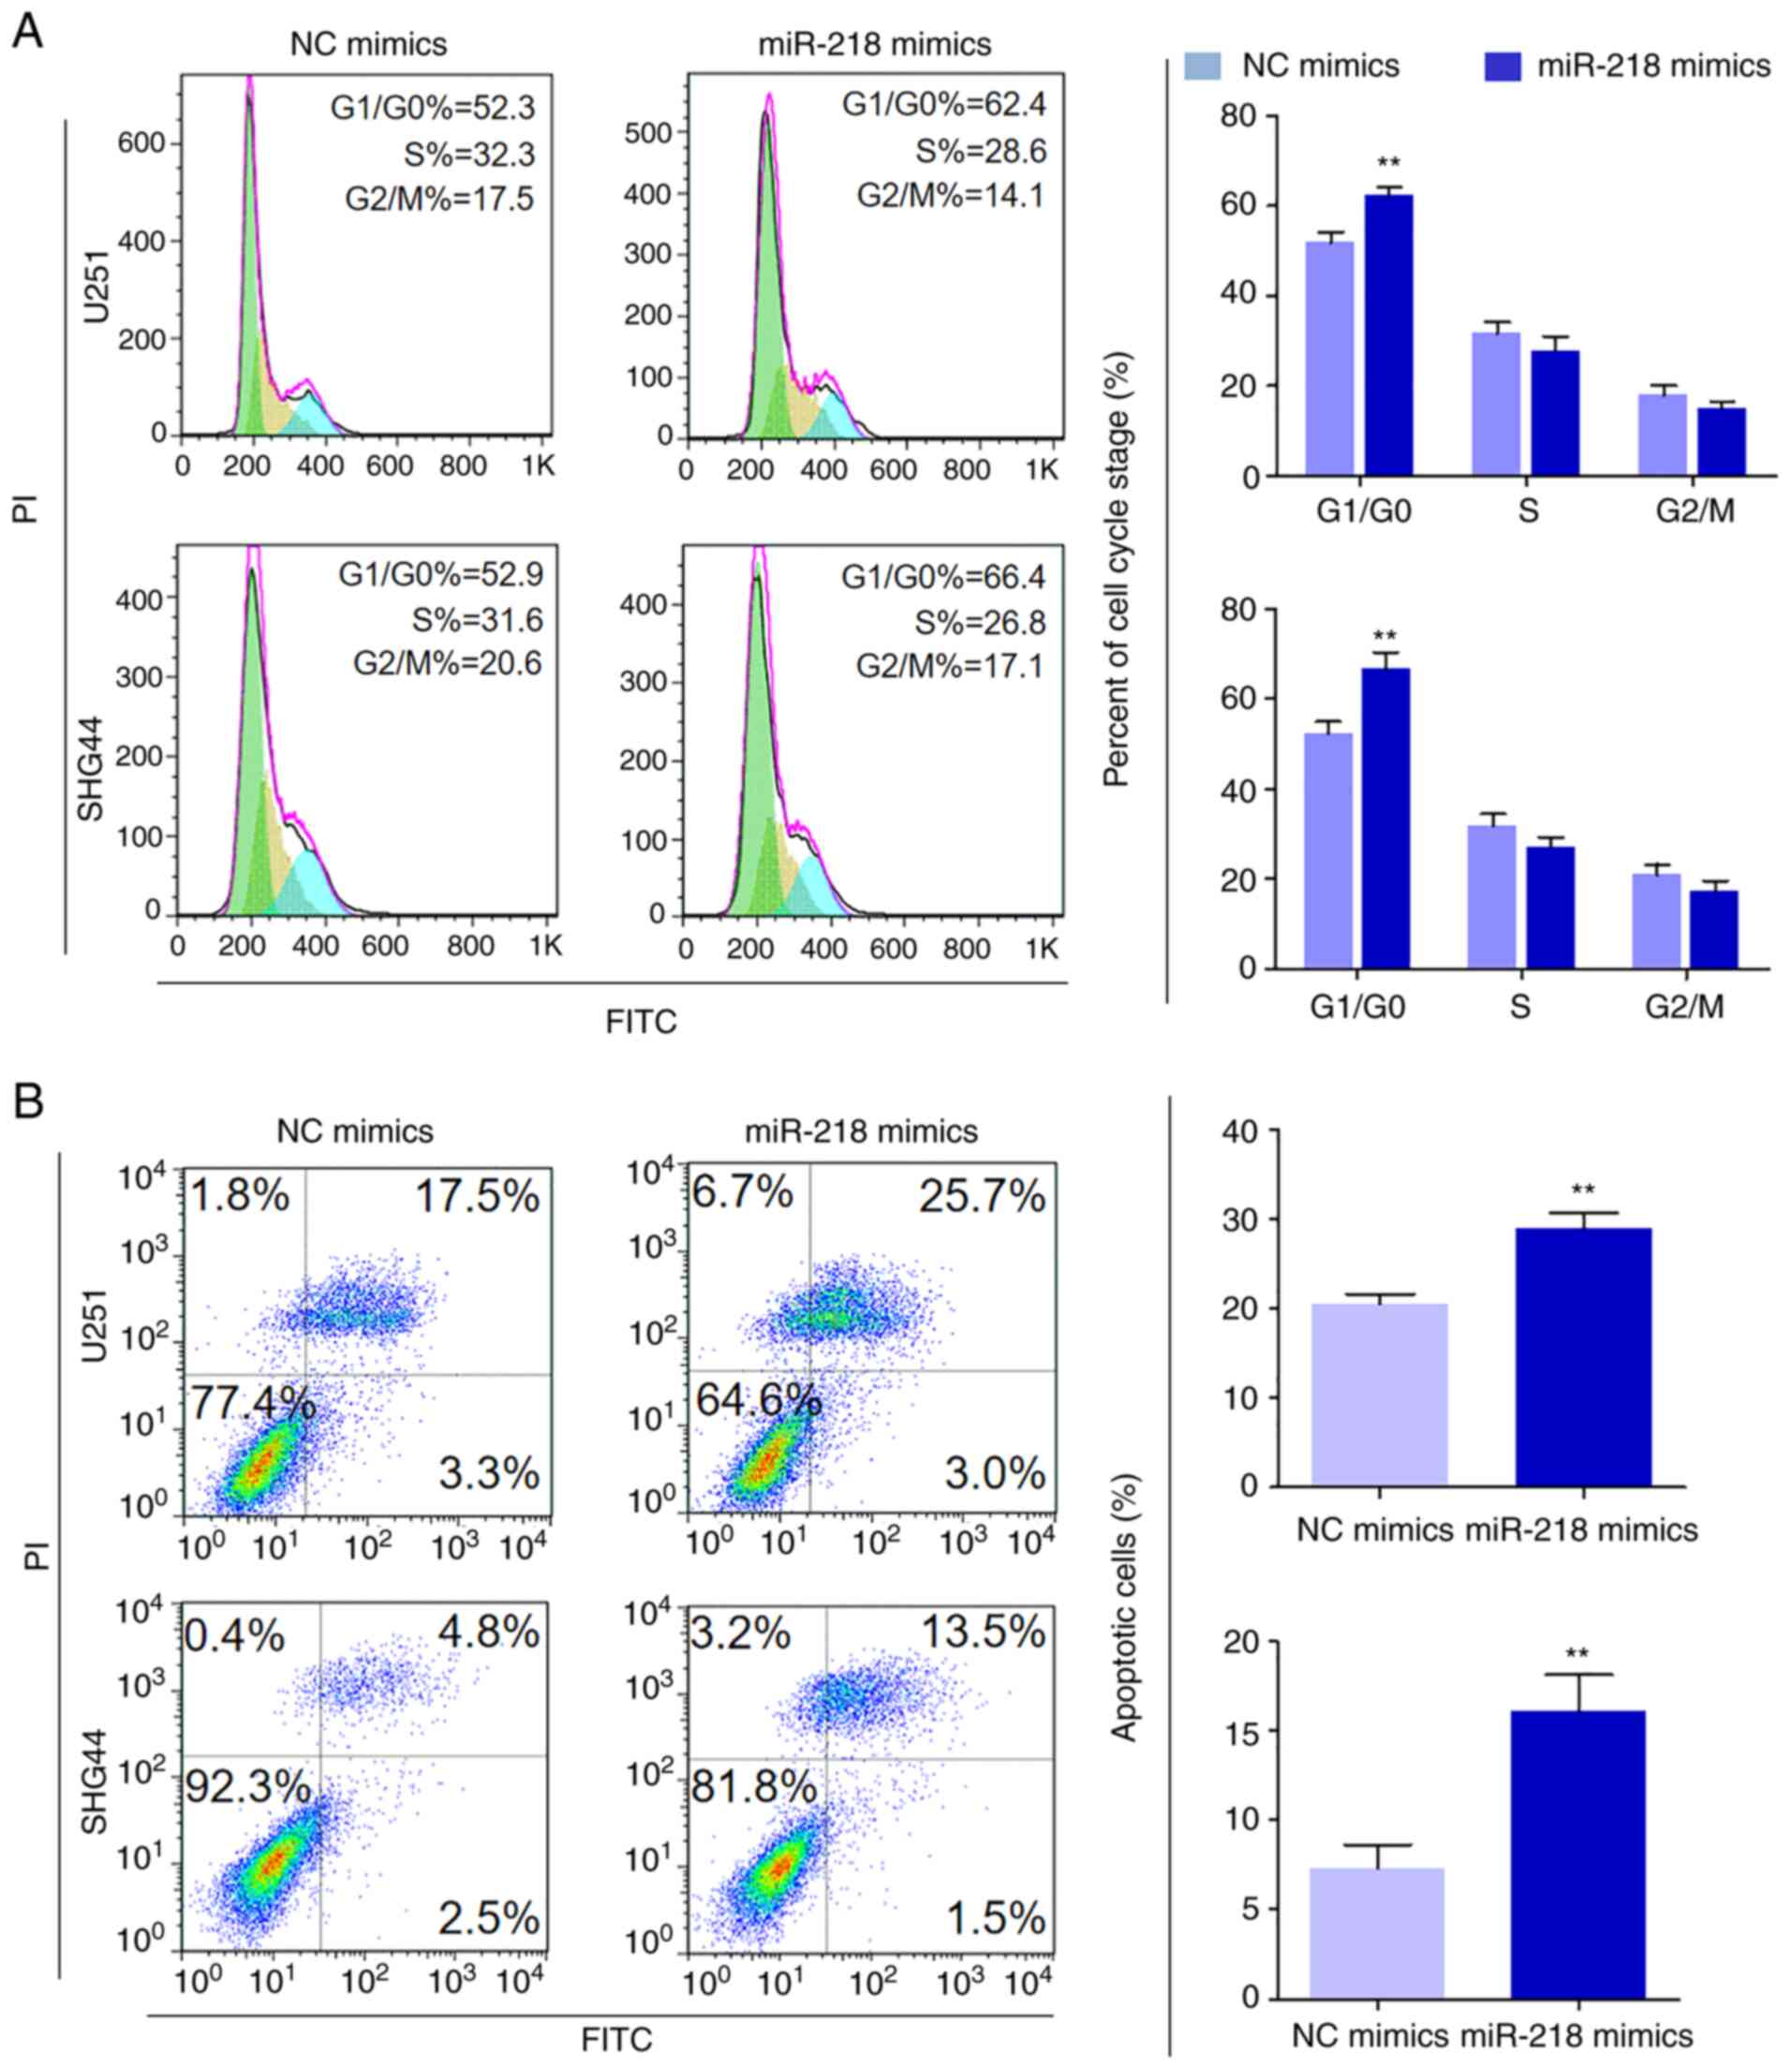
The effects of miR-218 mimics on cell cycle
distribution and apoptosis in U251 and SHG44 cells were assessed
The results demonstrated that the cell cycle of
miR-218-overexpressing cells was arrested at the
G0/G1 phase compared with the control cells
(Fig 3A) The percentage of cells
in the G0/G1 phase increased from 517±24 to
623±20% in U251 cells (P=0004) and from 523±27 to 666±37% in SHG44
cells (P=0005) In addition, transfection with miR-218 mimics
increased both early and late apoptosis compared with the control
(205±11 vs 289±18% in U251 cells, P<0002; and 72±13 vs 160±21%
in SHG44 cells, P=0003; Fig 3B)
Collectively, these results indicated that miR-218 acts as a tumor
suppressor in glioma cells
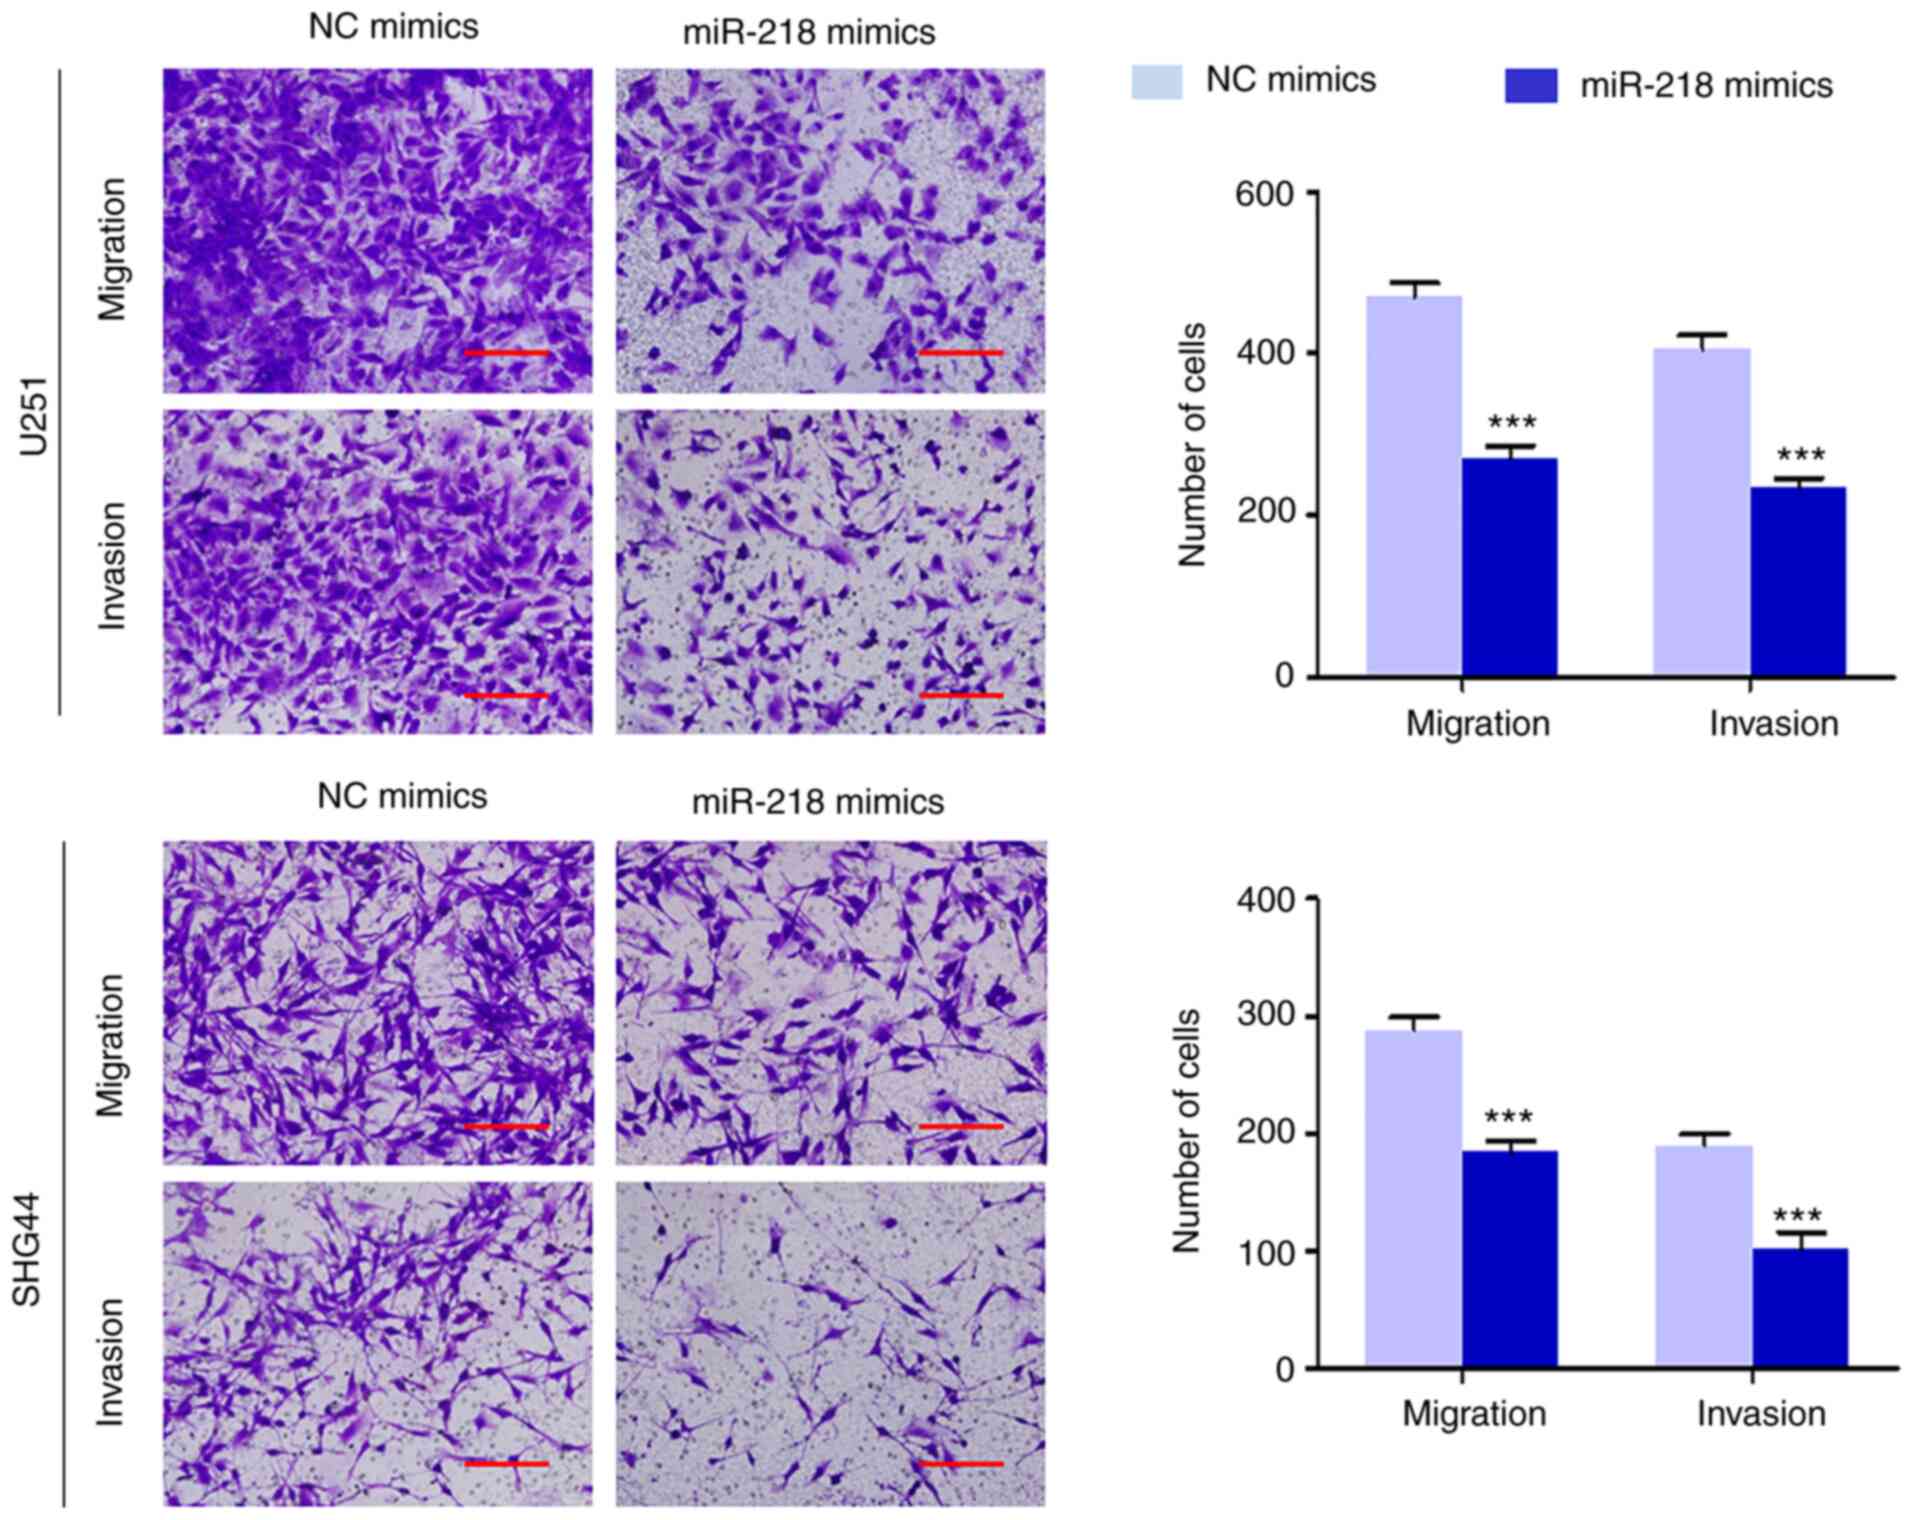
miR-218 inhibits glioma cell migration
and invasion
The effect of miR-218 mimics on migration and
invasion potential was assessed in U251 and SHG44 cells The results
demonstrated that overexpression of miR-218 significantly
suppressed the migration in U251 and SHG44 cells (Fig 4) In addition, transfection with
miR-218 mimics significantly downregulated the ability of cells to
invade through the Matrigel-coated membrane (Fig 4) Collectively, these results
indicated that miR-218 is closely associated with metastatic
phenotypes of glioma cells
TNC is a novel target of miR-218
A panel of candidate genes, which are potentially
targeted by miR-218, were identified using target predicting tools,
such as miRanda, TargetScan and miRDB Among them, genes involved in
vital signaling pathways were selected, including inhibitor of
NF-κB kinase subunit β (IKBKB), TNC and WNT2B
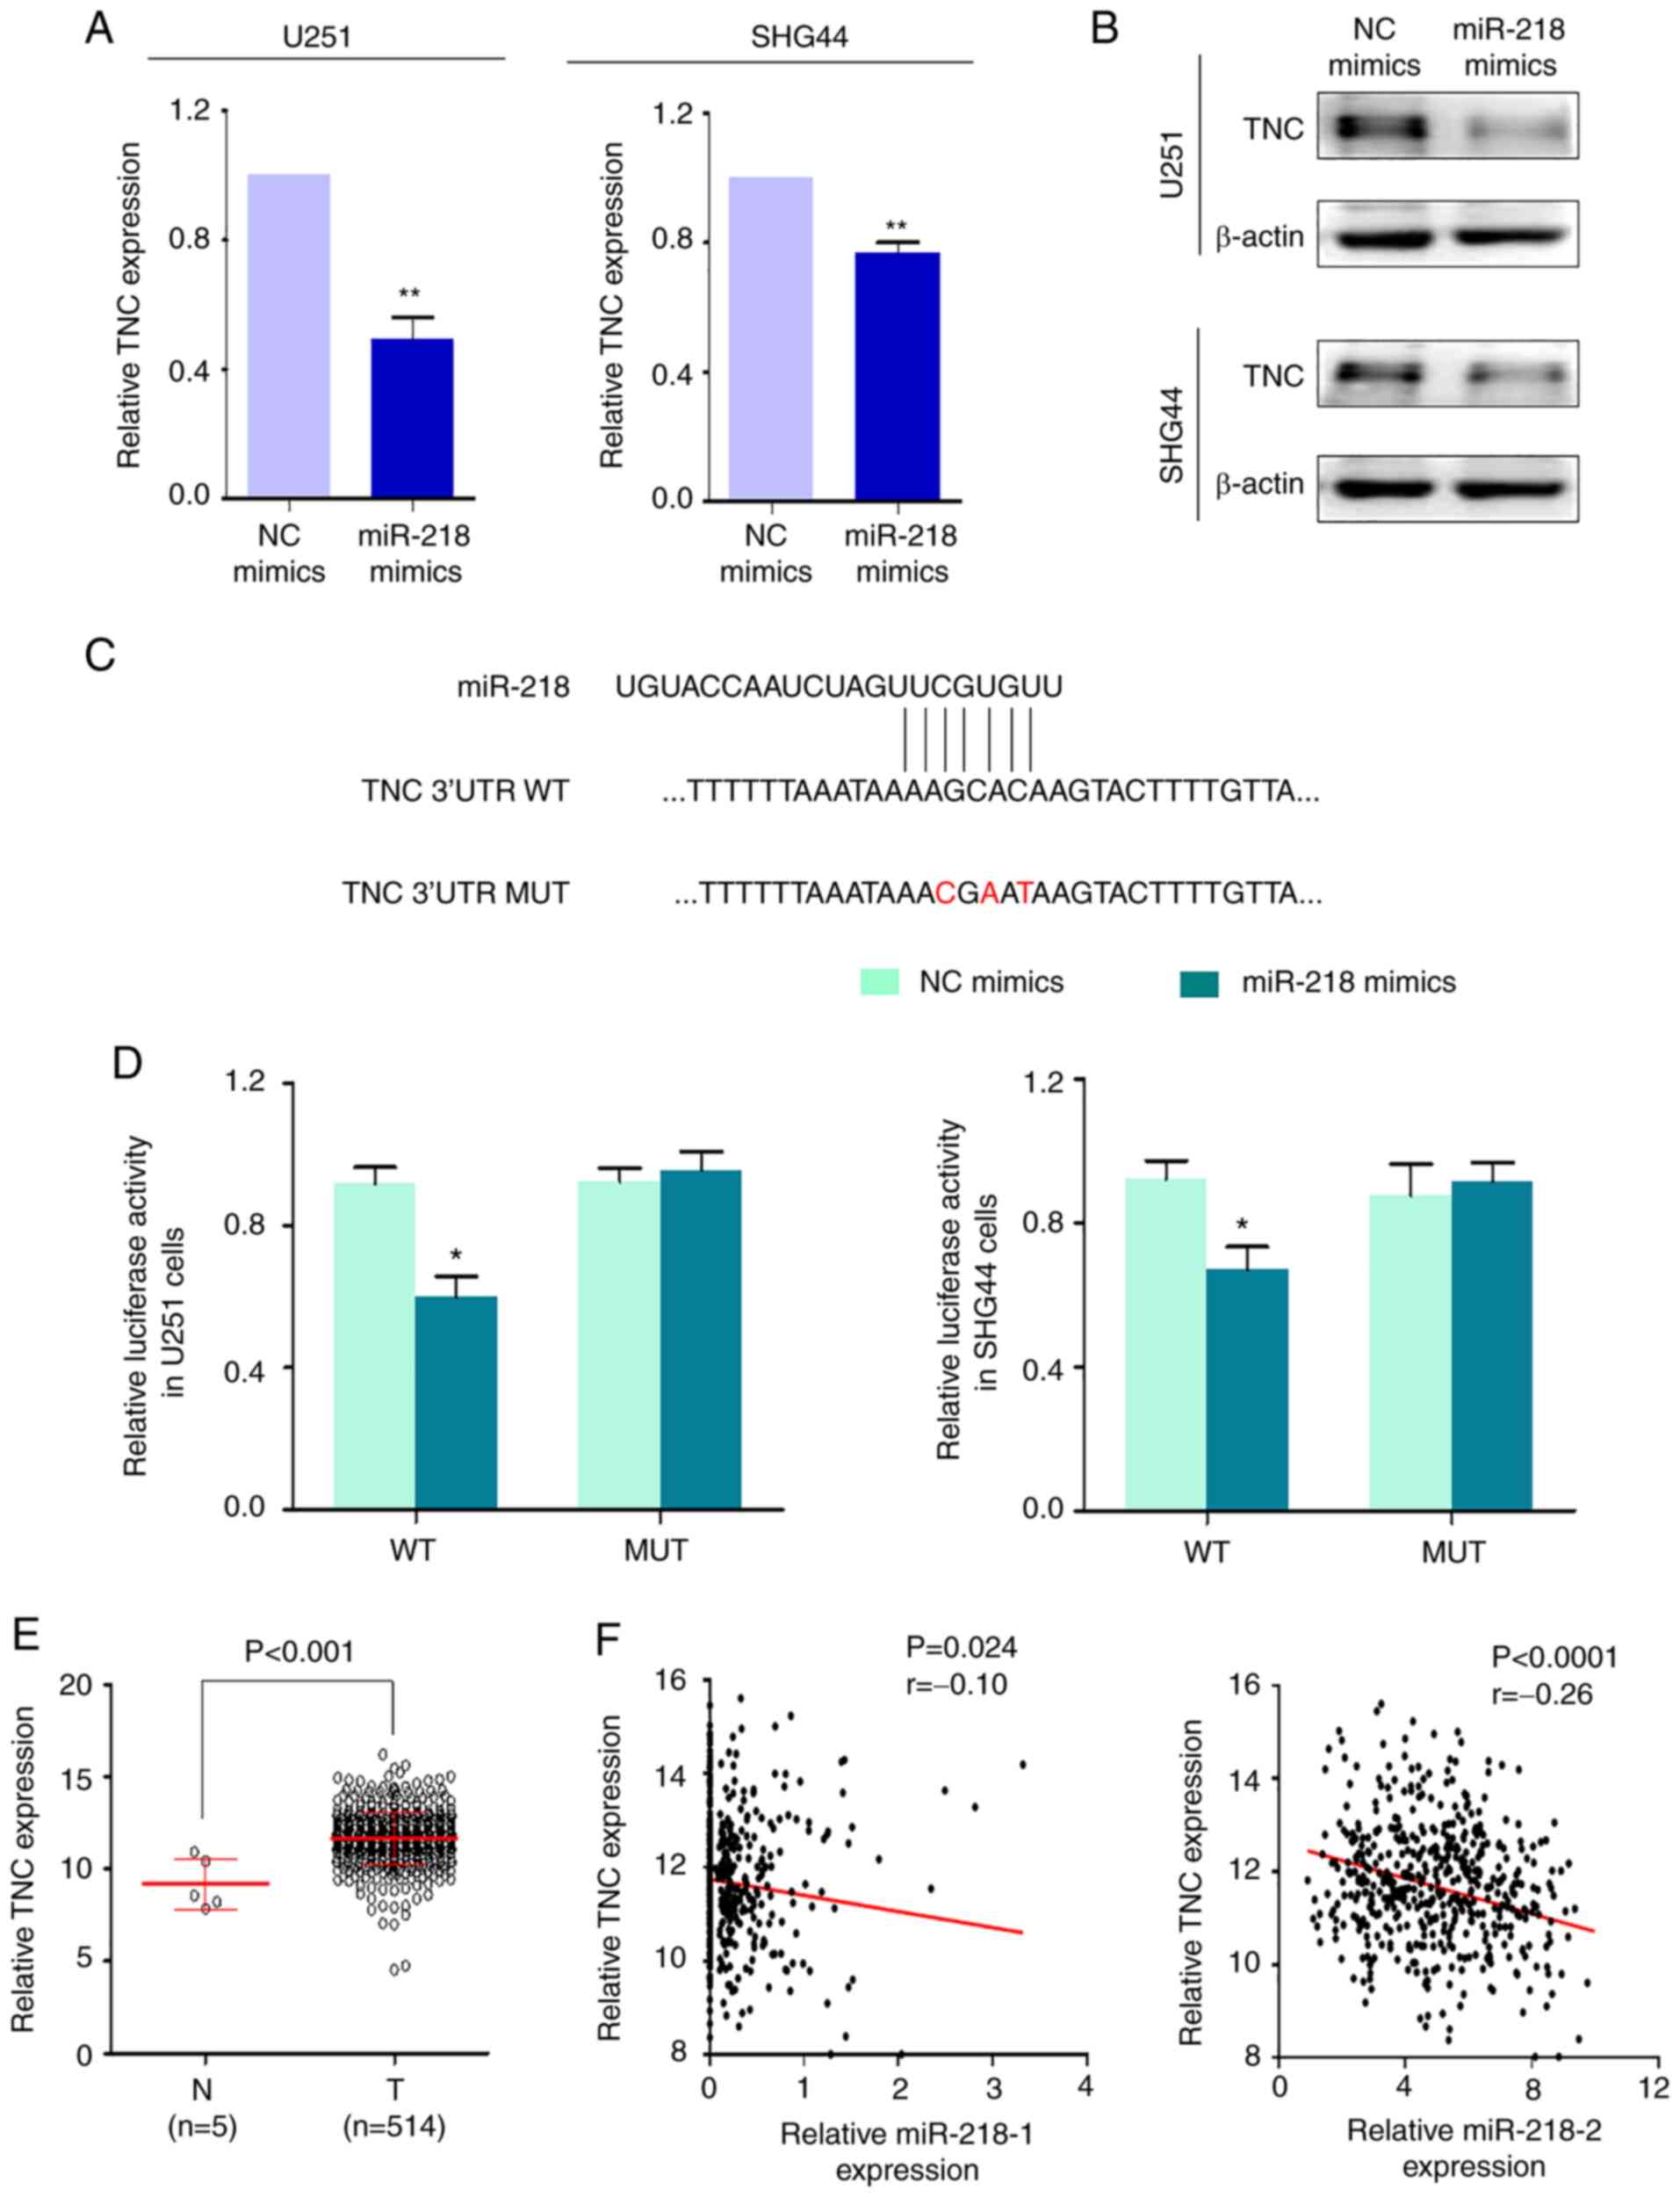
As revealed in Fig 5A and B, and
Fig S1, only TNC was notably
downregulated following transfection with miR-218 mimics in these
two cell lines, at both the mRNA and protein levels In addition,
miR-218 modulated TNC via a direct interaction A total of two
TNC 3′-UTR (attached to luciferase coding region) luciferase
reporter plasmids, which contained putative miR-218 binding sites,
WT 5′-AAGCACA-3′ and MUT 5′-ACGAATA-3′, were constructed (Fig 5C) The results demonstrated that
luciferase activity was significantly suppressed by miR-218 mimics
in U251 and SHG44 cells transfected with WT luciferase reporter
plasmid (Fig 5D) Notably,
luciferase activity remained unchanged in cells transfected with
MUT luciferase reporter plasmid (Fig
5D) Collectively, these results indicated that TNC is a
direct target of miR-218
TNC expression was analyzed in gliomas and normal
brain tissues using a dataset from TCGA The results demonstrated
that TNC expression was significantly upregulated in gliomas
(Fig 5E), which was consistent
with a previous study (24) In
addition, the correlation between miR-218-1/miR-218-2 and
TNC expression in gliomas was also investigated As revealed
in Fig 5F, TNC expression
was significantly correlated with miR-218-1 expression (P=0024,
r=−010; Pearson's correlation coefficient, left panel), and was
significantly correlated with miR-218-2 expression (P<00001,
r=−026; Pearson's correlation coefficient, right panel)
miR-218 functions as a tumor suppressor
in glioma cells by inhibiting the TNC/AKT/AP-1/TGFβ1-positive
feedback loop
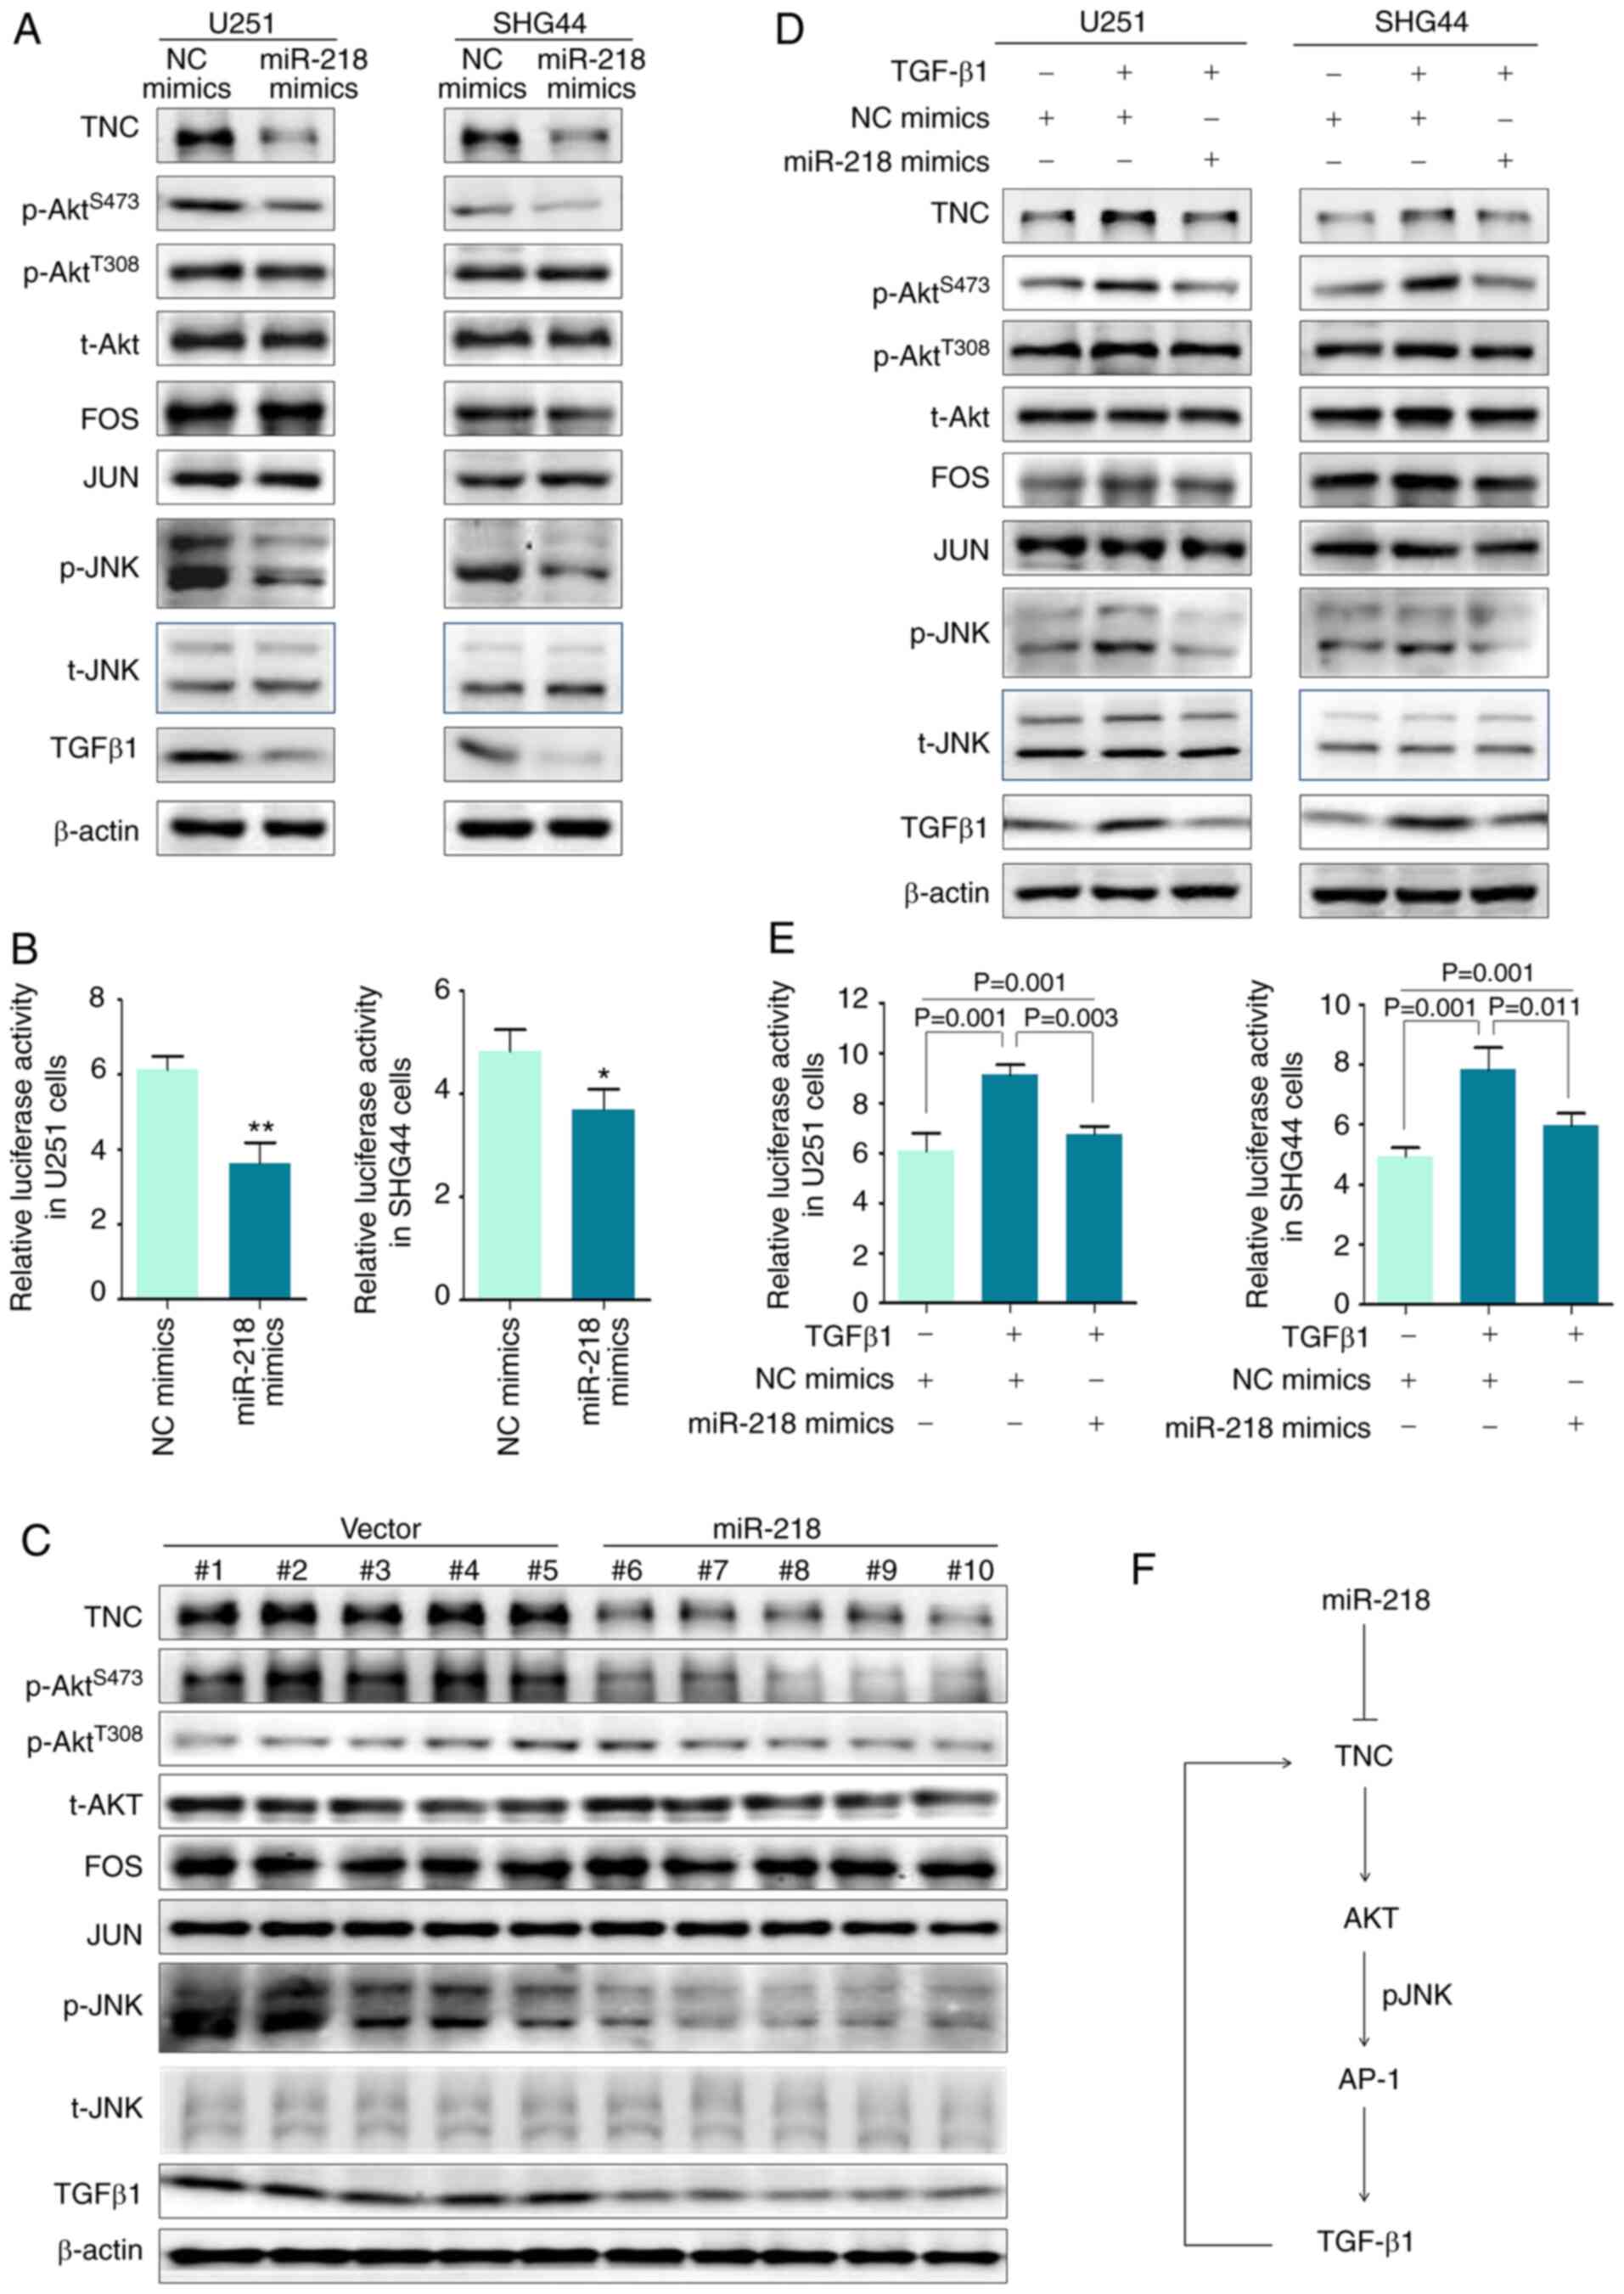
The molecular mechanism of malignant phenotypes of
glioma cells inhibited by miR-218 was investigated Increasing
evidence has indicated that TNC can increase phosphorylation of AKT
at Ser473 by interacting with integrins, thereby activating the
PI3K/AKT pathway (31-33) Thus, it was hypothesized that
miR-218 may inhibit the PI3K/AKT signaling by targeting TNC The
results demonstrated that transfection with miR-218 mimics
downregulated TNC expression, and notably inhibited phosphorylation
of AKT at Ser473, while it slightly affected phosphorylation of AKT
at Thr308 in U251 and SHG44 cells (Fig 6A)
Targeted by the PI3K/AKT signaling pathway,
transcription factor AP-1 is constitutively activated in glioma and
is important in cell proliferation (34-37) AP-1, which can bind to a common
DNA binding sequence, is a heterodimer composed primarily by the
FOS and JUN families (38,39) AP-1 activation involves complex
processes, such as increased expression or phosphorylation of FOS
and JUN (40) As revealed in
Fig 6A, transfection with
miR-218 mimics markedly inhibited JNK phosphorylation, while it
slightly affected FOS, JUN and total JNK expression in U251 and
SHG44 cells Considering that TGFβ1 is a well-known target of AP-1
(41-43), it was hypothesized that miR-218
could downregulate TGFβ1 expression by suppressing AP-1 activity As
revealed in Fig 6A, transfection
with miR-218 mimics decreased TGFβ1 expression in U251 and SHG44
cells compared with the control Collectively, these results
indicated that transcriptional activity of AP-1 could be inhibited
by miR-218, as supported by the AP-1 luciferase reporter assay
(Fig 6B)
To confirm the in vivo findings, western blot
analysis was performed to detect the indicated gene expression in
the xenograft tumors The results demonstrated that TNC expression
was significantly decreased in tumors overexpressing miR-218
(transfected with lentivirus encoding miR-218) compared with
control tumors (transfected with control lentivirus) (Fig 6C) As anticipated, phosphorylation
of AKT at Ser473, p-JNK and TGFβ1 expression was markedly decreased
in tumors overexpressing miR-218 compared with the control tumors
However, no significant differences were observed in
phosphorylation of AKT at Thr308 and the expression levels of FOS,
JUN and total JNK between the two groups, further supporting the
in vitro findings Notably, TGFβ1 has been reported to induce
TNC expression involving Smad3/4, Sp1 transcription factor, ETS
proto-oncogene 1, transcription factor and CBP300 (44) Thus, it was hypothesized that
TGFβ1 could activate the AKT/AP-1 signaling axis by upregulating
TNC expression, thereby forming a positive feedback loop To
demonstrate this, U251 and SHG44 cells were treated with
recombinant human TGFβ1 proteins The results demonstrated that
treatment with TGFβ1 markedly induced TNC expression and
subsequently increased phosphorylation of AKT at Ser473 and JNK
expression, the effects of which were reversed following
transfection with miR-218 mimics (Fig 6D) This was also supported by the
AP-1 luciferase reporter assay (Fig
6E) Collectively, these results indicated that miR-218 acts as
a tumor suppressor in glioma cells by blocking the
TNC/AKT/AP-1/TGFβ1-positive feedback loop
In the present study, a model was proposed to
investigate the molecular mechanism of miR-218 inhibiting malignant
progression of glioma (Fig 6F)
Briefly, miR-218 suppresses TNC expression by binding to its 3′-UTR
This in turn decreases AKT phosphorylation and subsequently
suppresses transcriptional activity of AP-1 by decreasing JNK
phosphorylation, thereby downregulating TGFβ1 expression, which
activates the TNC/AKT/AP-1 signaling axis Thus, miR-218 acts as a
potent tumor suppressor in glioma by blocking the
TNC/AKT/AP-1/TGFβ1-positive feedback loop
Discussion
miR-218 has been widely reported to act as a
putative tumor suppressor that is downregulated in several types of
human cancer, including gastric, nasopharyngeal, lung, cervical,
oral and brain tumors (14-16,45-49) Low miR-218 expression is closely
associated with poor overall survival and disease-free survival in
patients with glioma (17)
However, the role and underlying molecular mechanism of miR-218 in
glioma remains unclear
The results of the present study demonstrated that
miR-218 acted as a potent tumor suppressor in glioma TCGA dataset
was systematically analyzed, and the results demonstrated that both
miR-218-1 and miR-218-2 expression levels were significantly
downregulated in gliomas compared with the control subjects In
addition, the results confirmed that miR-218-2 constituted most of
the mature miR-218 in gliomas miR-218-2 expression was negatively
correlated with histological grading of patients with gliomas
Notably, downregulated miR-218-2 expression was closely associated
with poor long-term survival of patients with glioma Collectively,
these results indicated that miR-218-2 may be a potential
prognostic biomarker for patients with glioma Furthermore,
transfection with miR-218 mimics significantly suppressed the
malignant phenotypes of glioma cells, which validated the tumor
suppressive role of miR-218 in glioma cells, which was consistent
with a previous study (50)
To further understand the tumor suppressive role of
miR-218 in gliomas, TNC was identified as a novel target of miR-218
using target prediction tools, western blotting and the
dual-luciferase reporter assay Analysis of TCGA dataset
demonstrated that TNC expression was significantly increased in
gliomas compared with the control subjects, and was negatively
correlated with miR-218 expression, particularly miR-218-2 TNC,
which is characterized by a modular construction and a six-armed
quaternary structure, is a large secreted oligomeric extracellular
matrix glycoprotein that binds to integrin cell adhesion receptors,
periostin, syndecan membrane proteoglycans and fibronectin
(51-53) In the present study, transfection
with miR-218 mimics downregulated TNC mRNA and protein expression
levels, both in vitro and in vivo
TNC has been reported to activate the PI3K/AKT
signaling pathway by interacting with integrins (31-33) Thus, the present study assessed
the effect of miR-218 on PI3K/AKT pathway activity The results
demonstrated that transfection with miR-218 mimics markedly
inhibited phosphorylation of AKT at Ser473, but not at Thr308, in
glioma cells Furthermore, transcriptional activity of AP-1, a
downstream target of the PI3K/AKT pathway (34-37), was markedly inhibited by miR-218
by decreasing JNK phosphorylation Considering that AP-1
transcriptionally induces TGFβ1 by binding to its promoter region
(41-43), it was hypothesized that miR-218
may downregulate TGFβ1 expression by suppressing AP-1 activity
through blocking PI3K/AKT signaling The results confirmed that
miR-218 mimics markedly decreased TGFβ1 expression in both glioma
cell lines and xenograft tumors, accompanied by decreased TNC
expression and inhibition of AKT/JNK phosphorylation
TGFβ1 has been reported to induce TNC expression
(44,54) Thus, it was hypothesized that
TGFβ1 can form a positive feedback loop with the TNC/AKT/AP-1
signaling axis The results demonstrated that exogenous TGFβ1
notably increased TNC expression and subsequently enhanced
phosphorylation of AKT at Ser473 and AP-1 activity, the effects of
which were reversed following transfection with miR-218 mimics
In conclusion, the results of the present study
indicated that miR-218 acts as a tumor suppressor in glioma
Furthermore, TNC was identified as a novel target of miR-218
Notably, miR-218 inhibited the malignant phenotypes of glioma cells
by blocking the TNC/AKT/AP-1/TGFβ1-positive feedback loop
Supplementary Data
Availability of data and materials
All data generated or analyzed during this study are
included in this published article
Authors' contributions
MJ and GL conceived and designed the experiments SD,
RZ and ST conducted the experiments SD, PH and MJ analyzed the data
GL and MJ contributed to acquisition of reagents and materials SD
and PH wrote the manuscript SD and PH confirm the authenticity of
all the raw data All authors read and approved the final
manuscript
Ethics approval and consent to
participate
All animal experiments were approved by The
Laboratory Animal Center of Xi'an Jiaotong University (Xi'an,
China)
Patient consent for publication
Not applicable
Competing interests
The authors declare that they have no competing
interests
Acknowledgments
Not applicable
Funding
The present study was supported by the National Natural Science
Foundation of China (grant no 81572697)
References
|
1
|
Jemal A, Bray F, Center MM, Ferlay J, Ward
E and Forman D: Global cancer statistics. CA Cancer J Clin.
61:69–90. 2011. View Article : Google Scholar
|
|
2
|
Clarke J, Butowski N and Chang S: Recent
advances in therapy for glioblastoma. Arch Neurol. 67:279–283.
2010. View Article : Google Scholar
|
|
3
|
Park DM, Sathornsumetee S and Rich JN:
Medical oncology: Treatment and management of malignant gliomas.
Nat Rev Clin Oncol. 7:75–77. 2010. View Article : Google Scholar
|
|
4
|
Castro MG, Candolfi M, Kroeger K, King GD,
Curtin JF, Yagiz K, Mineharu Y, Assi H, Wibowo M, Ghulam Muhammad
AK, et al: Gene therapy and targeted toxins for glioma. Curr Gene
Ther. 11:155–180. 2011. View Article : Google Scholar
|
|
5
|
Hu J, Sun T, Wang H, Chen Z, Wang S, Yuan
L, Liu T, Li HR, Wang P, Feng Y, et al: MiR-215 is induced
post-transcriptionally via HIF-Drosha complex and mediates
glioma-Initiating cell adaptation to hypoxia by targeting KDM1B.
Cancer Cell. 29:49–60. 2016. View Article : Google Scholar
|
|
6
|
Dang SW, Zhou JS, Chen YJ, Chen P, Ji MJ,
Shi BY, Yang Q and Hou P: Dynamic expression of ZNF382 and its
tumor-suppressor role in hepatitis B virus-related hepatocellular
carcinogenesis. Oncogene. 38:4804–4819. 2019. View Article : Google Scholar
|
|
7
|
Bartel DP: MicroRNAs: Genomics,
biogenesis, mechanism, and function. Cell. 116:281–297. 2004.
View Article : Google Scholar
|
|
8
|
Chen X, Zhang X, Sun S and Zhu M:
MicroRNA-432 inhibits the aggressiveness of glioblastoma multiforme
by directly targeting IGF-1R. Int J Mol Med. 45:597–606. 2020.
|
|
9
|
Liu FZ, Lou K, Zhao XT, Zhang J, Chen W,
Qian YC, Zhao YB, Zhu Y and Zhang Y: miR-214 regulates papillary
thyroid carcinoma cell proliferation and metastasis by targeting
PSMD10. Int J Mol Med. 42:3027–3036. 2018.
|
|
10
|
Park S and James CD: ECop
(EGFR-coamplified and overexpressed protein), a novel protein,
regulates NF-kappaB transcriptional activity and associated
apoptotic response in an IkappaBalpha-dependent manner. Oncogene.
24:2495–2502. 2005. View Article : Google Scholar
|
|
11
|
Frampton AE, Castellano L, Colombo T,
Giovannetti E, Krell J, Jacob J, Pellegrino L, Roca-Alonso L, Funel
N, Gall TM, et al: Integrated molecular analysis to investigate the
role of microRNAs in pancreatic tumour growth and progression.
Lancet. 385(Suppl 1): S372015. View Article : Google Scholar
|
|
12
|
Dvinge H, Git A, Graf S, Salmon-Divon M,
Curtis C, Sottoriva A, Zhao Y, Hirst M, Armisen J, Miska EA, et al:
The shaping and functional consequences of the microRNA landscape
in breast cancer. Nature. 497:378–382. 2013. View Article : Google Scholar
|
|
13
|
Ding PF, Liang B, Shou JX and Wang WJ:
lncRNA KCNQ1OT1 promotes proliferation and invasion of glioma cells
by targeting the miR-375/YAP pathway. Int J Mol Med. 46:1983–1992.
2020. View Article : Google Scholar
|
|
14
|
Song L, Huang Q, Chen K, Liu L, Lin C, Dai
T, Yu C, Wu Z and Li J: miR-218 inhibits the invasive ability of
glioma cells by direct downregulation of IKK-β. Biochem Biophys Res
Commun. 402:135–140. 2010. View Article : Google Scholar
|
|
15
|
Setty M, Helmy K, Khan AA, Silber J, Arvey
A, Neezen F, Agius P, Huse JT, Holland EC and Leslie CS: Inferring
transcriptional and microRNA-mediated regulatory programs in
glioblastoma. Mol Syst Biol. 8:6052012. View Article : Google Scholar
|
|
16
|
Xia H, Yan Y, Hu M, Wang Y, Wang Y, Dai Y,
Chen J, Di G, Chen X and Jiang X: MiR-218 sensitizes glioma cells
to apoptosis and inhibits tumorigenicity by regulating
ECOP-mediated suppression of NF-κB activity. Neuro Oncol.
15:413–422. 2013. View Article : Google Scholar
|
|
17
|
Cheng MW, Wang LL and Hu GY: Expression of
microRNA-218 and its clinicopathological and prognostic
significance in human glioma cases. Asian Pac J Cancer Prev.
16:1839–1843. 2015. View Article : Google Scholar
|
|
18
|
Luo Y, Hou WT, Zeng L, Li ZP, Ge W, Yi C,
Kang JP, Li WM, Wang F, Wu DB, et al: Progress in the study of
markers related to glioma prognosis. Eur Rev Med Pharmacol Sci.
24:7690–7697. 2020.
|
|
19
|
Tatarano S, Chiyomaru T, Kawakami K,
Enokida H, Yoshino H, Hidaka H, Yamasaki T, Kawahara K, Nishiyama
K, Seki N and Nakagawa M: miR-218 on the genomic loss region of
chromosome 4p1531 functions as a tumor suppressor in bladder
cancer. Int J Oncol. 39:13–21. 2011.
|
|
20
|
Erickson HP: Tenascin-C, tenascin-R and
tenascin-X: A family of talented proteins in search of functions.
Curr Opin Cell Biol. 5:869–876. 1993. View Article : Google Scholar
|
|
21
|
Jones PL and Jones FS: Tenascin-C in
development and disease: Gene regulation and cell function. Matrix
Biol. 19:581–596. 2000. View Article : Google Scholar
|
|
22
|
Fassler R, Sasaki T, Timpl R, Chu ML and
Werner S: Differential regulation of fibulin, tenascin-C, and
nidogen expression during wound healing of normal and
glucocorticoid-treated mice. Exp Cell Res. 222:111–116. 1996.
View Article : Google Scholar
|
|
23
|
Zagzag D, Friedlander DR, Miller DC, Dosik
J, Cangiarella J, Kostianovsky M, Cohen H, Grumet M and Greco MA:
Tenascin expression in astrocytomas correlates with angiogenesis.
Cancer Res. 55:907–914. 1995.
|
|
24
|
Zamecnik J: The extracellular space and
matrix of gliomas. Acta Neuropathol. 110:435–442. 2005. View Article : Google Scholar
|
|
25
|
Rolle K, Nowak S, Wyszko E, Nowak M,
Zukiel R, Piestrzeniewicz R, Gawronska I, Barciszewska MZ and
Barciszewski J: Promising human brain tumors therapy with
interference RNA intervention (iRNAi). Cancer Biol Ther. 9:396–406.
2010. View Article : Google Scholar
|
|
26
|
Doecke JD, Wang Y and Baggerly K:
Co-localized genomic regulation of miRNA and mRNA via DNA
methylation affects survival in multiple tumor types. Cancer Genet.
209:463–473. 2016. View Article : Google Scholar
|
|
27
|
Shi J, Liu W, Sui F, Lu R, He Q, Yang Q,
Lv H, Shi B and Hou P: Frequent amplification of AIB1, a critical
oncogene modulating major signaling pathways, is associated with
poor survival in gastric cancer. Oncotarget. 6:14344–14359. 2015.
View Article : Google Scholar
|
|
28
|
Livak KJ and Schmittgen TD: Analysis of
relative gene expression data using real-time quantitative PCR and
the 2(-Delta Delta C(T)) method. Methods. 25:402–408. 2001.
View Article : Google Scholar
|
|
29
|
Shi J, Qu Y, Li X, Sui F, Yao D, Yang Q,
Shi B, Ji M and Hou P: Increased expression of EHF via gene
amplification contributes to the activation of HER family signaling
and associates with poor survival in gastric cancer. Cell Death
Dis. 7:e24422016. View Article : Google Scholar
|
|
30
|
Guan H, Wei G, Wu J, Fang D, Liao Z, Xiao
H, Li M and Li Y: Down-regulation of miR-218-2 and its host gene
SLIT3 cooperate to promote invasion and progression of thyroid
cancer. J Clin Endocrinol Metab. 98:E1334–E1344. 2013. View Article : Google Scholar
|
|
31
|
Jang JH and Chung CP: Tenascin-C promotes
cell survival by activation of Akt in human chondrosarcoma cell.
Cancer Lett. 229:101–105. 2005. View Article : Google Scholar
|
|
32
|
Ding H, Jin M, Liu D, Wang S, Zhang J,
Song X and Huang R: TenascinC promotes the migration of bone marrow
stem cells via toll-like receptor 4-mediated signaling pathways:
MAPK, AKT and Wnt. Mol Med Rep. 17:7603–7610. 2018.
|
|
33
|
Paron I, Berchtold S, Voros J, Shamarla M,
Erkan M, Höfler H and Esposito I: Tenascin-C enhances pancreatic
cancer cell growth and motility and affects cell adhesion through
activation of the integrin pathway. PLoS One. 6:e216842011.
View Article : Google Scholar
|
|
34
|
Xu Z, Liu D, Fan C, Luan L, Zhang X and
Wang E: DIXDC1 increases the invasion and migration ability of
non-small-cell lung cancer cells via the PI3K-AKT/AP-1 pathway. Mol
Carcinog. 53:917–925. 2014. View Article : Google Scholar
|
|
35
|
Wu D, Peng F, Zhang B, Ingram AJ, Kelly
DJ, Gilbert RE, Gao B and Krepinsky JC: PKC-beta1 mediates
glucose-induced Akt activation and TGF-beta1 upregulation in
mesangial cells. J Am Soc Nephrol. 20:554–566. 2009. View Article : Google Scholar
|
|
36
|
Peterziel H, Muller J, Danner A, Barbus S,
Liu HK, Radlwimmer B, Pietsch T, Lichter P, Schutz G, Hess J and
Angel P: Expression of podoplanin in human astrocytic brain tumors
is controlled by the PI3K-AKT-AP-1 signaling pathway and promoter
methylation. Neuro Oncol. 14:426–439. 2012. View Article : Google Scholar
|
|
37
|
Ho E and Ames BN: Low intracellular zinc
induces oxidative DNA damage, disrupts p53, NFkappa B, and AP1 DNA
binding, and affects DNA repair in a rat glioma cell line. Proc
Natl Acad Sci USA. 99:16770–16775. 2002. View Article : Google Scholar
|
|
38
|
Han R, Li L, Ugalde AP, Tal A, Manber Z,
Barbera EP, Chiara VD, Elkon R and Agami R: Functional CRISPR
screen identifies AP1-associated enhancer regulating FOXF1 to
modulate oncogene-induced senescence. Genome Biol. 19:1182018.
View Article : Google Scholar
|
|
39
|
Yao CD, Haensel D, Gaddam S, Patel T,
Atwood SX, Sarin KY, Whitson RJ, McKellar S, Shankar G, Aasi S, et
al: AP-1 and TGFß cooperativity drives non-canonical Hedgehog
signaling in resistant basal cell carcinoma. Nat Commun.
11:50792020. View Article : Google Scholar
|
|
40
|
Karin M, Liu Z and Zandi E: AP-1 function
and regulation. Curr Opin Cell Biol. 9:240–246. 1997. View Article : Google Scholar
|
|
41
|
Kim SJ, Angel P, Lafyatis R, Hattori K,
Kim KY, Sporn MB, Karin M and Roberts AB: Autoinduction of
transforming growth factor beta 1 is mediated by the AP-1 complex.
Mol Cell Biol. 10:1492–1497. 1990.
|
|
42
|
Kim SJ, Jeang KT, Glick AB, Sporn MB and
Roberts AB: Promoter sequences of the human transforming growth
factor-beta 1 gene responsive to transforming growth factor-beta 1
autoinduction. J Biol Chem. 264:7041–7045. 1989. View Article : Google Scholar
|
|
43
|
Yue J and Mulder KM: Requirement of
Ras/MAPK pathway activation by transforming growth factor beta for
transforming growth factor beta 1 production in a Smad-dependent
pathway. J Biol Chem. 275:30765–30773. 2000. View Article : Google Scholar
|
|
44
|
Jinnin M, Ihn H, Asano Y, Yamane K,
Trojanowska M and Tamaki K: Tenascin-C upregulation by transforming
growth factor-beta in human dermal fibroblasts involves Smad3, Sp1,
and Ets1. Oncogene. 23:1656–1667. 2004. View Article : Google Scholar
|
|
45
|
Tie J, Pan Y, Zhao L, Wu K, Liu J, Sun S,
Guo X, Wang B, Gang Y, Zhang Y, et al: MiR-218 inhibits invasion
and metastasis of gastric cancer by targeting the Robo1 receptor.
PLoS Genet. 6:e10008792010. View Article : Google Scholar
|
|
46
|
Alajez NM, Lenarduzzi M, Ito E, Hui AB,
Shi W, Bruce J, Yue S, Huang SH, Xu W, Waldron J, et al: MiR-218
suppresses nasopharyngeal cancer progression through downregulation
of survivin and the SLIT2-ROBO1 pathway. Cancer Res. 71:2381–2391.
2011. View Article : Google Scholar
|
|
47
|
Shi ZM, Wang L, Shen H, Jiang CF, Ge X, Li
DM, Wen YY, Sun HR, Pan MH, Li W, et al: Downregulation of miR-218
contributes to epithelial-mesenchymal transition and tumor
metastasis in lung cancer by targeting Slug/ZEB2 signaling.
Oncogene. 36:2577–2588. 2017. View Article : Google Scholar
|
|
48
|
Martinez I, Gardiner AS, Board KF, Monzon
FA, Edwards RP and Khan SA: Human papillomavirus type 16 reduces
the expression of microRNA-218 in cervical carcinoma cells.
Oncogene. 27:2575–2582. 2008. View Article : Google Scholar
|
|
49
|
Uesugi A, Kozaki K, Tsuruta T, Furuta M,
Morita K, Imoto I, Omura K and Inazawa J: The tumor suppressive
microRNA miR-218 targets the mTOR component Rictor and inhibits AKT
phosphorylation in oral cancer. Cancer Res. 71:5765–5778. 2011.
View Article : Google Scholar
|
|
50
|
Tu Y, Gao X, Li G, Fu H, Cui D, Liu H, Jin
W and Zhang Y: MicroRNA-218 inhibits glioma invasion, migration,
proliferation, and cancer stem-like cell self-renewal by targeting
the polycomb group gene Bmi1. Cancer Res. 73:6046–6055. 2013.
View Article : Google Scholar
|
|
51
|
Jones FS and Jones PL: The tenascin family
of ECM glycoproteins: Structure, function, and regulation during
embryonic development and tissue remodeling. Dev Dyn. 218:235–259.
2000. View Article : Google Scholar
|
|
52
|
Kii I, Nishiyama T, Li M, Matsumoto K,
Saito M, Amizuka N and Kudo A: Incorporation of tenascin-C into the
extracellular matrix by periostin underlies an extracellular
meshwork architecture. J Biol Chem. 285:2028–2039. 2010. View Article : Google Scholar
|
|
53
|
Orend G and Chiquet-Ehrismann R:
Tenascin-C induced signaling in cancer. Cancer Lett. 244:143–163.
2006. View Article : Google Scholar
|
|
54
|
Barrera LN, Evans A, Lane B, Brumskill S,
Oldfield FE, Campbell F, Andrews T, Lu Z, Perez-Mancera PA,
Liloglou T, et al: Fibroblasts from distinct pancreatic pathologies
exhibit disease-specific properties. Cancer Res. 80:2861–2873.
2020. View Article : Google Scholar
|