Introduction
Breast cancer (BC), is the most commonly occurring
malignancy in females and it continues to impose a major health
burden globally. Despite the notable improvements in early
diagnosis and the development of more effective therapeutic
strategies, BC remains the leading cause of cancer-related
mortality (1), with the vast
majority of these deaths attributed to recurrent or metastatic
disease (2). The development of
metastasis requires interactions among breast cells and tumor
microenvironment components, and implicates a variety of
proteolytic enzymes, growth factors and cell adhesion molecules
(3).
The carcinoembryonic antigen-related cell adhesion
molecule (CEACAM) gene subfamily, belongs to the carcinoembryonic
antigen (CEA) gene family; which in turn is a member of the
immunoglobulin superfamily (IgSF) (4). In humans, the CEACAM subfamily
members are involved in a variety of homotypic and/or heterotypic
intercellular-adhesion and intracellular signaling events (5,6),
that govern several key biological processes, such as cell
adhesion, cell growth, differentiation, immune response, cellular
recognition, apoptosis and angiogenesis (7–10).
Apart from their physiological functions, recent
studies demonstrate that the expression and/or function of CEACAM
subfamily members are often deregulated in tumors, suggesting that
they play an instrumental role in tumorigenesis, invasion and
metastasis (9,11–13).
Indeed, CEA (encoded by the CEACAM5 gene), and the closely
related family member CEACAM6 are frequently found to be
overexpressed in a majority of carcinomas (14,15),
and their overexpression is often associated with enhanced
metastatic potential and, thus, with poor prognosis (11,12,16–18).
On the contrary, CEACAM1 expression is usually reported to
be downregulated in several tumor types, such as breast, prostate
and colorectal cancer (8). Due to
their differential expression in cancer and their documented
tumorigenic functions (4,8), many CEACAM members may possess
clinical utility as prognostic/predictive markers for a panel of
human malignancies. In particular, this notion is underscored by
the routine clinical use of CEA serum levels in the prognosis,
early detection of recurrence and follow-up of patients with
breast, colorectal, or lung cancer (19).
CEACAM19 gene, previously known as CEA-like
gene 1 (CEAL1), was recently discovered and cloned by
members of our research group. At the mRNA level, CEACAM19
is constitutively expressed in a wide range of normal tissues.
However, the exact nature of its biological function remains to be
fully elucidated. A preliminary study showed that CEACAM19
is upregulated, at the mRNA level, in ovarian and breast tumors.
Interestingly, CEACAM19 overexpression was observed in
clinically highly aggressive ovarian tumors suggesting that it
could serve as a new cancer biomarker (20).
In the current study, we sought to analyze the
expression of CEACAM19 and to further investigate its
potential clinical significance in BC. Currently, BC management is
mainly based on clinical and histological features such as tumor
size, histological subtype and grade, as well as on molecular
markers, such as estrogen receptor (ER), progesterone receptor
(PgR), and human epidermal growth factor receptor 2 (HER2)
(21,22). Nevertheless, all these parameters
have a limited capacity to capture the great variability of
biological and clinical behavior of breast carcinomas (23). Consequently, since BC is an
extraordinarily heterogeneous disease entity (24), it is increasingly apparent that
there is a great need for the identification and implementation of
additional and more reliable tumor molecular biomarkers for early
and effective diagnosis, prognosis and prediction of treatment
outcome in BC patients. Here, we provide the first evidence that
CEACAM19 gene expression analysis may provide important
clinical information for patients suffering from BC.
Materials and methods
Collection of breast tissue samples and
clinical data
Breast tumor samples (n=143) and matched
non-malignant tissue sections (n=89) were obtained from patients
with breast carcinoma, who had undergone surgical treatment at the
‘Saint Savvas’ Anticancer Hospital of Athens, between February 2010
and March 2011. Each malignant and corresponding normal tissue
sample was divided into two pieces. One of these was snap-frozen in
liquid nitrogen immediately after the surgical resection and stored
at −80°C until the relevant assays were performed, and the second
was histopathologically characte rized in order to confirm the
presence of malignancy.
A detailed database, containing clinical and
pathological information concerning each patient was also provided
for statistical analysis. None of the patients had received
preoperative treatment. The age range was from 31 to 89 years with
a median of 60 years. Tumor sizes ranged from 0.5 to 8.5 cm with a
median of 2.4 cm. Clinical staging was performed according to the
Tumor-Node-Metastasis (TNM) classification system and histological
grade was determined according to the Bloom-Scarff-Richardson
grading system. ER, PgR and HER2 receptor status and Ki67 labeling
index (percentage of Ki67 positive cancer nuclei) were determined
by immunohistochemistry (IHC). ER and PgR immunostaining results
were reported using a semi-quantitative immunohistochemical score
(Hscore) which incorporated both the staining intensity (i)
and the corresponding percentage of positive stained cells
(Pi) (25). The Hscore is
given by the equation Hscore = Σ (Pi * i/100) and
ranges from 0 to 3. The clinicopathological data obtained from the
pathology report such as age, tumor size, hormone receptors’ Hscore
and Ki67 proliferation index, are summarized in Table I.
 | Table IDistribution of numerical variables
of the study in breast cancer patients. |
Table I
Distribution of numerical variables
of the study in breast cancer patients.
| | | Percentiles
|
|---|
| Variables | Mean ± SEa | Range | 10 | 25 | 50 | 75 | 90 |
|---|
| CEACAM19 (RQ
units)b in cancer
tissues (n=143) | 0.542±0.071 | 0.008–5.19 | 0.008 | 0.019 | 0.182 | 0.708 | 1.52 |
| CEACAM19 (RQ
units)b in non-cancer
tissues (n=89) | 0.462±0.098 | 0.008–4.87 | 0.008 | 0.008 | 0.008 | 0.464 | 1.45 |
| Age (years) | 59.7±1.15 | 31.0–89.0 | 39.2 | 50.0 | 60.0 | 71.0 | 77.0 |
| Tumor size
(cm) | 2.70±0.129 | 0.50–8.50 | 1.40 | 1.80 | 2.40 | 3.10 | 5.32 |
| Ki67 proliferation
index (%) | 13.5±1.21 | 0.00–60.0 | 1.00 | 3.00 | 10.0 | 20.0 | 30.0 |
| CEA (ng/ml) | 2.54±0.376 | 0.20–31.1 | 0.680 | 1.10 | 1.88 | 2.90 | 4.40 |
| Estrogen receptor
(ER)c | 1.29±0.100 | 0.00–3.00 | 0.00 | 0.01 | 1.30 | 2.10 | 3.00 |
| Progesterone
receptor (PR)c | 0.765±0.086 | 0.00–3.00 | 0.00 | 0.00 | 0.100 | 1.67 | 2.50 |
All of the research procedures that took place
during the course of our study were performed according to the
ethical standards of the 1975 Declaration of Helsinki, as revised
in 2008, and were approved by the institutional review board of
‘Saint Savvas’ Anticancer Hospital. Moreover, written informed
consent was obtained from all BC patients participating in the
study.
Total RNA extraction, RNA quality
evaluation and cDNA synthesis
Specimens of 50–100 mg were cut from the frozen
breast tissue samples, with a prechilled scalpel without thawing,
and pulverized in liquid nitrogen. Then, the resulting homogeneous
powder was dissolved in 1 ml of TRI® Reagent (Ambion
Inc., Austin, TX, USA) and total RNA was extracted according to the
manufacturer’s protocol. All RNA samples were preserved with
RNA-Storage solution (Ambion Inc.) and stored at −80°C until use.
The concentration and purity of RNA were determined
spectrophotometrically at 260 and 280 nm, while its integrity was
assessed by agarose gel electrophoresis. Two micrograms of total
RNA from each sample were reverse-transcribed into first-strand
cDNA, in a 20 μl reaction mixture, using M-MLV Reverse
Transcriptase (Invitrogen, Life technologies, Carlsbad, CA, USA)
and Oligo(dT) primers.
Quantitative real-time polymerase chain
reaction (qRT-PCR)
Gene specific primers were designed for HPRT1
(hypoxanthine phosphoribosyltransferase 1, housekeeping gene) and
for CEACAM19, based on their published cDNA sequences in the
NCBI Sequence database (GenBank accession nos. NM_000194.2 for
HPRT1 and NM_020219.3 for CEACAM19), using the Primer
Express software (Applied Biosystems, Foster City, CA, USA). The
sequences of the HPRT1 primers were as follows: 5′-TGG AAA
GGG TGT TTA TTC CTC AT-3′ and 5′-ATG TAA TCC AGC AGG TCA GCA A-3′
resulting in a 151 bp PCR amplicon, whereas the sequences of the
CEACAM19 primers were: 5′-GAG GTC CAG GTA GCT GAA AAG A-3′
and 5′-GGA TAC AGC CGA GCA CAA GA-3′, generating a 222 bp PCR
amplicon.
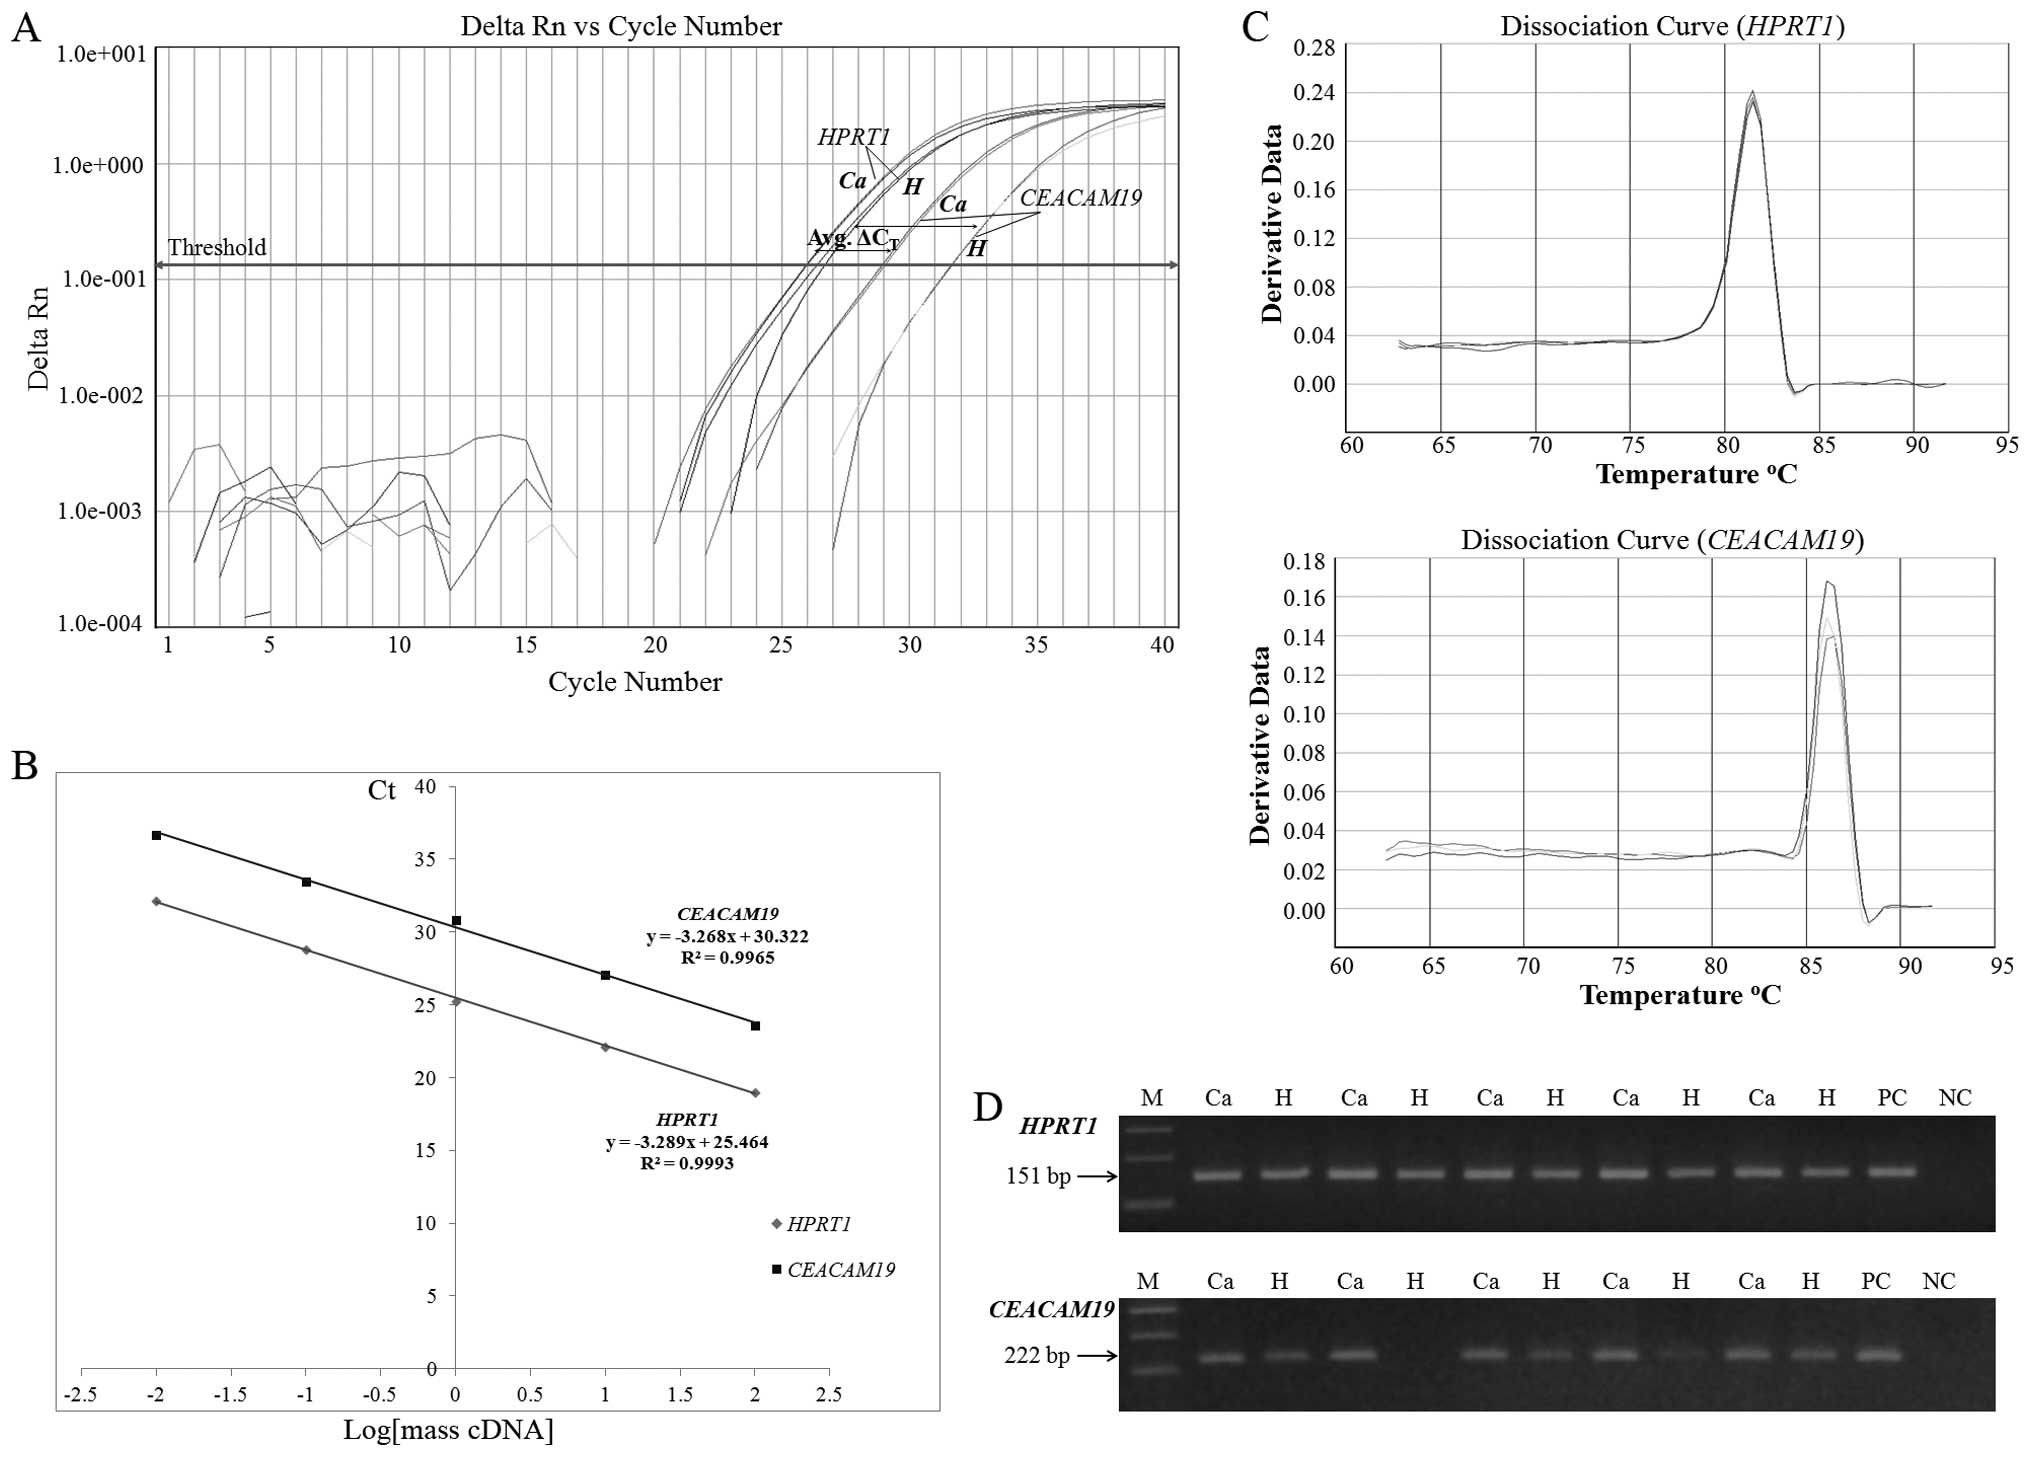
Real-time monitoring of the PCR reaction was
performed using a 7500 real-time PCR System (Applied Biosystems,
Inc.) and the SYBR-Green I chemistry (Fig. 1A). The reaction mixture consisted
of 10 ng of template cDNA, 5.0 μl KAPA SYBR® FAST
qPCR Master mix (Kapa Biosystems, Woburn, MA, USA), 1.0 μl
of each gene-specific primer (final concentration 75 nM each) and
the final reaction volume was adjusted to 10.0 μl, with
DEPC-treated water. The thermal protocol conditions were as
follows: an initial step of polymerase activation at 95°C for 3
min, followed by 40 cycles of denaturation at 95°C for 15 sec and
primer annealing and extension at 60°C for 1 min. Each sample was
amplified in triplicate, and the average Ct values were
calculated for the subsequent expression analysis. Following
amplification, dissociation curves were generated for
distinguishing the specific PCR products from non-specific products
and/or any primer-dimers, through their unique melting temperatures
(Tm) (Fig. 1C). Furthermore, in
order to confirm the amplification specificity, the qRT-PCR
products were electrophoresed on 3.0 % (w/v) agarose gel and
visualized, under UV light, after ethidium bromide staining
(Fig. 1D).
Gene expression analysis was performed using the
comparative Ct (2−ΔΔCt) method, to calculate
the relative quantification units (RQ units) for each sample.
HPRT1 served as an internal control gene for normalization
purposes, whereas the human breast cancer cell line BT-474 was used
as a calibrator allowing PCR comparison from distinct runs
(26). The ΔCt value
represents the difference between the threshold cycle
(Ct) of the target gene (CEACAM19) and the
Ct of the corresponding endogenous reference gene
(HPRT1) of a sample under study, while the ΔΔCt
value is the difference between the average ΔCt value of
an experimental sample and the average ΔCt of the
corresponding calibrator.
Statistical analysis
Our data were subjected to statistical analysis
using the SPSS software program (SPSS Inc., Chicago, IL, USA).
Differences between the relative expression levels of
CEACAM19 obtained from matched normal and tumor compartments
were tested using the Wilcoxon Signed Ranks test. Receiver
Operating Characteristic curve (ROC) was constructed for
CEACAM19 expression levels, by plotting sensitivity versus
(1-specificity), and the area under the ROC curve (AUC) was
analyzed by the Hanley and McNeil method. Logistic regression
analysis was used to calculate the odds ratio that defines the
relation between CEACAM19 expression and BC risk.
Correlations between different variables were assessed by the
Spearman correlation coefficient (rs). Furthermore, the
X-tile algorithm was applied in order to produce an optimal cutoff
value for CEACAM19(27),
since there are no established cutoff points regarding its
expression. Thus, an optimal cutoff point of 0.18 RQ units was
generated, which is equal to the 50th percentile. According to this
cutoff value, tumors were categorized as CEACAM19-positive
or CEACAM19-negative and associations between
CEACAM19 expression status and other qualitative
clinicopathological parameters were analyzed using the
χ2 test or the Fisher’s exact test, where appropriate.
Patients’ menopausal status was defined according to age as
follows: premenopausal (<55 years) and postmenopausal (>55
years). The cutoff values for CEA and CA15.3 serum levels were 5.0
ng/ml and 27 U/ml, respectively. ER and PgR status were considered
as negative if the Hscore was below the minimum cutoff value of
0.35 and 0.25, respectively. In case of HER2, IHC staining was
categorized as follows: 0, no staining; 1+, weak staining; 2+,
complete membrane staining that is either non-uniform or weak in
intensity; and 3+, intense staining of >30% of tumor cells.
Regarding Ki67 labeling index, a cutoff value of 14% was used, as
proposed by the recent Saint Gallen Consensus Conference
Guidelines, to distinguish tumors with low (<14%) and high
(>14%) proliferative fraction (28). A P-value of <0.05 was considered
as an indication of statistical significance.
Results
Validation of the comparative
Ct (2−ΔΔCt) method for CEACAM19 mRNA
quantification
A prerequisite for the application of the
comparative Ct (2−ΔΔCt) method is that the
PCR amplification efficiencies of the target (CEACAM19) and
the reference (HPRT1) gene are approximately equal and close
to 100% (26). In order to
determine PCR efficiencies for each gene, a validation experiment
was carried out, in which Ct values of CEACAM19
and HPRT1 were measured in serial dilutions of control cDNA
prepared from total RNA from BT-474 breast cancer cells, over a
100-fold range. A plot of Ct values versus log of cDNA
concentration was constructed for each gene and real-time PCR
efficiencies (E) were calculated from the given slopes, according
to the equation: E (%) = (10(−1/slope) − 1) × 100.
As illustrated in Fig.
1B, the slopes of HPRT1 and CEACAM19 plots, were
similar (−3.288 and −3.268, correspondingly), and the calculated
PCR amplification efficiencies were 101.4% (HPRT1) and
102.3% (CEACAM19), allowing the relative quantification by
the application of the 2−ΔΔCt formula.
Analysis of CEACAM19 relative expression
levels in breast tumors and non-malignant breast tissue
sections
Expression of the CEACAM19 gene was observed
in both cancerous and non-neoplastic breast tissue samples.
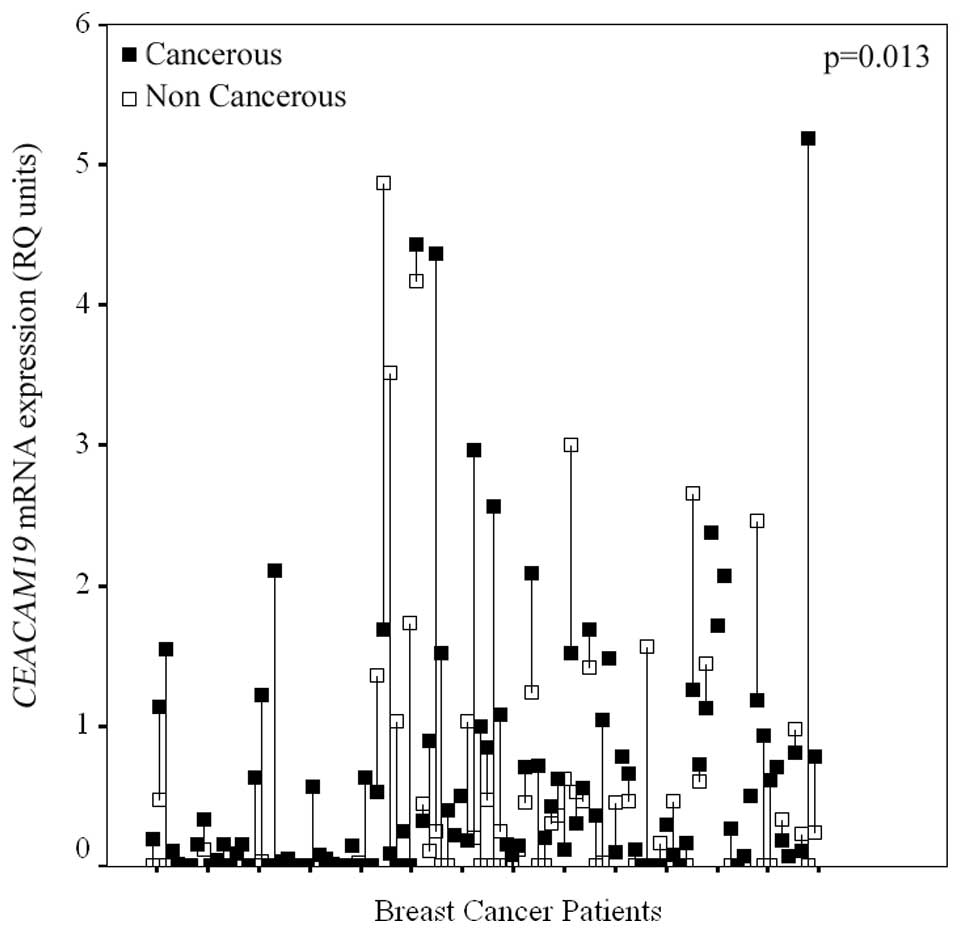
Interestingly, after examining CEACAM19 expression in the
cohort of the 89 paired breast tissue samples, a statistically
significant (p=0.013), CEACAM19 overexpression in cancerous
breast tissue sections compared to their normal counterparts, was
observed, in the majority of the patients. In more detail,
CEACAM19 expression levels were higher in the cancerous
tissue compared to the matched non-cancerous component in 59.55% of
the paired samples, whereas only 23.59% of the paired tissues
showed lower CEACAM19 expression in the cancerous part
compared to their matched normal counterpart (Fig. 2).
Furthermore, relative quantification units (RQ
units) of CEACAM19 in cancerous specimens ranged from 0.008
to 5.19 RQ units with a mean (±SE) of 0.542 (±0.071). In
non-cancerous breast tissue samples, CEACAM19 relative
expression levels varied from 0.008 to 4.87 RQ units with a mean
(±SE) of 0.462 (±0.098). The median (50th percentile) value of
CEACAM19 relative expression levels was found to be
approximately 23-fold higher in BC tissues (median: 0.182 RQ units)
compared to normal tissue specimens (median: 0.008 RQ units)
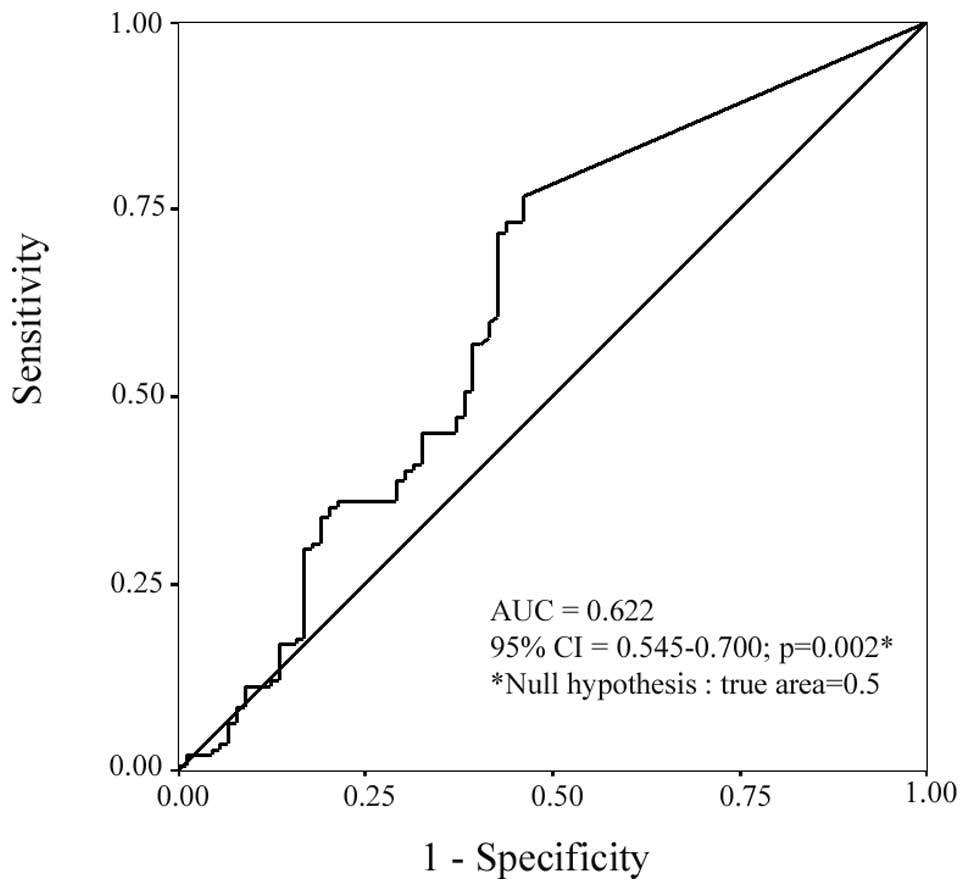
(Table I). ROC curve analysis
(Fig. 4), revealed a statistically
significant (p=0.002) value of CEACAM19 expression in
differentiating malignant from non-malignant breast tissues (AUC,
0.622; 95% CI=0.545–0.700). Additionally, logistic regression
analysis demonstrated that CEACAM19 expression was
significantly associated with BC risk, since an elevation in
CEACAM19 expression levels is associated with increased risk
of suffering from BC (odds ratio, 1.39, 95% CI=1.03–1.86,
p=0.027).
CEACAM19 expression status in BC tissues
and its association with clinicopathological features of breast
cancer patients
The median value of the CEACAM19 relative
expression levels (0.18 RQ units), was adopted as an optimal cutoff
point, in order to investigate the possible relationship between
the CEACAM19 expression status of the tumors
(CEACAM19-positive or CEACAM19-negative) with the
clinical and pathological data obtained from the BC patients
(Table II).
| Table IIRelationships between CEACAM19
expression status and clinicopathological variables. |
Table II
Relationships between CEACAM19
expression status and clinicopathological variables.
| | No. of patients (%)
| |
|---|
| Variable | Total |
CEACAM19-negativea |
CEACAM19-positivea | P-value |
|---|
| Tumor grade | | | | 0.031b |
| I | 7 | 6 (85.7) | 1 (14.3) | |
| II | 86 | 46 (53.5) | 40 (46.5) | |
| III | 34 | 12 (35.3) | 22 (64.7) | |
| X | 16 | | | |
| Tumor stage | | | | 0.971b |
| I | 42 | 21 (50.0) | 21 (50.0) | |
| II | 74 | 37 (50.0) | 37 (50.0) | |
| III | 15 | 8 (53.3) | 7 (46.7) | |
| X | 12 | | | |
| Ki67 proliferative
index | | | | 0.038c |
| Low proliferative
fraction | 64 | 37 (57.8) | 27 (42.2) | |
| High
proliferative fraction | 48 | 18 (37.5) | 30 (62.5) | |
| X | 31 | | | |
| CEA | | | | 1.00c |
| Negative | 83 | 41 (49.4) | 42 (50.6) | |
| Positive | 4 | 2 (50.0) | 2 (50.0) | |
| X | 56 | | | |
| CA 15-3 | | | | 0.470c |
| Negative | 68 | 34 (50.0) | 34 (50.0) | |
| Positive | 23 | 9 (39.1) | 14 (60.9) | |
| X | 52 | | | |
| ER-status | | | | 0.018c |
| Negative | 46 | 16 (34.8) | 30 (65.2) | |
| Positive | 84 | 48 (57.1) | 36 (42.9) | |
| X | 13 | | | |
| PgR-status | | | | 1.00c |
| Negative | 68 | 34 (50.0) | 34 (50.0) | |
| Positive | 63 | 32 (50.8) | 31 (49.2) | |
| X | 12 | | | |
| Menopausal
status | | | | 0.016c |
|
Premenopausal | 33 | 10 (30.3) | 23 (69.7) | |
|
Postmenopausal | 106 | 59 (55.7) | 47 (44.3) | |
| X | 4 | | | |
| HER2 status | | | | 0.847b |
| 0 | 71 | 35 (49.3) | 36 (50.7) | |
| 1+ | 19 | 9 (47.4) | 10 (52.6) | |
| 2+ | 13 | 8 (61.5) | 5 (38.5) | |
| 3+ | 19 | 9 (47.4) | 10 (52.6) | |
| X | 21 | | | |
As far as the tumors’ histological grade is
concerned, CEACAM19 levels were significantly (p=0.031)
elevated in poorly differentiated tumors (Grade III), compared to
those of well and moderate differentiation states (Grade I/II).
Specifically, CEACAM19-positivity was more often found in
Grade III (64.7%) tumors than in Grade I (14.3%) and Grade II
(46.5%) tumors. Beside the histological grade, a statistically
significant positive association between CEACAM19 expression
status and Ki67 labeling index (p=0.038), was also revealed. More
precisely, 62.5% of the tumors with high proliferative fraction
were found to be CEACAM19-positive, whereas only 42.2% of
those with low proliferative fraction were detected with
CEACAM19 expression levels above the adopted cutoff value.
On the other hand, CEACAM19 expression status was not
associated with tumor stage, HER2 status, and CEA or CA15.3 serum
levels.
Furthermore, as indicated by our results,
CEACAM19 mRNA expression status was negatively associated
with the estrogen receptors as well as the patients’ menopausal
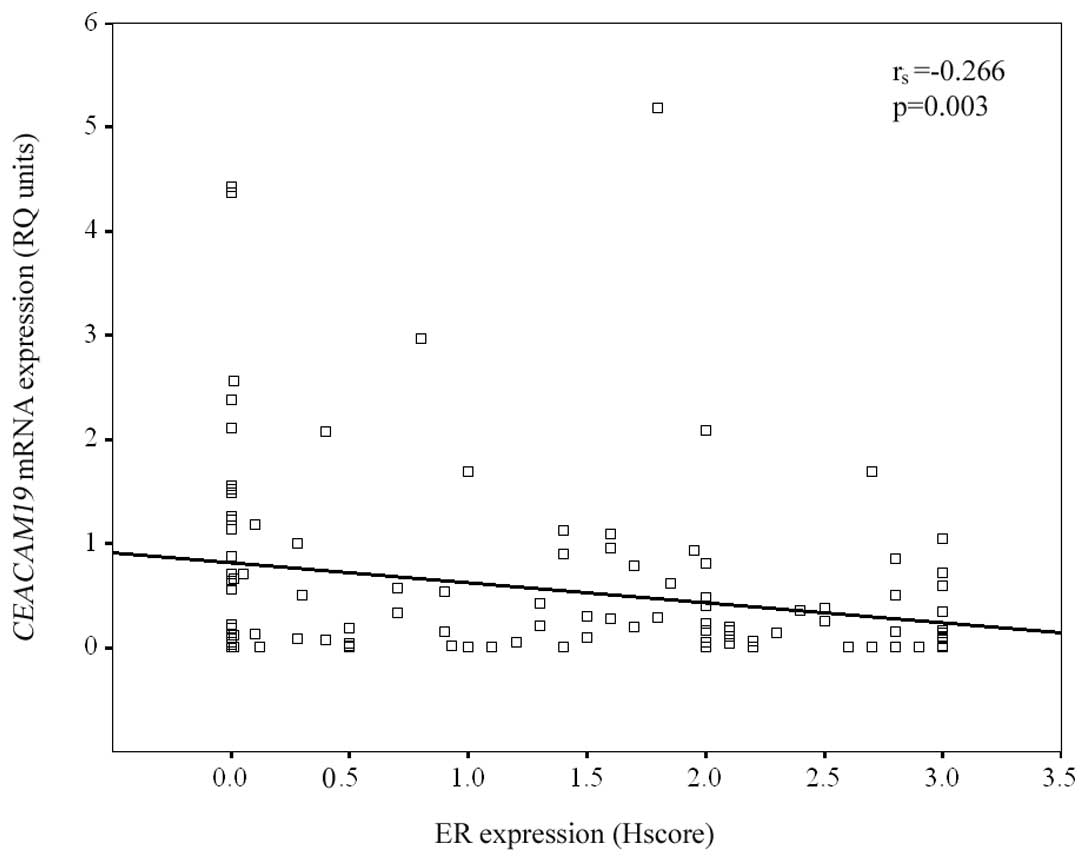
status, to a statistically significant degree. In particular,
regarding ER-status, CEACAM19 mRNA levels were found to be
significantly (p=0.018) higher in tumors with ER-negative staining,
compared to ER-positive tumors. CEACAM19-positivity was more
frequently found in ER-negative tumors (65.2%) than in ER-positive
tumors (42.9%). The negative association between CEACAM19
expression and ER expression status was also supported by the
calculated negative Spearman correlation coefficient
(rs= −0.266; p=0.003) (Fig.
3). On the contrary, no significant association was observed
between CEACAM19 expression and PgR status. In addition,
CEACAM19-positivity was found significantly (p=0.016) more
often in tumors derived from premenopausal women (69.7%), than in
those obtained from postmenopausal women (44.3%).
Taken together, these data strongly suggest that
higher CEACAM19 expression is associated with several
indicators of aggressive tumor behavior and poor clinical outcome
in BC patients, including high histological grade (Grade III), high
tumor proliferative index (Ki67 labeling index), ER-negative status
and patients’ premenopausal state.
Discussion
Breast cancer (BC), the most common malignancy which
affects the female population, constitutes a major cause of
morbidity and mortality, globally. Despite extensive research
efforts in the field of biomedical BC research, early diagnosis and
management of BC patients, still face major challenges (1). Therefore, it is increasingly apparent
that the identification of new and more reliable tumor molecular
markers, which can be used either solely or in suitable
combinations with other biomarkers and/or clinical parameters, can
aid the differential diagnosis, accurate prognosis and treatment
tailoring of BC patients. This approach could provide a clinically
relevant solution in order to control this extremely heterogeneous
disease.
Breast tumor biomarkers can be found among molecules
that take part in key-processes often characterized as the
hallmarks of cancer. Members of the CEACAM subfamily are known to
be involved in various aspects of tumor progression and metastasis
by affecting both intercellular adhesion and intracellular
signaling (4,8) and thus, represent one example of such
molecules. Indeed, CEA, the prototypic member of the CEACAM
subfamily, is one of the first known and most widely used tumor
markers in clinical management of patients with colorectal, breast
or lung cancer (19). In addition,
other CEACAM members may also possess clinical utility as
prognostic/predictive markers for a panel of human malignancies,
including BC. Interestingly, CEACAM6 protein expression is an
important predictor of subsequent invasive BC development, in
patients with precancerous lesions (29) and of future recurrence in
endocrine-resistant breast tumors (30). Additionally, altered splicing of
CEACAM1 was observed in BC and aberrant expression of its
splice variants in cancerous compared to normal breast tissue may
have an important prognostic value for this malignancy (31).
Given the above, we sought to analyze
CEACAM19 mRNA expression in breast tumors and matched
adjacent normal breast tissue sections. The objective of this study
was to investigate whether CEACAM19 expression levels have a
clinical value in the discrimination of cancerous from
non-cancerous breast tissues and to further assess any possible
relationship between CEACAM19 expression and
clinicopathological variables of BC patients. To the best of our
knowledge, this is the first study examining quantitatively
CEACAM19 expression and its clinical value, in a large
cohort of clinical breast tissue samples.
According to our data, CEACAM19 mRNA
expression was detected in both cancerous and non-cancerous breast
tissue specimens. However, in the cohort of the 89 paired breast
tissue samples, CEACAM19 was significantly overexpressed
(p=0.013) in the cancerous breast tissue compared to their matched
normal counterparts. The majority of the paired samples (59.55%)
were found with higher CEACAM19 expression in cancer versus
normal tissue, whereas only 23.59% of the paired tissues showed
lower CEACAM19 expression in cancer compared to the normal
tissue parts. Furthermore, the median value of CEACAM19
relative expression levels was approximately 23-fold higher in BC
tissues compared to normal tissue specimens (Table I). Additionally, ROC curve analysis
revealed that CEACAM19 is differentially expressed, at a
statistically significant degree (p=0.002), and can be used for the
discrimination of malignant from non-malignant breast tissues
(Fig. 4). Moreover, logistic
regression analysis demonstrated that patients with high
CEACAM19 expression levels were at increased risk of
suffering from BC (p=0.027). These results are in agreement with a
preliminary study that demonstrated that CEACAM19 expression
is lower in normal, compared to cancerous breast and ovarian tissue
samples (20). Furthermore, our
observation that CEACAM19 is overexpressed in BC tissue
samples is consistent with the upregulation of other CEACAM family
members in BC and in other carcinomas (12), and further suggests the possible
involvement of the CEACAM19 molecule in breast tumor
pathobiology.
In the present study, CEACAM19 expression was
also scrutinized for its prognostic value, which could arise from
any relationships with the clinicopathological data of the patients
examined (Table II). Intriguingly,
this analysis revealed a statistically significant positive
association between CEACAM19 expression status with tumor
grade (p= 0.031). This finding suggests that CEACAM19
expression may provide valuable information for more detailed
molecular discrimination between low- and high-grade tumors.
Furthermore, our observation is in agreement with different
studies, which showed that the expression of other subfamily
members is often associated with tumor grade. In particular, in
gastric cancer, CEACAM7 protein expression is more frequently found
in poorly differentiated compared to well and moderately
differentiated gastric carcinomas (32). Additionally, CEA and CEACAM6
expression in colorectal cancer correlates inversely with the
degree of cellular differentiation (33). It is also possible that deregulated
expression of CEACAM19 may disrupt cellular differentiation
during tumor progression. This assumption is supported by earlier
studies which provide evidence that deregulated overexpression of
several CEACAM members, such as CEA and CEACAM6, are capable of
inhibiting cellular differentiation in many cell types (33).
Another important finding of the present study is
the statistically significant positive association (p=0.038)
between CEACAM19 expression status with tumor Ki67 labeling
index. This observation is consistent with the association of
CEACAM19 expression with high histological grade, since high
Ki67 protein expression is in consonance with higher tumor grade.
Notably, high Ki67 proliferative index is an established indicator
of aggressive tumor behavior and increased risk of relapse and
death in BC patients (21).
Therefore, this observation discloses another proof that
CEACAM19 expression is associated with manifestations of
poor prognosis and suggests that its upregulated expression may
contribute to the aggressive nature of high Ki67 tumors by
promoting cellular proliferation. Supporting this notion, a recent
study has shown that CEACAM6 may act as an inducer of cellular
proliferation in a subpopulation of A549 human lung cells, and its
expression is also associated with Ki67-positive staining (13). Additionally, in accordance with our
results, a different research group demonstrated that the
expression of another member of the subfamily, CEACAM1, in
pancreatic endocrine tumors is strongly associated with high Ki67
labeling index (34).
Another point to be addressed is the significant
negative association between CEACAM19 expression status and
the tumors’ ER status (p=0.018), given that
CEACAM19-positivity, was more frequently found in
ER-negative compared to ER-positive tumors. It is well known that
ER-negative breast carcinomas are a distinct group of tumors with
poor prognosis, due to their resistance to hormonal therapies
(21). Thus, our findings give
additional evidence that CEACAM19 is associated with poor
prognosis. This raises the possibility that, CEACAM19
expression assessment, may serve as a clinically useful tool for
predicting tumor response to hormone therapy. Supporting this
hypothesis, a different study has previously shown that CEACAM6, is
significantly overexpressed in tamoxifen resistant breast tumors
that subsequently relapse, and stable silencing of the
CEACAM6 gene, partially restores hormone sensitivity in
model systems, in vitro(30). Therefore, CEACAM19,
similarly to CEACAM6, may represent a novel therapeutic
target, in certain subgroups of BC patients, for example those who
are ER-negative. Besides, our results revealed that breast tumors
derived from premenopausal women, that are known to have poorer
outcome, as well as more aggressive tumors (35), were significantly (p= 0.016) more
frequently found to be CEACAM19-positive, compared to those
obtained from postmenopausal women.
In conclusion, our data demonstrate that
significantly higher CEACAM19 expression levels are found in
breast tumors compared to their corresponding normal counterparts.
Moreover, CEACAM19 expression status is associated with
tumor grade and Ki67 proliferative index and negatively related to
ER status and patients’ menopausal state. Therefore, our overall
findings provide the first evidence that CEACAM19 expression
is associated with certain clinicopathological features indicative
of poor prognosis in BC patients and suggest that CEACAM19,
in combination with other established markers, may serve as a
valuable tool in the early diagnosis and prognosis of BC. A large
scale clinical study, incorporating patient follow-up data, is our
main future goal in order to further strengthen the clinical value
of this promising biomarker.
Acknowledgements
This study was carried out with the
financial support of the Commission of the European Community
through the INsPiRE project (EU-FP7-REGPOT-2011-1, proposal
284460).
References
|
1.
|
Jemal A, Bray F, Center MM, Ferlay J, Ward
E and Forman D: Global cancer statistics. CA Cancer J Clin.
61:69–90. 2011. View Article : Google Scholar
|
|
2.
|
Weigelt B, Peterse JL and van’t Veer LJ:
Breast cancer metastasis: markers and models. Nat Rev Cancer.
5:591–602. 2005. View
Article : Google Scholar : PubMed/NCBI
|
|
3.
|
Bogenrieder T and Herlyn M: Axis of evil:
molecular mechanisms of cancer metastasis. Oncogene. 22:6524–6536.
2003. View Article : Google Scholar : PubMed/NCBI
|
|
4.
|
Kuespert K, Pils S and Hauck CR: CEACAMs:
their role in physiology and pathophysiology. Curr Opin Cell Biol.
18:565–571. 2006. View Article : Google Scholar : PubMed/NCBI
|
|
5.
|
Obrink B: CEA adhesion molecules:
multifunctional proteins with signal-regulatory properties. Curr
Opin Cell Biol. 9:616–626. 1997. View Article : Google Scholar : PubMed/NCBI
|
|
6.
|
Gray-Owen SD and Blumberg RS: CEACAM1:
contact-dependent control of immunity. Nat Rev Immunol. 6:433–446.
2006. View
Article : Google Scholar : PubMed/NCBI
|
|
7.
|
Huang J, Hardy JD, Sun Y and Shively JE:
Essential role of biliary glycoprotein (CD66a) in morphogenesis of
the human mammary epithelial cell line MCF10F. J Cell Sci.
112:4193–4205. 1999.PubMed/NCBI
|
|
8.
|
Horst AK and Wagener C: CEA-Related CAMs.
Handb Exp Pharmacol. 283–341. 2004. View Article : Google Scholar
|
|
9.
|
Nittka S, Gunther J, Ebisch C,
Erbersdobler A and Neumaier M: The human tumor suppressor CEACAM1
modulates apoptosis and is implicated in early colorectal
tumorigenesis. Oncogene. 23:9306–9313. 2004. View Article : Google Scholar : PubMed/NCBI
|
|
10.
|
Singer BB, Scheffrahn I and Obrink B: The
tumor growth-inhibiting cell adhesion molecule CEACAM1 (C-CAM) is
differently expressed in proliferating and quiescent epithelial
cells and regulates cell proliferation. Cancer Res. 60:1236–1244.
2000.
|
|
11.
|
Duxbury MS, Ito H, Zinner MJ, Ashley SW
and Whang EE: CEACAM6 gene silencing impairs anoikis resistance and
in vivo metastatic ability of pancreatic adenocarcinoma cells.
Oncogene. 23:465–473. 2004. View Article : Google Scholar : PubMed/NCBI
|
|
12.
|
Blumenthal RD, Leon E, Hansen HJ and
Goldenberg DM: Expression patterns of CEACAM5 and CEACAM6 in
primary and metastatic cancers. BMC Cancer. 7:22007. View Article : Google Scholar : PubMed/NCBI
|
|
13.
|
Singer BB, Scheffrahn I, Kammerer R,
Suttorp N, Ergun S and Slevogt H: Deregulation of the CEACAM
expression pattern causes undifferentiated cell growth in human
lung adenocarcinoma cells. PLoS One. 5:e87472010. View Article : Google Scholar : PubMed/NCBI
|
|
14.
|
Chevinsky AH: CEA in tumors of other than
colorectal origin. Semin Surg Oncol. 7:162–166. 1991. View Article : Google Scholar : PubMed/NCBI
|
|
15.
|
Chan CH and Stanners CP: Recent advances
in the tumour biology of the GPI-anchored carcinoembryonic antigen
family members CEACAM5 and CEACAM6. Curr Oncol. 14:70–73. 2007.
View Article : Google Scholar : PubMed/NCBI
|
|
16.
|
Hostetter RB, Campbell DE, Chi KF, et al:
Carcinoembryonic antigen enhances metastatic potential of human
colorectal carcinoma. Arch Surg. 125:300–304. 1990. View Article : Google Scholar : PubMed/NCBI
|
|
17.
|
Blumenthal RD, Hansen HJ and Goldenberg
DM: Inhibition of adhesion, invasion, and metastasis by antibodies
targeting CEACAM6 (NCA-90) and CEACAM5 (Carcinoembryonic Antigen).
Cancer Res. 65:8809–8817. 2005. View Article : Google Scholar : PubMed/NCBI
|
|
18.
|
Jantscheff P, Terracciano L, Lowy A, et
al: Expression of CEACAM6 in resectable colorectal cancer: a factor
of independent prognostic significance. J Clin Oncol. 21:3638–3646.
2003. View Article : Google Scholar : PubMed/NCBI
|
|
19.
|
Ballesta AM, Molina R, Filella X, Jo J and
Gimenez N: Carcinoembryonic antigen in staging and follow-up of
patients with solid tumors. Tumour Biol. 16:32–41. 1995. View Article : Google Scholar : PubMed/NCBI
|
|
20.
|
Scorilas A, Chiang PM, Katsaros D, Yousef
GM and Diamandis EP: Molecular characterization of a new gene,
CEAL1, encoding for a carcinoembryonic antigen-like protein with a
highly conserved domain of eukaryotic translation initiation
factors. Gene. 310:79–89. 2003. View Article : Google Scholar
|
|
21.
|
Weigel MT and Dowsett M: Current and
emerging biomarkers in breast cancer: prognosis and prediction.
Endocr Relat Cancer. 17:R245–R262. 2010. View Article : Google Scholar : PubMed/NCBI
|
|
22.
|
Harris L, Fritsche H, Mennel R, et al:
American Society of Clinical Oncology 2007 update of
recommendations for the use of tumor markers in breast cancer. J
Clin Oncol. 25:5287–5312. 2007. View Article : Google Scholar : PubMed/NCBI
|
|
23.
|
Henderson IC and Patek AJ: The
relationship between prognostic and predictive factors in the
management of breast cancer. Breast Cancer Res Treat. 52:261–288.
1998. View Article : Google Scholar : PubMed/NCBI
|
|
24.
|
Bertos NR and Park M: Breast cancer - one
term, many entities? J Clin Invest. 121:3789–3796. 2011. View Article : Google Scholar : PubMed/NCBI
|
|
25.
|
Kinsel LB, Szabo E, Greene GL, Konrath J,
Leight GS and McCarty KS Jr: Immunocytochemical analysis of
estrogen receptors as a predictor of prognosis in breast cancer
patients: comparison with quantitative biochemical methods. Cancer
Res. 49:1052–1056. 1989.PubMed/NCBI
|
|
26.
|
Livak KJ and Schmittgen TD: Analysis of
relative gene expression data using real-time quantitative PCR and
the 2(−Delta Delta C(T)) method. Methods. 25:402–408. 2001.
|
|
27.
|
Camp RL, Dolled-Filhart M and Rimm DL:
X-tile: a new bioinformatics tool for biomarker assessment and
outcome-based cut-point optimization. Clin Cancer Res.
10:7252–7259. 2004. View Article : Google Scholar : PubMed/NCBI
|
|
28.
|
Goldhirsch A, Wood WC, Coates AS, Gelber
RD, Thurlimann B and Senn HJ: Strategies for subtypes - dealing
with the diversity of breast cancer: highlights of the St. Gallen
International Expert Consensus on the Primary Therapy of Early
Breast Cancer 2011. Ann Oncol. 22:1736–1747. 2011. View Article : Google Scholar : PubMed/NCBI
|
|
29.
|
Poola I, Shokrani B, Bhatnagar R, DeWitty
RL, Yue Q and Bonney G: Expression of carcinoembryonic antigen cell
adhesion molecule 6 oncoprotein in atypical ductal hyperplastic
tissues is associated with the development of invasive breast
cancer. Clin Cancer Res. 12:4773–4783. 2006. View Article : Google Scholar : PubMed/NCBI
|
|
30.
|
Maraqa L, Cummings M, Peter MB, et al:
Carcinoembryonic antigen cell adhesion molecule 6 predicts breast
cancer recurrence following adjuvant tamoxifen. Clin Cancer Res.
14:405–411. 2008. View Article : Google Scholar : PubMed/NCBI
|
|
31.
|
Gaur S, Shively JE, Yen Y and Gaur RK:
Altered splicing of CEACAM1 in breast cancer: identification of
regulatory sequences that control splicing of CEACAM1 into long or
short cytoplasmic domain isoforms. Mol Cancer. 7:462008. View Article : Google Scholar : PubMed/NCBI
|
|
32.
|
Zhou J, Zhang L, Gu Y, et al: Dynamic
expression of CEACAM7 in precursor lesions of gastric carcinoma and
its prognostic value in combination with CEA. World J Surg Oncol.
9:1722011. View Article : Google Scholar : PubMed/NCBI
|
|
33.
|
Ilantzis C, DeMarte L, Screaton RA and
Stanners CP: Deregulated expression of the human tumor marker CEA
and CEA family member CEACAM6 disrupts tissue architecture and
blocks colonocyte differentiation. Neoplasia. 4:151–163. 2002.
View Article : Google Scholar
|
|
34.
|
Serra S, Asa SL, Bamberger AM, Wagener C
and Chetty R: CEACAM1 expression in pancreatic endocrine tumors.
Appl Immunohistochem Mol Morphol. 17:286–293. 2009. View Article : Google Scholar : PubMed/NCBI
|
|
35.
|
Fredholm H, Eaker S, Frisell J, Holmberg
L, Fredriksson I and Lindman H: Breast cancer in young women: poor
survival despite intensive treatment. PLoS One. 4:e76952009.
View Article : Google Scholar : PubMed/NCBI
|