Introduction
In the United States the incidence and mortality
rates from colorectal cancer (CRC) are higher in African Americans
(AAs) than for all other racial and ethnic groups (1). Socio-economic differences may
contribute to delayed detection of cancers. However, a relatively
recent study reported that despite receiving equal treatment and
after controlling for known prognostic factors, AAs with high-grade
tumors were three times more likely to die as a result of CRC than
Caucasian Americans (CAs) with high-grade tumors (2). The most recent population-based study
shows a 30–50% higher rate of disease-specific mortality after
diagnosis among AAs than in CAs (3–8) and
this disparity between the 2 groups has greatly widened in recent
years. This has occurred despite an increase of CRC screening for
both groups. Because one would not expect incidence rates to
increase with increased screening and/or detection, it is highly
unlikely that socioeconomic status and dietary factors, factors
normally attributed to this phenomenon, are the only determinants
of racial cancer disparity. Additionally, AAs are diagnosed with
CRC at a younger age than Caucasian Americans (CAs) (9). The observation that distinctive
mutations in mismatch repair genes hMLH1 and hMSH2 (10), high microsatellite instability
(MSI-H), and unique polymorphisms in the p53 tumor
suppressor gene (11) are more
prevalent in AA colon cancers than in CA colon cancers, lend
support to the concept that biological differences between AA and
CA tumors may contribute to increased mortality in AA patients.
miRNAs are frequently dysregulated in cancer and
have shown promise as tissue-based markers for cancer
classification and prognostication (12,13).
Initially synthesized as long primary transcripts, miRNA are
processed to small (17–22 nt) regulatory RNAs through a series of
steps. miRNAs control gene expression via specific sites at the
3′-UTR of their target mRNAs by accelerating mRNA degradation
and/or by repression of translation. A number of studies have
reported differential expression of miRNAs in paired colon cancer
tumor and adjacent normal colon samples (14–21).
miRNAs have also been shown to act either as oncogenes [e.g.,
miR-155, miR-17-5p and miR-21 (22,23)]
or as tumor suppressors [e.g., miR-15a, miR-16-1 and let-7
(24)]. In addition, other studies
have indicated that miRNAs are involved in tumor migration and
invasion (25). Together, these
findings support the premise that the dysregulation of miRNAs can
lead to the development of cancer.
In this investigation, microarray analysis and
qRT-PCR technologies are used to determine whether miRNA levels are
disproportionately expressed in the tumors of AA CRC patients as
compared to those of CA CRC patients. In this study, we report the
identification of miR-182 as a potential candidate that may
contribute to increased colon cancer mortality in AA compared to CA
patients.
Materials and methods
Ethics statement
This study was approved by the Washington University
School (WU) of Medicine-St. Louis and Stony Brook University (SBU)
Institutional Review Boards. Tissues were banked at the SBU
(http://www.stonybrookmedicalcenter.org/pathology/biobank)
and WU (http://www.siteman.wustl.edu/ContentPage.aspx?id=243)
human bio-specimen bio-banks. The samples and clinical metadata
were de-identified, assigned a patient code and a sample code prior
to release to the researchers and qualified for a waiver of consent
per 45CFR46.116.d.
Demographics of colon cancer
subjects
The available clinical metadata for the WU samples
were limited to age at the time of surgical resection of the tumor,
gender (male vs. female) and race (AA or CA). Paired tumor and
normal colon RNA samples were prepared from 30 AA and 31 CA
subjects. The average age of the CA (63.4±3.5) and AA (61.3±3.6)
subjects were not significantly different. Similarly, the gender
distribution was not significantly different for AA (15 male, 14
female and 1 unspecified) and CA (17 male and 14 female)
patients.
Extraction of RNA from SBU and WU colon
cancer tumor and adjacent normal colon tissue samples
For the SBU samples, sections of 30 pairs of
formalin-fixed paraffin-embedded (FFPE) tumor and adjacent normal
colon tissues were obtained through the Stony Brook Research
Histology Core Lab from 15 CA and 15 AA colon cancer patients who
underwent colon cancer surgery at Stony Brook University Medical
Center. All SBU tissue sections were reviewed by a surgical
pathologist (K.R.S.). Tumor sections selected contained a minimum
of 70% neoplastic cells, ensuring that the majority of tissue
extracted was of neoplastic origin. The control samples were
adjacent normal colon tissue removed during colon resection. Total
RNA was isolated from three 10-μm thick tissue sections using a
miRNeasy FFPE kit (Qiagen, Valencia, CA). Briefly, tumor sections,
as determined morphologically by H&E staining, were removed
from slides by scraping with a scalpel blade. Paraffin was removed
from the sample using xylene and an ethanol wash. Cells were lysed
by digestion with proteinase K at 56°C for 15 min followed by
additional incubation at 80°C for 15 min. The supernatant was
treated with DNase, followed by the addition of Cell Lysis Buffer
and ethanol. Total RNA, including miRNA, was bound to an RNeasy
MinElute column (Qiagen). The column was washed twice with RPE
buffer (Qiagen) and total RNA eluted with RNase-free water.
For the WU sample set, total RNA were prepared by
and obtained from the Siteman Cancer Center Tissue Procurement
Facility at Washington University (WU)-St. Louis from 16 CA and 15
AA colon cancer patients who underwent colon cancer surgery at
Barnes Jewish Hospital. Here, total RNA was extracted from 31 pairs
of snap-frozen tumors and adjacent matching normal colon using
TRIzol followed by lithium precipitation (Invitrogen, Carlsbad, CA)
according to the manufacturer’s protocol. For all samples, RNA
quantity and quality was determined using a Nanodrop 2000C (Thermo
Scientific, Waltham, MA).
Agilent miRNA microarray analysis
Whole genome miRNA expression profiles for
predicting colon cancer risk with respect to race were acquired
using single color Agilent miRNA microarrays, release 16.0G4870A
6×60 K (Agilent Technologies, Foster City, CA). miRNAs were labeled
and hybridized using Agilent miRNA Complete Labeling and
Hybridization Kit (Agilent Technologies) in the Stony Brook
University Genomics Core Facility. Labeled miRNA was used to probe
and hybridize with Agilent Human Microarray Kit V3, 8×15 K arrays,
based on Sanger miRbase release 12.0 (G4470C, Agilent
Technologies). Hybridization was performed at 55°C for 20 h in a
hybridization oven (Agilent Technologies) according to the
manufacturer’s protocol. Hybridized microarrays were scanned with a
DNA microarray scanner (Agilent G2565BA), and features were
extracted using the Agilent Feature Extraction (AFE) image analysis
tool (version A.10.7.3.1) with default protocols and settings. To
ensure reliable results as to upregulation and downregulation in
the miRNAs of a given patient, paired tumor/normal matched samples
were run on the same array. All microarray data have been deposited
in the NCBI GEO database with accession number GSE48267.
Microarray preprocessing
The raw probe-level data were imported into
GeneSpring 12.5GX (Agilent Technologies), and the miRNA signal was
normalized using the default setting: threshold raw signal to 1.0,
percent shift to 90th percentile as the normalization algorithm,
and no baseline transformation. After normalization, the probes
were filtered using the gIsGeneDetected flag provided in Agilent
AFE software to remove miRNAs that were not detected in 60% of
tumor or 60% of adjacent normal colon samples. Two class analysis
of tumor vs. adjacent normal tissue RNA, AA tumor vs. CA tumor and
AA adjacent normal vs. CA adjacent normal were conducted using
Significance Analysis of Microarray (26) with a 1.5-fold change and FDR
<0.05 for significance.
qRT-PCR
For all samples, cDNA was synthesized from 100 ng of
total RNA using the Universal cDNA Synthesis Kit (Exiqon, Woburn,
MA). After cDNA conversion, quantification of candidate miRNAs
(miR-182 and miR204) was determined using commercial specific
microRNA LNA PCR primers (Exiqon). Real-time PCR was conducted
using Universal RT SYBR Green master mix (Exiqon) in a Realplex
real-time PCR machine (Eppendorf, Hauppauge, NY). Quantitative PCR
was done under the following cycling conditions: 95°C for 10 min,
and 45 cycles of 95°C for 10 s, 60°C for 1 min. All PCRs were done
in triplicate. Transcript normalization of samples was obtained
using miR-191 as a reference (27). The relative expression of the
candidate miRNAs was measured by the threshold cycle Ct miR-191-Ct
candidate miRNA. The effects of race, tumor, institutional source
and first order interactions were analyzed by RANOVA (see
below).
Immunohistochemistry
The SBU FFPE tissue sections were deparaffinized and
rehydrated according to standard protocols. Tissue sections were
pretreated for antigen retrieval by heating in a microwave oven for
15 min in a 0.01 M citric acid solution (pH 6.0). Staining of FFPE
colon specimens was performed according to the instructions for
rapid immunohistochemical staining using Histostain-Plus Bulk Kit
(Life Technologies, Grand Island, NY). Primary antibodies to FOXO1
(1:100 dilution/Cell Signaling Technology Inc., Davers, MA) and
FOXO3 (1:250/Cell Signaling Technology Inc.) were used to detect
these targets of miR-182 and miR-183. An isotypic antibody control
was included with each tissue section.
Scoring
A pathologist (N.O.), blinded to sample identity,
evaluated the SBU tissue sections. The ‘intensity of staining’ of
each tissue sample was scored using the following scale: 0, no
staining; 1, light staining; 2, medium staining; and 3, maximal
staining. Bootstrap RANOVA was used to determine significant
differences of FOXO1 and FOXO3a expression by
immunohistochemistry.
Statistical analysis
Repeated measures analysis of variance (RANOVA) was
implemented to evaluate significant effects in the model, with
tumor as a within-subjects effect and race and institutional source
of the RNA samples as between-subjects effects. Our analysis was
based on a mixed model with individual effect on miRNA expression
profile as a random effect, and tumor, race and data source as
fixed effects: Yhijk = μ + (Raceh +
Tumorj + Sourcek)2 +
Subi(kh) + ehijk.
Here Yhijk is the miRNA expression level
for subject i, of race indicator h (h=1 or 0 if the subject is AA
or CA, respectively), tumor indicator j (j=1 or 0 for tumor or
normal tissue, respectively), and source indicator k (k=1 or 0 for
SBU or WU, respectively). On the right hand side of the equation, μ
is the overall mean, followed by the race, tumor, source individual
effects, two-way and three-way interactions, the random subject
effect Subi(kh), and the random error ehijk
independent of Subi(kh). Constraints
∑hRaceh = ∑jTumorj =
∑kSourcek = 0 are imposed for
identifiability.
Since normality assumptions did not hold for these
datasets, a non-parametric bootstrap approach was adopted to
estimate the p-values (28). To
further enhance the robustness of the tests, we considered both the
p-values and the fold change to test for significance. The
threshold was set as fold change >1.5 and p<0.05 for main
effects. For interaction terms, the fold change threshold was set
at 1.5 for either the AA tumor/CA tumor or the AA normal/CA normal
ratio and the p-value threshold was set at 0.05.
Results
The effect of race and tumor on miRNA
expression
Our strategy for selecting candidate miRNAs that
could potentially be associated with biological differences between
AA and CA colon cancers was to analyze the effect of race and tumor
using RANOVA (see Materials and methods). Since the samples
obtained from SBU and WU included differences in i) geographic
location of the subjects; ii) processing and storage of the tissues
(FFPE vs. snap frozen); and iii) RNA isolation procedure, the
effect of institutional source was also included. While SAM
(26) is extremely robust for two
class comparisons, the advantage of RANOVA is that all three terms
and first order interactions could be incorporated in the
model.
The effect of the tumor was large compared to the
effects of race or institutional source. RANOVA identified 49
miRNAs that were upregulated and 40 miRNAs that were downregulated
in tumor vs. adjacent normal colonic tissue (Table I). This included the upregulation
of a number of miRNAs (e.g., miR-21, miR-31, miR-96 and miR-135b,
miR-182, miR-183) (14–19,29–34)
and downregulation of miRNAs (e.g., 133a and mir-1) (31) which were previously noted.
 | Table ImiRNAs that were significantly
upregulated and downregulated in tumor vs. paired adjacent normal
colon tissues. |
Table I
miRNAs that were significantly
upregulated and downregulated in tumor vs. paired adjacent normal
colon tissues.
| Upregulated
miRNA | Fold change
tumor/normal | p-value | Downregulated
miRNA | Fold change
tumor/normal | p-value |
|---|
| hsa-miR-135b | 46.25 | 0 | hsa-miR-133a | 0.04 | 0 |
| hsa-miR-183 | 20.00 | 0 | hsa-miR-139-5p | 0.07 | 0 |
| hsa-miR-31 | 17.05 | 0 |
hsa-miR-378* | 0.09 | 0 |
| hsa-miR-96 | 11.95 | 0 | hsa-miR-133b | 0.10 | 0 |
| hsa-miR-182 | 11.12 | 0 | hsa-miR-1 | 0.10 | 0 |
| hsa-miR-552 | 8.60 | 0 |
hsa-miR-30a* | 0.11 | 0 |
| hsa-miR-224 | 5.47 | 0 | hsa-miR-490-3p | 0.13 | 0 |
| hsa-miR-503 | 4.81 | 0 | hsa-miR-149 | 0.14 | 0 |
| hsa-miR-18a | 4.43 | 0 | hsa-miR-363 | 0.16 | 0 |
|
hsa-miR-17* | 3.90 | 0 |
hsa-miR-145* | 0.18 | 0 |
| hsa-miR-409-3p | 3.65 | 0 | hsa-miR-129-3p | 0.18 | 0 |
| hsa-miR-424 | 3.49 | 0 |
hsa-miR-143* | 0.21 | 0 |
| hsa-miR-203 | 3.42 | 0 | hsa-miR-145 | 0.23 | 0 |
| hsa-miR-18b | 3.38 | 0.001 | hsa-miR-218 | 0.23 | 0 |
| hsa-miR-7 | 3.36 | 0 | hsa-miR-204 | 0.28 | 0.004 |
|
hsa-miR-21* | 3.24 | 0 | hsa-miR-143 | 0.29 | 0 |
|
hsa-miR-629* | 3.15 | 0 |
hsa-miR-23b* | 0.29 | 0 |
| hsa-miR-19a | 2.98 | 0.001 |
hsa-miR-29c* | 0.31 | 0 |
|
hsa-miR-424* | 2.91 | 0 | hsa-miR-338-3p | 0.33 | 0 |
| hsa-miR-21 | 2.80 | 0 | hsa-miR-195 | 0.35 | 0 |
| hsa-miR-181c | 2.67 | 0.002 |
hsa-miR-24-1* | 0.41 | 0.002 |
|
hsa-miR-34b* | 2.58 | 0 | hsa-miR-30a | 0.41 | 0 |
| hsa-miR-148a | 2.48 | 0.003 | hsa-miR-662 | 0.42 | 0.003 |
| hsa-miR-34a | 2.28 | 0.02 | hsa-miR-497 | 0.42 | 0 |
| hsa-miR-221 | 2.27 | 0.001 | hsa-miR-99a | 0.44 | 0 |
| hsa-miR-146a | 2.18 | 0 | hsa-miR-451 | 0.46 | 0 |
| hsa-miR-301a | 2.16 | 0.002 | hsa-miR-28-3p | 0.48 | 0 |
| hsa-miR-501-3p | 2.16 | 0 |
hsa-miR-30e* | 0.49 | 0.01 |
| hsa-miR-1246 | 2.10 | 0.003 | hsa-miR-378 | 0.50 | 0 |
| hsa-miR-29b | 2.09 | 0.004 |
hsa-miR-125b-2* | 0.50 | 0.002 |
| hsa-miR-130b | 2.05 | 0 |
hsa-miR-149-2* | 0.51 | 0.006 |
| hsa-miR-663b | 2.04 | 0.001 | hsa-miR-610 | 0.52 | 0.015 |
| hsa-miR-20a | 2.03 | 0 |
hsa-miR-30c-1* | 0.53 | 0.005 |
| hsa-miR-296-5p | 2.03 | 0 | hsa-miR-100 | 0.56 | 0 |
| hsa-miR-17 | 1.95 | 0 | hsa-miR-30c | 0.57 | 0 |
| hsa-miR-92a | 1.89 | 0 |
hsa-miR-193b* | 0.59 | 0.044 |
| hsa-miR-429 | 1.85 | 0.007 | hsa-miR-28-5p | 0.62 | 0.006 |
| hsa-miR-19b | 1.83 | 0 | hsa-miR-125b | 0.62 | 0.002 |
| hsa-miR-335 | 1.78 | 0.018 | hsa-miR-365 | 0.66 | 0 |
| hsa-miR-1249 | 1.75 | 0.044 | hsa-let-7e | 0.66 | 0.002 |
| hsa-miR-141 | 1.73 | 0.035 | | | |
| hsa-miR-29a | 1.68 | 0 | | | |
| hsa-miR-142-3p | 1.66 | 0.016 | | | |
| hsa-miR-93 | 1.66 | 0 | | | |
| hsa-miR-663 | 1.65 | 0.002 | | | |
| hsa-miR-148b | 1.59 | 0.033 | | | |
| hsa-miR-425 | 1.58 | 0.046 | | | |
| hsa-miR-25 | 1.57 | 0 | | | |
| hsa-miR-1280 | 1.51 | 0 | | | |
As shown in Table
II, 4 miRNAs demonstrated significant race:tumor interaction
and 5 miRNAs showed both race and tumor main effects. Of the 5
miRNA with both race and tumor main effects, we noted the
prominence of miR-182 and miR-204, which were identified based on
RANOVA analysis of the SBU miRNA profiles alone (data not shown)
and confirmed by the combined data sets. miR-182 was upregulated
11.1-fold in paired tumor vs. normal tissue and was increased
2-fold in AA vs. CA tumors. miR-204 was downregulated 3.6-fold in
tumor vs. adjacent normal colonic tissue and increased 2.6-fold in
AA vs. CA tumors.
| Table IImiRNAs with significant race:tumor
interaction or both significant race and tumor main effects. |
Table II
miRNAs with significant race:tumor
interaction or both significant race and tumor main effects.
| Race:tumor | Race | Tumor | Source | Source:race | Source:tumor |
Source:race:tumor |
|---|
| miR-H1 | 0.016 | 0.225 | 0.001 | 0.16 | 0.099 | 0 | 0.033 |
| miR-210 | 0.022 | 0.226 | 0.001 | 0.074 | 0.441 | 0.297 | 0.049 |
| miR-128 | 0.036 | 0.754 | 0.013 | 0.001 | 0.491 | 0.8 | 0.555 |
| miR-200a | 0.048 | 0.452 | 0.022 | 0.278 | 0.974 | 0.905 | 0.262 |
| miR-152 | 0.57 | 0.012 | 0.014 | 0.013 | 0.671 | 0.323 | 0.444 |
| miR -204 | 0.948 | 0.013 | 0.004 | 0.239 | 0.288 | 0.841 | 0.325 |
| miR-182 | 0.959 | 0.015 | 0 | 0.569 | 0.074 | 0.809 | 0.856 |
| miR-222 | 0.665 | 0.017 | 0 | 0 | 0.332 | 0.065 | 0.196 |
| miR-202 | 0.164 | 0.045 | 0.017 | 0 | 0.018 | 0.021 | 0.661 |
miR-182 demonstrates a significant
race:tumor interactions based on qRT-PCR results
qRT-PCR using primers for 25 of the miRNAs which
were most differentially expressed was conducted to confirm results
of the miRNA microarray analysis. The miRNAs which exhibited
statistical significance as determined by RANOVA analysis were
mir-182 and miR-183 (Fig. 1).
Other miRNAs (i.e., miR-135b and miR-204) exhibited significant
difference between tumor and normal tissues only. Although the
increased expression, as determined by miRNA microarray, of miR-204
in AA tumors compared to CA tumors could not be confirmed by
qRT-PCR, our qRT-PCR analysis did confirm that of previous reports
indicating downregulation of miR-204 in tumor vs. normal
tissues.
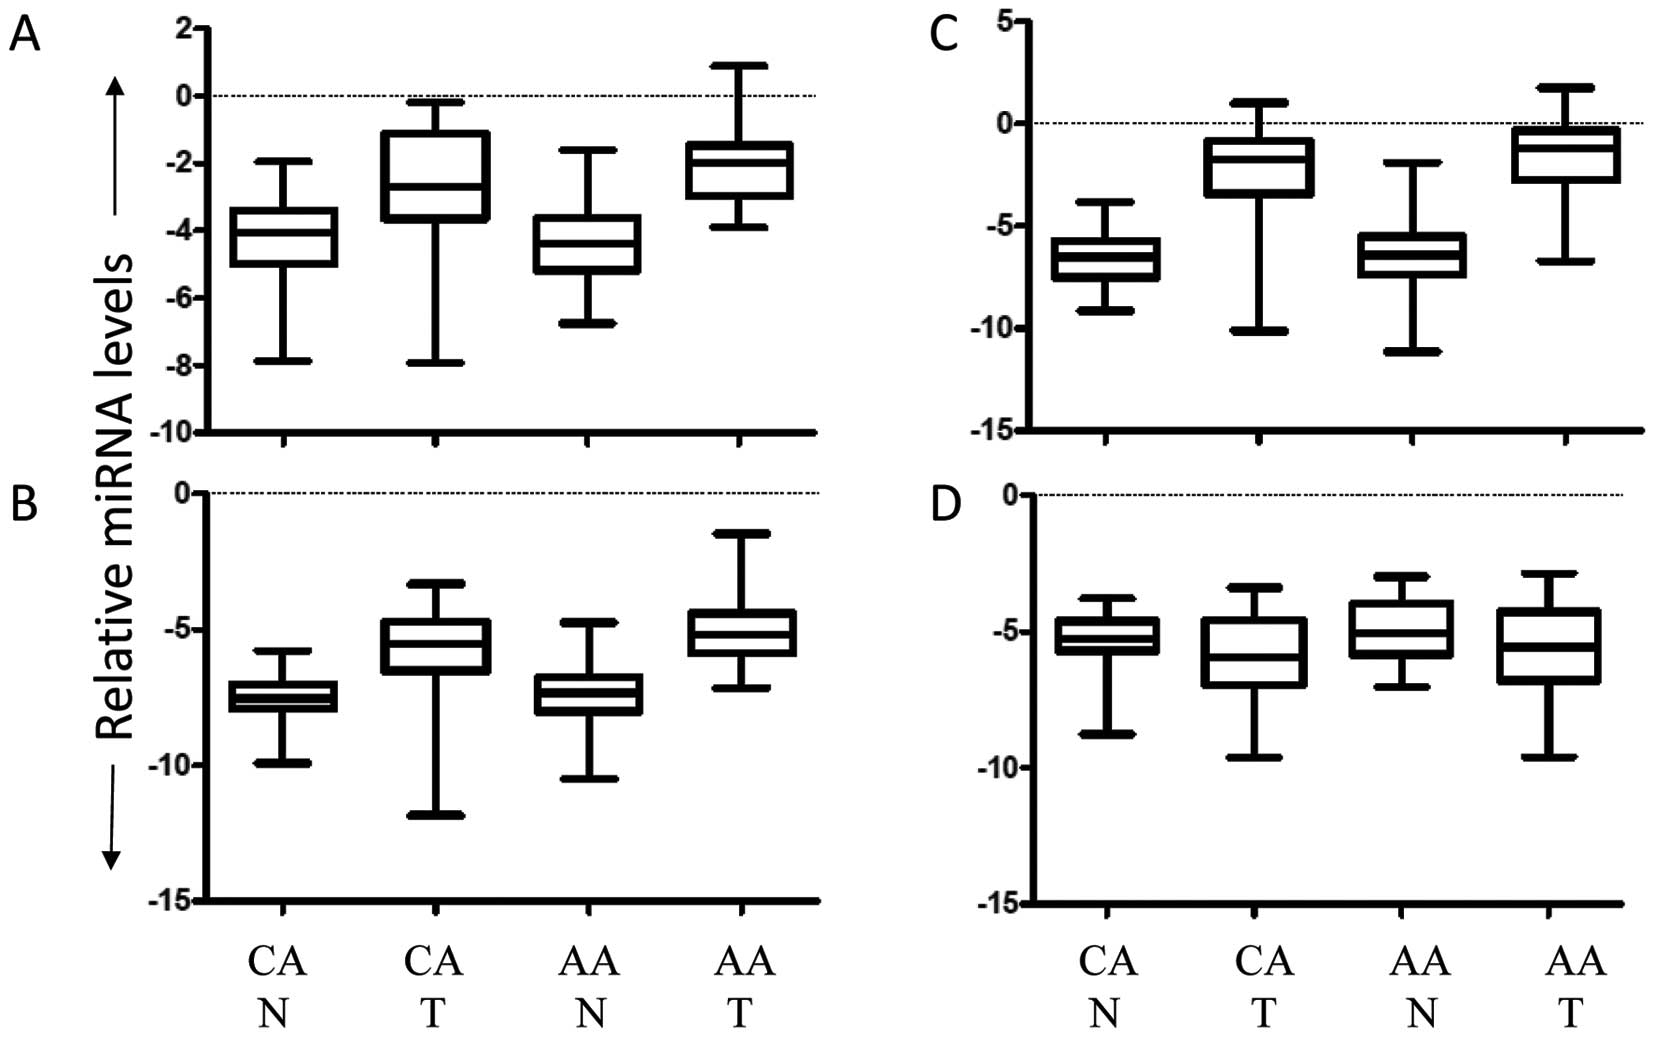 | Figure 1Confirmation by qRT-PCR analysis of
miRNAs that were most differentially expressed. qRT-PCR analysis
using primers for 25 of the most differentially expressed miRNAs
were evaluated. Statistical significance was determined by RANOVA
(p<0.05). Significance was as follows: (A) miR-182, CAN vs. AAT,
CAT vs. AAT and AAN vs. AAT. (B) miR-183, CAN vs. AAT, CAT vs. AAT
and AAT vs. AAN. (C) miR-135b, CAN vs. CAT and AAN vs. AAT. (D)
miR-204, CAN vs. CAT and AAN vs. AAT. Abbreviations: CA, Caucasian
American; AA, African American; T, tumor; and N, normal
adjacent. |
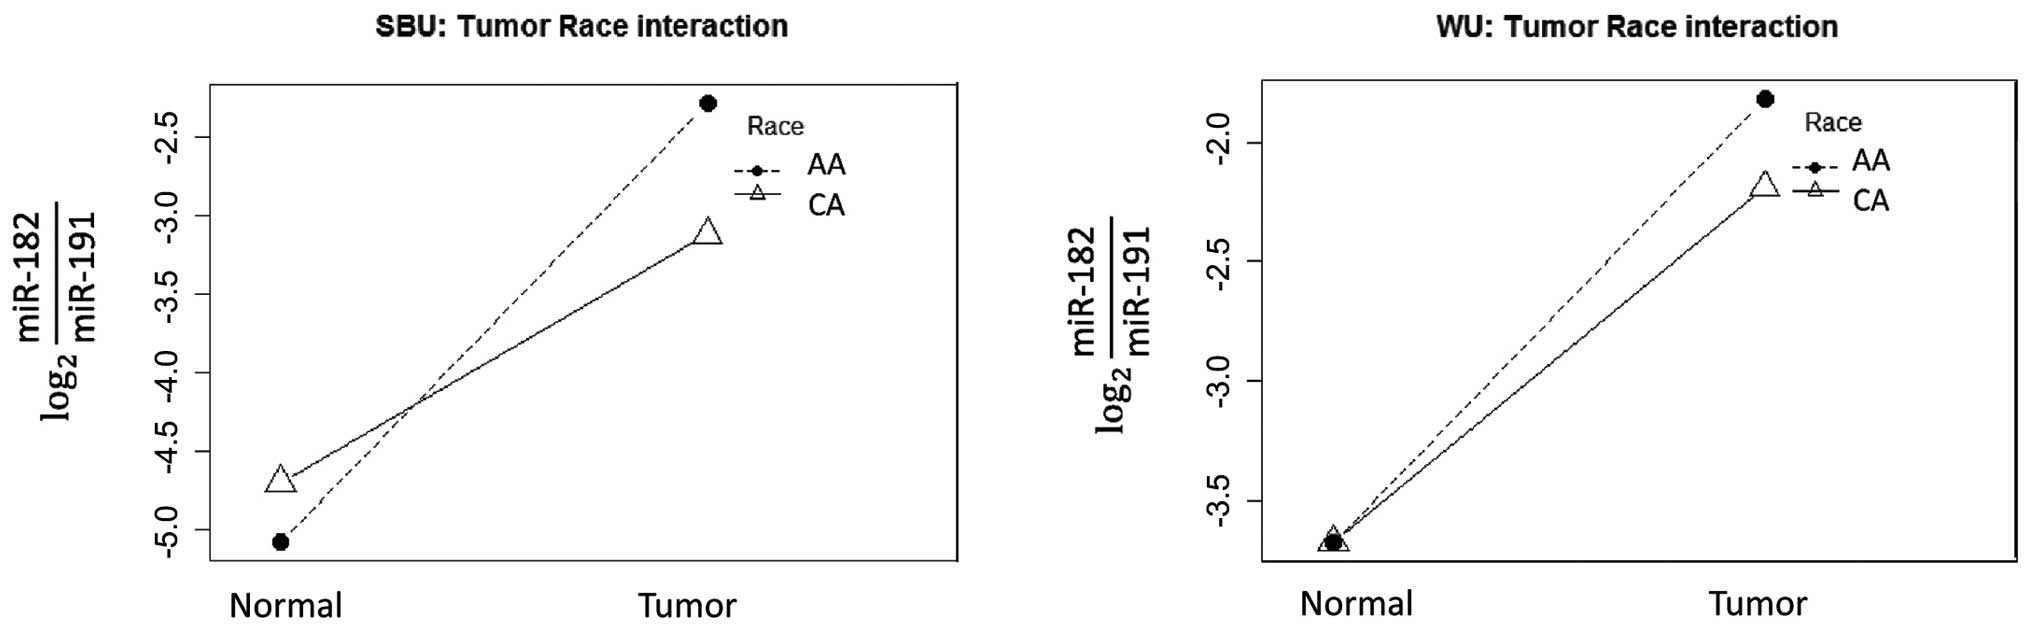
RANOVA analysis of only miR-182 and its cluster
partner, miR-183 demonstrated a significant race:tumor interaction
term (p<0.05, Table III). As
demonstrated in Fig. 2, the lines
connecting the paired tumor and normal tissues cross, thus
graphically demonstrating the interaction between race and tumor in
miR-182 qRT-PCR data. The relative level of miR-182 is much higher
in the tumor than in the paired adjacent normal colonic tissue. In
addition, the relative level of miR-182 is also consistently higher
in AA tumors compared to CA tumors in both the SBU and WU cohorts
singularly and in combination. Interestingly, there is little or no
difference in AA normal mucosa compared to the CA normal
tissue.
| Table IIIRANOVA analysis of qRT-PCR analysis
of selected miRNA expression relative to miR-191. |
Table III
RANOVA analysis of qRT-PCR analysis
of selected miRNA expression relative to miR-191.
| Race:tumor | Race | Tumor | Source | Source:race | Source:tumor |
Source:race:tumor |
|---|
| hsa-miR-182 | 0.001 | 0.325 | 0 | 0 | 0.905 | 0.058 | 0.266 |
| hsa-miR-204 | 0.439 | 0.898 | 0 | 0.038 | 0.028 | 0.053 | 0.788 |
| hsa-miR-183 | 0.048 | 0.048 | 0 | 0.473 | 0.473 | 0.189 | 0.943 |
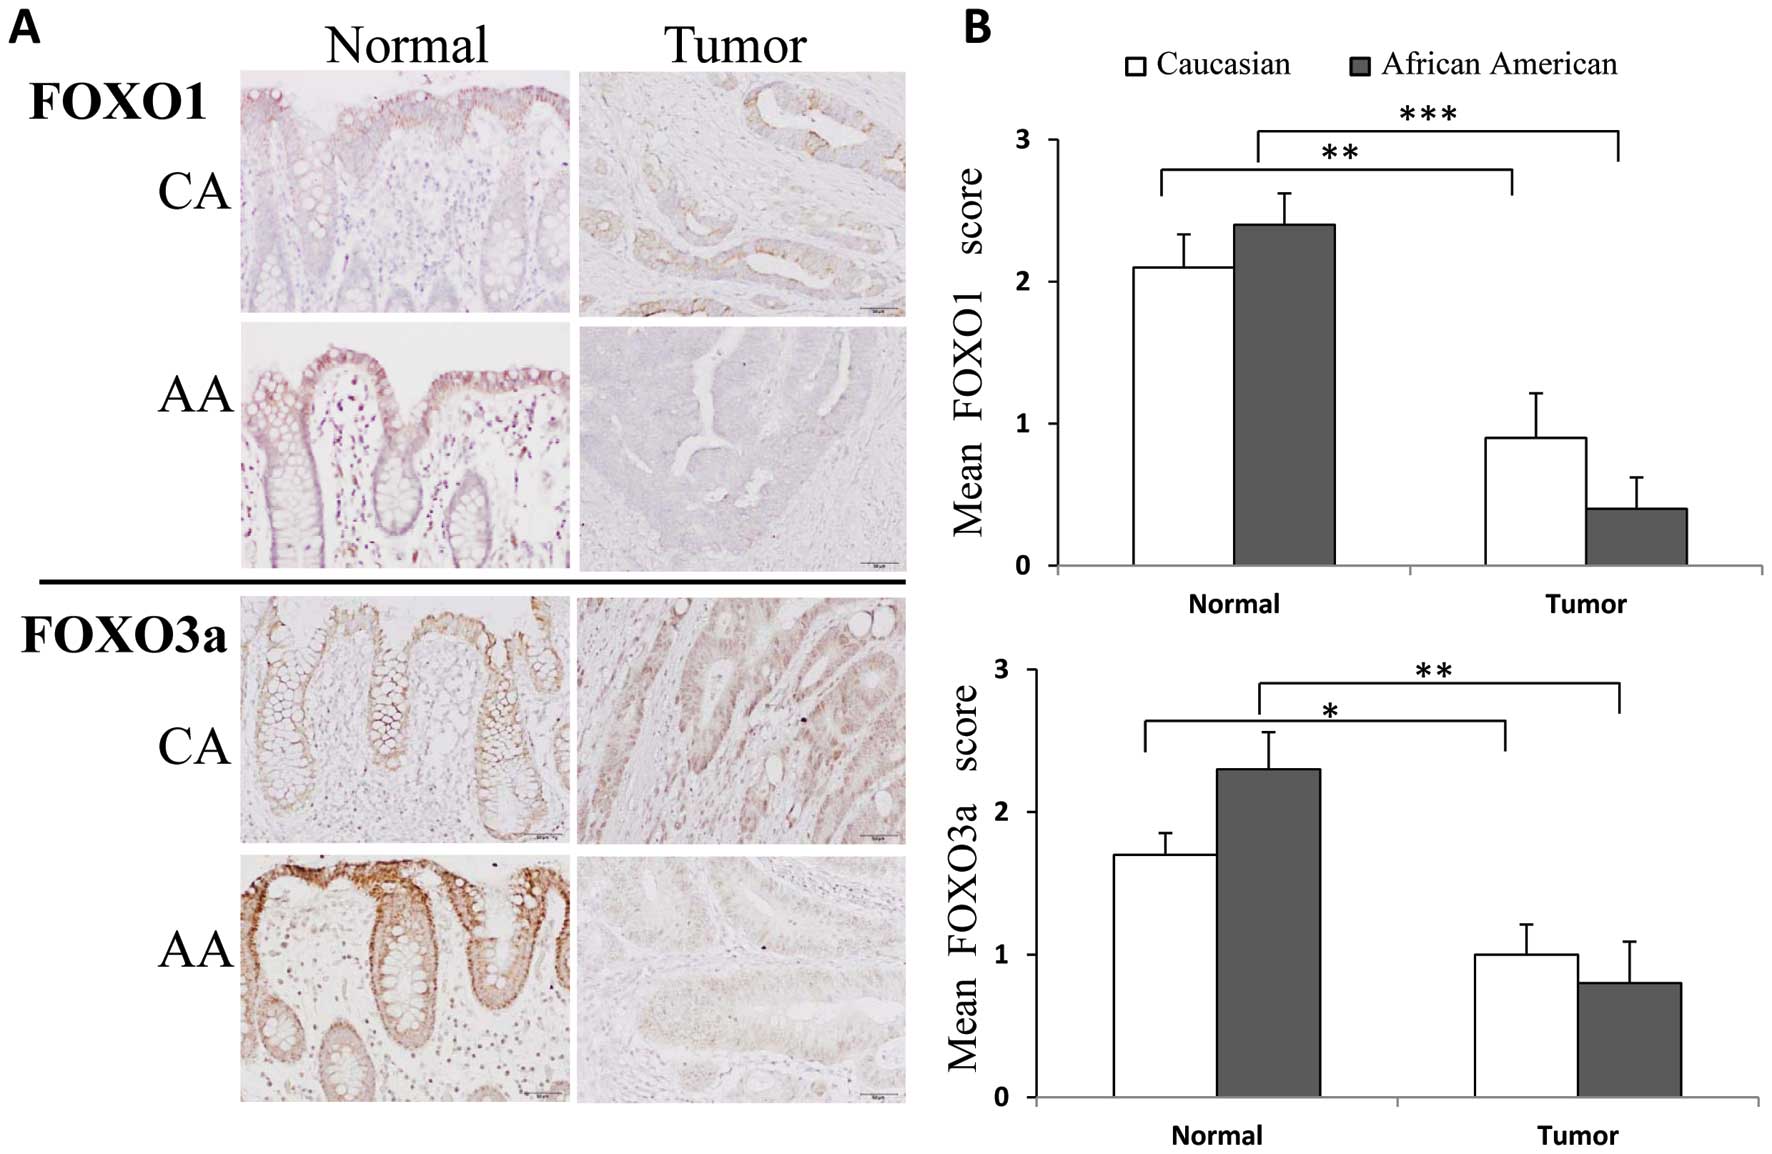
Immunohistochemical analysis of potential
miRNA targets
For further downstream analysis, we focused our
attention on the potential targets of miR-182 (35,36).
We reasoned that upregulation of miR-182 could result in reduced
expression of target mRNAs. To test this hypothesis,
immunohistochemical staining for two potential miR-182 targets,
FOXO1 and FOXO3a, were performed on 10 of the 15 matching tissue
sets from SBU CA and AA colon cancer patients (Fig. 3). SBU samples were solely used due
to availability of samples for this analysis. FOXO1 and FOXO3a
cytoplasmic staining was detected in all normal colon tissue
samples regardless of race. In normal colonic mucosa, staining for
both FOXO1 and FOXO3a was most intense in luminal surface columnar
cells, but colonic crypt epithelial cells also showed weak to
moderate cytoplasmic staining. In tumors, FOXO1 was localized
exclusively in the cytoplasm, but FOXO3a showed nuclear staining,
potentially reflecting the translocation of phospho-FOXO3a. The
expression of FOXO1 decreased by 57.14% in tumors of CAs and
decreased by 83.33% in tumors of AAs as compared to adjacent normal
tissues. Similarly, the extent of expression of FOXO3a decreased by
41.17% in tumors of CAs and decreased by 65.22% in tumors of AAs as
compared to adjacent normal tissues. However, the trend towards
reduced staining in AA tumors compared to CA did not reach
statistical significance. Statistical significance was noted only
when assessing differences in staining between normal and tumor
tissues.
Discussion
This exploratory study provides proof of principle
for identifying biological factors that could contribute to
increased mortality in CRC in AAs compared to CAs. Whole human
genome miRNA expression profiles were compared between AA and CA
paired colon cancer and adjacent normal colonic tissue. To increase
the power of the analysis, samples were combined between two
medical centers located, respectively, in New York City, NY and St.
Louis, MO, with at least 30 subjects per each racial cohort. The 2
cohorts were not significantly different with respect to
distribution of age or gender. However, there were significant
differences between the 2 cohorts with respect to the type of
samples used: formalin fixed paraffin embedded tissues vs. snap
frozen tissues.
One approach towards identifying candidate miRNAs
could be to conduct a series of two class comparisons using SAM
(26); i) compare paired tumor vs.
adjacent normal; ii) compare unpaired AA tumor with CA tumor; and
iii) compare unpaired AA normal with CA normal. The miRNAs that
were differentially expressed in tumor vs. normal and between AA
cancer and CA cancer would be selected as potential candidates.
However, to simultaneously evaluate the effect of race, tumor and
the institutional source as well as first order interaction terms
we instead used RANOVA.
The largest differences in miRNA expression are
between tumor and adjacent normal tissue. RANOVA identified miRNAs
that were previously reported to be differentially expressed
between tumor and normal colon tissue (14–19,29–34).
RANOVA identified nine miRNAs that exhibited either a race:tumor
interaction or both race and tumor main effects. We focused on one
miRNA that were initially identified by both SAM and RANOVA
analysis in the SBU cohort and then confirmed in the analysis of
the combined SBU and WU cohorts. Our main potential biomarker for
indicating a role in racial disparity, miR-182, has been previously
reported to be upregulated in tumor vs. normal tissues. In
addition, miR-204, which has been previously reported to be
downregulated in tumors (29–34)
was also considered as a potential biomarker. While subsequent
qRT-PCR confirmed upregulation of miR-182 and downregulation of
miR-204 in tumor vs. normal tissues, only miR-182 was confirmed as
being increased in AA vs. CA tumor tissues. In agreement, analysis
of miR-182 expression in the 6 AA designated colon cancers and the
37 CA designated colon cancers in The Cancer Genome Atlas database
also showed increased expression in the AA cancers, but this
increase did not reach statistical significance (37). This could be due in part to the
small sample number of AA colon cancer tissue. A recent RT-PCR
analysis of selected miRNAs in AA and CA paired tumor and adjacent
normal colon tissues detected an effect of race and colon cancer
stage on expression; however, miR-182 was not measured in this
study (38). While the observation
that miR-182 expression is increased in AA tumors, needs to be
confirmed in larger samples sets and/or better annotation of racial
metadata in existing collections, the results of this study
suggests that variations in sample processing at different
institutions will not obscure racial differences in miRNA
expression.
In accordance with the expression levels of miR-182,
there were reduced expressions of FOXO3 and FOXO1 in tumor vs.
normal tissues in the SBU cohort. Although expression levels were
noted to differ between AA vs. CA tumors, this decreased expression
was not statistically significant. These immunohistochemical
results support a recent report of decreased FOXO3a (39) expression in CRC, and suggest that
miR-182 levels may contribute to the regulation of FOXO1 and FOXO3a
expression. The concept that increased miR-182 levels in AA
compared to CA levels may contribute to increased AA colon cancer
mortality is further supported by a recent report linking miR-182
to reduced colon cancer survival and increased liver metastases
(40). Targeted suppression of
miR-182 expression has been reported to reduce hepatic metastases
in an experimental model of melanoma (41), suggesting that miR-182 is involved
in promoting the development of liver metastases.
The molecular pathways leading AA colon cancer
racial health disparity remain to be determined. We propose that
this may be related to an increase of miR-182 in AA colon cancers.
One potential link may be with defective mismatch repair (19). AAs with CRC (43%) have a higher
proportion of MSI instability compared to the general US population
(42). This instability may in
turn be associated with altered prognosis and response to
chemotherapeutic agents (42).
Another may be epigenetic modulation of the miR-182 locus (43). Identification of the biological
pathways associated with differential expression of miRNAs in AA
cancers will, therefore, require the generation and integration of
parallel genetic and epigenetic mRNA expression datasets with an
expanded racially annotated miRNA colon cancer dataset.
Acknowledgements
We thank the Siteman Cancer Center Tissue Core
(Washington University, St. Louis, MO) for providing the total RNA
isolated from colon cancer tissues for microarray analysis. The
Siteman Cancer Center is supported in part by NCI Cancer Center
Support Grant #P30 CA91842. Technical support for histologic
studies was provided by the Stony Brook Medicine Research Histology
Core Lab. We thank John Schwedes in the Stony Brook University
Genomics Core Facility for conducting the labeling, hybridization
and scanning of the microarrays. The authors thank Ms. Patti Blair
(Blair BioSciences, LLC) for editorial assistance. This study was
supported by the grants R01CA140487 and DK52574 and The Simons
Foundation.
References
|
1
|
Lieberman DA, Holub JL, Moravec MD, Eisen
GM, Peters D and Morris CD: Prevalence of colon polyps detected by
colonoscopy screening in asymptomatic black and white patients.
JAMA. 300:1417–1422. 2008. View Article : Google Scholar : PubMed/NCBI
|
|
2
|
Alexander D, Jhala N, Chatla C, et al:
High-grade tumor differentiation is an indicator of poor prognosis
in African Americans with colonic adenocarcinomas. Cancer.
103:2163–2170. 2005. View Article : Google Scholar : PubMed/NCBI
|
|
3
|
Chien C, Morimoto LM, Tom J and Li CI:
Differences in colorectal carcinoma stage and survival by race and
ethnicity. Cancer. 104:629–639. 2005. View Article : Google Scholar : PubMed/NCBI
|
|
4
|
Clegg LX, Li FP, Hankey BF, Chu K and
Edwards BK: Cancer survival among US whites and minorities: a SEER
(Surveillance, Epidemiology, and End Results) Program
population-based study. Arch Intern Med. 162:1985–1993. 2002.
View Article : Google Scholar : PubMed/NCBI
|
|
5
|
Cooper GS, Yuan Z and Rimm AA: Racial
disparity in the incidence and case-fatality of colorectal cancer:
analysis of 329 United States counties. Cancer Epidemiol Biomarkers
Prev. 6:283–285. 1997.
|
|
6
|
Hodgson DC, Fuchs CS and Ayanian JZ:
Impact of patient and provider characteristics on the treatment and
outcomes of colorectal cancer. J Natl Cancer Inst. 93:501–515.
2001. View Article : Google Scholar : PubMed/NCBI
|
|
7
|
Hodgson DC, Zhang W, Zaslavsky AM, Fuchs
CS, Wright WE and Ayanian JZ: Relation of hospital volume to
colostomy rates and survival for patients with rectal cancer. J
Natl Cancer Inst. 95:708–716. 2003.
|
|
8
|
Mayberry RM, Coates RJ, Hill HA, et al:
Determinants of black/white differences in colon cancer survival. J
Natl Cancer Inst. 87:1686–1693. 1995. View Article : Google Scholar : PubMed/NCBI
|
|
9
|
Ries LAG, Kosary CL, Hankey BF, Miller BA,
Harras A and Edwards BK: SEER Cancer Statistics Review, 1973–1994.
National Cancer Institute; Bethesda, MD: 1997
|
|
10
|
Weber TK, Chin HM, Rodriguez-Bigas M, et
al: Novel hMLH1 and hMSH2 germline mutations in African Americans
with colorectal cancer. JAMA. 281:2316–2320. 1999. View Article : Google Scholar : PubMed/NCBI
|
|
11
|
Carethers JM: Racial and ethnic factors in
the genetic pathogenesis of colorectal cancer. J Assoc Acad Minor
Phys. 10:59–67. 1999.PubMed/NCBI
|
|
12
|
Heneghan HM, Miller N, Lowery AJ, Sweeney
KJ and Kerin MJ: MicroRNAs as novel biomarkers for breast cancer. J
Oncol. 2009:9502012009.PubMed/NCBI
|
|
13
|
Croce CM: Causes and consequences of
microRNA dysregulation in cancer. Nat Rev Genet. 10:704–714. 2009.
View Article : Google Scholar : PubMed/NCBI
|
|
14
|
Yang L, Belaguli N and Berger DH: MicroRNA
and colorectal cancer. World J Surg. 33:638–646. 2009. View Article : Google Scholar : PubMed/NCBI
|
|
15
|
Cummins JM, He Y, Leary RJ, et al: The
colorectal microRNAome. Proc Natl Acad Sci USA. 103:3687–3692.
2006. View Article : Google Scholar : PubMed/NCBI
|
|
16
|
Callari M, Dugo M, Musella V, et al:
Comparison of microarray platforms for measuring differential
microRNA expression in paired normal/cancer colon tissues. PLoS
One. 7:e451052012. View Article : Google Scholar
|
|
17
|
Schetter AJ, Leung SY, Sohn JJ, et al:
MicroRNA expression profiles associated with prognosis and
therapeutic outcome in colon adenocarcinoma. JAMA. 299:425–436.
2008. View Article : Google Scholar : PubMed/NCBI
|
|
18
|
Schepeler T, Reinert JT, Ostenfeld MS, et
al: Diagnostic and prognostic microRNAs in stage II colon cancer.
Cancer Res. 68:6416–6424. 2008. View Article : Google Scholar
|
|
19
|
Sarver AL, French AJ, Borralho PM, et al:
Human colon cancer profiles show differential microRNA expression
depending on mismatch repair status and are characteristic of
undifferentiated proliferative states. BMC Cancer. 9:4012009.
View Article : Google Scholar
|
|
20
|
Xi Y, Shalgi R, Fodstad O, Pilpel Y and Ju
J: Differentially regulated micro-RNAs and actively translated
messenger RNA transcripts by tumor suppressor p53 in colon cancer.
Clin Cancer Res. 12:2014–2024. 2006. View Article : Google Scholar : PubMed/NCBI
|
|
21
|
Fu J, Tang W, Du P, et al: Identifying
microRNA-mRNA regulatory network in colorectal cancer by a
combination of expression profile and bioinformatics analysis. BMC
Syst Biol. 6:682012. View Article : Google Scholar : PubMed/NCBI
|
|
22
|
He L, Thomson JM, Hemann MT, et al: A
microRNA polycistron as a potential human oncogene. Nature.
435:828–833. 2005. View Article : Google Scholar : PubMed/NCBI
|
|
23
|
Voorhoeve PM, le Sage C, Schrier M, et al:
A genetic screen implicates miRNA-372 and miRNA-373 as oncogenes in
testicular germ cell tumors. Cell. 124:1169–1181. 2006. View Article : Google Scholar
|
|
24
|
Shell S, Park SM, Radjabi AR, et al: Let-7
expression defines two differentiation stages of cancer. Proc Natl
Acad Sci USA. 104:11400–11405. 2007. View Article : Google Scholar : PubMed/NCBI
|
|
25
|
Huang Q, Gumireddy K, Schrier M, et al:
The microRNAs miR-373 and miR-520c promote tumour invasion and
metastasis. Nat Cell Biol. 10:202–210. 2008. View Article : Google Scholar : PubMed/NCBI
|
|
26
|
Tusher VG, Tibshirani R and Chu G:
Significance analysis of microarrays applied to the ionizing
radiation response. Proc Natl Acad Sci USA. 98:5116–5121. 2001.
View Article : Google Scholar : PubMed/NCBI
|
|
27
|
Peltier HJ and Latham GJ: Normalization of
microRNA expression levels in quantitative RT-PCR assays:
identification of suitable reference RNA targets in normal and
cancerous human solid tissues. RNA. 14:844–852. 2008. View Article : Google Scholar : PubMed/NCBI
|
|
28
|
Zhou BY and Wong WH: A bootstrap-based
non-parametric ANOVA method with applications to factorial
microarray data. Statistica Sinica. 21:495–514. 2011. View Article : Google Scholar
|
|
29
|
Xu XM, Qian JC, Deng ZL, et al: Expression
of miR-21, miR-31, miR-96 and miR-135b is correlated with the
clinical parameters of colorectal cancer. Oncol Lett. 4:339–345.
2012.PubMed/NCBI
|
|
30
|
Meiri E, Levy A, Benjamin H, et al:
Discovery of microRNAs and other small RNAs in solid tumors.
Nucleic Acids Res. 38:6234–6246. 2010. View Article : Google Scholar
|
|
31
|
Reid JF, Sokolova V, Zoni E, et al: miRNA
profiling in colorectal cancer highlights miR-1 involvement in
MET-dependent proliferation. Mol Cancer Res. 10:504–515. 2012.
View Article : Google Scholar : PubMed/NCBI
|
|
32
|
Hamfjord J, Stangeland AM, Hughes T, et
al: Differential expression of miRNAs in colorectal cancer:
comparison of paired tumor tissue and adjacent normal mucosa using
high-throughput sequencing. PLoS One. 7:e341502012. View Article : Google Scholar
|
|
33
|
Piepoli A, Tavano F, Copetti M, et al:
MiRNA expression profiles identify drivers in colorectal and
pancreatic cancers. PLoS One. 7:e336632012. View Article : Google Scholar : PubMed/NCBI
|
|
34
|
Liu H, Du L, Wen Z, et al: Up-regulation
of miR-182 expression in colorectal cancer tissues and its
prognostic value. Int J Colorectal Dis. 28:697–703. 2013.
View Article : Google Scholar : PubMed/NCBI
|
|
35
|
Myatt SS and Lam EW: The emerging roles of
forkhead box (Fox) proteins in cancer. Nat Rev Cancer. 7:847–859.
2007. View
Article : Google Scholar : PubMed/NCBI
|
|
36
|
Paik JH, Kollipara R, Chu G, et al: FoxOs
are lineage-restricted redundant tumor suppressors and regulate
endothelial cell homeostasis. Cell. 128:309–323. 2007. View Article : Google Scholar : PubMed/NCBI
|
|
37
|
CGA N: Comprehensive molecular
characterization of human colon and rectal cancer. Nature.
487:330–337. 2012. View Article : Google Scholar : PubMed/NCBI
|
|
38
|
Bovell LC, Shanmugam C, Putcha BD, et al:
The prognostic value of microRNAs varies with patient
race/ethnicity and stage of colorectal cancer. Clin Cancer Res.
19:3955–3965. 2013. View Article : Google Scholar : PubMed/NCBI
|
|
39
|
He LY, Wei X, Du L, et al: Remarkably
reduced expression of FoxO3a in metaplastic colorectum, primary
colorectal cancer and liver metastasis. J Huazhong Univ Sci
Technolog Med Sci. 33:205–211. 2013. View Article : Google Scholar : PubMed/NCBI
|
|
40
|
Huynh C, Segura MF, Gaziel-Sovran A, et
al: Efficient in vivo microRNA targeting of liver metastasis.
Oncogene. 30:1481–1488. 2011. View Article : Google Scholar : PubMed/NCBI
|
|
41
|
Kauh J, Brawley OW and Berger M: Racial
disparities in colorectal cancer. Curr Probl Cancer. 31:123–133.
2007. View Article : Google Scholar
|
|
42
|
Carethers JM, Chauhan DP, Fink D, et al:
Mismatch repair proficiency and in vitro response to
5-fluorouracil. Gastroenterology. 117:123–131. 1999. View Article : Google Scholar : PubMed/NCBI
|
|
43
|
Liu S, Howell PM and Riker AI:
Up-regulation of miR-182 expression after epigenetic modulation of
human melanoma cells. Ann Surg Oncol. 20:1745–1752. 2013.
View Article : Google Scholar : PubMed/NCBI
|