Introduction
Gallbladder cancer (GBC) is the most common
malignancy of the biliary tract with highly aggressive
characteristics, low 5-year survival and poor prognosis. Because of
disappointing surgical resection and chemoradiotherapy, and an
effective tumor microcirculation, novel adjuvant therapies for
highly aggressive GBCs are clearly needed (1–5).
Recent studies have shown that an effective tumor microcirculation
in a highly aggressive malignancy, e.g., melanoma, consists of
vasculogenesis, angiogenesis and vasculogenic mimicry (VM)
(6,7). Therefore, many researchers are
currently seeking to develop new angiogenic and/or VM inhibitors
from cleaved proteins, monoclonal antibodies, synthesized small
molecules and natural products (8–14).
However, the sole use of some angiogenic inhibitors has been
confirmed to have no effect on VM (15–17).
Thus, it should be considered to develop new anti-vascular
therapeutic agents that target both angiogenesis and VM, in a
special, anti-VM therapy for tumor VM.
Matrix metalloproteinases (MMPs) including soluble
MMPs and membrane-type MMPs (MT-MMPs) are a broad family of
zinc-binding endopeptidases that participate in the extracellular
matrix (ECM) degradation that accompanies cancer cell invasion,
metastasis, and angiogenesis (18,19).
Recent studies have indicated that expression of MMP-2 and membrane
type 1-MMP (MT1-MMP) was significantly related to VM formation in
melanoma and ovarian cancer cells in three-dimensional (3-D)
culture; MMP-2 and MT1-MMP were more highly expressed in aggressive
melanoma with VM channels compared with poorly aggressive melanoma
with absence of VM (20–22). As a 21-kDa protein which
selectively forms a complex with the latent proenzyme form of the
72-kDa type IV collagenase, tissue inhibitor of matrix
metalloproteinase-2 (TIMP-2) inhibits the type IV collagenolytic
activity and the gelatinolytic activity, and abolishes the
hydrolytic activity of all members of the metalloproteinase family,
thus is a potent inhibitor of cancer cell invasion through
reconstituted ECM (23). Addition
of endogenous inhibitor TIMP-2 or antibodies to 72-kDa type IV
collagenase or specific antiserum against the 72-kDa type IV
collagenase achieved alteration of the type IV
collagenase-inhibitor balance, then inhibited HT-1080 cell invasion
(23). TIMP-2 may effectively
inhibit all of the proteolytic activities associated with MMP-2
and/or MT1-MMP, and is sufficient to prevent formation of VM-like
patterned networks (24). Thus,
TIMP-2 is considered to have anti-VM activity for VM in some highly
aggressive malignant tumors.
We recently reported that VM exist in human GBCs,
the 3-D matrices and the xenografts of highly aggressive GBC-SD
cells, and correlated with the poor prognosis (25–27);
that the formation of VM in GBCs is through the activation of the
phosphoinositide 3-kinase (PI3-K)/MMPs/Ln-5γ2 and the ephrin type-A
receptor 2 (EphA2)/focal adhesion kinase (FAK)/Paxillin signaling
pathways in vitro and in vivo; and that recombinant
TIMP-2 retarded patterned VM formation in GBC-SD cell 3-D matrices
and xenografts as compared to untreated GBC-SD cells and xenografts
(28). Norcantharidin (NCTD), a
demethylated and low-cytotoxic derivative of cantharidin, not only
inhibits the proliferation and growth of a variety of human tumor
cells and is used clinically to treat some human cancers because of
its anticancer activity, fewer side-effects and leukocytosis
(29–34), but also has multiple antitumor
activities for GBCs in vitro and in vivo (10,35–38).
In this study, we further investigated that expression of MMP-2 and
MT1-MMP among human GBC specimens, the 3-D matrices and the nude
mouse xenografts of GBC-SD cells was related to VM in GBCs, and the
anti-VM activity of NCTD in combination with TIMP-2 for human GBCs,
so as to explore if NCTD would serve as a potential anti-VM agent
or synergist of cancer therapies. As McNamara et al have
pointed out, the future therapeutic spectrum for GBC will likely
encompass novel combinations of targeted therapies with cytostatics
in scientifically and molecularly directed schedules, thus
permitting fewer mechanisms of escape for tumor cells (39).
Materials and methods
Tissue specimens and human GBC VM
identification
This study in human GBC tissue specimens was carried
out with approval from the Ethics Committee of Tongji Hospital,
Tongji University School of Medicine (Shanghai, China) (Reference
no. TER 2012–158); and because this study involved medical records
and biological specimens obtained from previous clinical diagnosis
and treatment, and two-time using of the medical records and
biological specimens, the Ethics Review Committee waived informed
consent and the need for written informed consent from the
participants, according to the ethical principles and related
clauses of the Ministry of Health of P.R. China ‘Ethical Review
Methods of Biomedical Research Involving Human Subjects (2007)’,
the World Medical Association (WMA) ‘Declaration of Helsinki’ and
Council for International Organizations of Medical Sciences (CIOMS)
‘International Ethical Guidelines for Biomedical Research Involving
Human Subjects (2002)’.
For this study, we retrospectively selected 94 GBC
patients who underwent curative resection from January, 1994 to
August, 2005 at Tongji Hospital of Tongji University School of
Medicine. No patients had history of chemotherapy or radiotherapy
before surgery. Clinical outcome was followed from the date of
surgery to the date of death or until the end of August 31, 2005.
Cases lost during follow-up were regarded as censored data for the
survival analysis. Finally, 89 resection specimens with complete
clinical and prognostic data were collected for analysis. The
diagnosis of these GBC samples was verified by two different
pathologists who were blinded to the clinical status of patients.
The median follow-up period for all patients was 20.16 (range,
1.5–60) months. Identifications of VM in human GBCs by using
hematoxylin and eosin (H&E) and CD31-PAS double
staining were performed as described previously (25).
Detections of MMP-2, MT1-MMP in human GBC
specimens
Expression of MMP-2, MT1-MMP in human GBC specimens
was determined by immunohistochemistry (IHC) as described
previously (40). After
pre-treating the samples, slides (4 μm) were incubated with the
primary antibodies MMP-2 (rabbit polyclone, 1:200; Zeta
Corporation, Sierra Madre, CA, USA) and MT1-MMP (rabbit monoclonal,
1:100; Abcam, Cambridge, MA, USA), biotinylated secondary antibody
(goat anti-rabbit Envision kit; Genentech, San Francisco, CA, USA),
3,3′-diaminobenzidine (DAB), and counter-stained by hematoxylin.
Negative controls were established by replacing the primary
antibody with phosphate buffer solution (PBS) in all samples, known
immunoassaying-positive sections were used as positive controls. To
evaluate precisely expression of MMP-2 and MT1-MMP proteins, the
computer-assisted image analysis and the selection of cut-off
scores were used respectively. All IHC-stained sections were
examined in a Zeiss photomicroscope (Carl Zeiss, Inc., Thornwood,
NY, USA) equipped with a three-chip charge-coupled device color
camera (model DXC-960 MD; Sony Corp., Tokyo, Japan).
High-resolution (1,024×1,024 pixels) images were obtained from each
histospot at ×40 magnification and stored digitally in a computer.
The image analysis to quantify intensity of color reaction was
analyzed using Image-Pro Plus Software (IPP version 4.5; Media
Cybernetics, Inc., Carlsbad, CA, USA), i.e., by computer-assisted
image analysis (41,42). The staining intensity levels of
MMP-2 and MT1-MMP were measured using arbitrary unit (AU) on a
linear scale ranging from 0 (non-detectable) to 255 (highest
intensity). Mean density of five different fields in each zone were
quantified by a reader blinded to the clinical outcome.
Furthermore, cut-off scores for MMP-2 and MT1-MMP expression were
selected based on receiver operating characteristic (ROC) curve
analysis (43,44). The area under curve (AUC) via the
ROC curve analysis was calculated, respectively, to estimate the
discriminatory power of MMPs protein over the entire range of
scores for overall survival (OS) rate of GBC patients. The ROC
curve was generated and analyzed using MedCalc statistical software
package 11.0.1 (MedCalc Software bvba, Ostend, Belgium).
Tumor xenograft assay and survival
analysis in vivo
This study was carried out in accordance with the
official recommendations of the Chinese Community Guidelines and
the Animal Research: Reporting of In Vivo Experiments
(ARRIVE) guidelines (45), and was
approved by the Ethics Committee of Animal Experiments of Tongji
Hospital, Tongji University School of Medicine, and the Science and
Technology Commission of Shanghai Municipality (Shanghai, China)
(Permit no.: SYXK 2012-0031).
Specific pathogen-free 4–5-week-old Balb/c nu/nu
mice and xenograft mice model established by subcutaneous injection
of GBC-SD (a highly aggressive human GBC cell line) cells into the
right backs of mice were used in this study as described previously
(27,38). The mice, by 2 weeks when a tumor
xenograft (~200 mm3) was apparent in all mice, were
randomly divided into a control group (n=20) receiving
intraperitoneal (i.p.) injection of 0.1 ml normal saline alone
twice each week, a NCTD group {n=20; each mouse receiving i.p.
injection of 28 mg/kg NCTD [Injection solution, 5
mg·ml−1; Jiangsu Kangxi Pharmaceutical Works, Jiangsu,
China; a dose of NCTD 1/5 LD50 (10)] given in 0.1 ml of normal saline}, a
TIMP-2 group [n=20; each mouse receiving intratumoral (i.t.)
injection of 100 nM, i.e., 5 mg/kg recombinant TIMP-2
(Sigma-Aldrich, Seelze, Germany)], and a NCTD+TIMP-2 group (n=20;
each mouse receiving i.p. injection of 28 mg/kg NCTD and i.t.
injection of 5 mg/kg recombinant TIMP-2), twice each week for 6
weeks in total. The xenograft size, i.e., the maximum diameter (a)
and minimum diameter (b) were measured with calipers two times each
week. Of each group of the xenograft mice 50% was sacrificed under
anesthesia at 8 weeks after injection, and tumor growth including
tumor volume, tumor growth curve and tumor inhibitory rate were,
respectively, evaluated as described previously (27,38).
The other xenograft mice continued to be housed in specific
pathogen-free condition, and the mouse survival was evaluated as
described previously (38). The
outcome was followed from the date of injection to the date of
mouse death or until 180th day after inoculation, when the mice
still alive were euthanized under anesthesia. The median follow-up
period for mice was 15 (range, 3–31) weeks.
VM formation assay of the xenografts in
vivo
VM formation assay from GBC-SD nude mouse xenograft
sections of each group was conducted by using H&E and
CD31-PAS double staining and transmission electron
microscopy (TEM) (27,28). For H&E staining,
paraffin-embedded tissue specimens were deparaffinized, hydrated,
and stained with H&E. For CD31-PAS double staining,
sections (4 μm) were pre-treated, then incubated in turn with mouse
monoclonal anti-CD31 protein IgG (1:50; Lab
Vision/NeoMarkers, Fremont, CA, USA), goat anti-mouse Envision kit
(Genentech), DAB chromogen, 0.5% periodic acid solution, followed
by treating with Schiff solution in dark chamber, counterstained
with hematoxylin, and observed under a light microscope (Olympus
IX70; Olympus, Tokyo, Japan). For TEM, fresh samples (0.5
mm3) were fixed in cold 2.5% glutaraldehyde in 0.1
mol·l−1 of sodium cacodylate buffer and post-fixed in a
solution of 1% osmium tetroxide, dehydrated, and embedded in a
standard fashion. The specimens were then embedded, sectioned, and
stained by routine means for a JEOL 1230 TEM (JEOL, Ltd., Tokyo,
Japan). All experiments were performed in triplicate.
Hemodynamic assay of the xenograft VM in
vivo
Hemodynamic assay of GBC-SD nude mouse xenografts
was examined by dynamic micro-magnetic resonance angiography
(micro-MRA) (MRI is a 1.5 T superconductive magnet unit from
Marconi Medical Systems, Inc., Cleveland, OH, USA) as described
previously (27). The anesthetized
xenograft mice (n=3, 7-weeks old, 35±3 g) placed at the center of
the coils were injected i.v. in the tail vein with human adult
serum gadopentetic acid dimeglumine salt injection [HAS-Gd-DTPA,
0.50 mmol (Gd)·ml−1, Mr=60–100 kDa, 0.1 mmol
(Gd)·kg−1; Bayer Schering Pharma AG, Berlin, Germany]
before sacrifice. Micro-MRA was performed to analyze hemodynamics
in the VM (central tumor) regions (28). The images were acquired before
injection of the contrast agents and 5, 10, and 15 min after
injection. Three regions of interset (ROI) in the central area and
the marginal area of the xenografts were observed and time-coursed
pixel numbers per mm3 were counted. Two experiments were
performed on these three gated ROI. The data were obtained directly
from the MRA analyzer and are expressed as the mean ± SD.
Vasculogenic-like network assay of the
3-D matrices in vitro
Matrigel and rat-tail type I collagen 3-D matrices
were prepared as described previously (27). GBC-SD cells were allowed to adhere
to matrix, and untreated (control group) and treated with 28
μg·ml−1 NCTD [a dose of NCTD 1/2 IC50
(36), NCTD group], 100 nM
recombinant TIMP-2 (Sigma-Aldrich; TIMP-2 group), or 28
μg·ml−1 NCTD and 100 nM recombinant TIMP-2 (NCTD+TIMP-2
group) for 2 days. The ability of GBC-SD cells to engage in VM was
respectively analyzed using H&E staining and periodic
acid-Schiff (PAS) staining (without hematoxylin counterstain) and
TEM (27,28). The outcome was observed under a
light microscope. The images were taken digitally using a Zeiss
Telaval Inverted Microscope (Carl Zeiss, Inc.) and camera (Nikon,
Tokyo, Japan) at the time indicated. And, the 3-D culture specimens
were fixed, dehydrated, embedded, sectioned, and stained by above
routine means for a JEOL 1230 TEM. All experiments were performed
in triplicate.
Assays of proliferation, apoptosis,
invasion and migration of the cells in vitro
The cultured GBC-SD cell suspensions were used for
proliferation assay via tetrazolium-based colorimetric method (MTT)
and apoptosis assay via flow cytometry (FCM) in vitro. Cells
cultured in a 96-well plate (3×10⁵ cells/ml·100 μl/well)
in fresh culture medium at 37°C in 5% CO2 were untreated
(control group) and treated with 28 μg·ml−1 NCTD [a dose
of NCTD 1/2 IC50 (36),
NCTD group], 100 nM recombinant TIMP-2 (Sigma-Aldrich; TIMP-2
group), or 28 μg·ml−1 NCTD and 100 nM recombinant TIMP-2
(NCTD+TIMP-2 group) for 5 days. The inhibitory effect of each group
on proliferation of GBC-SD cells was determined by MTT assay as
described previously (38). For
FCM, cells were untreated (control group) or treated with above
NCTD, TIMP or NCTD+TIMP-2 (6 wells per agent) at 37°C in 5%
CO2 for 24 h, then were made up into the cell suspension
(5×10⁵ cells/ml), and suspended in 500 μl binding
buffer. Tumor DNA was then stained for 15 min with 5 μl Annexin
V-FITC and propidium iodine (PI) (Sigma, St. Louis, MO, USA). DNA
value and apoptotic rate were determined by the Cell Apoptotic
Detection kit (BioDev, Beijing, China) and the Fluorescent
Activated Cell Sorter (420 type FCM; Becton-Dickinson, San Jose,
CA, USA). Three experiments were separately performed.
The 35-mm, 6-well Transwell membranes (Coster, South
Elgin, IL, USA) were used to measure the invasiveness of GBC-SD
cells in vitro as described (38). Upper wells of chamber were filled
with 1 ml serum-free DMEM containing 2×10⁵
ml−1 GBC-SD cells (n=3). Cells were untreated (control
group) and treated, respectively, with the above NCTD, TIMP-2 or
NCTD+TIMP-2 in fresh culture medium (0.3 ml/every chamber) for 24
h. Lower wells of the chamber were filled with 3 ml serum-free DMEM
containing 1X MITO+ (Collaborative Biomedical Prdts, Bedford, MA,
USA). Cells invaded through the basement membrane were stained with
H&E, and counted under a light microscope. Invasiveness was
calculated as the number of cells invaded successfully through the
matrix-coated membrane to the lower wells by counting cells in five
independent microscopic fields. All experiments were performed in
triplicate with consistent results.
Collagen gel suspensions for GBC-SD cells are
prepared by mixing 250 μl of a suspension (3×10⁶
ml−1) into 250 μl of undiluted rat-tail collagen type I
(Sigma-Aldrich) dripped into sterilized 35-mm petri dishes that
contained 2 ml culture medium to prevent adhesion of the collagen
to the glass substrate. Cells were treated according to above
invasion assay. Gel contraction was defined as the relative change
in the gel size, measured daily in two dimensions including maximum
and minimum diameters. Contraction index (CI) was calculated, i.e.,
migration assay, as follows: CI = 1 − (D −
D0)2 × 100%, where D is the primary diameter
of rat-tail collagen type I, D0 is the average of
maximum and minimum diameters of gel. All experiments were
performed in triplicate.
Detection of MMP-2 and MM1-MMP molecules
from GBC-SD cells in vitro and xenografts in vivo
Expression of MMP-2 and MM1-MMP proteins/mRNAs from
GBS-SD nude mouse xenografts in vivo and 3-D matrices of
GBS-SD cells in vitro were determined by streptavidin-biotin
complex method (SABC), immunofluorescence, western blotting and
semiquantitative reverse transcription-polymerase chain reaction
(RT-PCR), respectively, as described previously (28).
For SABC, sections were incubated in turn with
primary antibody [MMP-2 (1:200), MT1-MMP (1:100), rabbit polyclonal
antibody], biotinylated secondary antibody, SABC reagents and DAB
solution (all from Wuhan Boster Biological Technology, Ltd., Wuhan,
China), and observed under an optic microscope (Olympus CH-2;
Olympus). Negative controls were established by replacing the
primary antibody with PBS in all samples. Ten sample slides (10
visual fields per slide) in each group were selected by
analysis.
For indirect immunofluorescence, sections were added
in order with 50 μl (1:100) primary antibody (MMP-2 and MT1-MMP,
rabbit polyclonal antibody; Wuhan Boster Biological Technology,
Ltd.), biotinylated secondary antibody (1:100, goat anti-rabbit
IgG-FITC/GGHL-15F; Immunology Consultants Laboratory, Portland, OR,
USA), mounted in coverslip using buffer glycerine, and observed
under a fluorescence microscope (Nikon). The slides were treated
with PBS in place of primary antibody as negative control. Ten
sample slides (10 visual fields per slide) in each group were
chosen by analysis. Expression of each protein on slides of the
xenografts showed a yellow-green fluorescent stain. Fluorescence
stain intensity was classed into −, ±, +, ++, +++, ++++. Then
grouped as, − to +: negative expression, ≥ ++: positive
expression.
For western blotting, cells were lysed, the
supernatant was recovered, BCA protein was determined with a
protein quantitative kit (KangChen KC-430; KangChen Bio-tech,
Shanghai, China). Then, an aliquot of 20 μg of proteins was
subjected to sodium dodecyl sulfate-polyacrylamide gel
electrophoresis (SDS-PAGE) under reducing conditions, and were then
transferred to a PVDF membrane. The membrane was added in order
with each primary antibody (MMP-2, MT1-MMP: mouse anti-human
antibody, 1:3,000; Wuhan Boster Biological Technology, Ltd.), mouse
anti-human GAPDH antibody (1:10,000), and an appropriate anti-mouse
HRP-labeled secondary antibody (1:5,000; both from KangChen
Bio-tech). The target proteins were visualized by an enhanced
chemiluminescent reagent (KC™ Chemiluminescent kit, KangChen
KC-420; KangChen Bio-tech), imaged on the Bio-Rad chemiluminescence
imager. The gray value and gray coefficient ratio of every protein
were analyzed and calculated with ImageJ analysis software.
For RT-PCR, total RNA from the xenograft cells of
each group was prepared using the TRIzol reagent (Invitrogen Life
Technologies, Carlsbad, CA, USA). Concentration of RNA was
determined by the absorption at 260–280 nm. PCR amplifications were
performed with gene-specific primers as below with annealing
temperature and number of amplification cycles optimized using cDNA
from the xenograft cells in each group. The primers for MMP-2,
MM1-MMP and GAPDH were as follows: MMP-2 (290 bp) 5′-TCT GAG GGT
TGG TGG GAT TGG-3′ (sense), 5′-AAG AGC GTG AAG TTT GGA AGC A-3′
(anti-sense); MM1-MMP (180 bp) 5′-CAA AGG CAG AAC AGC CAG AGG-3′
(sense), 5′-ACA GGG ACC AAC AGG AGC AAG-3′ (anti-sense); GAPDH (211
bp) 5′-CCT CTA TGC CAA CAC AGT GC-3′ (sense), 5′-GTA CTC CTG CTT
GCT GAT CC-3′ (anti-sense). PCR amplification reactions were
performed as follows: 1 cycle of 94°C for 5 min; 35 cycles of 94°C
for 10–22 sec, 57–60°C for 15–20 sec, 72°C for 20 sec, 82–86°C
(fluorescence collection) for 5–10 sec; 1 cycle of 72–99°C for 5
min. GAPDH primers were used as control for PCR amplication. PCR
products (10 μl) were placed onto 15 g·l−1 agarose gel
and observed by ethidium bromide (Huamei Bioengineering Co., Ltd.,
Shanghai, China) staining using ABI Prism 7300 SDS software.
Statistical analysis
The data are expressed as mean ± SD and performed
using SAS 9.0 software (SAS Institute, Inc., Cary, NC, USA). The
comparison and association between VM and categorical variables
were analyzed by t/F test and Spearman correlation analysis,
respectively. Survival curves were calculated with the Kaplan-Meier
method and were compared using the log-rank test. P<0.05 was
considered statistically significant.
Results
MMP-2 and MT1-MMP expression relates to
VM in GBC patients
We reported that VM existed in human GBCs and
corrected with the patient’s poor prognosis (25,26).
In this experiment, we further investigated if expression of MMP-2
and MT1-MMP proteins relates to VM in GBC patients. As shown in
Fig. 1, VM in human GBCs was
observed by using H&E and CD31-PAS double staining
(Fig. 1A); expression of MMP-2 and
MT1-MMP proteins in VM-positive GBCs was significantly higher than
those in VM-negative GBCs (Fig.
1B, P=0.0007 and P=0.0013). Then, by selecting the cut-off
score for high or low IHC reactivity and calculating the AUC of
MMP-2 or MT1-MMP via ROC curve analysis, 89 GBC specimens were
categorized into high and low MMP-2 and MT1-MMP expression groups,
respectively. According to high or low expression of MMP-2 (38.6 or
61.4%) and MT1-MMP (18.6 or 81.4%) in VM-negative GBCs, and high or
low expression of MMP-2 (84.2 or 15.8%) and MT1-MMP (68.4 or 31.6%)
in VM-positive GBCs, a positive correlation between MMP-2 (r=0.374,
P=0.0003) or MT1-MMP (r=0.449, P=0.0001) expression and VM was
revealed, respectively. In addition, the means and medians for
survival time in VM-positive GBC patients were 11.13 and 9 months
as compared to 22.62 and 22 months in VM-negative GBC patients; the
cumulative 1-, 3- and 5-year OS rate were 36.84, 0 and 0% in the
VM-positive group and 71.43, 21.43 and 4.29% in the VM-negative
group, respectively. The survival time of VM-positive GBC patients
were significantly shorter than that of VM-negative GBC patients
(Fig. 1C1, P=0.000); a
worse survival of VM-positive GBC patients with high MMP-2
(Fig. 1C2, P=0.003) or
MT1-MMP (Fig. 1C3,
P=0.018) expression than that of the patients with low MMP-2 or
MT1-MMP expression. Thus, expression of MMP-2 and MT1-MMP was
considered to significantly relate to VM in human GBCs and
prognosis of GBC patients with VM.
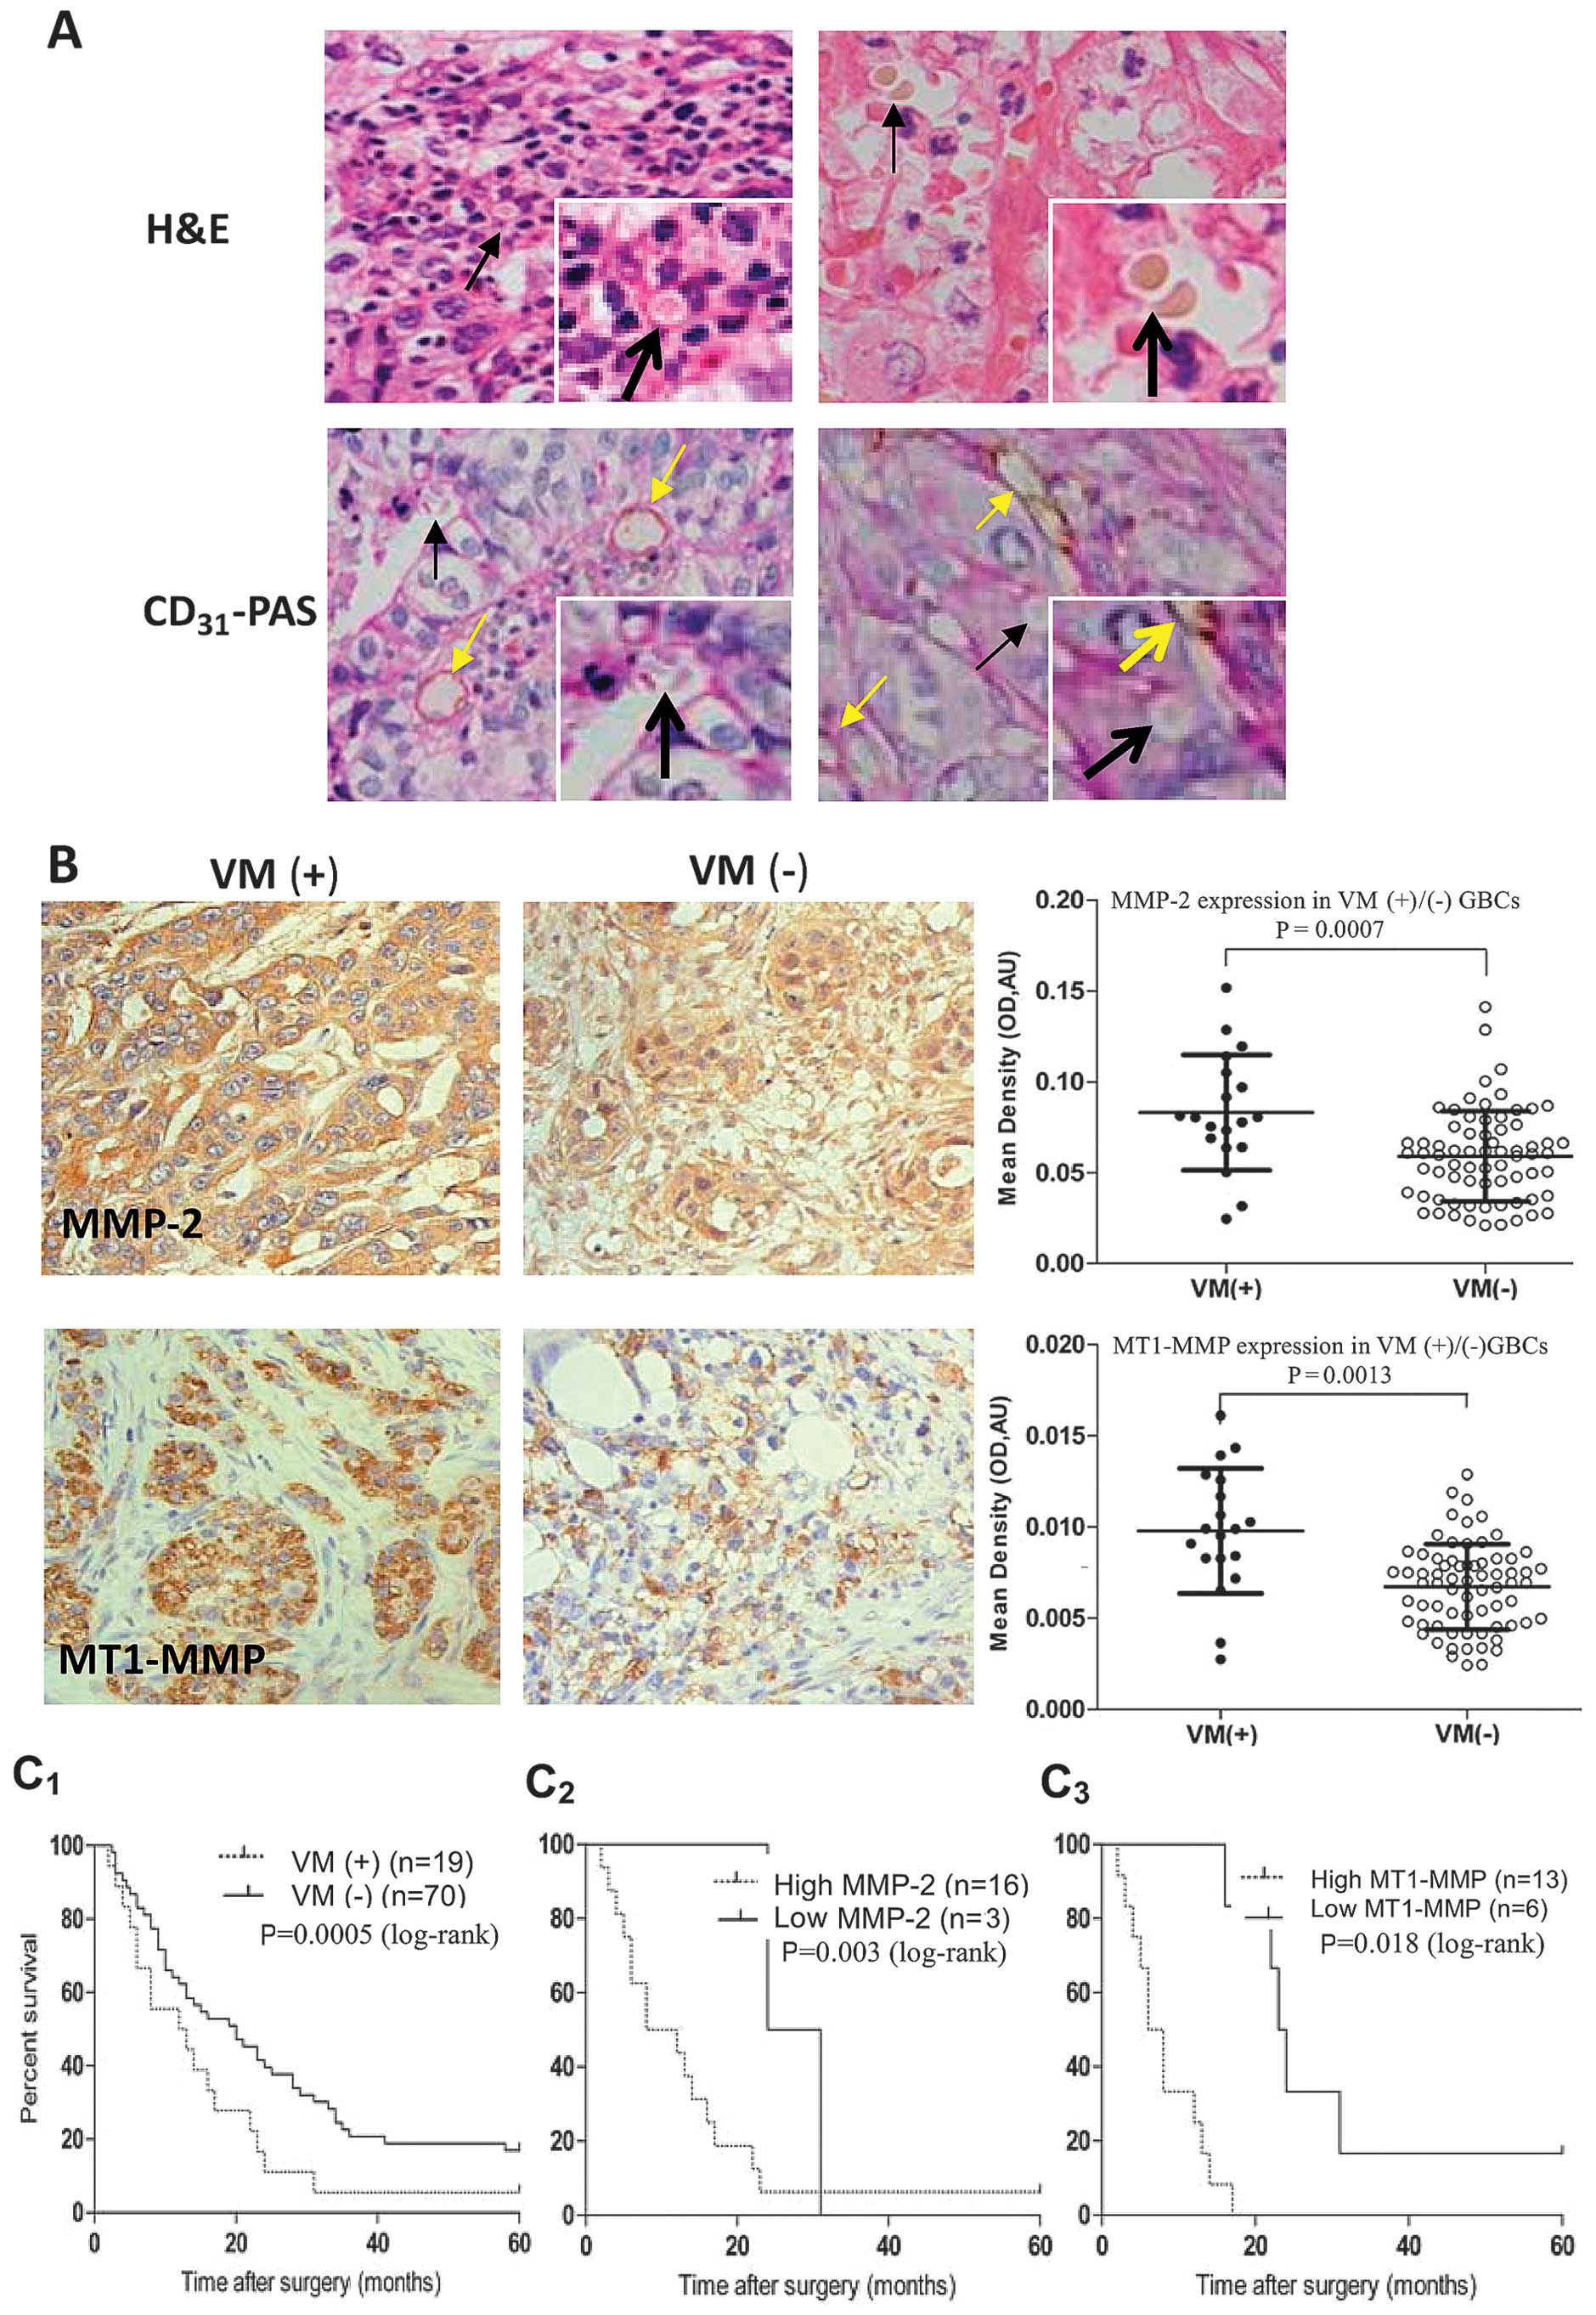 | Figure 1Relationship between vasculogenic
mimicry (VM) and matrix metalloproteinase (MMP)-2 or membrane type
1-MMP (MT1-MMP) expression in human gallbladder cancers (GBCs). (A)
Morphologic appearance of VM (Envision, original magnification,
×400) with hematoxylin and eosin (H&E) staining and
CD31-PAS double staining: The VM channels (black arrows)
positive for periodic acid-Schiff (PAS) staining were lined only by
CD31-negative tumor cells lining the external wall,
single or several erythrocytes therein, and
CD31-positive endothelium-dependent vessels (yellow
arrows) presenting in the same field with VM. (B) Expression of
MMP-2, MT1-MMP in VM (+)/(−) GBC samples (Envision, original
magnification, ×400). The positive expression site of MMP-2 or
MT1-MMP protein presented yellow-brown reactant was in cytoplast or
both cytoplast and cytomembrane. Expression of MMP-2 and MT1-MMP
proteins was significantly higher in VM (+) GBCs than that of VM
(−) GBCs (P=0.0007, P=0.0013). (C) Kaplan-Meier survival curves
(log-rank test) for VM (+)/(−) GBC patients, high or low expression
of MMP-2 or MT1-MMP. The survival time of VM (+) GBC patients was
significantly shorter than that of the VM (−) patients
(C1, P=0.000); a worse survival of VM-positive GBC
patients with high MMP-2 (C2, P=0.003) or MT1-MMP
(C3, P=0.018) expression than that of the patients with
low MMP-2 or MT1-MMP expression. |
NCTD enhances TIMP-2 antitumor and
anti-VM activities for GBC-SD nude mouse xenografts in vivo
We have reported that TIMP-2 has anti-VM activity
for human GBC cells (28). Here,
we investigated whether NCTD enhances TIMP-2 anti-VM activity for
human highly aggressive GBCs. In this experiment, GBC-SD xenografts
were seen in all nude mice at the end of the second week after
inoculation. The xenograft volume was markedly decreased, tumor
inhibition was significantly increased in TIMP-2, NCTD or
NCTD+TIMP-2 group as compared to control group (Fig. 2A–C, all P<0.001); but the
xenograft volume was much lower, tumor inhibition was much higher
in NCTD+TIMP-2 group than those in NCTD or TIMP-2 group (Fig. 2A–C, all P<0.01). Furthermore, a
prolonged survival time of the xenograft mice in NCTD, TIMP-2 or
NCTD+TIMP-2 group was observed when compared with control group
(Fig. 2D, log-rank test,
P=0.0115), whilst without difference on survival time among TIMP-2,
NCTD and NCTD+TIMP-2 groups.
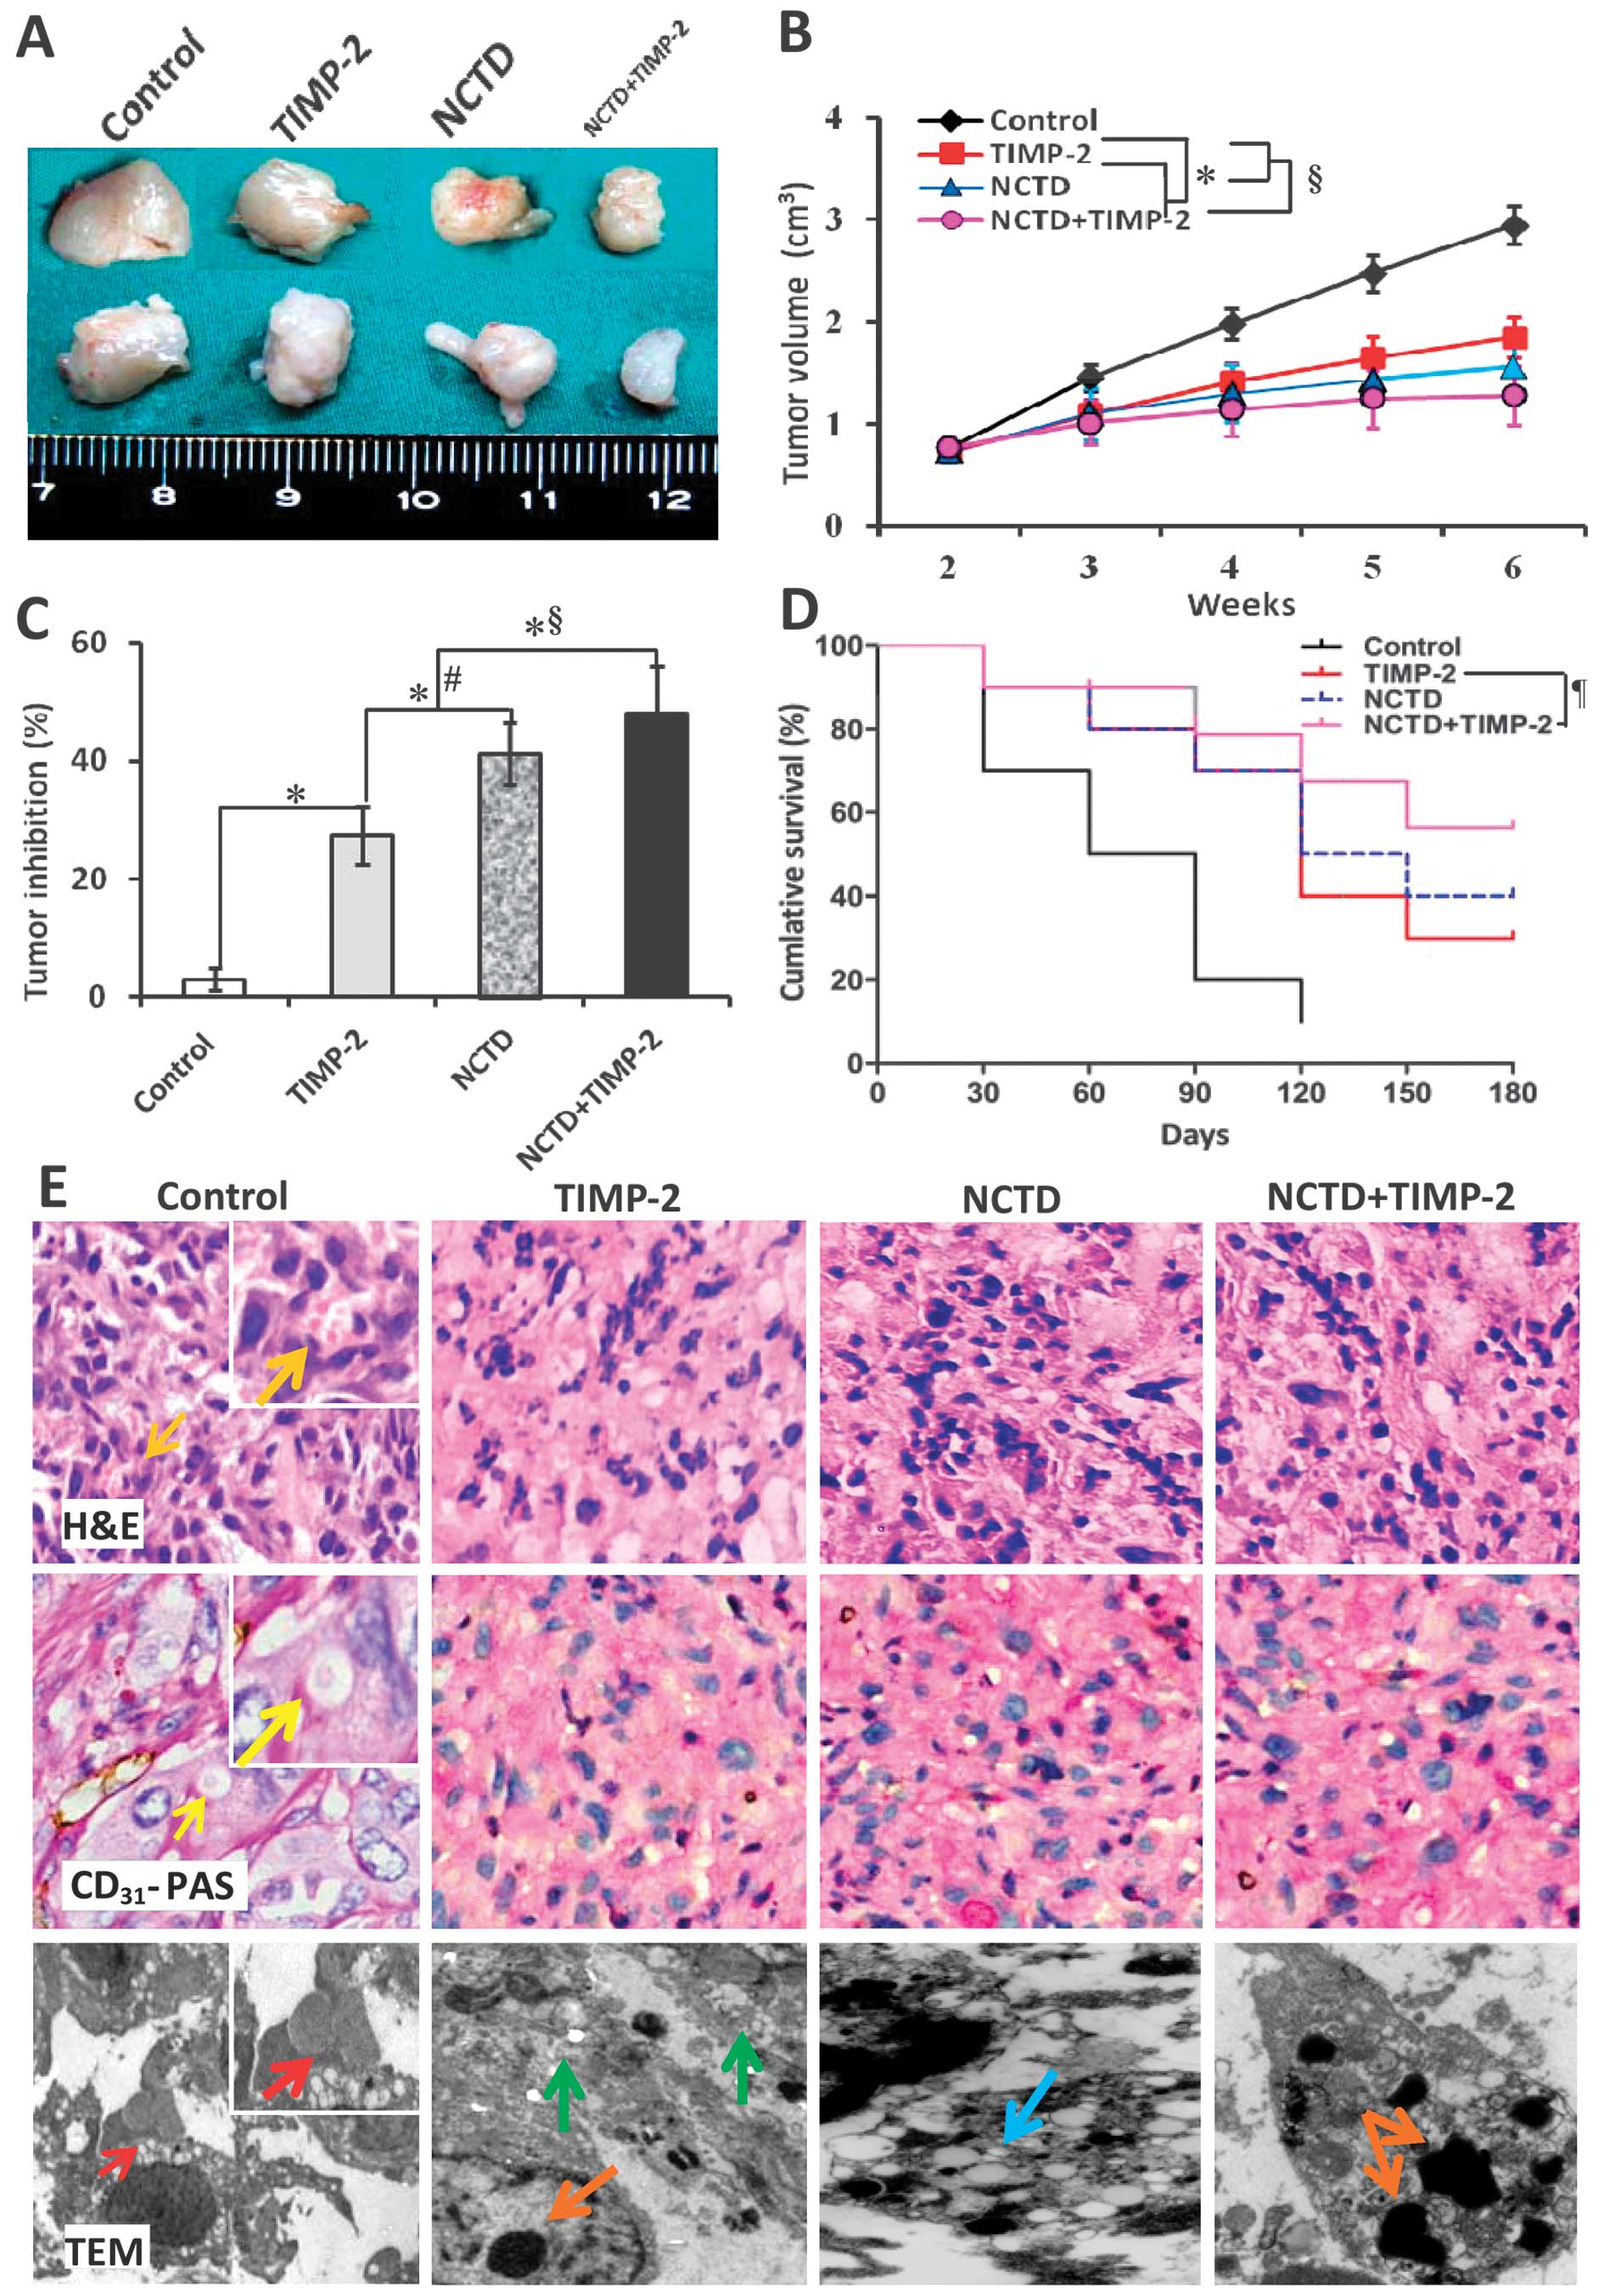 | Figure 2Growth and vasculogenic mimicry (VM)
formation of GBC-SD xenografts, and survival of the xenograft mice
in vivo. (A–C) The size, volume and tumor inhibition of the
xenografts of each group. *P<0.001 vs. control group;
#P<0.01 vs. tissue inhibitor of matrix
metalloproteinase-2 (TIMP-2) group; §P<0.01 vs.
norcantharidin (NCTD) or TIMP-2 group. (D) Kaplan-Meier survival
curves for the xenograft mice of each group (log-rank test,
¶P=0.0115 vs. control group), whilst no difference on
survival time among TIMP-2, NCTD and NCTD+TIMP-2 groups. (E)
Histomorphologic appearance of the xenografts of each group. In
control group, hematoxylin and eosin (H&E) staining (original
magnification, ×200 or ×400) showed tumor cell-lined VM channels
containing erythrocytes (orange arrows) without any evidence of
tumor necrosis; CD31-PAS double staining (original
magnification, ×200 or ×400) showed periodic acid-Schiff
(PAS)-positive substances lining channels and forming basement
membrane-like structures (VM) with single erythrocyte inside
(yellow arrows); transmission electron microscopy (TEM) (original
magnification, ×8,000) visualized several erythrocytes at the
central of tumor nests in the xenografts (red arrows). However,
similar phenomenon failed to occur in the xenografts in TIMP-2,
NCTD or NCTD+TIMP-2 group, with destroyed cellular organelles,
vacuolar degeneration (blue arrow), cell necrosis (green arrows),
nuclear pyknosis, fragmentation and apoptotic bodies (brown
arrows). |
In addition, in control group, H&E staining
showed VM channels formed by tumor cells and erythrocytes therein;
CD31-PAS double staining showed CD31-negative
PAS-positive substance lining channels and forming basement
membrane-like structures (VM) with single erythrocyte inside
(Fig. 2E); and TEM clearly
visualized several erythrocytes at the centrer of the tumor nests
and non-vascular structure between the surrounding tumor cells and
erythrocytes (Fig. 2E). VM in
histology appears multiple, with ECM-rich PAS-positive networks and
surrounding clusters of tumor cells, while VM structures were
strictly defined as CD31-negative PAS-positive
structures (6), thus VM existed in
GBC-SD xenografts (9/10, 90.0%). However, microscopically similar
phenomenon failed to occur in the xenografts in TIMP-2, NCTD or
NCTD+TIMP-2 group, with destroyed cellular organelles, vacuolar
degeneration, cell necrosis, nuclear pyknosis, fragmentation and
apoptotic bodies; and these inhibited and destroyed microscopical
phenomena are more obvious in NCTD+TIMP-2 group than TIMP-2 or NCTD
group (Fig. 2E). The results
showed that highly aggressive GBC-SD cells were able to form VM
networks when injected subcutaneously into the mice, and
facilitated xenograft growth; that NCTD+TIMP-2 more effectively
inhibited VM formation and tumor growth of the xenografts than NCTD
or TIMP-2 in vivo. Thus, we concuded that NCTD enhanced
TIMP-2 antitumor and anti-VM activities for GBC-SD nude mouse
xenografts in vivo.
NCTD enhances anti-VM activity for GBC-SD
nude mouse xenografts through affecting VM hemodynamics in
vivo
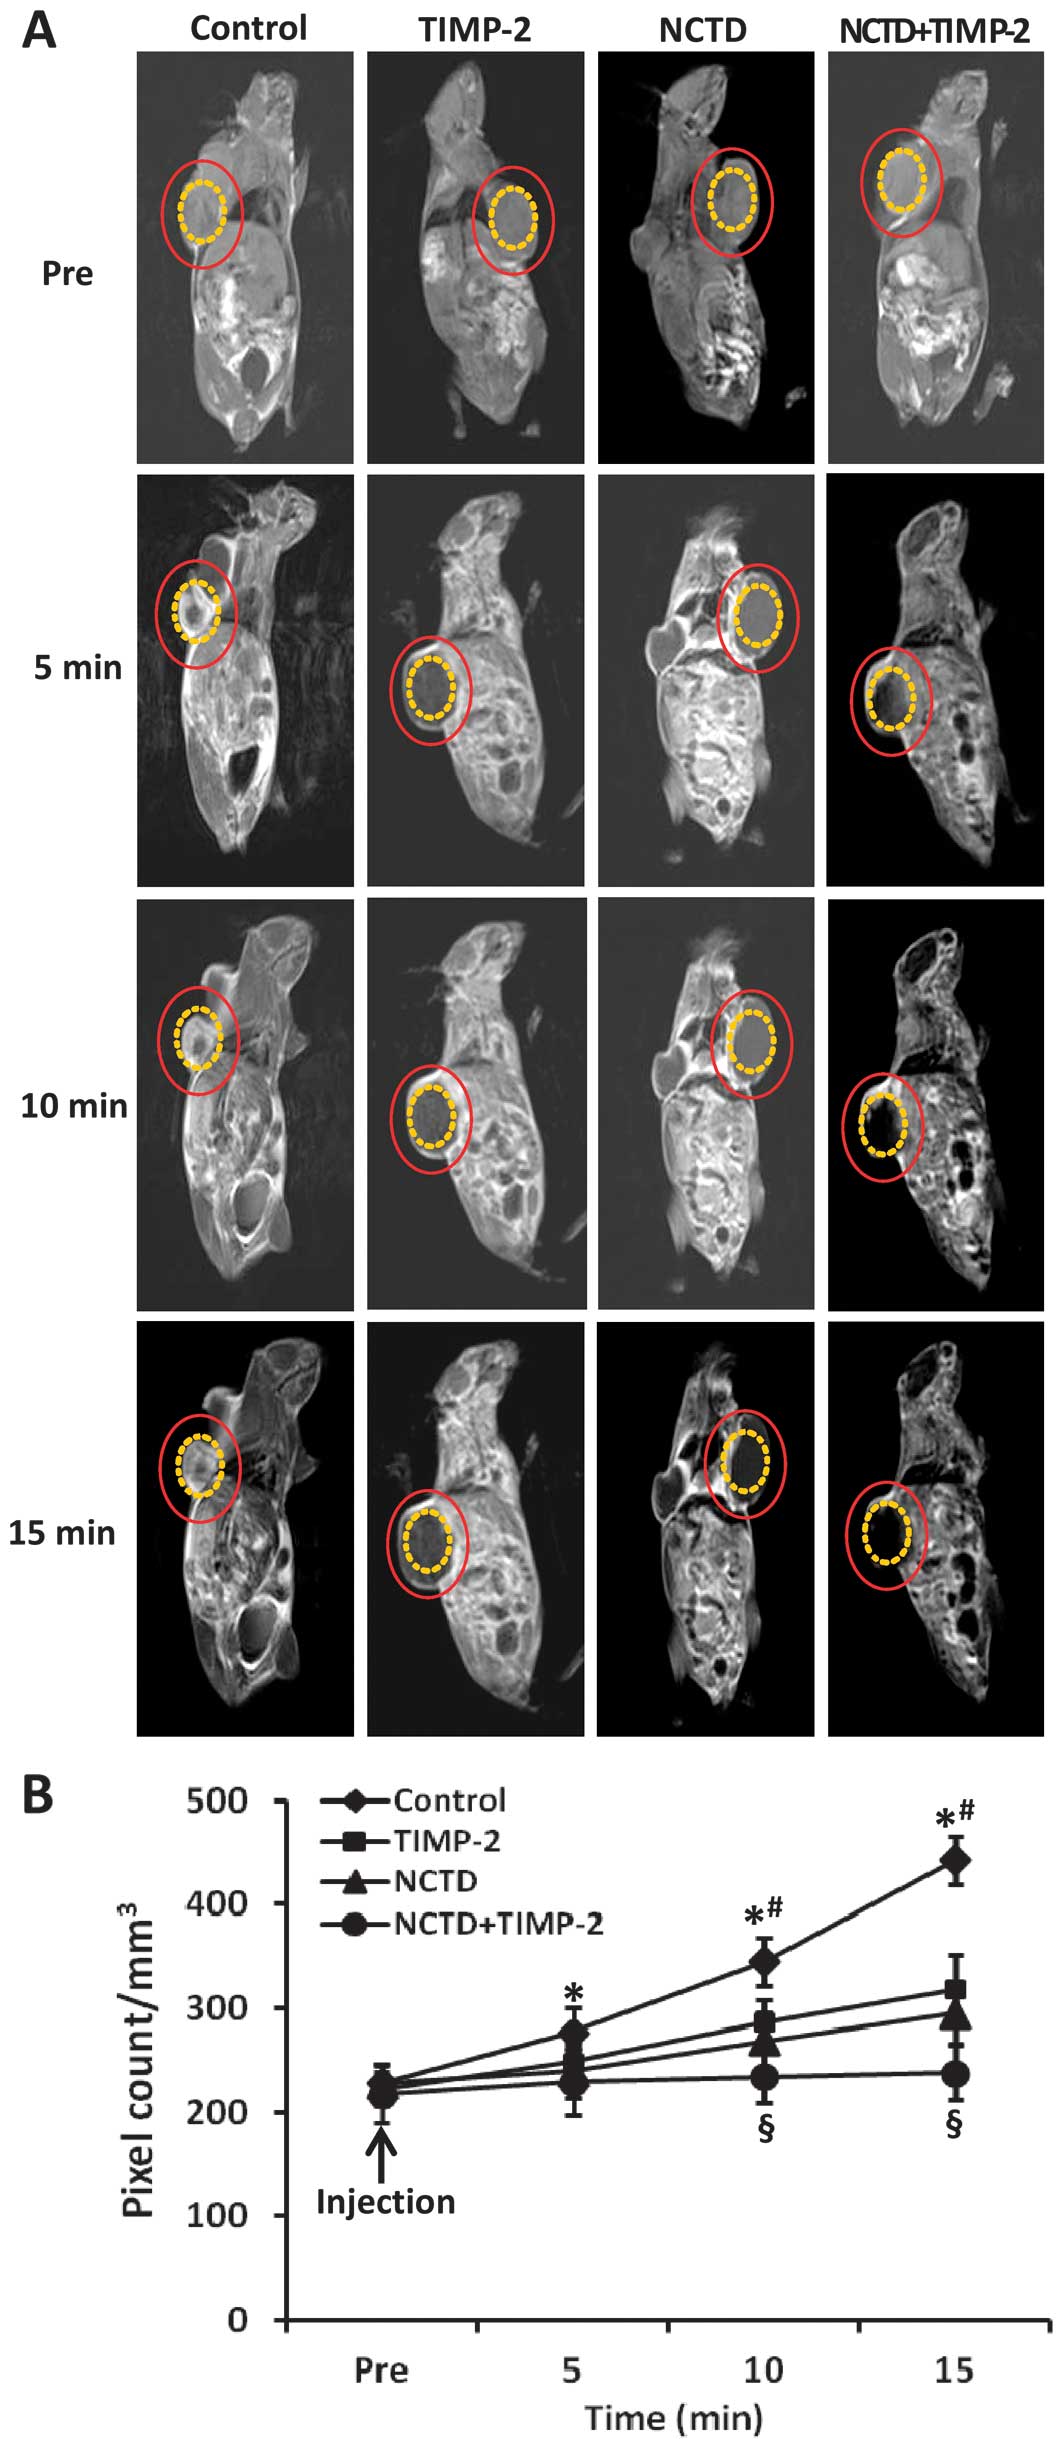
Two-millimeter interval horizontal scanning of the
xenografts was conducted to compare tumor signal intensities of the
xenograft mice by dynamic micro-MRA with an intravascular
macromolecular MRI contrast agent HAS-Gd-DTPA. As shown in Fig. 3, the xenograft center in control
group exhibited a gradually increased multiple high-intensity MRI
signal (pixel count/mm3), i.e., higher occurrence of VM
observed in the xenograft center, a result correlating with
pathological VM (all P<0.001). However, the center region of the
xenografts in TIMP, NCTD or NCTD+TIMP-2 group exhibited a low
intensity MRI signal or a lack of signal change in intensity as
compared to control group, a result consistent with central
ischemic necrosis, disappearance of nuclei, and apoptosis; and
these MRI signals were much less in NCTD+TIMP-2 group than TIMP-2
or NCTD group (P<0.001), no difference on signal intensity was
observed between NCTD group and TIMP-2 group. Thus, we deduced that
NCTD enhanced antitumor and anti-VM activities for GBC-SD
xenografts through affecting VM hemodynamic and inducing the
ischemic necrosis of the xenografts in vivo.
NCTD enhances TIMP-2 anti-VM activity for
GBC-SD cells through inhibiting VM-like network formation in
vitro
To further verify TIMP-2 anti-VM activity enhanced
by NCTD, we observed VM-like networks formed in GBC-SD 3-D matrices
in vitro. As shown in Fig.
4, in the control group, GBC-SD cells were able to form hollow
tubular networks and microstructures when cultured on Matrigel and
rat-tail collagen type I; and PAS-positive, cherry-red VM
base-membrane materials were found in granules and patches in the
cytoplasm of GBC-SD cells appeared around the signal cell or cell
clusters by PAS staining without hematoxylin counterstain. But in
the process of network formation, using TIMP-2, NCTD or NCTD+TIMP-2
for 2 days, GBC-SD cells lost the capacity of the above VM-like
network formation, with visible cell aggregation, float, nuclear
fragmentation; using TIMP-2, NCTD or NCTD+TIMP-2 for 2–4 days after
network formation, the already formed VM-like networks from GBC-SD
3-D matrices were inhibited or destroyed, with visible cell
aggregation, deformed collagen framework, less microvilli, vacuolar
degeneration, nuclear fragmentation and typical apoptotic bodies;
and more obvious inhibition or destruction of the above forming and
formed VM-like structure was observed in NCTD+TIMP-2 group than
TIMP-2 or NCTD group (Fig. 4). It
was showed that NCTD+TIMP-2 more effectively inhibited and
destroyed the forming VM and formed VM in GBC-SD cells in
vitro, thus confirmed that NCTD enhanced TIMP-2 anti-VM
activity for GBC-SD cells in vitro.
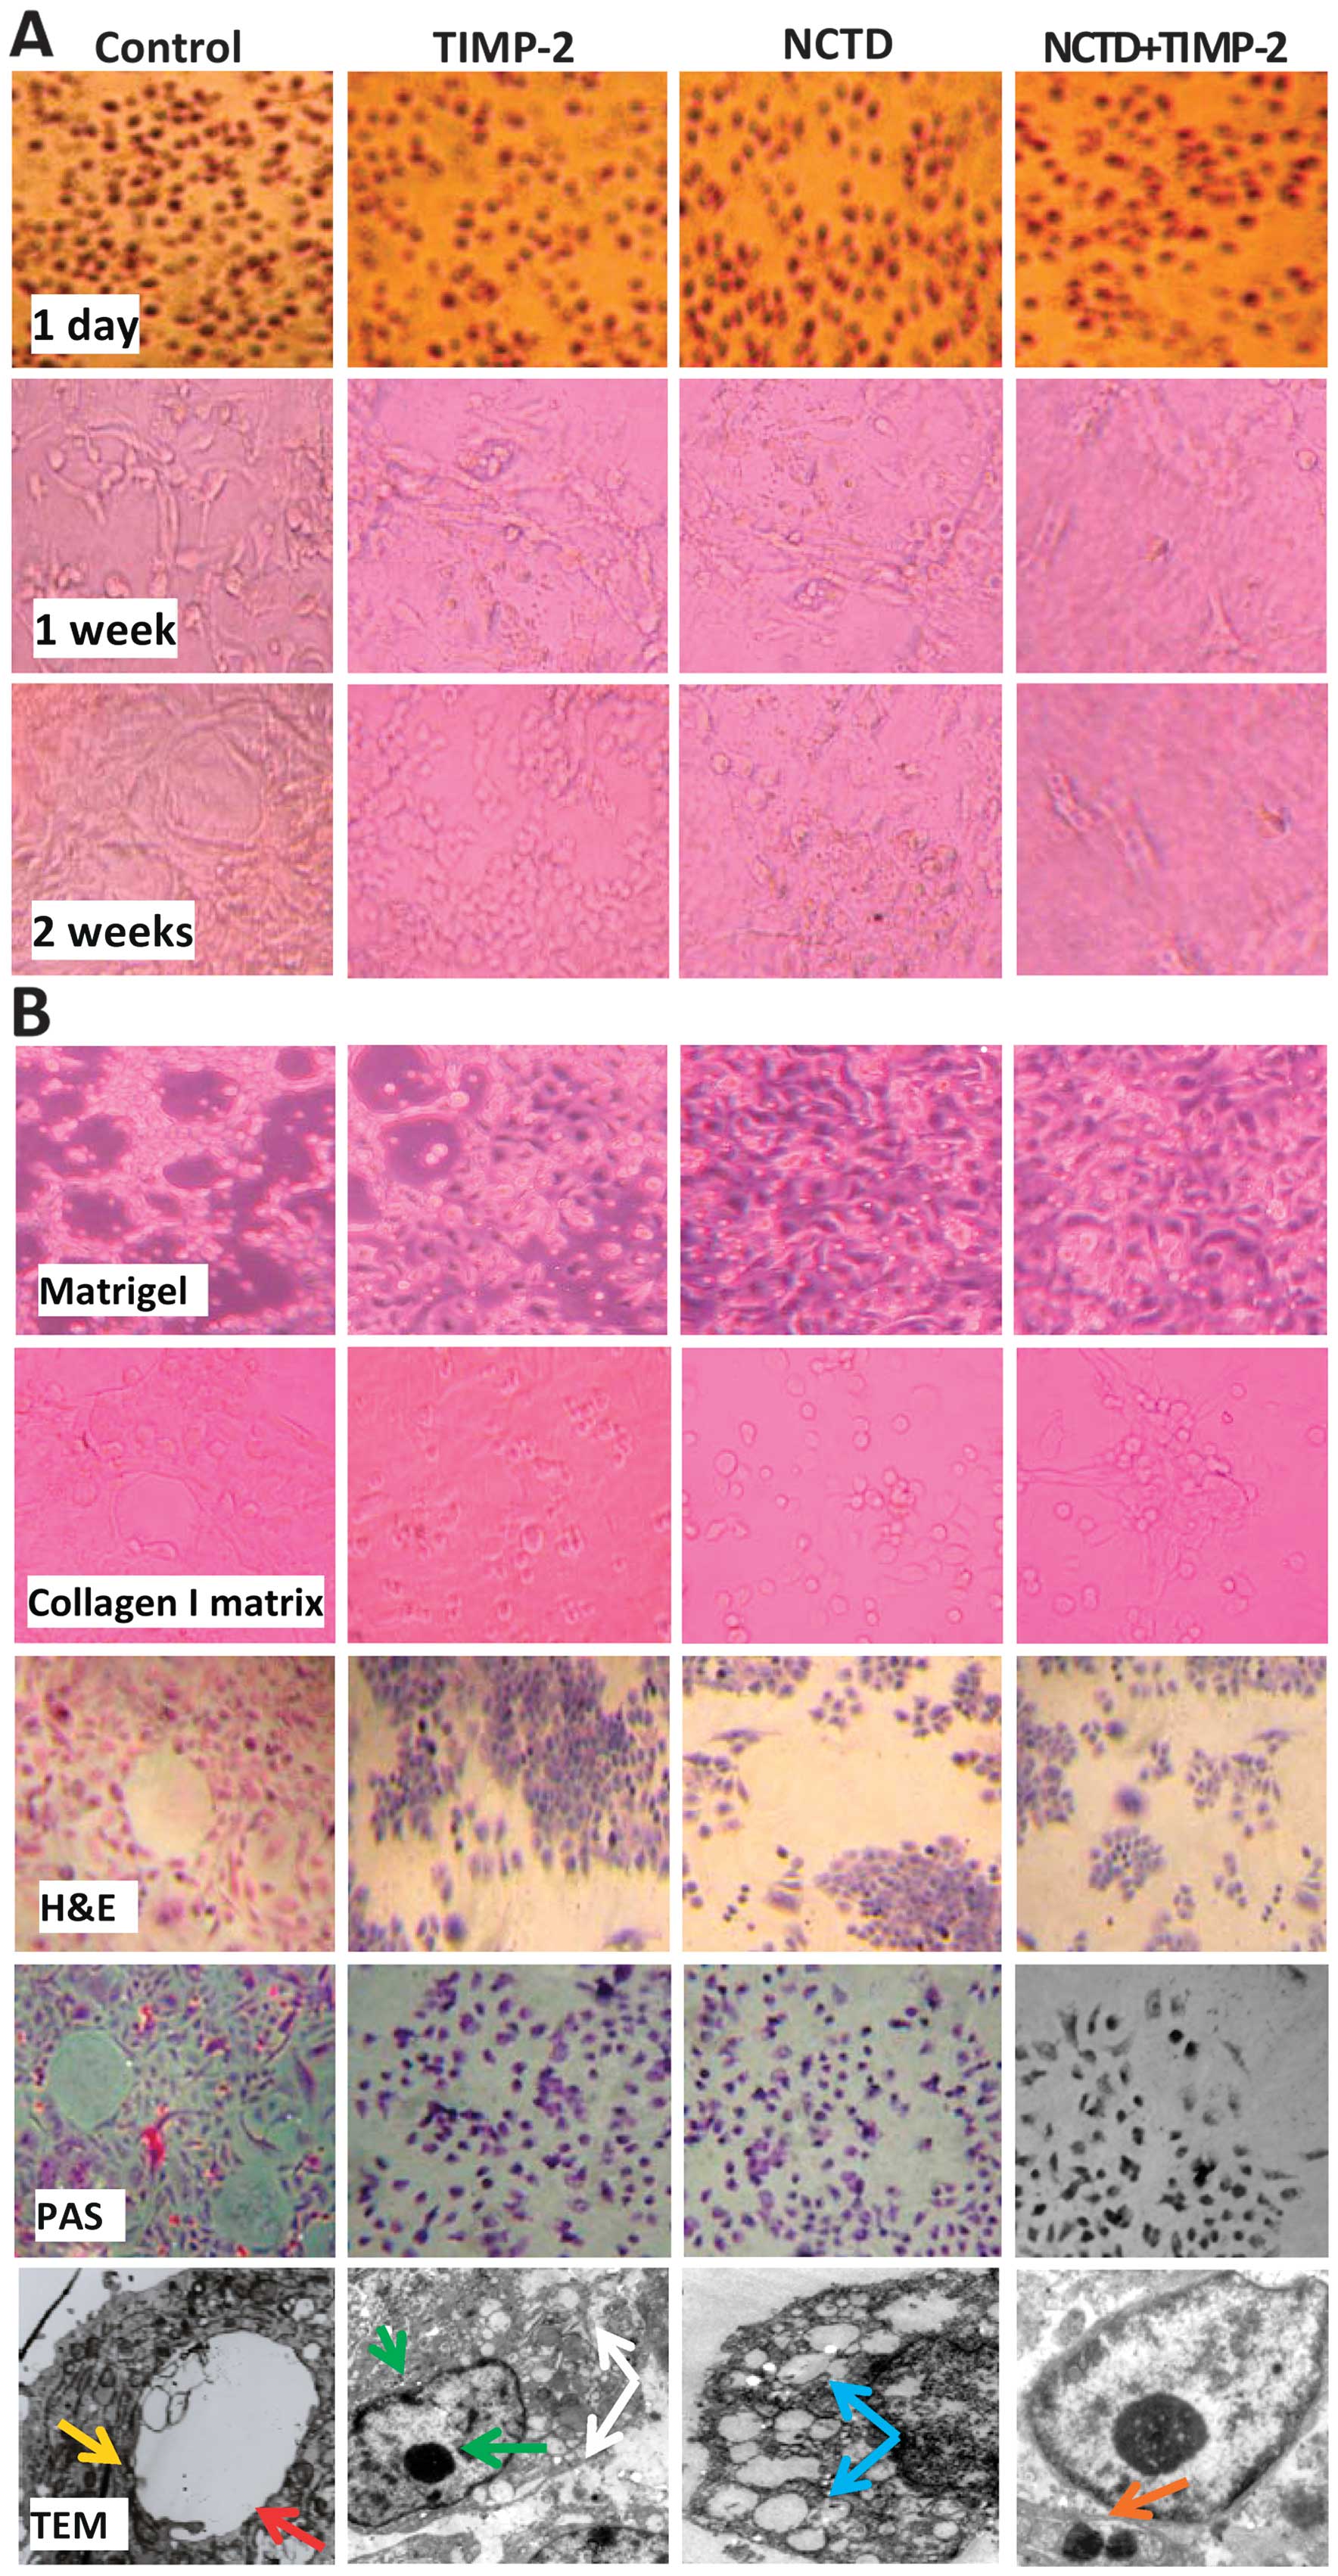 | Figure 4The forming and formed vasculogenic
mimicry (VM)-like networks of the 3-D matrix of GBC-SD cells in
vitro under a phase contrast microscope and an electron
microscope. (A) The forming VM-like networks of the 3-D matrix.
GBC-SD cell-formed networks in control group initiated formation
within 48 h after seeding, matured after 1 week, formed optimal
VM-like structure by 2 weeks; but in the process of network
formation, using tissue inhibitor of matrix metalloproteinase-2
(TIMP-2), norcantharidin (NCTD) or NCTD+TIMP for 2 days, GBC-SD
cells lost the capacity of the above VM-like network formation,
with visible cell aggregation, float, nuclear fragmentation; and
more obvious inhibition of the forming VM-like structure was
observed in NCTD+TIMP-2 group. (B) The formed VM-like networks of
the 3-D matrix. In control group, GBC-SD cells formed the optimal
patterned, VM-like networks when cultured on Matrigel and rat-tail
collagen type I matrix [including hematoxylin and eosin (H&E)
staining] for 2 weeks, periodic acid-Schiff (PAS) positive,
cherry-red materials found in granules and patches in the cytoplasm
appeared around the signal cell or cell clusters by PAS staining
without hematoxylin counterstain (original magnification, all
×200); and channelized or hollowed VM-like network microstructures
visualized under transmission electron microscopy (TEM) (original
magnification, ×1,200) with clear microvilli surrounding cluster of
tumor cells (red arrow), cellular organelle structures, and cell
connection with an increased electron density in density (yellow
arrow). After this, using TIMP-2, NCTD or NCTD+TIMP-2 for 2–4 days,
the already formed VM-like networks from the 3-D matrix were
inhibited or destroyed, with visible deformed collagen framework,
decreased microvilli, destroyed cellular organelles (white arrows),
vacuolar degeneration (blue arrow), nuclear pyknosis and
fragmentation (green arrows), and typical apoptotic bodies (brown
arrows); and more obvious inhibition or destruction of the formed
VM-like structure was observed in NCTD+TIMP-2 group. |
NCTD enhances TIMP-2 anti-VM activity in
GBC-SD cells through disturbing malignant phenotypes in vitro
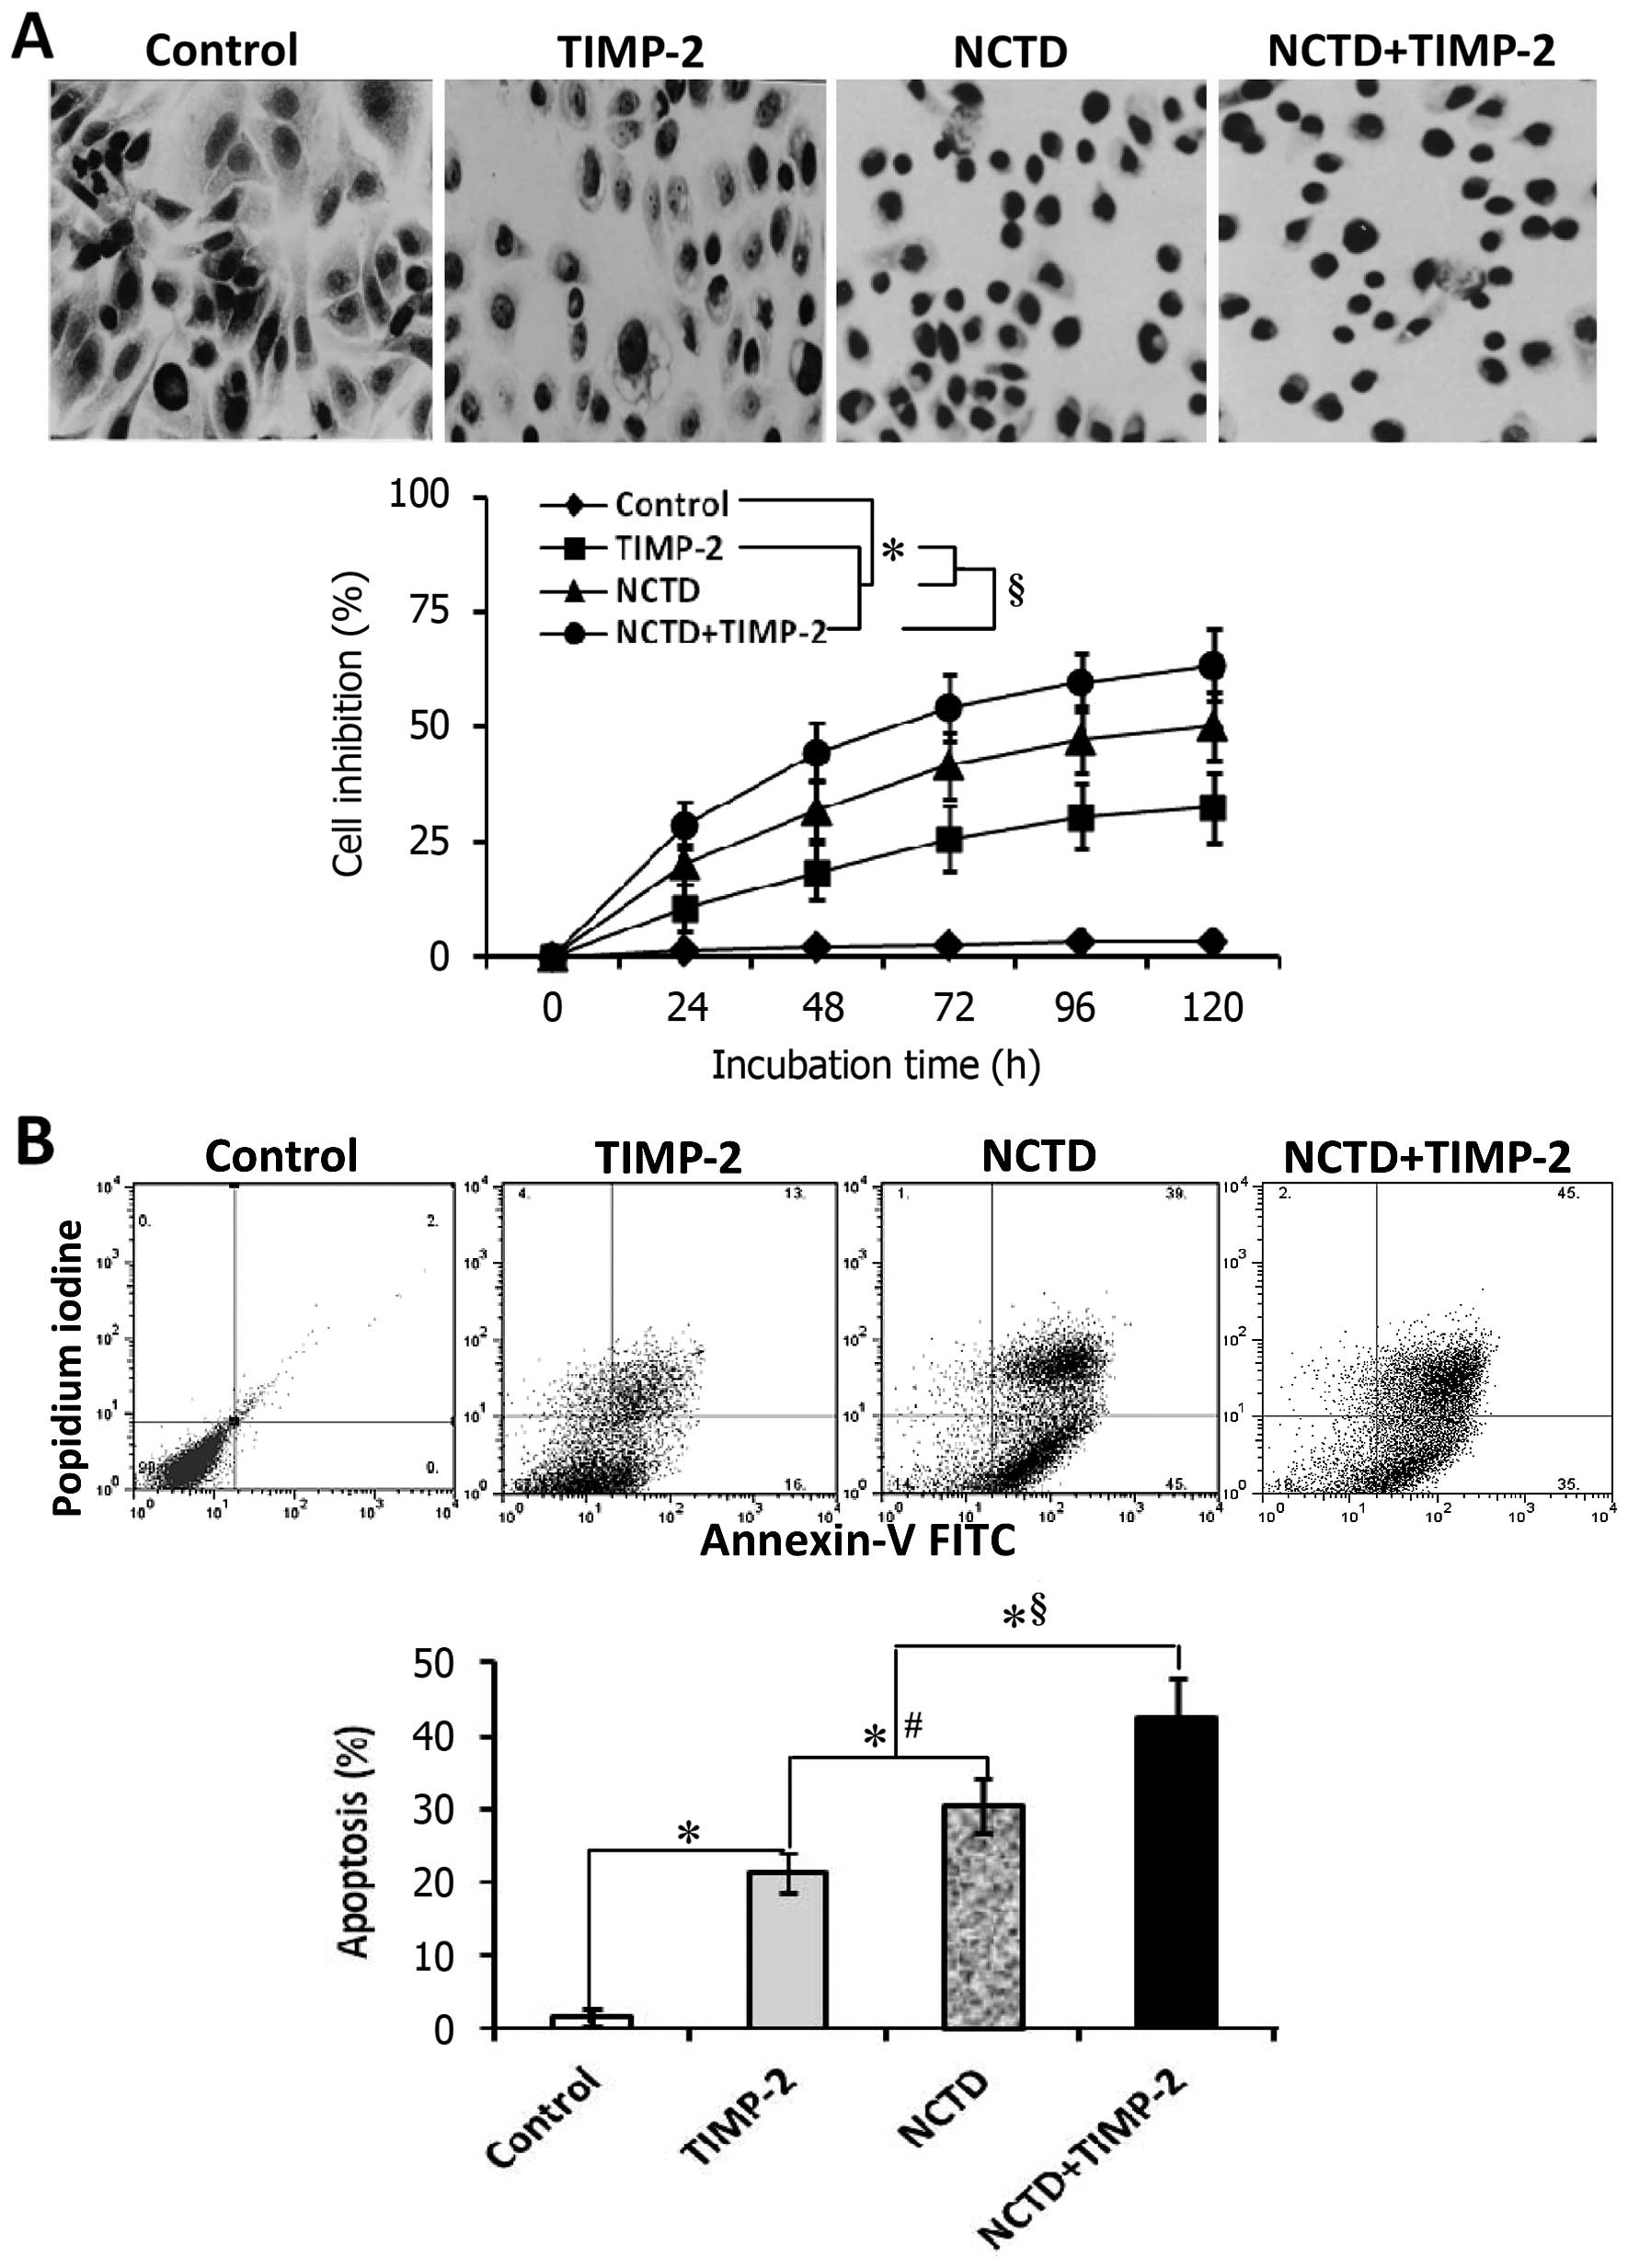
To confirm that NCTD enhances TIMP-2 anti-VM
activity, we further observed the effects of NCTD+TIMP-2 on
malignant phenotypes of GBC-SD cells such as proliferation,
apoptosis, invasion and migration in vitro. In this
experiment, the morphology of treated GBC-SD cells showed visible
cell aggregation, float, nuclear fragmentation, cataclysms; and a
significant inhibition of cell proliferation in a time-dependent
manner was observed in TIMP-2, NCTD or NCTD+TIMP-2 group as
compared to control groups (Fig.
5A, all P<0.001). These results were confirmed by apoptotic
assay and microstructure observation, which revealed that apoptosis
percent of GBC-SD cells (total cells under right quadrant of cells)
was significantly increased as compared to control group (Fig. 5B, P<0.001); decrease in
microvillus, cytoplast vacuoles, nuclear shrinkage, chromatin
aggregation and typical apoptotic bodies were observed under TEM
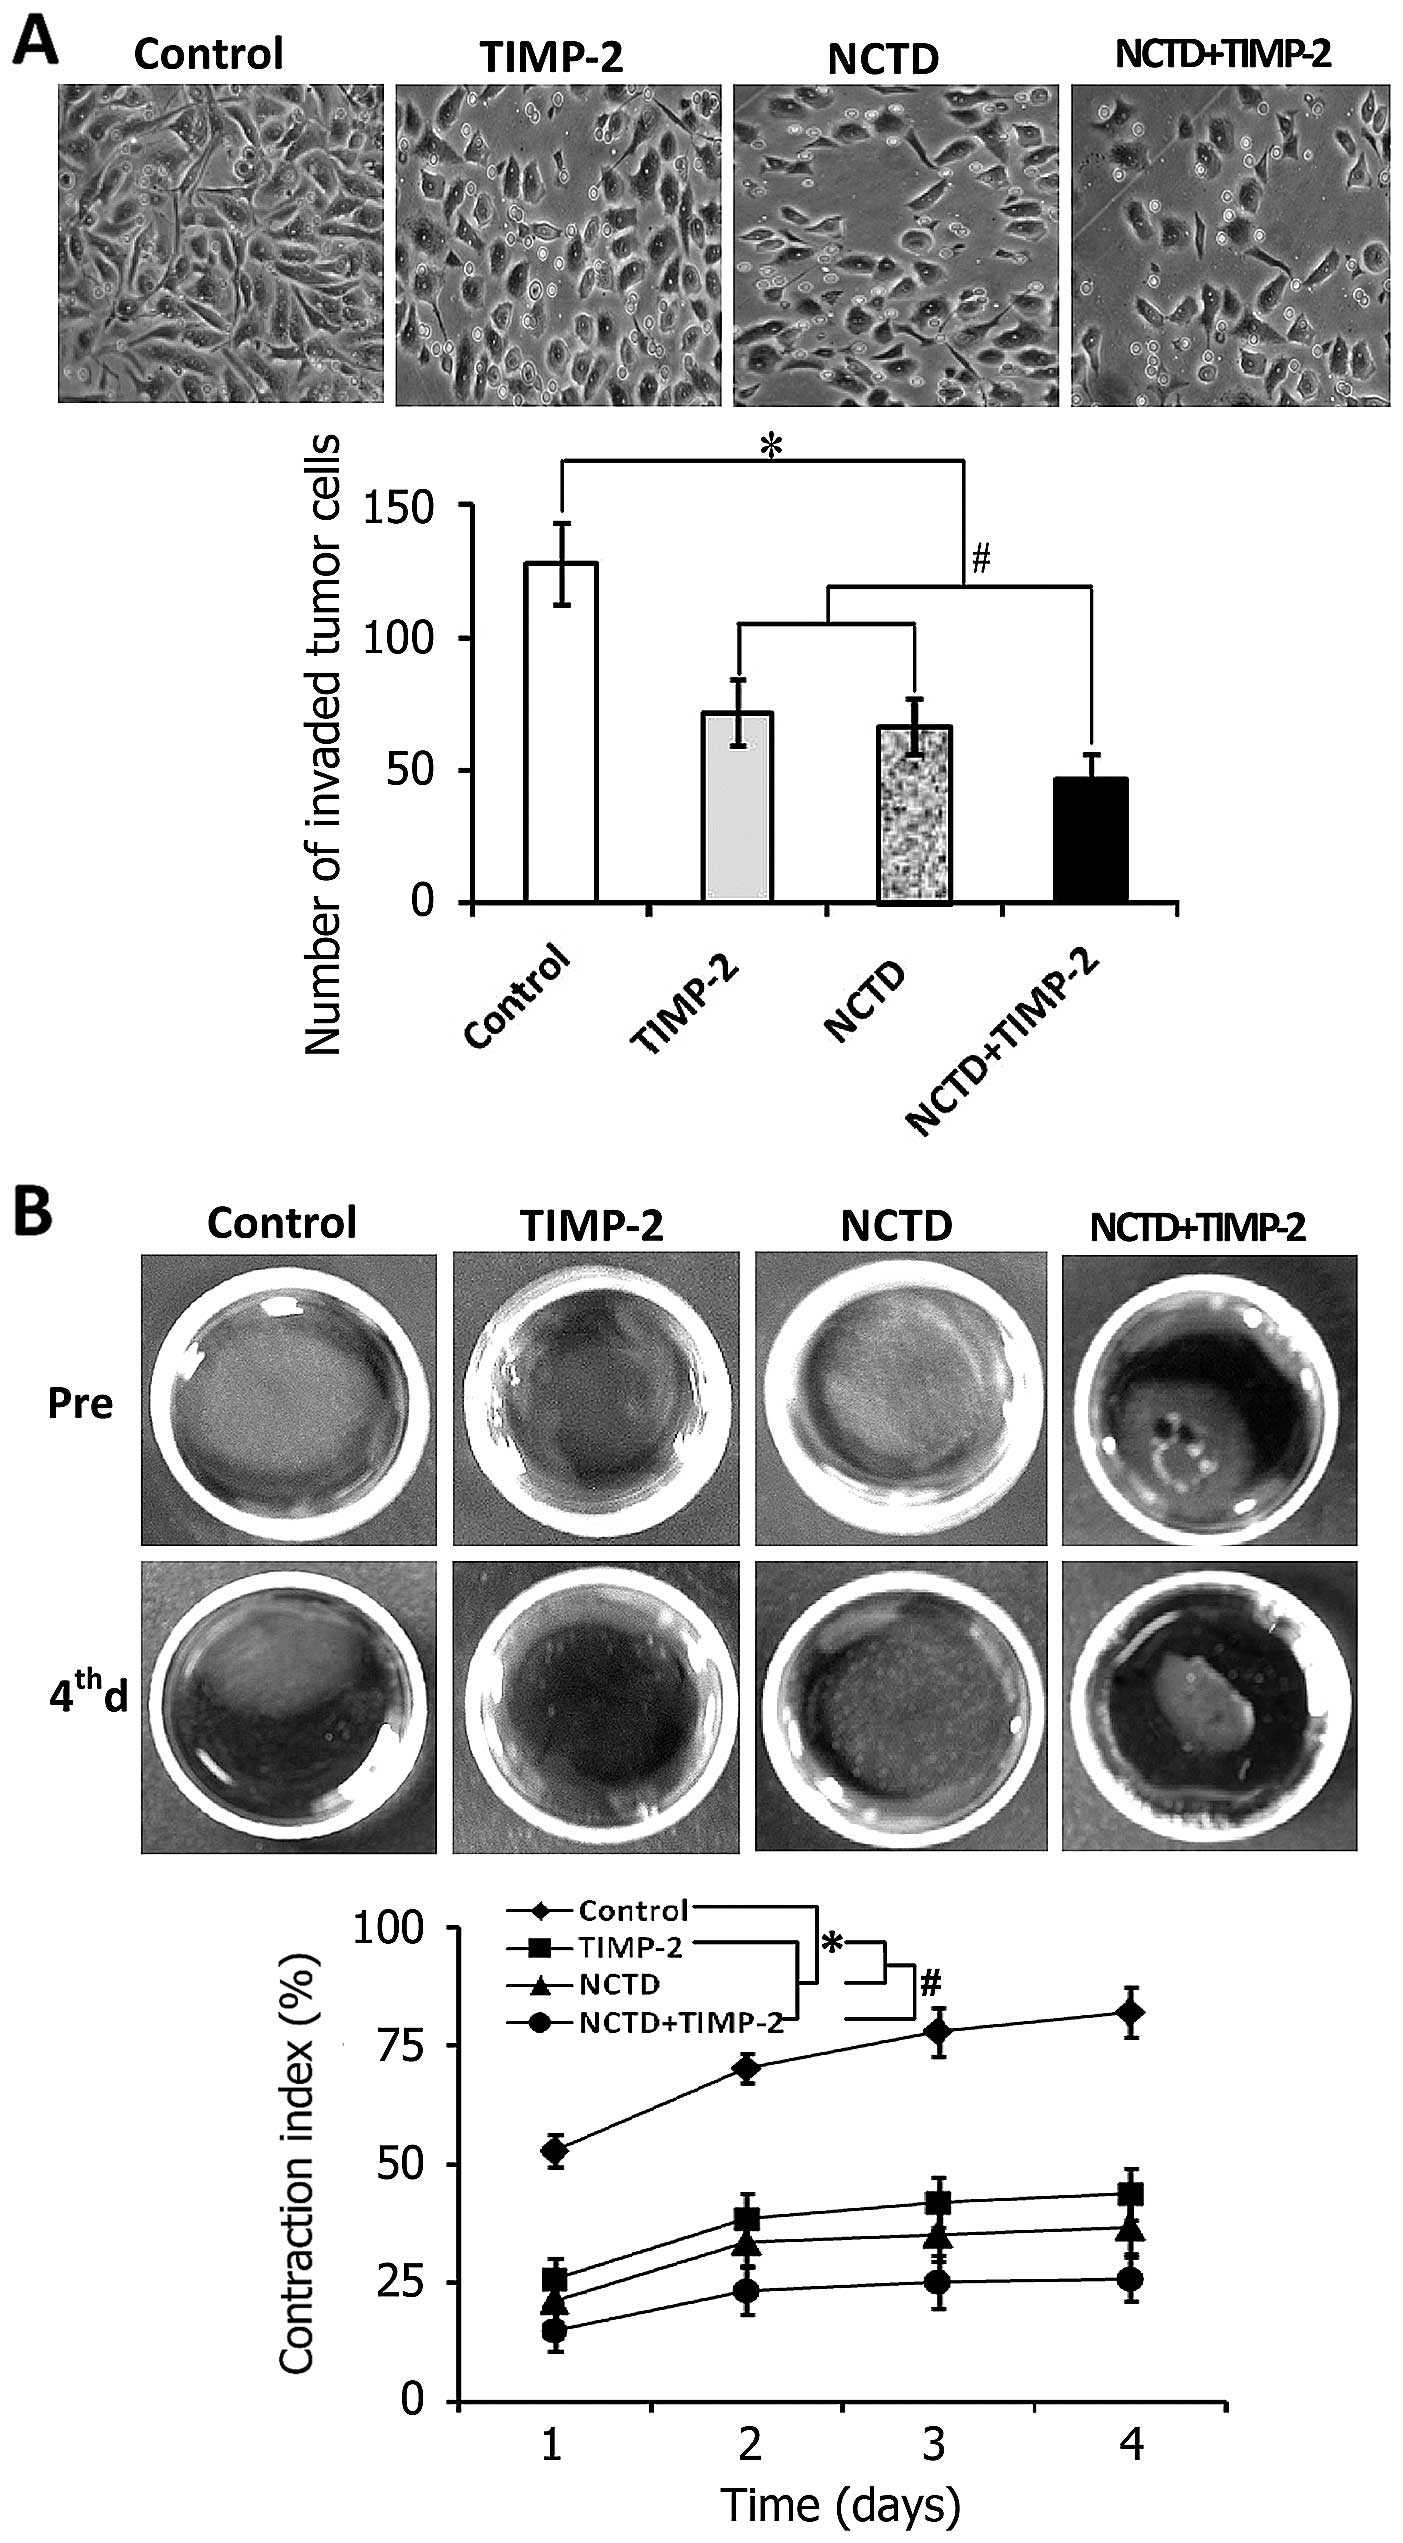
(Fig. 4B). In addition, the number
of invaded GBC-SD cells in TIMP-2, NCTD or NCTD+TIMP-2 group was
much less than that of control group (Fig. 6A, all P<0.001); a significant
decreased gel CI of treated GBC-SD cells was observed as compared
to control group from 1 to 4 days (Fig. 6B, all P<0.001), without
different CI between TIMP-2 group and NCTD group. Interestingly,
malignant phenotypes of GBC-SD cells such as proliferation,
apoptosis, invasion and migration were significantly influenced in
NCTD+TIMP-2 group, i.e., proliferation, invasion and migration of
GBC-SD cells were significantly inhibited, apoptosis percent of
GBC-SD cells was markedly increased as compared to TIMP-2 or NCTD
group (Figs. 5 and 6, P<0.01). Taken together, these in
vitro results indicated that NCTD enhanced TIMP-2 anti-VM
activity for GBC-SD cells through disturbing the malignant
phenotypes of GBC-SD cells in vitro.
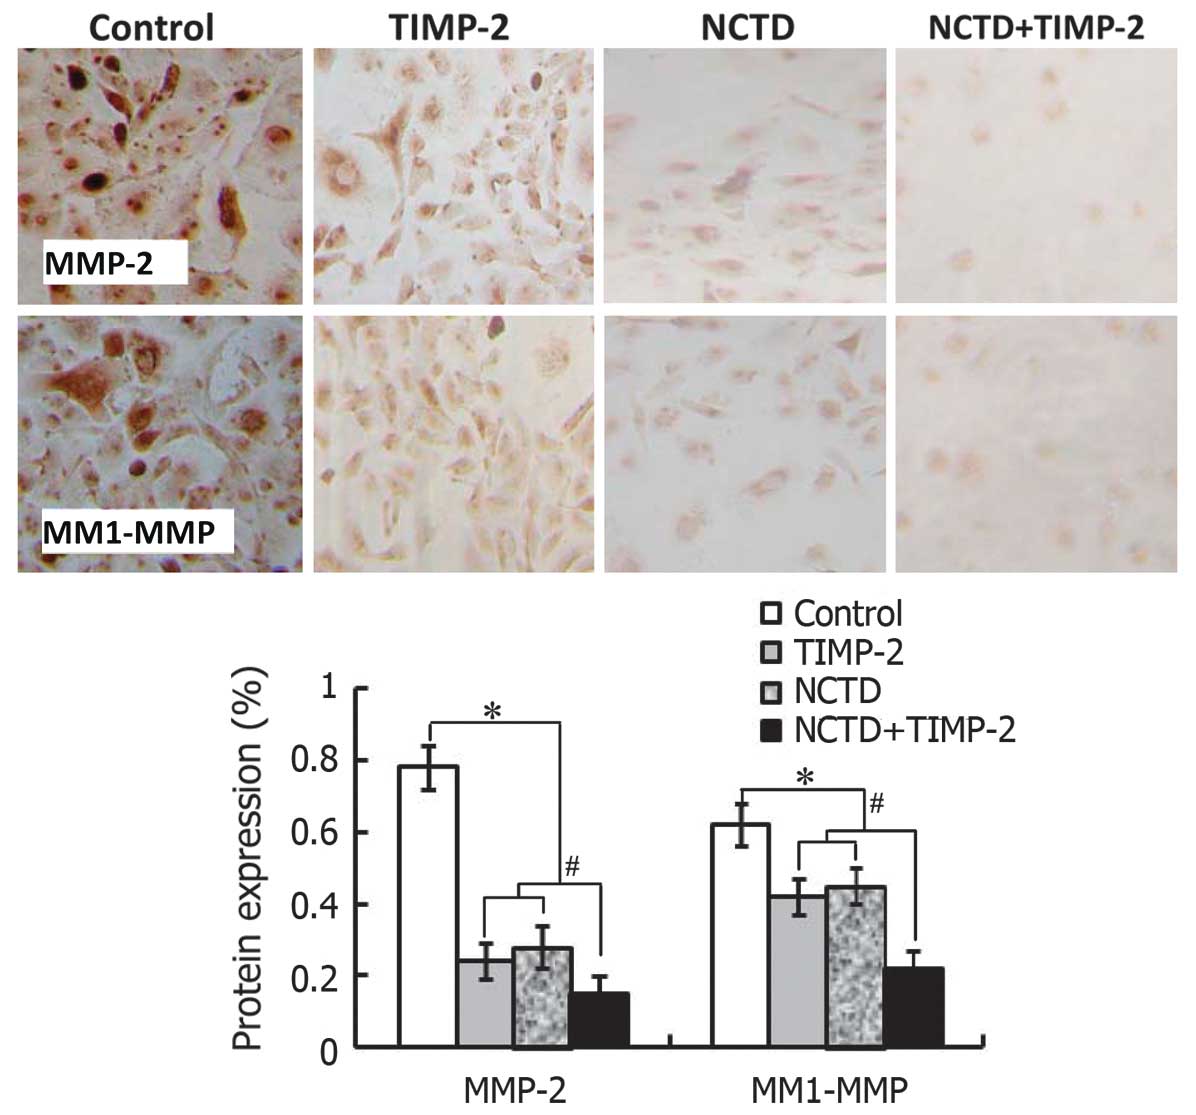
NCTD enhances TIMP-2 anti-VM activity
through downregulating expression of MMP-2 and MT1-MMP
The above clinical experiment on human GBCs showed
that expression of MMP-2 and MT1-MMP was significantly related to
VM in GBC patients. In this study, we further evaluated whether
expression of MMP-2 and MT1-MMP correlates with VM formation of
GBC-SD 3-D matrices in vitro and xenografts in vivo,
and if NCTD enhances TIMP-2 anti-VM activity through affecting
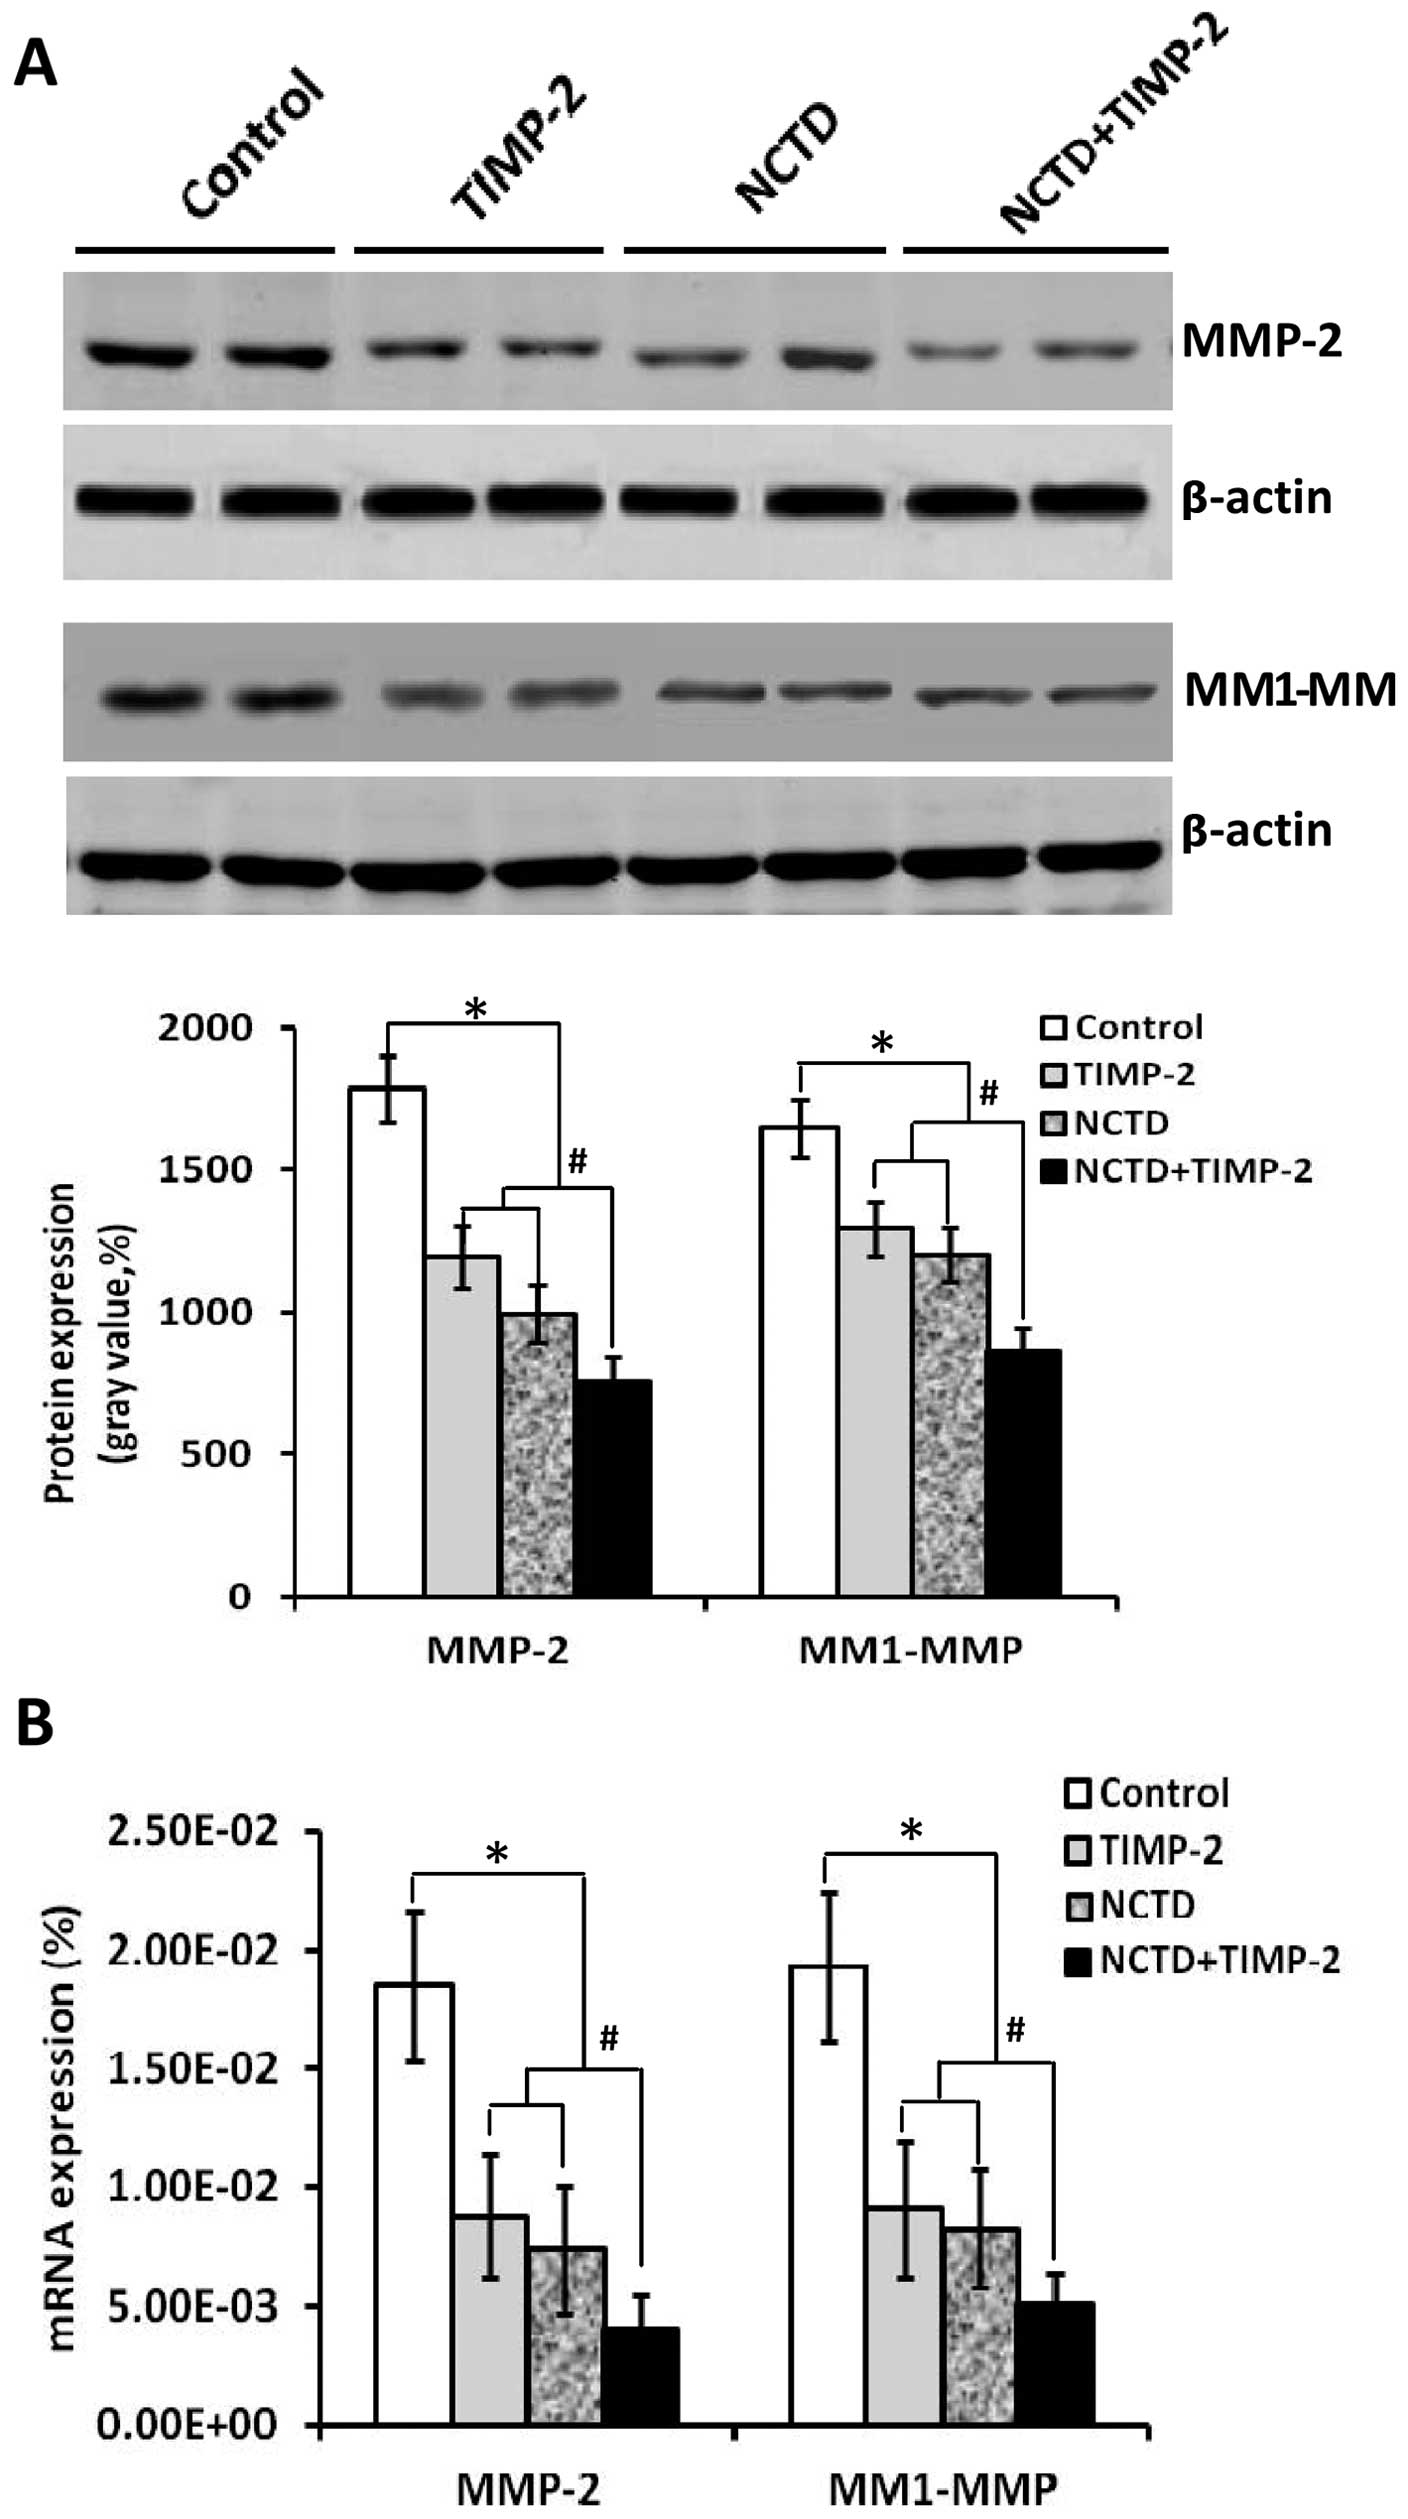
expression of these molecules. As shown in Figs. 7–9, expression of MMP-2 and MT1-MMP
proteins/mRNAs (SABC, immunofluorescence, western blotting or
RT-PCR) from sections of GBC-SD 3-D cultures in vitro and/or
the xenografts in vivo in control group were all
upregulated. However, expression of these proteins/mRNAs in TIMP-2,
NCTD or NCTD+TIMP-2 group were significantly downregulated as
compared to control group (all P<0.001); expression of these
proteins/mRNAs was much less in NCTD+TIMP-2 group than those of
TIMP or NCTD group (P<0.01), whereas no difference in expression
of these molecules was observed between NCTD group and TIMP-2
group. Thus, these in vitro and in vivo results
indicated that expression of MMP-2 and MT1-MMP in VM formation of
GBC-SD cells and xenografts was significantly increased; and that
NCTD enhanced TIMP-2 anti-VM activity in GBC-SD cells and
xenografts through downregulating expression of MMP-2 and
MT1-MMP.
Discussion
VM is a newly defined tumor microcirculation pattern
in some highly aggressive malignant tumors which differs from
endothelium-dependent angiogenesis and describes the unique ability
of highly aggressive tumor cells to express endothelial
cell-associated genes, and forms ECM-rich, patterned tubular
networks, and is related to the poor prognosis of patients
(6,7). We recently reported that VM existed
in human GBCs, the 3-D matrices and the xenografts of highly
aggressive GBC-SD cells, correlating with the poor prognosis; and
the formation of VM in GBCs through the activation of the
PI3-K/MMPs/Ln-5γ2 or/and the EphA2/FAK/Paxillin signaling pathways
in vitro and in vivo (25–28).
In this study, we further investigated that expression of MMP-2 and
MT1-MMP among human GBC specimens, GBC-SD 3-D matrices and nude
mouse xenografts were related to VM in GBCs. The clinical results
showed that expression of MMP-2, MT1-MMP in VM-positive GBCs was
significantly higher than those in VM-negative GBCs (Fig. 1); a positive correlation between
MMP-2 (r=0.374, P=0.0003) or MT1-MMP (r=0.449, P=0.0001) expression
and VM in human GBCs, a shorter survival time of VM-positive GBC
patients than that of VM-negative GBC patients, and a worse
survival of VM-positive GBC patients with high expression of MMP-2
or MT1-MMP than that of the patients with low expression were,
respectively, observed (Fig. 1).
Furthermore, the in vitro and in vivo results
indicated overexpression of MMP-2 and MT1-MMP at protein and mRNA
levels from sections with VM formation of GBC-SD 3-D cultures in
vitro and GBC-SD xenografts in vivo (Figs. 7–9). Thus, expression of MMP-2 and MT1-MMP
was considered to significantly relate to VM in human GBCs.
Worse treatment results, poor prognosis and high
aggressiveness in patients with GBCs, have been reported in sole
application of adjuvant therapies for the disease, in particular,
when in antitumor treatment for highly aggressive tumors with VM
(15–17). It is thus necessary to develop more
effective comprehensive therapies such as combining anti-VM or
anti-angiogenic drugs with conventional chemotherapies, or
traditional Chinese medicines which have multifunctional antitumor
activities. TIMP-2 is considered to have the anti-VM activity for
VM in some highly aggressive malignant tumors (23), and to prevent the formation of
vasculogenic-like patterned networks (24). We reported that recombinant TIMP-2
inhibited VM formation in GBCs when added to the 3-D matrices of
GBC-SD cells and injecting into GBC-SD xenografts (28). NCTD is a demethylated,
low-cytotoxic derivative of cantharidin with antitumor properties,
which is an active ingredient of the traditional Chinese medicine
Mylabris, also a small-molecule compound synthesized from furan and
maleic anhydride via the Diels-Alder reaction (29–31).
It has been reported that NCTD inhibits the proliferation and
growth of various human tumor cells and is clinically used to treat
hepatic, gastric, colorectal and ovarian cancers (32–34).
We have reported that NCTD has multiple antitumor activities for
GBCs in vitro and in vivo (10,35–38).
In this study, we investigated whether NCTD enhanced TIMP-2
antitumor and anti-VM activities for GBC-SD cells and xenografts.
The in vivo results showed that the xenograft volume was
markedly decreased, tumor inhibition was significantly increased in
TIMP-2, NCTD or NCTD+TIMP-2 group as compased to control group
(Fig. 2, all P<0.001); these
changes of the xenograft volume and the tumor inhibition were more
obvious in NCTD+TIMP-2 group than those in NCTD or TIMP-2 group
(Fig. 2, all P<0.01); the
survival time of the xenograft mice in NCTD, TIMP-2 or NCTD+TIMP-2
group was greatly prolonged as compared to control group (Fig. 2, log-rank test, P=0.0115), whilst
without difference on survival time among TIMP-2, NCTD and
NCTD+TIMP-2 groups. In addition, VM-like channels in the xenografts
in vivo and the forming and formed VM-like networks from
GBC-SD 3-D matrices in vitro were significantly inhibited in
TIMP-2, NCTD or NCTD+TIMP-2 group, with destroyed cellular
organelles, vacuolar degeneration, cell necrosis, nuclear pyknosis,
fragmentation and apoptotic bodies; and these microscopical
phenomena are more obvious in NCTD+TIMP-2 group than TIMP-2 or NCTD
group (Figs. 2 and 4). It was demonstrated that NCTD+TIMP-2
more effectively inhibited VM formation, tumor growth of the
xenografts in vivo and the forming, and formed VM from the
3-D cultures of GBC-SD cells in vitro than NCTD or TIMP-2.
Thus, we concuded that NCTD enhanced TIMP-2 antitumor and anti-VM
activities for GBC-SD cells in vitro and the xenografts
in vivo.
To confirm that NCTD enhances TIMP-2 anti-VM
activity, we further observed the effects of NCTD+TIMP-2 on VM
hemodynamics in the xenografts in vivo and the malignant
phenotypes of GBC-SD cells such as proliferation, apoptosis,
invasion and migration in vitro. The results showed that the
xenograft center in TIMP, NCTD or NCTD+TIMP-2 group exhibited a low
intensity MRI signal or a lack of signal intensity change as
compared to control group (Fig.
3), a result consistent with central ischemic necrosis,
disappearance of nuclei and apoptosis; and these MRI signals were
much less in NCTD+TIMP-2 group than TIMP-2 or NCTD group
(P<0.001). A significant inhibition of GBC-SD cell proliferation
in a time-dependent manner was observed in TIMP-2, NCTD or
NCTD+TIMP-2 group as compared to control groups (Fig. 5, all P<0.001). These
observations were confirmed by significantly increased cell
apoptosis (Fig. 5, P<0.001) and
microstructure changes such as microvillus decrease, cytoplast
vacuoles, nuclear shrinkage, chromatin aggregation and typical
apoptotic bodies (Fig. 4). In
addition, a much smaller number of invaded and a significantly
decrease gel CI of GBC-SD cells in TIMP-2, NCTD or NCTD+TIMP-2
group were also observed as compased to control group (Fig. 6, all P<0.001); interesting,
GBC-SD cell malignant phenotypes such as proliferation, apoptosis,
invasion and migration were significantly influenced in NCTD+TIMP-2
group as compared to TIMP-2 or NCTD group (Figs. 5 and 6, P<0.01). These in vivo and
in vitro results indicated that NCTD enhanced TIMP-2
antitumor and anti-VM activities for GBCs through affecting VM
hemodynamics and inducing xenograft ischemic necrosis in
vivo, and interfering with these malignant phenotypes in GBC-SD
cells in vitro.
Molecular events underlying VM displayed by highly
aggressive GBCs and molecular mechanisms responsible for the NCTD
antitumor are not thoroughly elucidated. Therefore, understanding
the key molecular mechanisms that regulate VM in human GBCs and the
exact mechanism of NCTD antitumor are important events and provide
potential targets for new therapies of GBCs. In view of the
importance of several key molecules or signaling pathways such as
PI3-K, MMPs, Ln-5γ2, ECK2/EphA2 and FAK in promoting VM formation
in aggressive malignant tumors (46) and VM formation in GBCs through the
activation of the EphA2/FAK/Paxillin and the PI3-K/MMPs/Ln-5γ2
signaling pathways (28), we
recently studied the effects of NCTD on tumor growth and VM in
highly aggressive GBCs and its underlying mechanisms; the results
have shown that NCTD inhibited tumor growth and VM in highly
aggressive GBCs via blocking the PI3-K/MMPs/Ln-5γ2 or/and
EphA2/FAK/Paxillin signaling pathways (37,38).
Because expression of MMP-2 and MT1-MMP were significantly related
to VM in GBCs, we further observed in this study that NCTD enhanced
TIMP-2 anti-VM activity through affecting the expression of these
molecules. The in vitro and in vivo results showed
that expression of MMP-2 and MT1-MMP proteins/mRNAs from sections
of GBC-SD xenografts and GBC-SD cells in TIMP-2, NCTD or
NCTD+TIMP-2 group was significantly downregulated as compared to
control group (all P<0.001); expression of these proteins/mRNAs
was much less in NCTD+TIMP-2 group than those of TIMP or NCTD group
(P<0.01), whereas no difference was seen between NCTD group and
TIMP-2 group. Thus, NCTD enhanced TIMP-2 anti-VM activity for
GBC-SD cells and xenografts through downregulating expression of
MMP-2 and MT1-MMP.
PI3-K/MMPs/Ln-5γ2 and EphA2/FAK/Paxillin signaling
pathways represent the predominant targets for anti-VM of tumors
and cancer therapy. MMP-2 and MT1-MMP are key molecules and
important mediators in the PI3-K/MMPs/Ln-5γ2 and the
EphA2/FAK/Paxillin which regulated VM formation of aggressive
malignant tumor cells (28,37,38).
As an important adjustor of directly affecting the cooperative
interactions of MT1-MMP and MMP-2 activity, PI3-K regulates MT1-MMP
and MMP-2 activity, promotes the conversion of pro-MMP into its
active conformation through an interaction with TIMP-2; both
enzymatically active MT1-MMP and MMP-2 therefore promote the
cleavage of Ln-5γ2 chain into pro-migratory γ2 and γ2× fragments,
then the deposition of these fragments into tumor extracellular
milieu may result in increased migration, invasion and VM formation
(24,47). EphA2, as an upstream molecule
regulating VM formation, not only activates FAK but also converges
to activate the PI3-K (as effector of EphA2 downstream) leading to
the activation of MMP-2, and consequent cleavage of Ln-5γ2
(48,49); and FAK signals through Erk1/2 which
regulates MMP-2 and MT1-MMP activity, thus promoting melanoma
invasion and VM (28,50). Thus, we deduced that NCTD enhanced
TIMP-2 anti-VM activity for GBC-SD cells and xenografts through
downregulating MMP-2 and MT1-MMP probably via two separate
molecular mechanisms. On one hand, reduction of MT1-MMP and MMP-2
activity inhibited the PI3-K/MMPs/Ln-5γ2, blocked the cleavage of
Ln-5γ2, resulting in decreased levels of the γ2 and γ2×
pro-migratory fragments, and impairment of VM formation. On the
other hand, downregulation of MMP-2 and MT1-MMP through inhibition
of EphA2/FAK/Paxillin did not merely converge to activate PI3-K
leading to the activation of MMP-2 and hindered cleavage of Ln-5γ2,
but also blocked Erk1/2 from regulating MMP-2 and MT1-MMP activity,
thus inhibiting tumor invasion and VM. These may be the molecular
mechanisms responsible for NCTD, as a potential anti-VM agent or
synergist, enhancing TIMP-2 anti-VM activity for human GBCs.
Collectively, overexpression of MMP-2 and MT1-MMP
was significantly related to VM in human GBCs; downregulation of
MMP-2 and MT1-MMP may be the underlying molecular mechanisms in
NCTD enhancing TIMP-2 antitumor and anti-VM activities for human
GBCs.
Acknowledgements
This study was supported by grants from the National
Natural Science Foundation of China (30672073, 81372614).
Abbreviations:
|
GBC
|
gallbladder cancer
|
|
VM
|
vasculogenic mimicry
|
|
NCTD
|
norcantharidin
|
|
MMP
|
matrix metalloproteinase
|
|
MT1-MMP
|
membrane type 1-MMP
|
|
TIMP-2
|
tissue inhibitor of matrix
metalloproteinase-2
|
|
3-D culture
|
three-dimensional culture
|
|
ECM
|
extracellular matrix
|
|
PI3-K
|
phosphoinositide 3-kinase
|
|
Ln-5
|
laminin-5
|
|
EphA2
|
ephrin type-A receptor 2
|
|
FAK
|
focal adhesion kinase
|
|
H&E
|
hematoxylin and eosin
|
|
PAS
|
periodic acid-Schiff
|
|
IHC
|
immunohistochemistry
|
|
SABC
|
streptavidin-biotin complex
method
|
|
DAB
|
3,3′-diaminobenzidine
|
|
PBS
|
phosphate buffer solution
|
|
TEM
|
transmission electron microscopy
|
|
MTT
|
tetrazolium-based colorimetric
method
|
|
FCM
|
flow cytometry
|
|
RT-PCR
|
reverse transcription-polymerase
chain reaction
|
References
|
1
|
Lazcano-Ponce EC, Miquel JF, Muñoz N, et
al: Epidemiology and molecular pathology of gallbladder cancer. CA
Cancer J Clin. 51:349–364. 2001. View Article : Google Scholar
|
|
2
|
Reddy SK and Clary BM: Surgical management
of gallbladder cancer. Surg Oncol Clin N Am. 18:307–324. 2009.
View Article : Google Scholar : PubMed/NCBI
|
|
3
|
Chakravarty KD, Yeh CN, Jan YY and Chen
MF: Factors influencing long-term survival in patients with T3
gallbladder adenocarcinoma. Digestion. 79:151–157. 2009. View Article : Google Scholar : PubMed/NCBI
|
|
4
|
Ishii H, Furuse J, Yonemoto N, et al:
Chemotherapy in the treatment of advanced gallbladder cancer.
Oncology. 66:138–142. 2004. View Article : Google Scholar : PubMed/NCBI
|
|
5
|
Mahantshetty UM, Palled SR, Engineer R, et
al: Adjuvant radiation therapy in gallbladder cancers: 10 years
experience at Tata Memorial Hospital. J Cancer Res Ther. 2:52–56.
2006. View Article : Google Scholar
|
|
6
|
Maniotis AJ, Folberg R, Hess A, et al:
Vascular channel formation by human melanoma cells in vivo and in
vitro: vasculogenic mimicry. Am J Pathol. 155:739–752. 1999.
View Article : Google Scholar : PubMed/NCBI
|
|
7
|
Warso MA, Maniotis AJ, Chen X, et al:
Prognostic significance of periodic acid-Schiff-positive patterns
in primary cutaneous melanoma. Clin Cancer Res. 7:473–477.
2001.PubMed/NCBI
|
|
8
|
Tian F, Zhang X, Tong Y, et al: PE, a new
sulfated saponin from sea cucumber, exhibits anti-angiogenic and
anti-tumor activities in vitro and in vivo. Cancer Biol Ther.
4:874–882. 2005. View Article : Google Scholar : PubMed/NCBI
|
|
9
|
Zhou YX and Huang YL: Antiangiogenic
effect of celastrol on the growth of human glioma: an in vitro and
in vivo study. Chin Med J (Engl). 122:1666–1673. 2009.
|
|
10
|
Zhang JT, Fan YZ, Chen CQ, Zhao ZM and Sun
W: Norcantharidin: A potential antiangiogenic agent for gallbladder
cancers in vitro and in vivo. Int J Oncol. 40:1501–1514. 2012.
|
|
11
|
Zhang S, Li M, Gu Y, et al: Thalidomide
influences growth and vasculogenic mimicry channel formation in
melanoma. J Exp Clin Cancer Res. 27:602008. View Article : Google Scholar : PubMed/NCBI
|
|
12
|
Cong R, Sun Q, Yang L, et al: Effect of
Genistein on vasculogenic mimicry formation by human uveal melanoma
cells. J Exp Clin Cancer Res. 28:1242009. View Article : Google Scholar : PubMed/NCBI
|
|
13
|
Fu D, He X, Yang S, et al: Zoledronic acid
inhibits vasculogenic mimicry in murine osteosarcoma cell line in
vitro. BMC Musculoskelet Disord. 12:1462011. View Article : Google Scholar : PubMed/NCBI
|
|
14
|
Chen LX, He YJ, Zhao SZ, et al: Inhibition
of tumor growth and vasculogenic mimicry by curcumin through
downregulation of the EphA2/PI3K/MMP pathway in a murine choroidal
melanoma model. Cancer Biol Ther. 11:229–235. 2011. View Article : Google Scholar
|
|
15
|
Chen HX and Cleck JN: Adverse effects of
anticancer agents that target the VEGF pathway. Nat Rev Clin Oncol.
6:465–477. 2009. View Article : Google Scholar : PubMed/NCBI
|
|
16
|
Higa GM and Abraham J: Biological
mechanisms of bevacizumab-associated adverse events. Expert Rev
Anticancer Ther. 9:999–1007. 2009. View Article : Google Scholar : PubMed/NCBI
|
|
17
|
van der Schaft DW, Seftor RE, Seftor EA,
et al: Effects of angiogenesis inhibitors on vascular network
formation by human endothelial and melanoma cells. J Natl Cancer
Inst. 96:1473–1477. 2004. View Article : Google Scholar : PubMed/NCBI
|
|
18
|
McCawley LJ and Matrisian LM: Matrix
metalloproteinases: multifunctional contributors to tumor
progression. Mol Med Today. 6:149–156. 2000. View Article : Google Scholar : PubMed/NCBI
|
|
19
|
Stetler-Stevenson WG: Matrix
metalloproteinases in angiogenesis: a moving target for therapeutic
intervention. J Clin Invest. 103:1237–1241. 1999. View Article : Google Scholar : PubMed/NCBI
|
|
20
|
Sood AK, Fletcher MS, Coffin JE, et al:
Functional role of matrix metalloproteinases in ovarian tumor cell
plasticity. Am J Obstet Gynecol. 190:899–909. 2004. View Article : Google Scholar : PubMed/NCBI
|
|
21
|
Hess AR, Seftor EA, Seftor RE and Hendrix
MJ: Phosphoinositide 3-kinase regulates membrane type 1-matrix
metalloproteinase (MMP) and MMP-2 activity during melanoma cell
vasculogenic mimicry. Cancer Res. 63:4757–4762. 2003.PubMed/NCBI
|
|
22
|
Hendrix MJ, Seftor EA, Kirschmann DA,
Quaranta V and Seftor RE: Remodeling of the microenvironment by
aggressive melanoma tumor cells. Ann N Y Acad Sci. 995:151–161.
2003. View Article : Google Scholar : PubMed/NCBI
|
|
23
|
Albini A, Melchiori A, Santi L, et al:
Tumor cell invasion inhibited by TIMP-2. J Natl Cancer Inst.
83:775–779. 1991. View Article : Google Scholar : PubMed/NCBI
|
|
24
|
Seftor RE, Seftor EA, Koshikawa N, et al:
Cooperative interactions of laminin 5 gamma2 chain, matrix
metalloproteinase-2, and membrane type-1-matrix/ metalloproteinase
are required for mimicry of embryonic vasculogenesis by aggressive
melanoma. Cancer Res. 61:6322–6327. 2001.PubMed/NCBI
|
|
25
|
Fan YZ, Sun W, Zhang WZ and Ge CY:
Vasculogenic mimicry in human primary gallbladder carcinoma and
clinical significance thereof. Zhonghua Yi Xue Za Zhi. 87:145–149.
2007.(In Chinese). PubMed/NCBI
|
|
26
|
Sun W, Shen ZY, Zhang H, Fan YZ, Zhang WZ,
Zhang JT, Lu XS and Ye C: Overexpression of HIF- 1α in primary
gallbladder carcinoma and its relation to vasculogenic mimicry and
unfavourable prognosis. Oncol Rep. 27:1990–2002. 2012.PubMed/NCBI
|
|
27
|
Sun W, Fan YZ, Zhang WZ and Ge CY: A pilot
histomorphology and hemodynamic of vasculogenic mimicry in
gallbladder carcinomas in vivo and in vitro. J Exp Clin Cancer Res.
30:462011. View Article : Google Scholar : PubMed/NCBI
|
|
28
|
Lu XS, Sun W, Ge CY, Zhang WZ and Fan YZ:
Contribution of the PI3-K/MMPs/Ln-5γ2 and EphA2/FAK/Paxillin
signaling pathways to tumor growth and vasculogenic mimicry of
gallbladder carcinomas. Int J Oncol. 42:2103–2115. 2013.PubMed/NCBI
|
|
29
|
Wang GS: Medical uses of mylabris in
ancient China and recent studies. J Ethnopharmacol. 26:147–162.
1989. View Article : Google Scholar : PubMed/NCBI
|
|
30
|
Liu J, Gao J and Liu X: Advances in the
study of Cantharidin and its derivatives. Zhong Yao Cai.
26:453–455. 2003.PubMed/NCBI
|
|
31
|
Ho YP, To KK, Au-Yeung SC, et al:
Potential new antitumor agents from an innovative combination of
demethylcantharidin, a modified traditional Chinese medicine, with
a platinum moiety. J Med Chem. 44:2065–2068. 2001. View Article : Google Scholar : PubMed/NCBI
|
|
32
|
Yang EB, Tang WY, Zhang K, Cheng LY and
Mack PO: Norcantharidin inhibits growth of human HepG2
cell-transplanted tumor in nude mice and prolongs host survival.
Cancer Lett. 117:93–98. 1997. View Article : Google Scholar : PubMed/NCBI
|
|
33
|
Yi SN, Wass J, Vincent P and Iland H:
Inhibitory effect of norcantharidin on K562 human myeloid leukemia
cells in vitro. Leuk Res. 15:883–886. 1991. View Article : Google Scholar : PubMed/NCBI
|
|
34
|
An WW, Wang MW, Tashiro S, Onodera S and
Ikejima T: Norcantharidin induces human melanoma A375-S2 cell
apoptosis through mitochondrial and caspase pathways. J Korean Med
Sci. 19:560–566. 2004. View Article : Google Scholar : PubMed/NCBI
|
|
35
|
Fan YZ, Fu JY, Zhao ZM and Chen CQ:
Inhibitory effect of norcantharidin on the growth of human
gallbladder carcinoma GBC-SD cells in vitro. Hepatobiliary Pancreat
Dis Int. 6:72–80. 2007.PubMed/NCBI
|
|
36
|
Fan YZ, Zhao ZM, Fu JY, Chen CQ and Sun W:
Norcantharidin inhibits growth of human gallbladder carcinoma
xenografted tumors in nude mice by inducing apoptosis and blocking
the cell cycle in vivo. Hepatobiliary Pancreat Dis Int. 9:414–422.
2010.PubMed/NCBI
|
|
37
|
Zhang JT, Sun W, Zhang WZ, Ge CY, Liu ZY,
Zhao ZM, Lu XS and Fan YZ: Norcantharidin inhibits tumor growth and
vasculogenic mimicry of human gallbladder carcinomas by suppression
of the PI3-K/MMPs/Ln-5γ2 signaling pathway. BMC Cancer. 14:1932014.
View Article : Google Scholar
|
|
38
|
Wang H, Sun W, Zhang WZ, Ge CY, Zhang JT,
Liu ZY and Fan YZ: Inhibition of tumor vasculogenic mimicry and
prolongation of host survival in highly aggressive gallbladder
cancers by norcantharidin via blocking the ephrin type a receptor
2/focal adhesion kinase/Paxillin signaling pathway. PLoS One.
9:e969822014. View Article : Google Scholar : PubMed/NCBI
|
|
39
|
McNamara MG, Metran-Nascente C and Knox
JJ: State-of-the-art in the management of locally advanced and
metastatic gallbladder cancer. Curr Opin Oncol. 25:425–431. 2013.
View Article : Google Scholar : PubMed/NCBI
|
|
40
|
Li M, Gu Y, Zhang Z, et al: Vasculogenic
mimicry: a new prognostic sign of gastric adenocarcinoma. Pathol
Oncol Res. 16:259–266. 2010. View Article : Google Scholar
|
|
41
|
Wang CJ, Zhou ZG, Holmqvist A, et al:
Survivin expression quantified by Image Pro-Plus compared with
visual assessment. Appl Immuohistochem Mol Morphol. 17:530–535.
2009. View Article : Google Scholar
|
|
42
|
Xavier LL, Viola GG, Ferraz AC, et al: A
simple and fast densitometric method for the analysis of tyrosine
hydroxylase immunoreactivity in the substantia nigra pars compacta
and in the ventral tegmental area. Brain Res Protoc. 16:58–64.
2005. View Article : Google Scholar
|
|
43
|
Situ DR, Hu Y, Zhu ZH, et al: Prognostic
relevance of β-catenin expression in T2-3N0M0 esophageal squamous
cell carcinoma. World J Gastroenterol. 16:5195–5202. 2010.
View Article : Google Scholar : PubMed/NCBI
|
|
44
|
Zlobec I, Steele R, Terracciano L, Jass JR
and Lugli A: Selecting immunohistochemical cut-off scores for novel
biomarkers of progression and survival in colorectal cancer. J Clin
Pathol. 60:1112–1116. 2007. View Article : Google Scholar
|
|
45
|
Kilkenny C, Browne WJ, Cuthill IC, Emerson
M and Altman DG: Improving bioscience research reporting: the
ARRIVE guidelines for reporting animal research. PLoS Biol.
8:e10004122010. View Article : Google Scholar : PubMed/NCBI
|
|
46
|
Fan YZ and Sun W: Molecular regulation of
vasculogenic mimicry in tumors and potential tumor-target therapy.
World J Gastrointest Surg. 2:117–127. 2010. View Article : Google Scholar : PubMed/NCBI
|
|
47
|
Seftor RE, Seftor EA, Kirschmann DA and
Hendrix MJ: Targeting the tumor microenvironment with chemically
modified tetracyclines: inhibition of laminin 5 gamma2 chain
promigratory fragments and vasculogenic mimicry. Mol Cancer Ther.
1:1173–1179. 2002.PubMed/NCBI
|
|
48
|
Hess AR, Seftor EA, Gardner LM, et al:
Molecular regulation of tumor cell vasculogenic mimicry by tyrosine
phosphorylation: role of epithelial cell kinase (Eck/EphA2). Cancer
Res. 61:3250–3255. 2001.PubMed/NCBI
|
|
49
|
Margaryan NV, Strizzi L, Abbott DE, et al:
EphA2 as a promoter of melanoma tumorigenicity. Cancer Biol Ther.
8:279–288. 2009. View Article : Google Scholar : PubMed/NCBI
|
|
50
|
Hess AR and Hendrix MJ: Focal adhesion
kinase signaling and the aggressive melanoma phenotype. Cell Cycle.
5:478–480. 2006. View Article : Google Scholar : PubMed/NCBI
|