Introduction
Histone translational modification via heritably
regulating the gene expression is involved in most cellular
biological processes. Studies have suggested that imbalance of
global histone modification in cells may play a key role in
initiating events in some forms of cancer. Therefore, efforts have
been made to understand the role of global changes of epigenetic
modifications in the initiation and propagation of various cancers
(1,2). Histone acetylation as the
well-characterized epigenetic modifications is dynamically
controlled by histone acetyltransferases (HATs) and histone
deacetylases (HDACs) (3,4). For instance, global loss of histone
H4K16 acetylation (H4K16ac) and histone H4K20 tri-metylation as a
hallmark of several human cancers have been reported (5).
Recently, increasing evidence has suggested that the
alteration of global histone H4K16ac may be closely associated with
the occurrence of tumors. Even though the global histone H4K16ac
may regulated by several enzymes including HATs and HDACs (6–8),
experimental studies have clarified that the changes of global
H4K16ac is tightly correlated with the expression of hMOF, a
member of the MYST family of HATs, in human cells (9–11).
Depletion of hMOF in cells not only leads to global
reduction of histone H4K16ac, but also results in genomic
instability, reduced transcription of certain genes, defective DNA
damage repair and early embryonic lethality (12–14),
suggesting the importance of acetylation of H4K16 in cells.
On the contrary, abnormal gene expression of the
hMOF and its corresponding modification of H4K16 have been found in
certain primary cancer tissues. The expression patterns of
hMOF in different primary cancers varied. Except for
non-small cell lung carcinoma tissues (15,16),
frequent downregulation of hMOF expression was found in
breast cancer, medulloblastoma, renal cell carcinoma (RCC),
ovariant carcinoma and colorectal cancer tissues (17–20),
hMOF protein expression is tightly correlated with acetylation of
histone H4K16, and the above observations strongly suggest that
histone acetyltransferase hMOF and its corresponding histone
H4K16ac might be involved in certain tumorigenic pathways.
Gastric cancer is the fourth most frequently
occurring cancer worldwide and the second most common cause of
cancer deaths in the world (21).
Although the mechanisms by which imbalance of histone modifications
contribute to tumorigenesis and metastasis have been intensively
investigated in several types of cancer, studies of the alterations
of histone modifications in gastric cancer are rare (22). Previously, we detected
low-hMOF expression in a limited number of gastric cancer
tissues (16 cases) (20). Here the
156 tissue samples including primary diagnosed gastric cancer and
matched adjacent or normal tissues from the same patients were
analyzed by qRT-PCR and western blotting to further confirm our
previous observation and to investigate the correlation of low
expression of hMOF compared with clinicopathological
features of gastric cancer. It is noteworthy that except for the
hMOF, several enzymes shch as SIRT1 and HDAC2 deacetyltransferases
are also involved in H4K16 acetylation process (6–8).
Therefore, to clarify which particular enzyme is responsible for
global reduction of histone H4K16ac in gastric cancer, we also
evaluated the HDACs expression in gastric cancer tissues and
gastric cancer cell lines. Using overexpression and siRNA knockdown
approaches, the relationship between hMOF and HDACs was analyzed in
MGC-803 gastric cancer cells.
Materials and methods
Tissue collection
One hundred and fifty-six tissue samples including
52 primary diagnosed gastric cancer, paired 52 adjacent and paired
52 normal tissues from the same patients were collected. All
patients underwent radical surgery between September 2008 and July
2013 at The First Bethune Hospital of Jilin University (Jilin,
China) and did not receive any adjuvant therapy before the surgical
operation. Gastric cancer and corresponding adjacent (<2 cm away
from the tumor area) and normal tissues (>5 cm away from the
tumor area) were collected from patients. The median age of the
patients was 64 years (range, 44–84 years). Written informed
consent was obtained from all participants, and the study was
approved by the Institutional Ethics Board of School of Medicine,
Jilin University. Patient medical records including patient age and
gender, tumor staging, pathological diagnosis, and surgical records
were reviewed. Tumors were staged according to the 2010 TNM
classification system using the American Joint Committee on Cancer
(AJCC) stage grouping (23).
Antibodies
Anti-H4K16ac (H9164) and anti-M2 Flag antibodies was
obtained from Sigma (USA). Anti-hMOF rabbit polyclonal antibody was
from Bethyl Laboratories (A300-992A, USA). Anti-H4K5 (07-327),
anti-H4K8 (07-328) and anti-H4K12 (07-595) antibodies were
purchased from Merck Millipore (Darmstadt, Germany). Anti-HDAC1
(10197-1-AP), anti-HDAC2 (12922-3-AP), anti-HDAC4 (17449-1-AP),
anti-HDAC6 (12834-1-AP) and SIRT1 (13161-1-AP) polyclonal
antibodies were from Proteintech Group (China, Wuhan). Anti-GAPDH
rabbit polyclonal antibodies were raised against bacterially
expressed proteins (Jilin University).
Reverse transcription and quantitative
real-time PCR (qRTPCR)
Total RNA from tissues (include tumor, adjacent or
normal tissues) or cultured cells (include GES-1, SGC-7901 and
MGC-803 cell lines) was isolated using TRIzol® LS
Reagent (Invitrogen, Carlsbad, CA, USA). Total RNA (1 μg) from each
sample was used as a template to produce cDNA with PrimeScript
First-strand cDNA Synthesis kit (Takara). hMOF, HDACs and Actin
mRNA levels were analyzed by quantitative real-time PCR (qPCR) with
an Eco Real-Time PCR System (Illumina, San Diego, CA, USA). All PCR
reactions were finished as follows: initial denaturation step at
95°C for 30 sec, followed by 40 cycles of denaturation at 95°C for
5 sec, annealing at 60°C for 30 sec and extension at 72°C for 30
sec. Primer sets used for PCR were as follows: β-actin,
5′-ATGGGTCAGAAGGATTCCTATGT-3′ (forward) and
5′-AGCCACACGCAGCTCATT-3′ (reverse) produce a 153 bp product; hMOF,
5′-GGCTGGACGAGTGGGTAGACAA-3′ (forward) and
5′-TGGTGATCGCCTCATGCTCCTT-3′ (reverse), yielding a 227 bp product;
HDAC1, 5′-CCGCA TGACTCATAATTTGCTG-3′ (forward) and 5′-ATTGGCT
TTGTGAGGGCGATA-3′ (reverse), yielding a 76 bp product; HDAC2,
5′-GAGCTGTGAAGTTAAACCGACA-3′ (forward) and
5′-ACCGTCATTACACGATCTGTTG-3′ (reverse), yielding a 229 bp products;
HDAC4, 5′-GGCCCACCG GAATCTGAAC-3′ (forword) and 5′-GAACTCTGGTCA
AGGGAACTG-3′ (reverse), yielding a 87 bp product; HDAC5,
5′-TGAACCCAACTTGAAAGTGCG-3′ (forward), 5′-CGCTGTTACACACGGACGA-3′
(forward), yielding a 164 bp product; HDAC6, 5′-GAGGGAGAACTCCGTGT
CCTA-3′ (forward) and 5′-AATAGCCATCCATAAGACTG TGC-3′ (reverse),
yielding a 196 bp product; HDAC9, 5′-GAA TCCTCAGTCAGTAGCAGTTC-3′
(forward), 5′-GGGGC AAAACCGAAGTCTCAT-3′ (reverse), yielding a 100
bp product; HDAC10, 5′-CAGTTCGACGCCATCTACTTC-3′ (forward),
5′-CAAGCCCATTTTGCACAGCTC-3′ (reverse), yielding a 115 bp product;
HDAC11, 5′-ACCCAGACAGGAGG AACCATA-3′ (forward),
5′-TGATGTCCGCATAGGCAC AG-3′ (reverse), yielding a 130 bp
product.
Cell culture and transient
transfection
Human gastric cancer cell lines SGC-7901 and
MGC-803, were obtained from Department of Gastrointestinal Surgery,
the First Bethune Hospital of Jilin University. Human gastric
mucosal cell line GES-1 was provided by the Cancer Hospital of
Beijing University. Cells were cultured in Dulbecco’s modified
Eagle’s medium (DMEM, Sigma-Aldrich, St. Louis, MO, USA) with 5%
glucose and 10% fetal bovine serum (FBS), 100 U/ml penicillin, and
100 mg/ml streptomycin in 10-cm dishes at 37°C in a humidified
atmosphere of 5% CO2. For transient transfection, cells
were cultured in 6-well tissue culture plates (~2×10⁵
cells/well) in DMEM medium containing 10% fetal bovine serum. Then
cells were transfected with 0.3 and 0.6 μg of hMOF cDNAs using
polyethylenimine (PEI). After 48 h of transfection, cells were
harvested and lysed for western blotting.
RNAi treatment
Gastric cancer MGC-803 cells were cultured in 6-well
tissue culture plates (~2×10⁵ cells/well) in DMEM medium
(Sigma) containing 10% fetal bovine serum. The cells were
transiently transfected with 10~20 pmol HDAC4 siRNAs (Lot no. 2837)
SMART pool (Shanghai GenePharma, China) using Lipofetamine RNAiMAX
transfection kit (Invitrogen, Cat#: 864425) following the
manufacturer’s instructions. Forty-eight hours after siRNA
transfection, cells were harvested and lysed. Whole-cell extracts
were prepared by adding 4× SDS sample buffer, and total RNA was
isolated using TRIzol LS Reagent (Invitrogen).
Western blotting
The homogenate from cancer, adjacent or normal
tissue samples were prepared as previously described (19). Briefly, the tissue homogenate was
swirled and kept on ice for 30 min. Whole cell extract was then
prepared by sonication (Scientz-IID, China) for 10 sec with 50%
duty cycle and centrifugation at 12,000 rpm for 15 min. The total
protein concentration of the resulting supernatant was measured
using the Bio-Rad Protein Assay kit (500-0201). Relative equal
total amounts of proteins from tissue whole-cell lysate were
separated by 12% SDS-PAGE. hMOF and GAPDH proteins were detected by
immunoblotting using hMOF and GAPDH polyclonal antibodies.
Whole-cell lysate from cultured cells was mixed with 4× SDS loading
buffer (0.25 M Tris-HCl pH 6.8, 8% SDS, 30% glycerol, 0.02%
Bromophenol Blue containing 10% BME), and boiled for 5 min at 95°C.
Denatured proteins were then separated by 12 or 18% SDS-PAGE, and
specific proteins were detected by western blotting using indicated
antibodies.
Immunofluorescence staining
Human gastric mucosal cell line GES-1, SGC-7901 and
MGC-803 gastric cancer cells were cultured and grown to ~60%
confluence in 24-well plates containing a cover-slip (8D1007, Nest)
on each well. Cells were washed by PBS buffer, and then fixed with
4% paraformaldehyde (PFA) for 15 min at room temperature,
permeabilized with 0.5% TritonX-100 in PBS buffer for 5 min,
followed by blocking with 1% bovine serum albumin in PBS for 1 h at
37°C. Sequentially, cells were washed for 5 min in PBST three
times, and incubated with hMOF (1:500), HDAC4 (1:200) and histone
H4K16 (1:100) acetylated primary antibodies at room temperature
then stained with FITC-conjugated secondary antibodies (1:300,
Santa Cruz sc-2012). Cell nuclei were stained by Vectashield with
DAPI (Vecter Laboraries, Inc., cat#: H-1200). Fluorescence images
were observed with Olympus BX40F Microscope (Olympus Corp.).
Statistical analysis
Statistical analysis was achieved using GraphPad
Prism 5 (TurnTech, Beijing, China). qRT-PCR values are presented as
the mean ± SEM. Statistically significant differences in gene
expression between tumor and normal/or adjacent tissues were
determined by Mann-Whitney U test. The log-rank test was used to
analyze the survival results. Values of P<0.05 were considered
to be statistically significant.
Results
Obvious reduction of hMOF gene expression
is observed in gastric cancer tissues
In our previous screening experiments (16 cases), we
found the gene expression of hMOF was not only significantly
reduced (94%, 15/16) in gastric cancer, the decreasing tendency was
also observed in adjacent tissues (20). To further investigate the
involvement of hMOF expression in the pathogenesis of
primary gastric cancer, we collected 156 tissue samples including
52 primary diagnosed gastric cancer, and 52 matched adjacent and
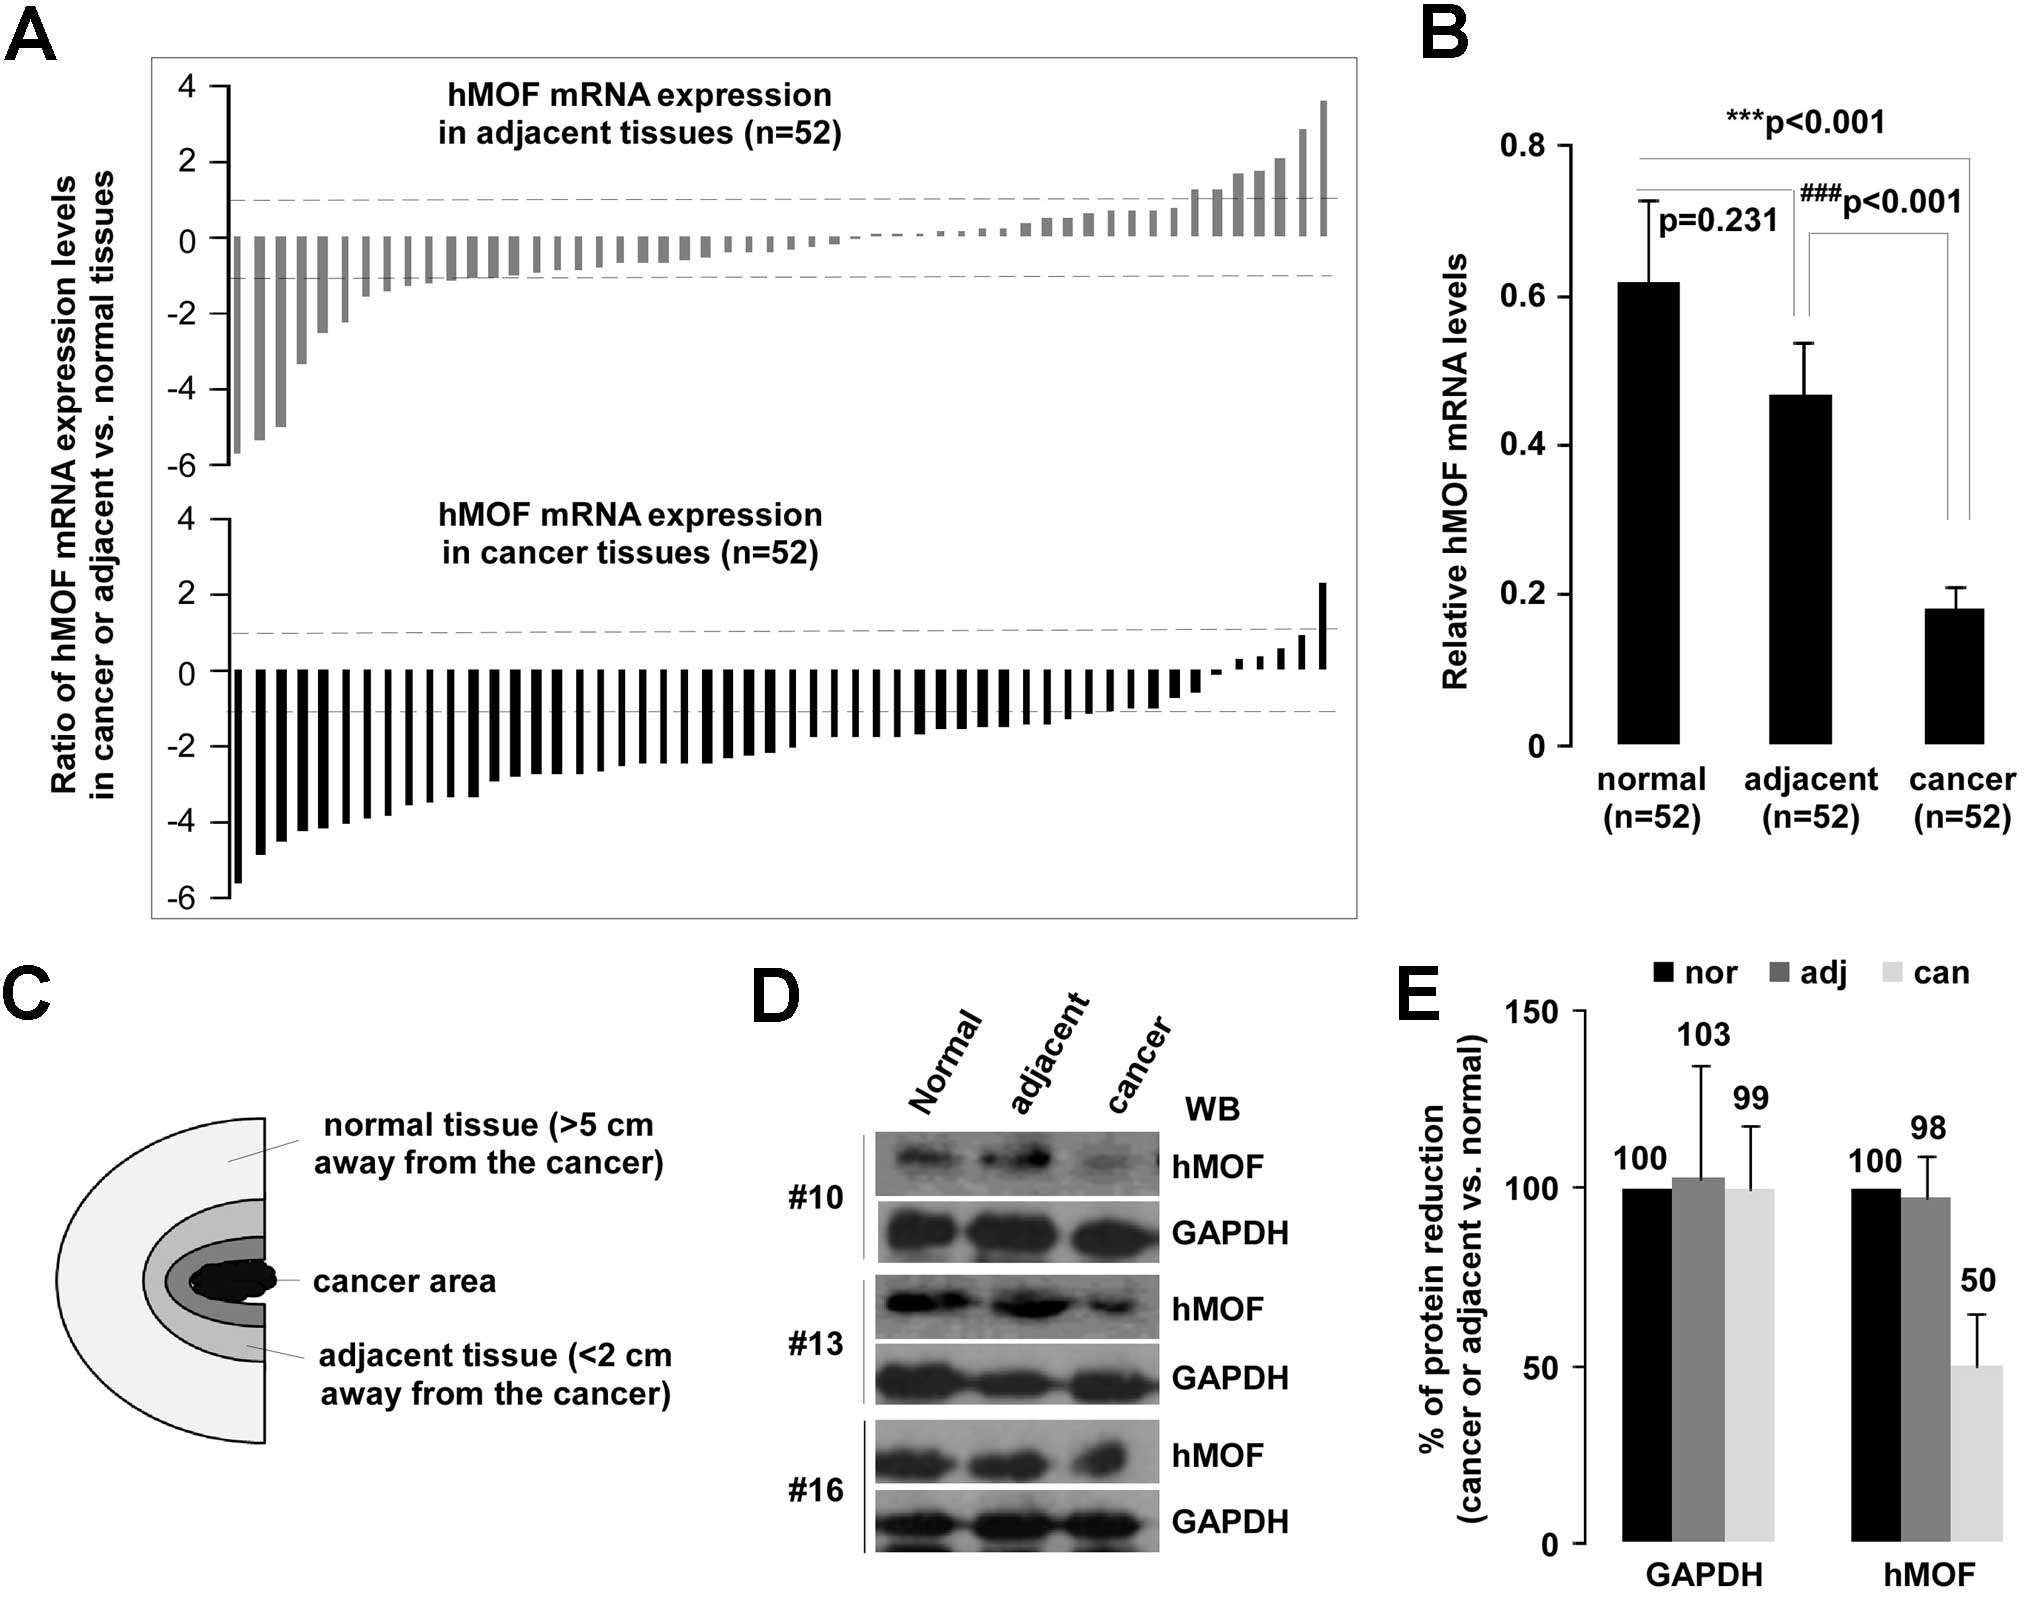
normal tissues from the same patients (Fig. 1C). The hMOF expression
levels were measured using qRT-PCR. Analysis of the qPCR data
revealed a significant (>2-fold decreased) downregulation of
hMOF mRNA in 81% (42/52) of patients, whereas only 2% (1/52) of
patients showed significant (>2-fold increased) upregulation of
hMOF. Of note, hMOF expression in adjacent tissues
had also a reduction (>2-fold decreased) in 25% (13/52) of
patients (Fig. 1A). These results
are consistent with our previous findings. As shown in Fig. 1B, compared to matched normal or
adjacent tissues, the gene expression of hMOF was significantly
decreased in gastric cancer tissues (p<0.001 and p<0.001,
respectively). To determine whether the reduction of hMOF mRNA
expression resulted in decreased hMOF protein levels, aliquots of
whole cell extract from three selected gastric cancer and
corresponding adjacent or normal tissues were analyzed by western
blotting (Fig. 1D). As expected,
the hMOF protein levels in cancer tissue decreased to 50% of those
in normal tissues. However, there was no difference between gastric
cancer and adjacent tissues (Fig.
1E).
hMOF gene expression and
clinicopathological features of gastric cancer
Gastric tumors were staged according to the 2010 TNM
classification system using American Joint Committee on Cancer
(AJCC) stage grouping (23). To
expand upon the observations given above and to determine the
relationship between hMOF expression and clinicopathological
parameters, qPCR results were examined according to the clinical
characteristics of gastric cancer. A summary of patient clinical
characteristics, including age, gender, cell differentiation, and
survival, is shown in Table I.
Less hMOF expression was observed in cancer tissues than in
both normal and adjacent tissues in both the >65 and ≤65 age
groups, and in both the male and female groups. However, there was
no significant difference by age, gender, cell differentiation, or
survival time.
 | Table IRelationship between hMOF gene
expression (qPCR) and clinicopathological characteristics of
gastric cancer. |
Table I
Relationship between hMOF gene
expression (qPCR) and clinicopathological characteristics of
gastric cancer.
| Factor | Case (n) | Normal mean ±
SEM | Adjacent mean ±
SEM | Cancer mean ±
SEM | p-value nor vs.
adj | p-value nor vs.
can | p-value adj vs.
can |
|---|
| All | 52 | 0.62±0.11 | 0.47±0.071 | 0.18±0.034 | 0.389 | <0.0001c | 0.0003f |
| Age (years) |
| ≤65 | 26 | 0.64±0.16 | 0.49±0.11 | 0.13±0.023 | 0.401 | 0.00222b | 0.0038e |
| >65 | 26 | 0.61±0.13 | 0.46±0.088 | 0.22±0.059 | 0.365 | 0.0107a | 0.0307d |
| Gender |
| Male | 36 | 0.72±0.13 | 0.51±0.092 | 0.21±0.046 | 0.171 | 4.62E-04c | 0.0073e |
| Female | 16 | 0.41±0.14 | 0.42±0.11 | 0.11±0.033 | 0.944 | 0.0359a | 0.0072e |
|
Differentiation |
| Well | 2 | 1.39±0.36 | 0.98±0.21 | 0.38±0.18 | 0.299 | 0.0701 | 0.0952 |
| Moderate | 22 | 0.54±0.18 | 0.38±0.12 | 0.08±0.019 | 0.452 | 0.0128a | 0.0196d |
| Poorly | 28 | 0.63±0.12 | 0.51±0.089 | 0.24±0.057 | 0.429 | 0.0047b | 0.0113d |
| Survival of
patients |
| >12 months | 22 | 0.41±0.15 | 0.36±0.097 | 0.15±0.042 | 0.781 | 0.0452a | 0.0816 |
| ≤12 months | 30 | 0.79±0.11 | 0.56±0.11 | 0.21±0.056 | 0.209 | 3.69E-04c | 0.0011e |
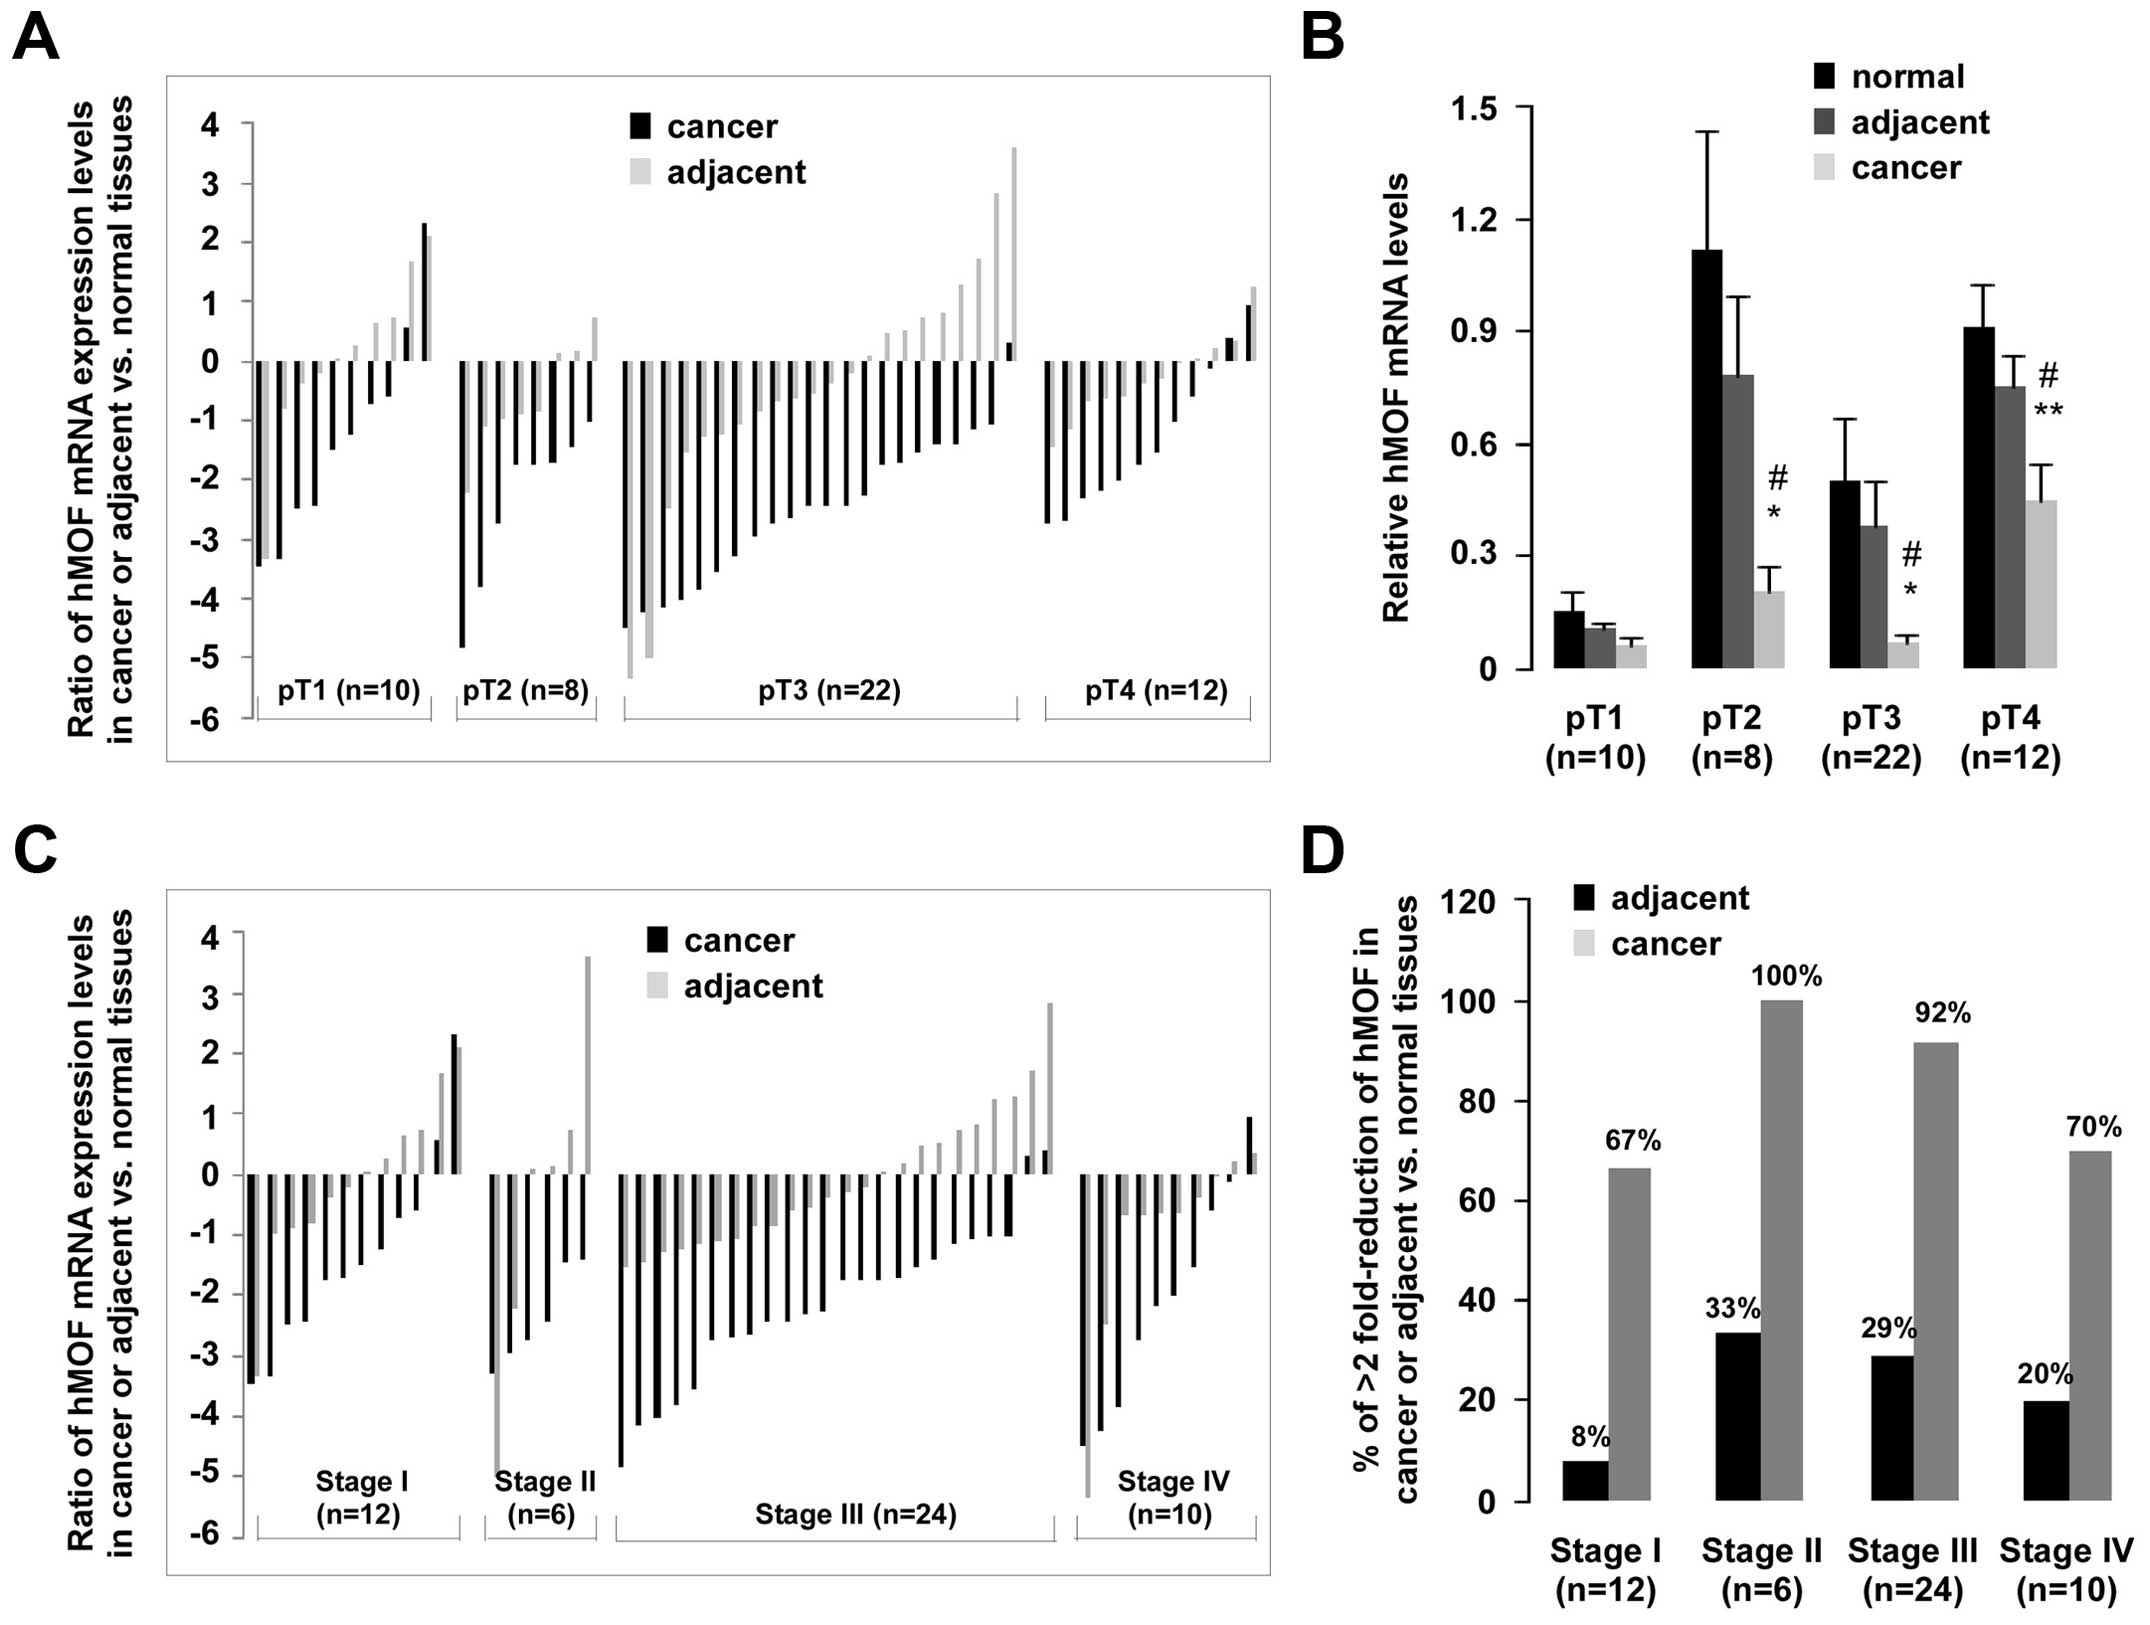
More detailed statistical analyses were performed in
order to further explore the correlation between hMOF expression
and clinical features. Analysis of the pathologic stage showed
significantly low levels of hMOF expression in pT2- to pT4-stage
gastric cancer than in normal (p<0.05 or p<0.01) or adjacent
(p<0.05) tissues (Fig. 2B). A
>2-fold reduction of hMOF mRNA was found in 88% (7/8) of pT2,
95% (21/22) of pT3, 67% (8/12) of pT4 (Fig. 2A). In addition, there was markedly
less (>2-fold) hMOF mRNA in cancer tissues than in normal
tissues in 67% (8/12) of clinical stage I, in 100% (6/6) of stage
II, in 92% (22/24) of stage III and 70% (7/10) of stage IV.
Notably, lower expression of hMOF (>2-fold) than in adjacent
tissues were also observed in 8% (1/12) of stage I, in 33% (2/6) of
stage II, in 29% (7/24) of stage III and 20% (2/10) of stage IV,
respectively (Fig. 2C and D).
Statistical analysis for clinical staging (data not shown),
revealed significantly less hMOF mRNA in normal tissues, observed
only in stage II (n=6, p<0.05) and stage III gastric cancers
(n=24, p<0.05).
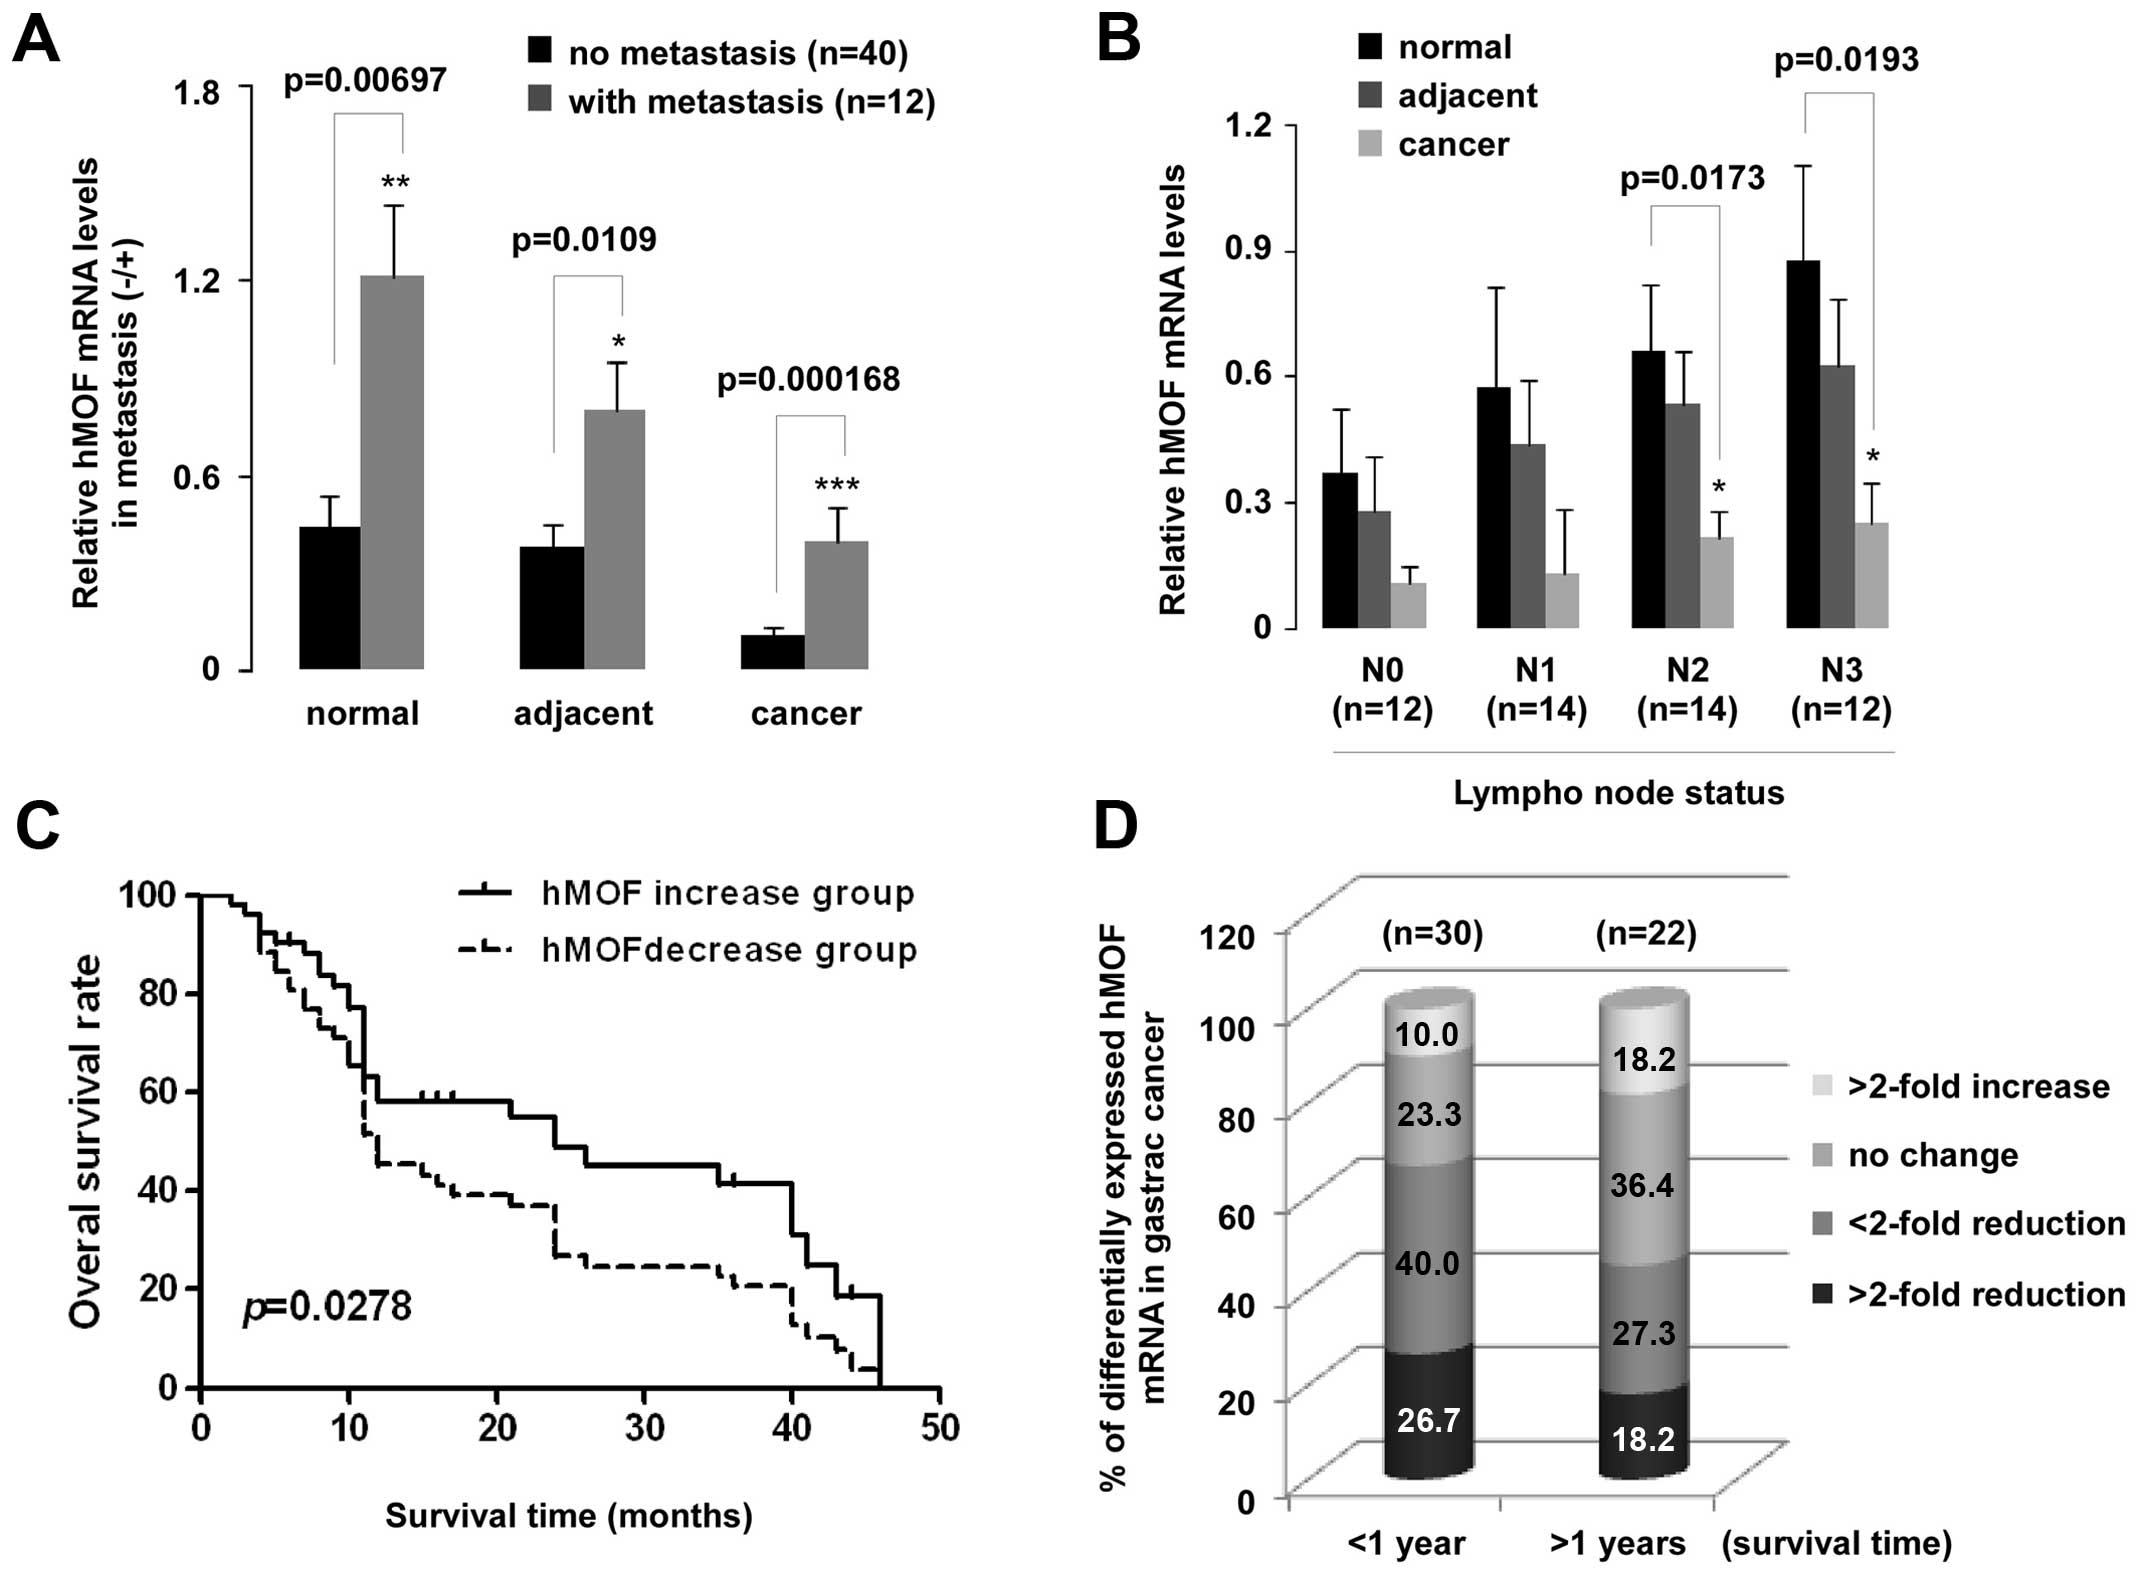
qPCR data were also analyzed based on adjacent lymph
node metastasis (N0–N3) and distant metastasis. To our surprise,
the hMOF expression in patients with distant metastasis was
higher than those in patients without distant metastasis.
Statistically significant difference between with or without
metastasis groups appeared in all tissues including normal,
adjacent and cancer (p<0.01, p<0.05 and p<0.001,
respectively) (Fig. 3A). A
significant downregulation of hMOF mRNA in N2 (p<0.05) and N3
(p<0.05) of lymph node metastasis groups was observed (Fig. 3B). Furthermore, overall survival
rates are shown in Fig. 3C. A
significant difference was found between the two hMOF
expression groups (p<0.05). Low levels (>2-fold) of hMOF mRNA
expression were observed in patients who survived for both less
(27%, 8/30) and more (18%, 4/22) than one year. Of all patients
evaluated here, 58% survived less than one year (Fig. 3D).
HDAC4 expression patterns in gastric
cancer
HDAC4 has been identified in specific cell line and
tissues. Recently studies were published, which showed high-level
of HDAC4 in SGC-7901 gastric cancer cells and frequent high
expression of HDAC4 in gastric cancer tissues (24). To explore the relationship between
HDAC4 expression and clinicopathological parameters, we collected
96 tissue samples including corresponding cancer tissue, adjacent
tissue and normal tissue from the same patients, and measured gene
expression of HDAC4 using qRT-PCR. A summary of patient clinical
characteristics is shown in Table
II. The number of cases may be limiting as we did not detect an
obvious increase of HDAC4 in gastric cancer tissues (p>0.05), on
the contrary, there was a decreasing tendency.
| Table IIRelationship between HDAC4 gene
expression (qPCR) and clinicopathological characteristics of
gastric cancer. |
Table II
Relationship between HDAC4 gene
expression (qPCR) and clinicopathological characteristics of
gastric cancer.
| Factor | Case (n) | Normal mean ±
SEM | Adjacent mean ±
SEM | Cancer mean ±
SEM | p-value nor vs.
adj | p-value nor vs.
can | p-value adj vs.
can |
|---|
| All | 32 | 0.525±0.13 | 0.255±0.048 | 0.133±0.023 | 0.239 | 0.0842 | 0.0552 |
| Age (years) |
| ≤65 | 19 | 0.479±0.16 | 0.255±0.073 | 0.126±0.031 | 0.195 | 0.0989 | 0.112 |
| >65 | 13 | 0.196±0.048 | 0.254±0.057 | 0.145±0.037 | 0.992 | 0.403 | 0.122 |
| Gender |
| Male | 25 | 0.431±0.024 | 0.192±0.028 | 0.129±0.025 | 0.345 | 0.211 | 0.0931 |
| Female | 7 | 0.864±0.058 | 0.481±0.018 | 0.157±0.065 | 0.536 | 0.245 | 0.118 |
|
Differentiation |
| Well | 2 | 0.243±0.033 | 0.244±0.023 | 0.228±0.018 | 0.996 | 0.957 | 0.931 |
| Moderate | 11 | 0.486±0.038 | 0.195±0.061 | 0.112±0.035 | 0.457 | 0.337 | 0.252 |
| Poorly | 19 | 0.578±0.031 | 0.291±0.072 | 0.135±0.039 | 0.373 | 0.165 | 0.0606 |
| Survival of
patients |
| >12 months | 20 | 0.291±0.056 | 0.328±0.069 | 0.164±0.034 | 0.675 | 0.0593 | 0.167 |
| ≤12 months | 12 | 0.916±0.058 | 0.133±0.043 | 0.0826±0.026 | 0.195 | 0.0381a | 0.316 |
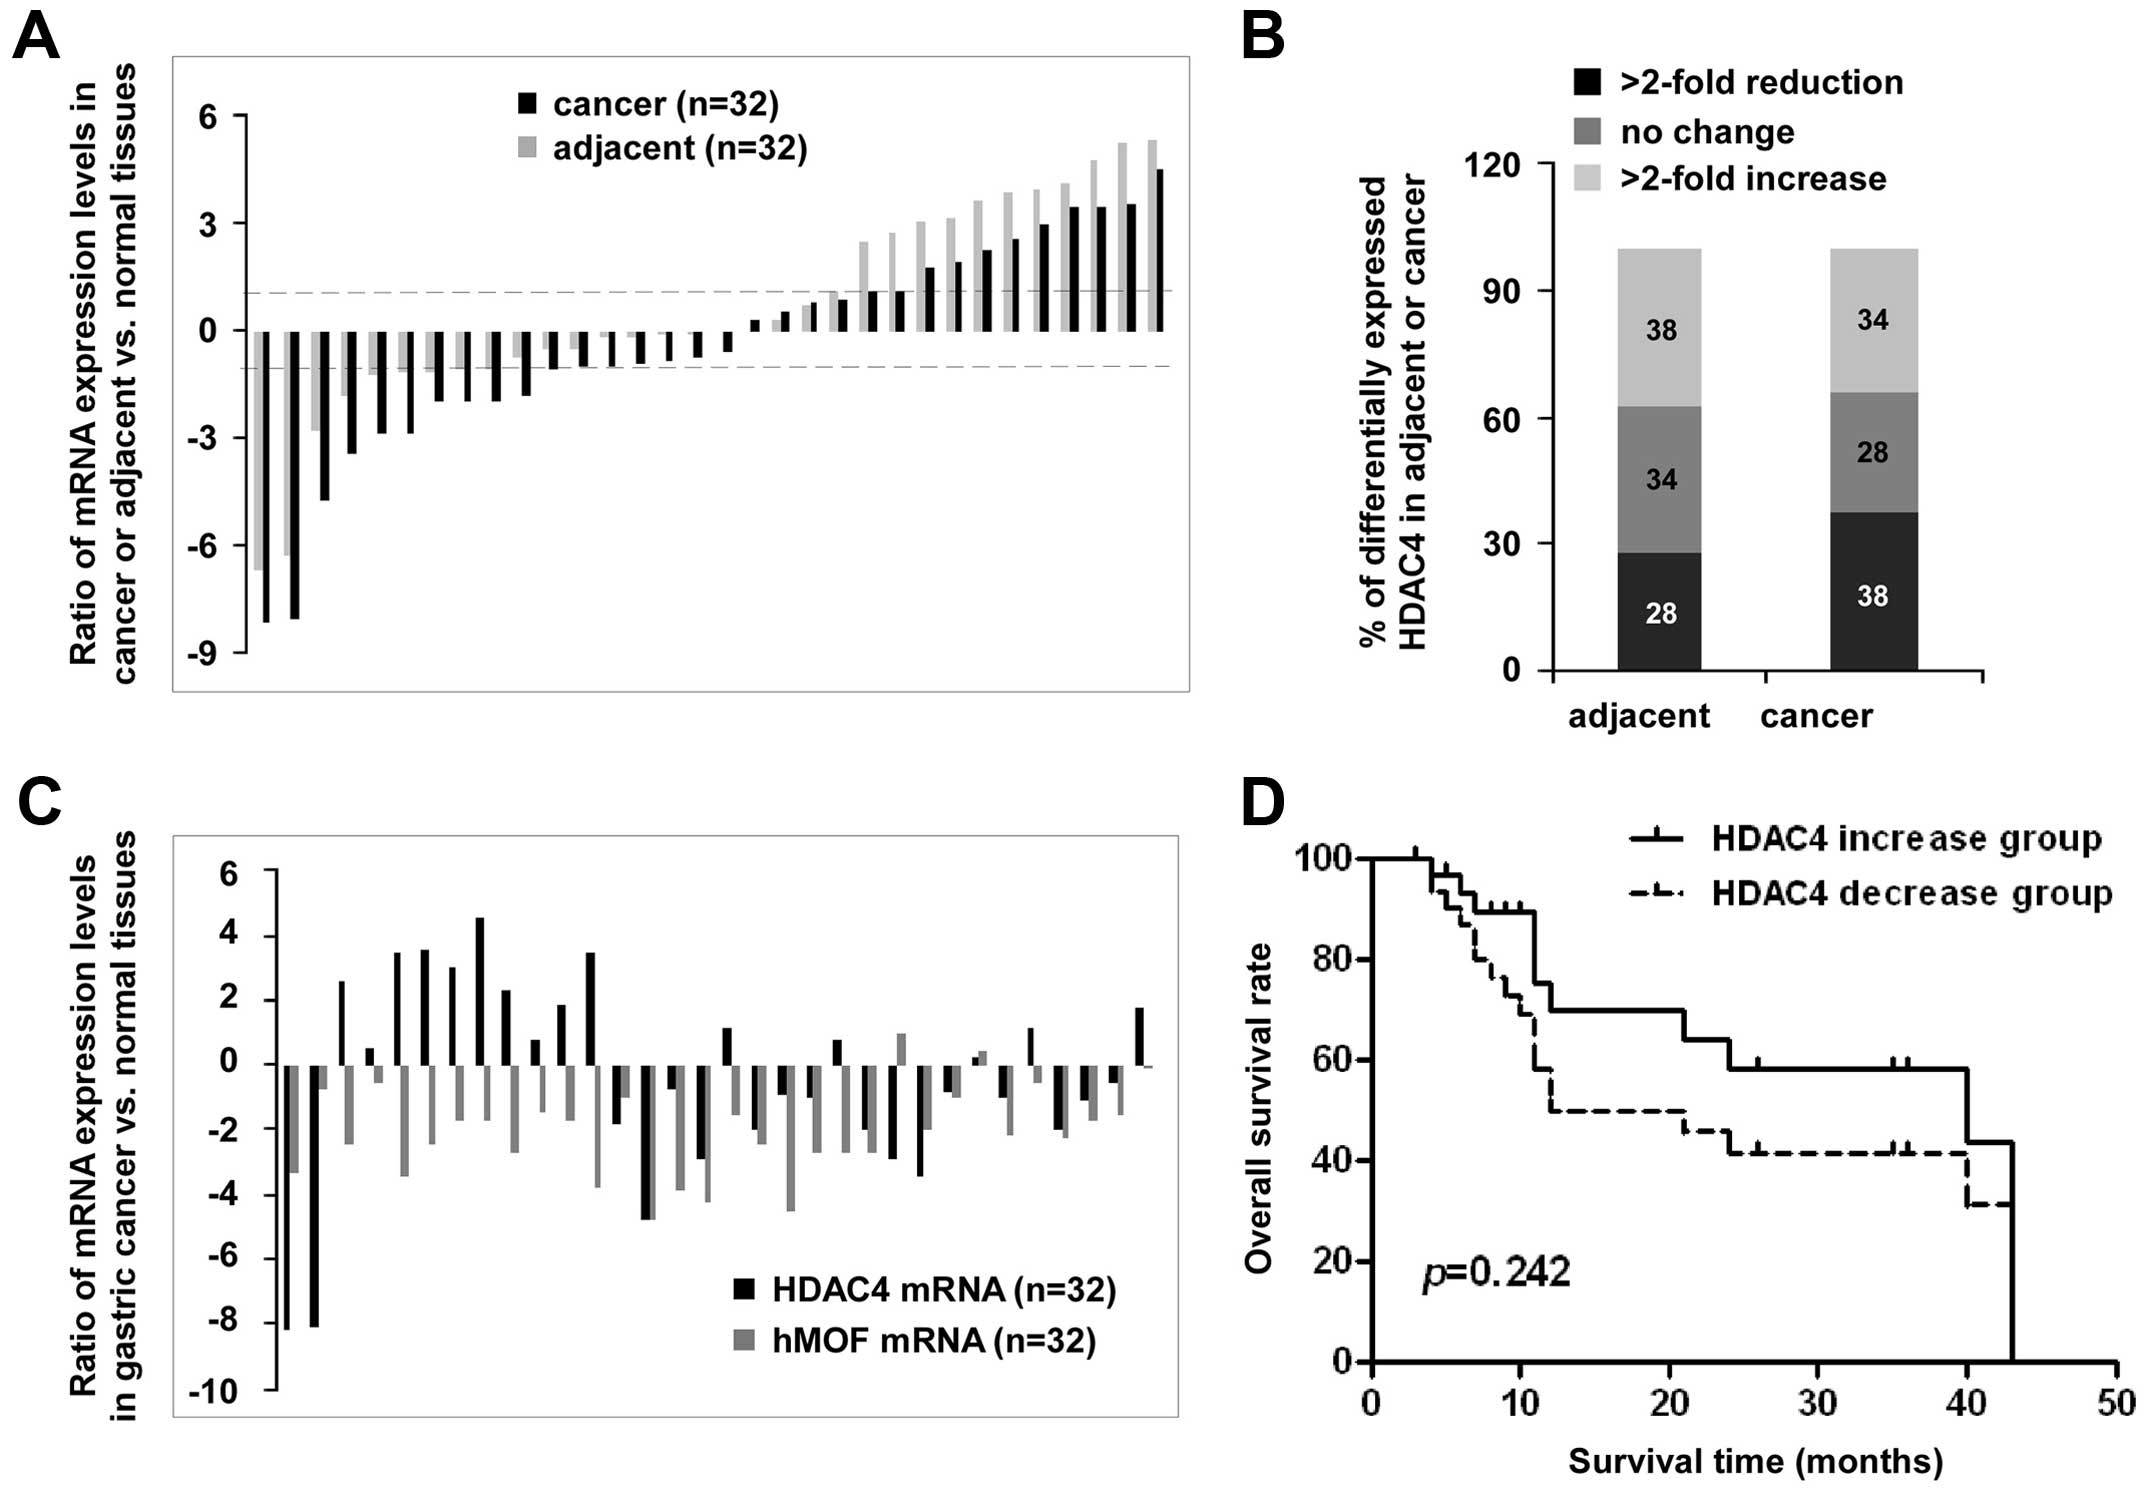
The HDAC4 expression patterns are shown in
Fig. 4A, there are wide individual
differences. Compared to normal tissues, high expression of
HDAC4 (>2-fold) was found in 38% (12/32) of adjacent
tissues and in 34% (11/32) of cancer tissues. Conversely, low
expression of HDAC4 was also observed in 28% (9/32) of
adjacent tissues and in 38% (12/32) of cancer tissues, while
<2-fold change of HDAC4 expression in adjacent and cancer
tissues were 34 and 28%, respectively (Fig. 4B). The analysis of the expression
levels of the hMOF and HDAC4 from the same patient
clearly shows there was no remarkable correlation between high
level of HDAC4 and low expression of hMOF in gastric
cancer tissues. Among the patients with low expression level of
hMOF (>2-fold decrease, n=26), only 42% (11/26) of patients were
accompanied with high expression of HDAC4 (>2-fold
increase) (Fig. 4C). In addition,
the overall survival rates as shown in Fig. 4D, did not indicate significant
difference between the two HDAC4 expression groups
(p=0.242).
Relationship between low expression of
hMOF and high level of HDAC4 in gastric cancer cells
In order to further assess the correlation between
hMOF and HDAC4 in gastric cancer, experiments were further
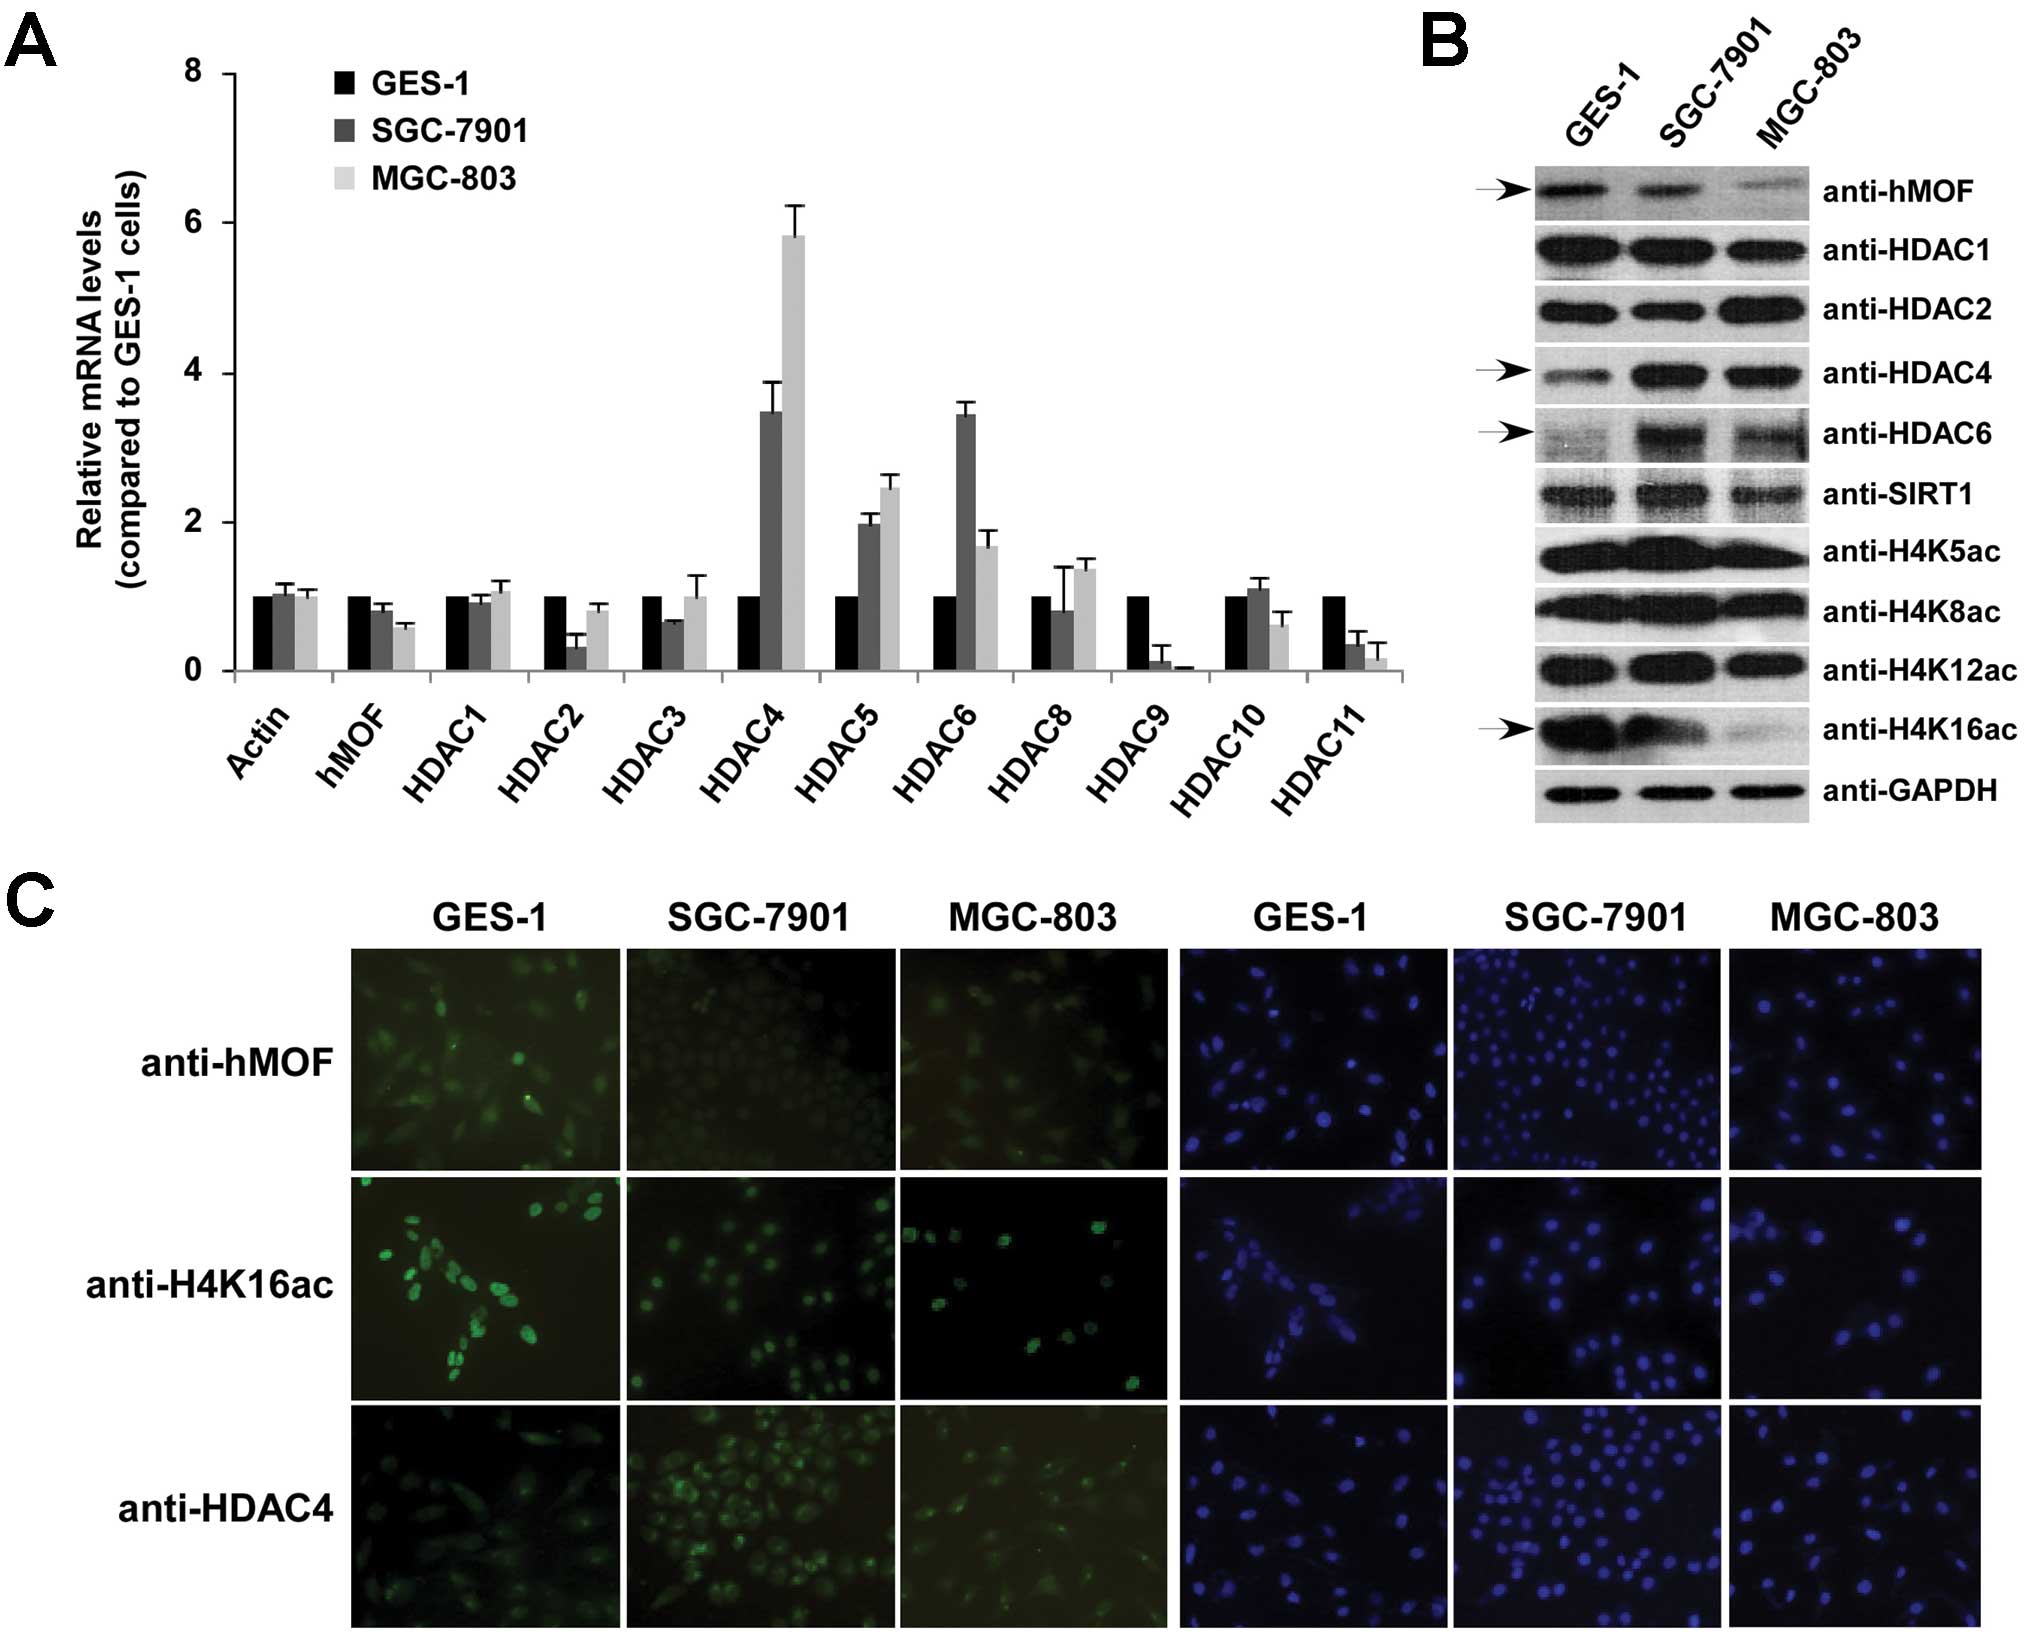
performed using gastric cancer cell lines. Fig. 5A shows the relative mRNA levels of
hMOF and indicated HDACs in gastric mucosal cell line GES-1 and two
gastric cancer cell lines including SGC-7901 and MGC-803. Compared
to GES-1 cells, higher mRNA levels of HDAC4, HDAC5 and HDAC6 were
observed in both gastric cancer cell lines. Protein expression
levels of hMOF and HDAC4, and the specific global lysine residue
acetylation on histone H4 were also evaluated in gastric cancer
cells by western blotting. As expected, declined hMOF protein level
was detected in both gastric cancer cell lines and the global
histone H4K16ac was tightly correlated with hMOF protein levels
(Fig. 5B and C). High expression
of HDAC4 was also confirmed by qPCR, western blotting and
immunofluorescence.
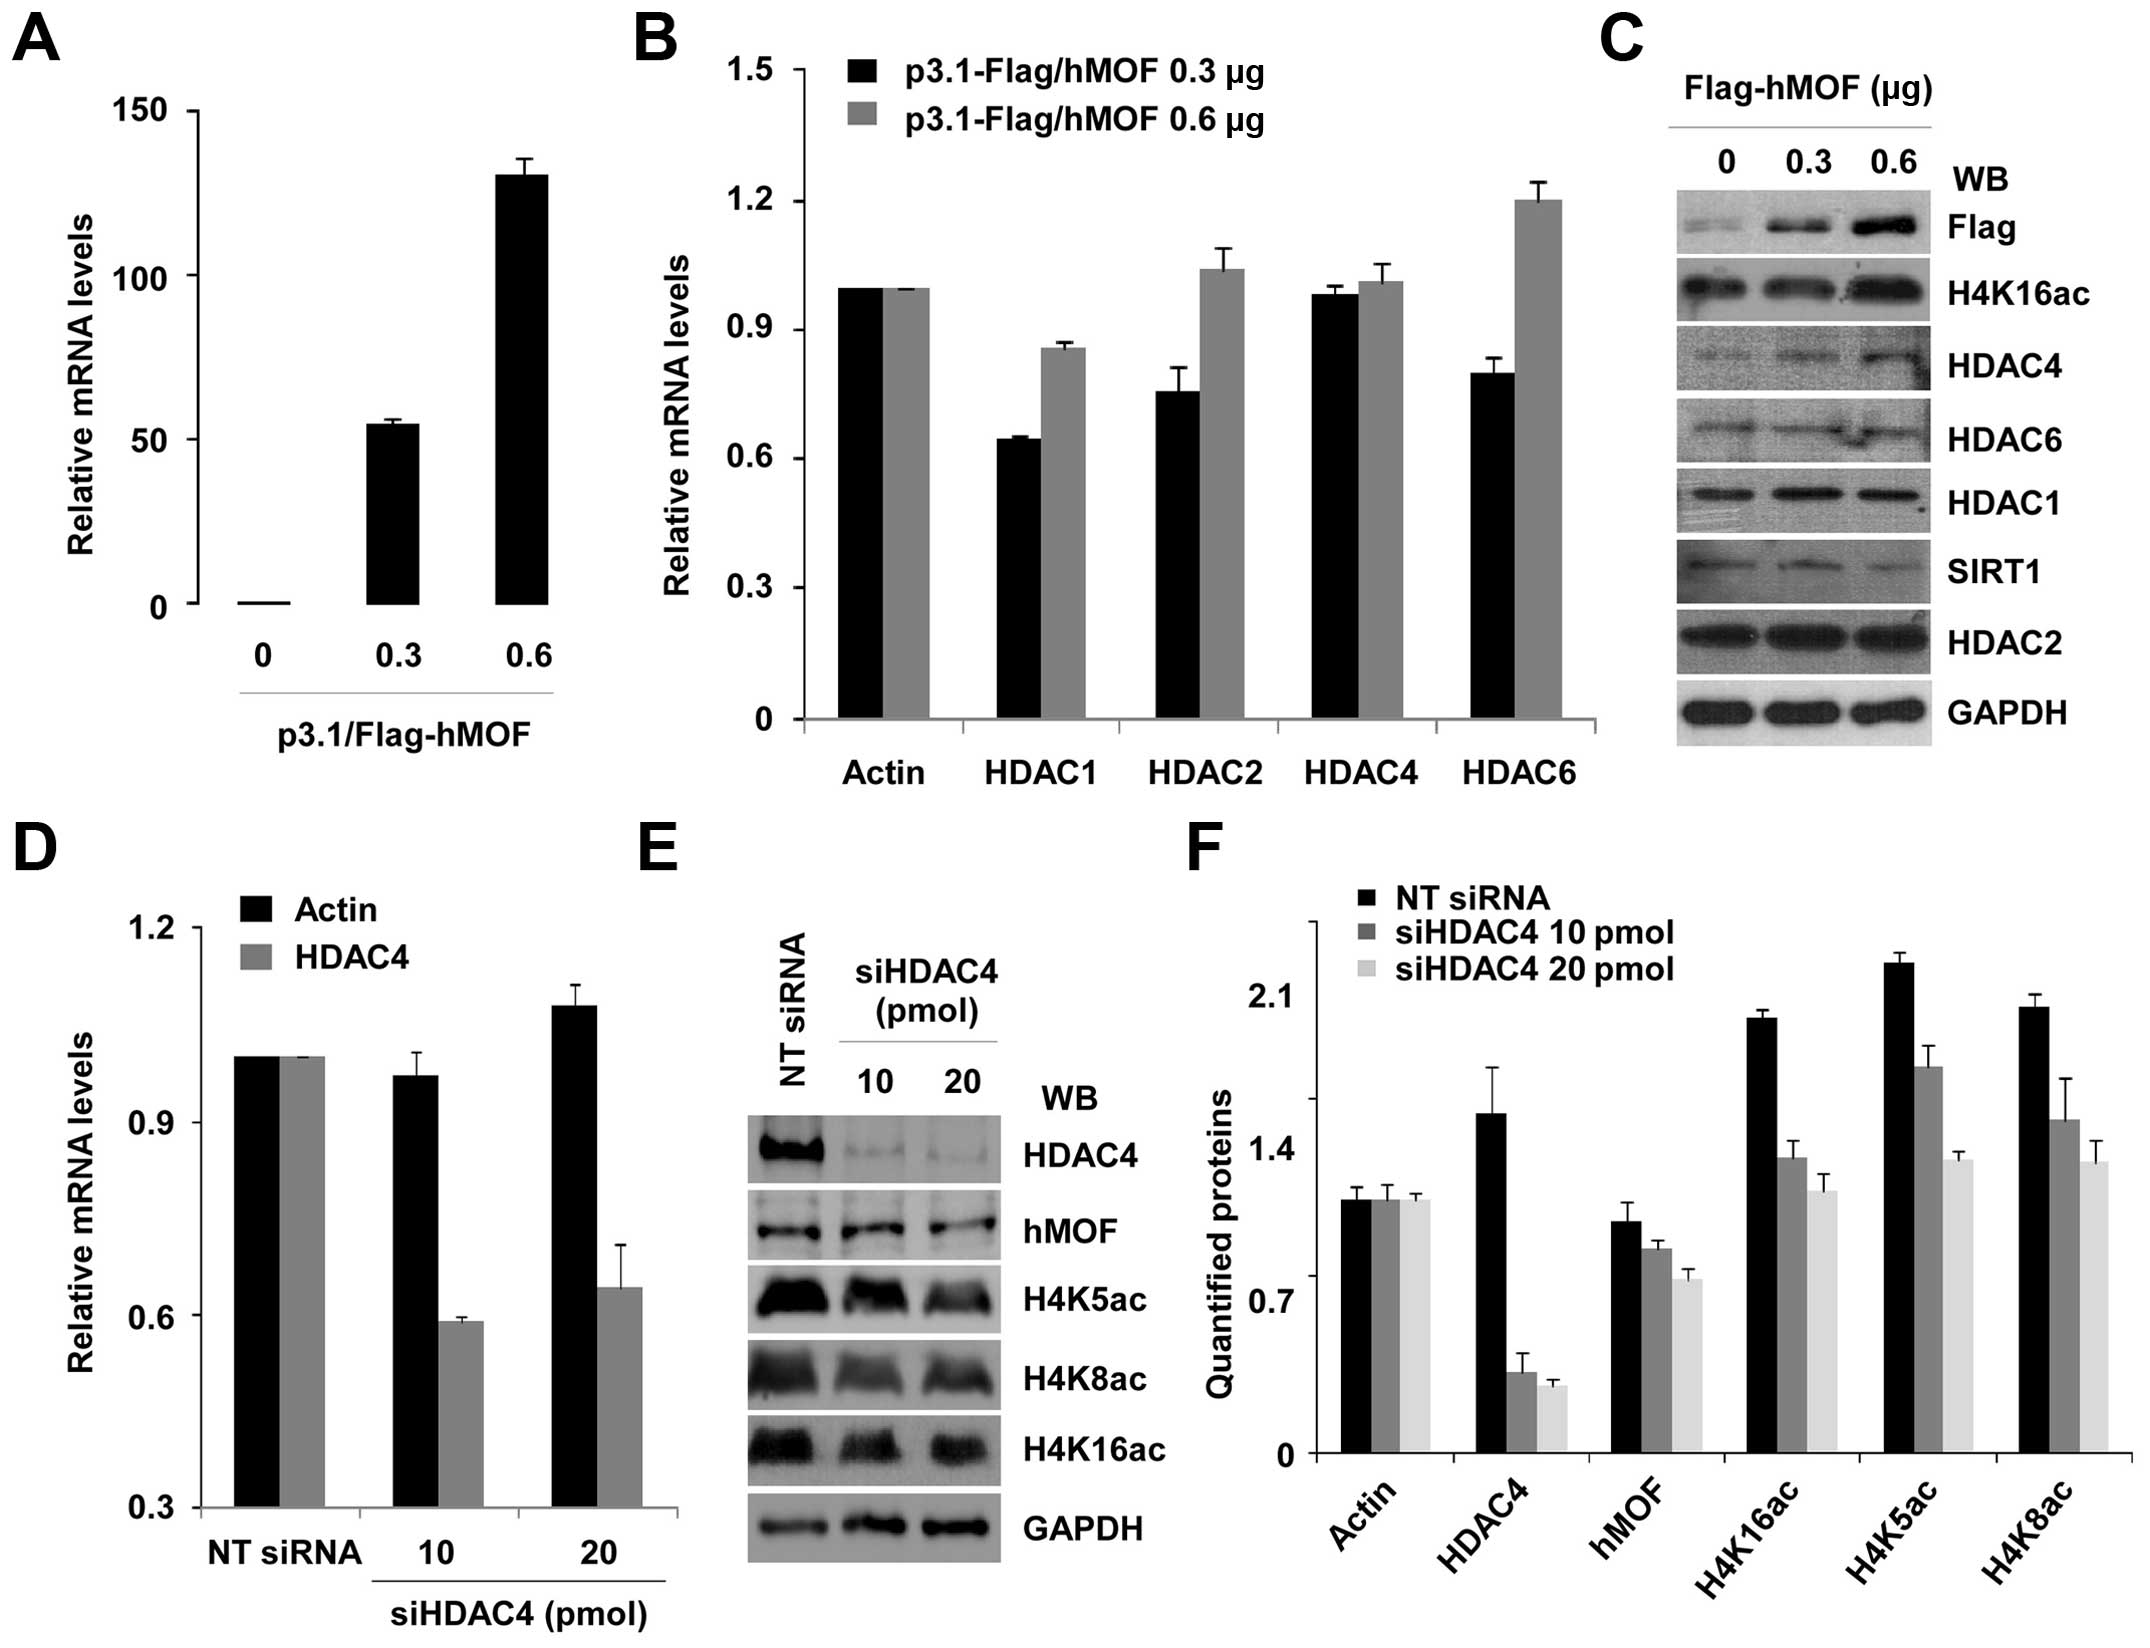
Our DNA microarray data show that HDAC4 is
transcriptionally regulated by hMOF. Depletion of hMOF with siRNAs
in HeLa cells leads to upregulation of HDAC4 (data not shown). To
determine whether HDAC4 expression was regulated by hMOF in gastric
cancer cells, MGC-803 cells were transiently transfected with 0.3
and 0.6 μg of hMOF cDNAs. The efficiency of transfection was
confirmed by qRT-PCR and western blotting (Fig. 6A and C). A dose-dependent increase
of mRNA and protein expression of hMOF was verified. However, the
relative mRNA expression of HDACs including HDAC4 was not increased
along with the amount of hMOF (Fig.
6B). On the other hand, western blot analysis revealed no
dramatic changes in protein levels for HDAC1/2/6 and SIRT1.
Moreover, increased HDAC4 protein level was not reversed in MGC-803
gastric cells (Fig. 6C). In
addition, to evaluate whether global histone H4K16ac is affected by
HDAC4, MGC-803 cells were then knocked down with HDAC4 siRNA. The
efficiency of HDAC4 knockdown was analyzed by qRT-PCR (Fig. 6D) and western blotting (Fig. 6E). However, low-status of global
histone H4K16ac in MGC-803 cells did not exhibit obvious
improvement by knocking down HDAC4. Global H4K5ac and H4K8ac were
also slightly decreased. Quantified proteins are shown in Fig. 6F.
Discussion
Global histone modification status in cells is
dynamically regulated by chromatin modifying enzymes that add and
remove covalent modifications to histone proteins. Any factor that
creates an imbalance can lead to abnormal global histone
modification in cells, and further cause cell dysfunction, even
cancer. Recently, increasing evidence suggests that chromatin
modifying enzymes including HATs and HDACs may participate in
initiating events in forms of some cancers. For example, histone
acetyltransferases such as EP300 (p300) and KAT6A (MOZ), and
histone deacetylases such as HDAC1 and HDAC2 have been shown to be
implicated in certain tumor types (25–27).
hMOF (MYST1), a member of the MYST family of histone
acetyltransferases (HATs), is the human ortholog of
Drosophila male absent on the first (MOF) protein (28). Frequent downregulation of
hMOF has been detected in several types of tumor tissues
including breast cancer, medulloblastoma, renal cell carcinoma,
ovariant cancer and colorectal cancer (17–20).
Our previous screening experimental data exhibit the low expression
tendency of hMOF in gastric cancer tissues (16 cases)
(20). In this study, using a
large number of gastric carcinoma tissue samples, we expanded our
previous research and elucidated the downregulation of hMOF
in gastric cancer tissues (Fig.
1). Significant (>2-fold decreased) downregulation of hMOF
mRNA was observed in 81% (42/52) of patients with gastric cancer.
Overall survival rates presented a significant difference between
the two hMOF expression groups (Fig. 3C).
Taken together, downregulation of hMOF might
closely correlate with the occurrence and prognosis of gastric
cancer. It is noteworthy that the abnormal expression of
hMOF had already appeared in adjacent tissues (<2 cm away
from the cancer area). Compared to matched normal tissues, although
no statistically significant difference was found between adjacent
and normal tissues, decreased expression of hMOF (>2-fold) in
adjacent tissues had already emerged in 25% (13/52) of patients
with gastric cancer. These findings are consistent with previous
study. A comprehensive analysis of the correlation between low
expression of hMOF and the clinicopathological features of
gastric cancer revealed that significant loss of hMOF is
tightly associated with the pathological stage (p<0.05 in
samples of pT2–pT4 stage), clinical stage (p<0.05 in stage
II–III) and lymph node metastasis (p<0.05 in N2 and N3)
(Figs. 2 and 3B).
To be clear, higher expression of hMOF in cancer and
matched adjacent or normal tissues was found in patients with
distant metastasis, and a statistically significant difference
between groups with or without distant metastasis was achieved
(p<0.01 for normal; p<0.05 for adjacent and p<0.001 for
cancer) (Fig. 3A). We have no
perfect way to explain this result, and more tissue samples and
further in-depth investigation is required. However, there was no
significant difference by age, gender, cell differentiation or
survival time.
On the contrary, low level of hMOF protein was
detected in both cancer tissues and gastric cancer cell lines
(Figs. 1D and 5B and C). In either case, hMOF protein
expression tightly correlated with acetylation of histone H4K16ac.
Except for histone H4K16ac, there was no obvious alteration in
global acetylation status on histone H4 at K5, K8 and K12 (Fig. 5B). Considering that global histone
H4K16ac in cells is also regulated by other enzymes such as HDACs
(29,30), mRNA and protein expression levels
of HDACs were evaluated by qRT-PCR and western blotting in gastric
cancer cells.
Among the detected HDACs, in HDAC4 and HDAC6,
especially high protein expression of HDAC4 was detected in both
SGC-7901 and MGC-803 cells (Fig. 5B
and C). These results are consistent with the report by Kang
et al that HDAC4 is upregulated in several gastric cancer
cell lines including BGC-823 and SGC-7901 (24). However, in our study, no
significant upregulation of HDAC4 was obtained in gastric
cancer tissues (Fig. 4). This may
be due to the limited number of tissue samples. Given the low
expression of hMOF and high-level of HDAC4 in both SGC-7901 and
MGC-803 gastric cancer cells, overexpression of hMOF in MGC-803
cells was carried out to evaluate whether the reduction of global
H4K16ac in gastric cancer cells is coordinately regulated by hMOF
and HDAC4. As expected, overexpression of hMOF increased global
H4K16ac in gastric cancer cells (Fig.
6C). However, there was no clear increase of histone H4K16ac in
the knockdown HDAC4 MGC-803 gastric cancer cells (Fig. 6E and F). These results suggest that
hMOF, but not HDAC4, is mainly responsible for global histone
H4K16ac in MGC-803 gastric cancer cells.
In summary, downregulation of hMOF was
detected in gastric cancer tissues and gastric cancer cells.
Declined hMOF expression, but not high level of HDAC4, may account
for global histone H4K16ac in gastric cancer cells. Our results
suggest that the molecular mechanism linking loss of hMOF
expression may be involved in gastric cancer progression.
Acknowledgements
This work was supported by National Natural Science
Foundation of China (no. 31070668, J.J.; no. 31171245 and 31371311,
Y.C.), the Research Fund for the Doctoral Program of Higher
Education of China (20110061110020, J.J.) and by a grant to J.J.
from the Jilin Province Science and Technology Development Program
(20130206005YY).
References
|
1
|
Feinberg AP, Ohlsson R and Henikoff S: The
epigenetic progenitor origin of human cancer. Nat Rev Genet.
7:21–33. 2006. View
Article : Google Scholar
|
|
2
|
Jones PA and Martienssen R: A blueprint
for a human epigenome project: The AACR human epigenome workshop.
Cancer Res. 65:11241–11246. 2005. View Article : Google Scholar : PubMed/NCBI
|
|
3
|
Bannister AJ and Kouzarides T: Regulation
of chromatin by histone modifications. Cell Res. 21:381–395. 2011.
View Article : Google Scholar : PubMed/NCBI
|
|
4
|
Haberland M, Montgomery RL and Olson EN:
The many roles of histone deacetylases in development and
physiology: Implications for disease and therapy. Nat Rev Genet.
10:32–42. 2009. View
Article : Google Scholar
|
|
5
|
Fraga MF, Ballestar E, Villar-Garea A,
Boix-Chornet M, Espada J, Schotta G, Bonaldi T, Haydon C, Ropero S,
Petrie K, et al: Loss of acetylation at Lys16 and trimethylation at
Lys20 of histone H4 is a common hallmark of human cancer. Nat
Genet. 37:391–400. 2005. View
Article : Google Scholar : PubMed/NCBI
|
|
6
|
Orpinell M, Fournier M, Riss A, Nagy Z,
Krebs AR, Frontini M and Tora L: The ATAC acetyl transferase
complex controls mitotic progression by targeting non-histone
substrates. EMBO J. 29:2381–2394. 2010. View Article : Google Scholar : PubMed/NCBI
|
|
7
|
Mulligan P, Yang F, Di Stefano L, Ji JY,
Ouyang J, Nishikawa JL, Toiber D, Kulkarni M, Wang Q,
Najafi-Shoushtari SH, et al: A SIRT1-LSD1 corepressor complex
regulates Notch target gene expression and development. Mol Cell.
42:689–699. 2011. View Article : Google Scholar : PubMed/NCBI
|
|
8
|
Ma P and Schultz RM: Histone deacetylase 2
(HDAC2) regulates chromosome segregation and kinetochore function
via H4K16 deacetylation during oocyte maturation in mouse. PLoS
Genet. 9:e10033772013. View Article : Google Scholar : PubMed/NCBI
|
|
9
|
Smith ER, Cayrou C, Huang R, Lane WS, Côté
J and Lucchesi JC: A human protein complex homologous to the
Drosophila MSL complex is responsible for the majority of histone
H4 acetylation at lysine 16. Mol Cell Biol. 25:9175–9188. 2005.
View Article : Google Scholar : PubMed/NCBI
|
|
10
|
Cai Y, Jin J, Swanson SK, Cole MD, Choi
SH, Florens L, Washburn MP, Conaway JW and Conaway RC: Subunit
composition and substrate specificity of a MOF-containing histone
acetyltransferase distinct from the male-specific lethal (MSL)
complex. J Biol Chem. 285:4268–4272. 2010. View Article : Google Scholar :
|
|
11
|
Mendjan S, Taipale M, Kind J, Holz H,
Gebhardt P, Schelder M, Vermeulen M, Buscaino A, Duncan K, Mueller
J, et al: Nuclear pore components are involved in the
transcriptional regulation of dosage compensation in Drosophila.
Mol Cell. 21:811–823. 2006. View Article : Google Scholar : PubMed/NCBI
|
|
12
|
Sharma GG, So S, Gupta A, Kumar R, Cayrou
C, Avvakumov N, Bhadra U, Pandita RK, Porteus MH, Chen DJ, et al:
MOF and histone H4 acetylation at lysine 16 are critical for DNA
damage response and double-strand break repair. Mol Cell Biol.
30:3582–3595. 2010. View Article : Google Scholar : PubMed/NCBI
|
|
13
|
Carrozza MJ, Utley RT, Workman JL and Côté
J: The diverse functions of histone acetyltransferase complexes.
Trends Genet. 19:321–329. 2003. View Article : Google Scholar : PubMed/NCBI
|
|
14
|
Gupta A, Guerin-Peyrou TG, Sharma GG, Park
C, Agarwal M, Ganju RK, Pandita S, Choi K, Sukumar S, Pandita RK,
et al: The mammalian ortholog of Drosophila MOF that acetylates
histone H4 lysine 16 is essential for embryogenesis and
oncogenesis. Mol Cell Biol. 28:397–409. 2008. View Article : Google Scholar :
|
|
15
|
Song JS, Chun SM, Lee JY, Kim DK, Kim YH
and Jang SJ: The histone acetyltransferase hMOF is overexpressed in
non-small cell lung carcinoma. Korean J Pathol. 45:386–396. 2011.
View Article : Google Scholar
|
|
16
|
Zhao L, Wang DL, Liu Y, Chen S and Sun FL:
Histone acetyltransferase hMOF promotes S phase entry and
tumorigenesis in lung cancer. Cell Signal. 25:1689–1698. 2013.
View Article : Google Scholar : PubMed/NCBI
|
|
17
|
Pfister S, Rea S, Taipale M, Mendrzyk F,
Straub B, Ittrich C, Thuerigen O, Sinn HP, Akhtar A and Lichter P:
The histone acetyltransferase hMOF is frequently downregulated in
primary breast carcinoma and medulloblastoma and constitutes a
biomarker for clinical outcome in medulloblastoma. Int J Cancer.
122:1207–1213. 2008. View Article : Google Scholar
|
|
18
|
Liu N, Zhang R, Zhao X, Su J, Bian X, Ni
J, Yue Y, Cai Y and Jin J: A potential diagnostic marker for
ovarian cancer: Involvement of the histone acetyltransferase, human
males absent on the first. Oncol Lett. 6:393–400. 2013.PubMed/NCBI
|
|
19
|
Wang Y, Zhang R, Wu D, Lu Z, Sun W, Cai Y,
Wang C and Jin J: Epigenetic change in kidney tumor: Downregulation
of histone acetyltransferase MYST1 in human renal cell carcinoma. J
Exp Clin Cancer Res. 32:82013. View Article : Google Scholar : PubMed/NCBI
|
|
20
|
Cao L, Zhu L, Yang J, Su J, Ni J, Du Y,
Liu D, Wang Y, Wang F, Jin J, et al: Correlation of low expression
of hMOF with clinicopathological features of colorectal carcinoma,
gastric cancer and renal cell carcinoma. Int J Oncol. 44:1207–1214.
2014.PubMed/NCBI
|
|
21
|
Ferlay J, Shin HR, Bray F, Forman D,
Mathers C and Parkin DM: Estimates of worldwide burden of cancer in
2008: GLOBOCAN 2008. Int J Cancer. 127:2893–2917. 2010. View Article : Google Scholar
|
|
22
|
Kang C, Song JJ, Lee J and Kim MY:
Epigenetics: An emerging player in gastric cancer. World J
Gastroenterol. 20:6433–6447. 2014. View Article : Google Scholar : PubMed/NCBI
|
|
23
|
Edge SB, Byrd DR, Compton CC, Fritz AG,
Greene FL and Trotti A: AJCC Cancer Staging Manual. 7th edition.
Springer; Chicago, IL: 2010
|
|
24
|
Kang ZH, Wang CY, Zhang WL, Zhang JT, Yuan
CH, Zhao PW, Lin YY, Hong S, Li CY and Wang L: Histone deacetylase
HDAC4 promotes gastric cancer SGC-7901 cells progression via p21
repression. PLoS One. 9:e988942014. View Article : Google Scholar : PubMed/NCBI
|
|
25
|
Fermento ME, Gandini NA, Salomón DG,
Ferronato MJ, Vitale CA, Arévalo J, López Romero A, Nuñez M, Jung
M, Facchinetti MM, et al: Inhibition of p300 suppresses growth of
breast cancer. Role of p300 subcellular localization. Exp Mol
Pathol. 97:411–424. 2014. View Article : Google Scholar : PubMed/NCBI
|
|
26
|
Chan EM, Chan RJ, Comer EM, Goulet RJ III,
Crean CD, Brown ZD, Fruehwald AM, Yang Z, Boswell HS, Nakshatri H,
et al: MOZ and MOZ-CBP cooperate with NF-kappaB to activate
transcription from NF-kappaB-dependent promoters. Exp Hematol.
35:1782–1792. 2007. View Article : Google Scholar : PubMed/NCBI
|
|
27
|
Xia J, Zhou Y, Ji H, Wang Y, Wu Q, Bao J,
Ye F, Shi Y and Bu H: Loss of histone deacetylases 1 and 2 in
hepatocytes impairs murine liver regeneration through Ki67
depletion. Hepatology. 58:2089–2098. 2013. View Article : Google Scholar : PubMed/NCBI
|
|
28
|
Neal KC, Pannuti A, Smith ER and Lucchesi
JC: A new human member of the MYST family of histone acetyl
transferases with high sequence similarity to Drosophila MOF.
Biochim Biophys Acta. 1490:170–174. 2000. View Article : Google Scholar : PubMed/NCBI
|
|
29
|
Hajji N, Wallenborg K, Vlachos P,
Füllgrabe J, Hermanson O and Joseph B: Opposing effects of hMOF and
SIRT1 on H4K16 acetylation and the sensitivity to the topoisomerase
II inhibitor etoposide. Oncogene. 29:2192–2204. 2010. View Article : Google Scholar : PubMed/NCBI
|
|
30
|
Noguchi A, Kikuchi K, Zheng H, Takahashi
H, Miyagi Y, Aoki I and Takano Y: SIRT1 expression is associated
with a poor prognosis, whereas DBC1 is associated with favorable
outcomes in gastric cancer. Cancer Med. 3:1553–1561. 2014.
View Article : Google Scholar : PubMed/NCBI
|