Introduction
The development of the next-generation sequencing
(NGS) allows us to do many different types of genetic and genomic
analyses in a high throughput way (1–4).
Completion of the whole coding exon (exome) or genome sequencing
takes several months to years using technologies such as Sanger
sequencing. But it takes only several days or weeks using NGS,
providing a tremendous amount of genomic information which can be
used for developing therapeutic targets or diagnostic markers
(1–5). Another significant trend toward NGS
is the application of targeted sequencing for selected genes
related to clinical or biological significance such as cancer
driver genes or the drug target genes such as EGFR and
BRAF (6–9). After completing large scale
collaborative sequencing projects such as The Cancer Genome Atlas
(TCGA) and identifying many cancer driving mutations (10–14),
targeted sequencing approaches designed only for biologically or
clinically proven genes are becoming both more popular and a
standard for precision medicine approaches in hospitals and clinics
(6–9).
There are several ways to enrich for selecting genes
or coding regions (5,6,15–17).
The most frequently used targeted enrichment methods are
amplification by PCR (6,7) or hybrid capture (15–17).
Hybrid capture method tends to require more DNA (i.e. 50–100 ng)
than an amplification method (i.e. 10 ng) (6,7,15–17).
Each method requires different amount of DNA and suggests a
different quantity and quality check of DNA for their library
preparation. However, there is no gold standard for DNA quality and
quantity assessment in targeted NGS. The lack of standard
assessment may cause inconsistent and non-reproducible results
among different targeted enrichment methods and different NGS
platforms (6,7,15–17).
A lot of clinical samples from hospitals are
incorrectly processed, or stored, and may be degraded or too small
to extract enough high quality DNA. Formalin-fixed,
paraffin-embedded (FFPE) tissues are the most frequently used
sample type for diagnosis and genetic screening in hospitals. DNAs
extracted from FFPE tissues are well known to be degraded and
fragmented, thus, special caution is needed for molecular genetic
analyses of DNA derived from FFPE tissues (7). A biopsy specimen, another frequently
used sample type in hospitals, is also challenging for extracting
enough high quality DNA due to its small sample (cancer) size. A
small amount of DNA may be amplified using a whole genome
amplification (WGA) method for the downstream genetic analyses. But
it is known that amplification biases affect results and cause
false positive and negative results (18,19).
Thus, it is very important to measure correctly and efficiently the
quality and quantity of DNA extracted from challenging clinical
samples for genetic analyses such as NGS.
Several different DNA quantity and quality
measurement methods have been used for NGS and other genetic
analyses. UV spectroscopy or spectrophotometry (i.e. NanoDrop) may
be simplest and easiest way to measure DNA or other materials in
certain ranges of wavelength (20). However, UV spectrophotometers
detect not only DNA, but also UV-absorbing materials like RNA,
protein and phenol (20) and are
not sensitive enough to detect a small amount of DNA. Another DNA
quantitation method is the detection of double-stranded DNA (dsDNA)
using a fluorescent dye (21).
PicoGreen is a fluorescent dye that preferentially binds to dsDNA
(22). Thus, a PicoGreen-based
dsDNA measurement can provide more specific results than UV
spectrophotometer (22).
Qubit® dsDNA assays (Thermo Fisher Scientific) also
detect dsDNA using a fluorescent dye and fluorometer (23). Another commonly used method is a
capillary electrophoresis of DNA or RNA in a chip (24). Agilent Bioanalyzer may be the best
example of this capillary electrophoresis method (25). Bioanalyzer provides quantity, size
and quality of measured DNA and RNA and may be a gold standard
method especially for RNA quantity and quality analyses. However,
this method requires several experimental steps and is relatively
more complex than other methods. The cost of Bioanalyzer analysis
may also be the highest among others. The last method is a
qPCR-based DNA quantification (21,23,26,27).
qPCR is widely used for gene expression, mutation and various
genotyping analyses. TaqMan (Thermo Fisher Scientific) may be the
most common qPCR-based assay using unlabeled PCR primers and
fluorescent labeled probe (21,23,26,27).
Another commonly used method is a SYBR-Green-based qPCR assay. Like
PicoGreen, SYBR-Green also preferentially binds dsDNA and has
widely been used for various qPCR assay (21,23,26,27).
Unlike TaqMan assays, no specific fluorescent probe is required
thus, SYBR-Green is cheaper and provides more flexibility for assay
design.
In the present study, we tested four commonly used
DNA measurement methods for their accuracy, cost and
user-friendliness to finally select the best method of DNA quality
and quantity assessment for NGS library preparation. As there is no
gold standard for DNA analyses for NGS, and each NGS method
suggests a different method, we believe that this comprehensive
analyses of four different methods will help researchers find the
best and most efficient method for targeted NGS.
Materials and methods
Experimental design
To evaluate quantitation techniques and determine
the optimal method for quantitation of DNA derived from FFPE tissue
samples for NGS library preparation, we compared four alternative
methods: i) fluorometry using PicoGreen; ii) Qubit®
fluorometer (Thermo Fisher Scientific); iii) an in-house designed
duplexed TaqMan qPCR assay; and iv) an in-house dual-probe
SYBR-Green qPCR assay to qPCR TaqMan RNase P. After determining
which of the methods quantified samples consistently when compared
to RNase P, we then compared NGS library performance based on yield
for samples prepped with inputs based on RNase P and the similar
alternative quantitation method.
In-house qPCR designs
Because the chronic exposure to UV light, skin
melanoma is among the top three tumor types with high mutation rate
(28). First, we interrogated the
genomic mutational landscape from 250 skin melanoma cases (TCGA;
http://www.cbioportal.org/) that had
available data from exome sequencing and gene copy number analysis
to identify those genes with the lowest rate of genetic alterations
(<1%). Second, the list of candidate genes was filtered by using
the exome and gene copy number data from more than 17,000 tumors
(TCGA) to identify genes or loci with less genetic alterations
(<4% in gene copy number, and never homozygous deletions and
<1.5% of SNV) across the 50 most frequent tumor types. Third,
the genes that had annotated pseudogenes (29) were discarded for design, as
pseudogenes can cause an over quantification of DNA due to the
extra copies in the genome. Fourth, the genes located in sexual
chromosomes were excluded. Fifth, to ensure a DNA specific
quantification, the oligonucleotides were designed in the intronic
or intergenic regions of the targeted genes. Sixth, the specificity
of the oligonucleotides was verified by primer blast (NCBI) against
the Human genome reference sequence. Finally, the lack of
polymorphic variants in the primer binding sites was tested and
confirmed by SNPCheck V3.0 (https://secure.ngrl.org.uk/SNPCheck/snpcheck.htm).
With these selection criteria, we selected three loci, 22q12.3,
14q24.1 and 15q24.3, with minimal copy number alterations across
different types of cancer samples.
We set out to create a two-assay qPCR quantitation
method with different amplicon sizes, to allow the assessment of
the relative quality of DNA by comparing the concentrations of the
smaller amplicon(s) to that of the larger amplicon(s). Thus, six
sets of primers for small amplicons (≤96 bp), three sets of large
amplicons (<190 bp) and corresponding TaqMan probes were
designed in conserved regions of the Human Genome as alternative
quantitation assays to TaqMan RNase P. The short amplicons are
located at chromosome 22q12.3 and 14q24.1, while the longest
amplicons are located at 22q12.3 and 15q24.3. Human genomic DNA
(Bioline, Taunton, MA, USA), was serially diluted to construct a
standard curve ranging from 40 to 0.064 ng/μl and run on a
QuantStudio 6 (Thermo Fisher Scientific) in accordance with the
manufacturer's instructions to determine the efficiency of the
primer sets with SYBR-Green chemistry using SYBR®
GreenER™ Dye (Thermo Fisher Scientific), a modified SYBR-Green I
dye. Inefficient primer pairs, or primer pairs showing more than a
single product in their melt curves were excluded from further
testing. Efficient primer pairs were then run with their
corresponding TaqMan probe and Human genomic DNA (Bioline) was
serially diluted to construct a standard curve ranging from 100 to
0.16 ng/μl and run to determine the efficiency of the primers/probe
with TaqMan chemistry. One of each efficient small and each
efficient large amplicon was then combined to make 10 duplex TaqMan
assays and tested for efficiency with a standard curve ranging from
40 to 0.8 ng/μl. One duplex was chosen as the final in-house design
for its consistent efficiency and deemed QC1 (small amplicon) and
QC2 (large amplicon). Similarly, the small amplicon designs were
paired creating pools of two sets of small amplicon oligos, and
large amplicon designs were also paired creating pools of two large
amplicon oligos. Small amplicon pairs and large amplicon
combinations were then tested for efficiency with a standard curve
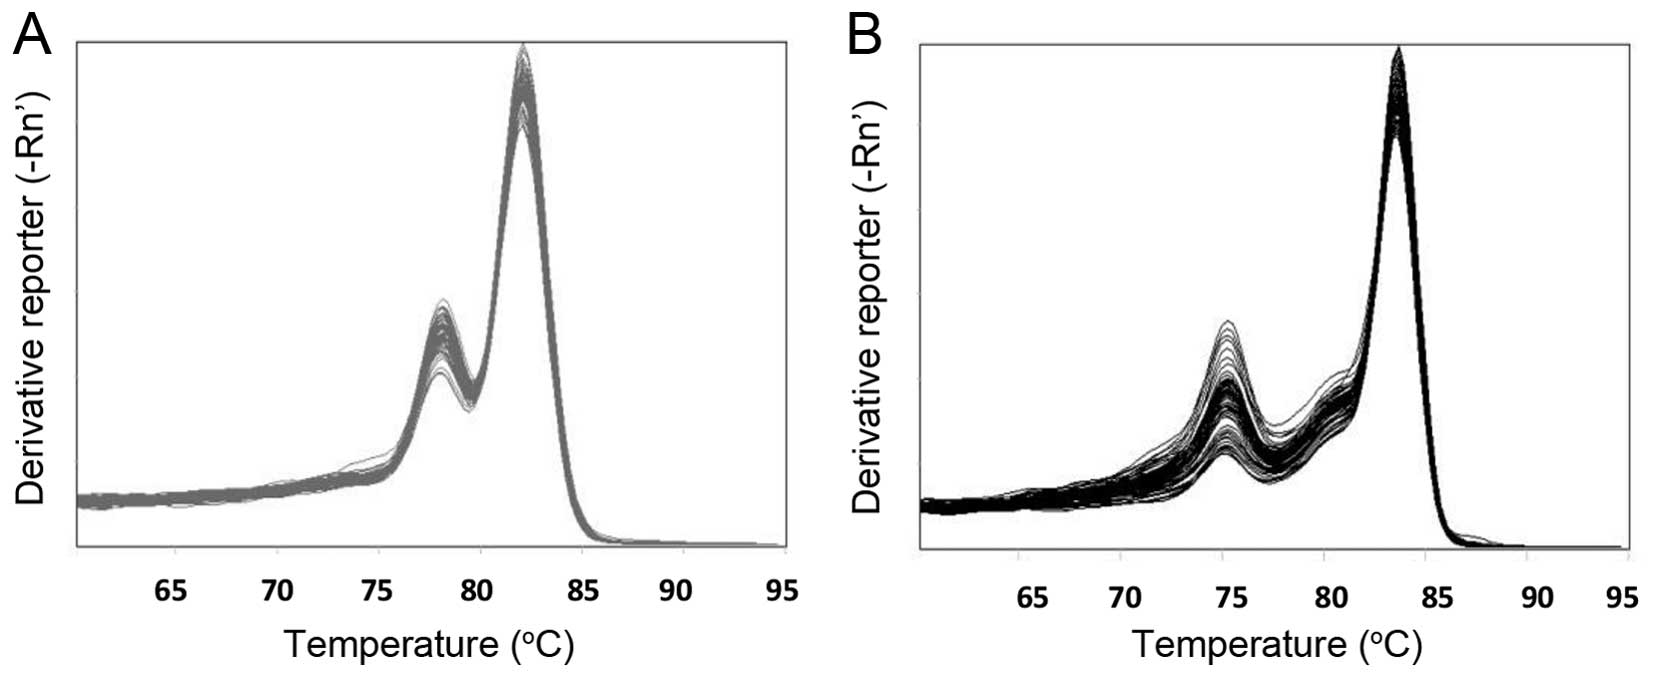
ranging from 40 to 0.8 ng/μl. One of the small amplicon
combinations and one of the large amplicon combinations was chosen
as the final in-house design for their melt curve profiles
(Fig. 1) and consistent
efficiencies to form a dual-probe SYBR-Green assay that
interrogates multiple regions of the genome. The combinations were
deemed DS1 (small amplicon combination) and DS2 (large amplicon
combination).
Clinical specimens
DNA samples were used for comparison and evaluation
quantitation methods including 26 frozen and 45 FPPE cancer tissue
samples collected under a protocol (#11-06107) approved by the
Committee for Human Research at the University of California, San
Francisco and one cancer FFPE cancer cell line, A549. Samples P12
and P37 were collected after prior consent and patient approval.
The sequencing data of sample P12 and P37 were collected from the
original clinical run in a certified Clinical Laboratory
Improvement Amendments (CLIA) laboratory (Purity Laboratories, Lake
Oswego, OR, USA) and have been fully de-identified.
FFPE tissue processing and DNA
extraction
Each FFPE tissue section, ranging in size from 5 to
10 μm in thickness with no more than 2.25 cm2 of tissue
area, was deparaffinized by submersion in xylene for 10 min at room
temperature and air dried for at least 10 min. DNA extraction was
performed on the deparaffinized tissue section with the UltraRapid
FFPE DNA Extraction kit (CureSeq, Inc., Brisbane, CA, USA) in
accordance with the manufacturer's instructions and as previously
described (7). Five of the 45
samples were also extracted with the AllPrep DNA/RNA FFPE kit
(Qiagen) in accordance with the manufacturer's instructions for
extraction method comparison. For the UltraRapid FFPE DNA
extraction, 5 μl of Solution A (CureSeq) was spread over the FFPE
tissue sections to hydrate the tissue before it was scraped and
transferred to a PCR tube containing 70 μl of Solution A. The tube
containing tissue was incubated for 5 min at 99°C, before the
addition of 10 μl of Solution B (CureSeq). After the addition of
Solution B, samples were mixed by shaking, briefly spun down, and
then incubated for 5 min at 60°C followed by 5 min at 99°C. Samples
were then centrifuged at 1,000 × g for 1 min at room temperature,
and the supernatant containing DNA was collected and transferred to
a new tube for quantification. For the AllPrep DNA/RNA FFPE
extraction, 7 μl of buffer PKD (Qiagen) was spread over the FFPE
tissue sections to hydrate the tissue before it was scraped and
transferred to a 1.5 ml microcentrifuge tube containing 150 μl of
buffer PKD. After the addition of proteinase K, tissue was
partially digested at 56°C for 15 min, then spun down for 15 min at
20,000 × g. The supernatant was removed, and the pellet was
suspended with buffer ATL (Qiagen). Additional proteinase K was
added and the re-suspended pellet was incubated at 56°C for 1 h,
followed by 90°C for 2 h. After incubation, buffer AL (Qiagen) and
ethanol was added before samples were transferred to a QIAamp
MinElute spin column (Qiagen) for column purification. Purified DNA
was eluted in 85 μl of nuclease-free water for quantification.
Frozen tissue processing and DNA
extraction
DNA from frozen tissues was extracted with DNeasy
Blood & Tissue kit (Qiagen) following the manufacturer's
instructions. Briefly, up to 25 mg of tissue was disrupted by using
TissueLyser LT for 5 min at 50 Hz. The tissue samples were digested
with ATL buffer in presence of proteinase K at 56°C for at least 1
h. The DNA was purified by using QIAmp MinElute columns, and eluted
in 200 μl of AE buffer.
PicoGreen assay
The stock DNA and the corresponding 1:5 diluted DNA
derived from FFPE tissue was quantified by using Quant-iT™
PicoGreen dsDNA Assay kit (Thermo Fisher Scientific) as follows: 2
μl of sample DNA were diluted 1:5 vol/vol in 1× TE, containing
1:100 diluted PicoGreen reagent in a final reaction volume of 40 μl
per reaction. Human genomic DNA (Bioline) was serially diluted to
construct a standard curve ranging from 2.5 to 0.08 ng/μl of DNA.
Each experimental sample or dilution point of the standard curve
was assayed in triplicates. The fluorometric quantitation was
performed in the Synergy HTX platform (BioTek Instruments, Inc.,
Winooski, VT, USA).
Qubit assay
The Qubit dsDNA HS (high sensitivity) assay kit
(Thermo Fisher Scientific) was used to quantify DNA derived from
FFPE tissue in accordance with the manufacturer's instruction.
Samples were prepared as follows: 2–5 μl of stock DNA or 1:5
diluted (vol/vol) DNA was added to 195–198 μl of the
Qubit® working solution for final volume of 200 μl. The
200 μl DNA and working solution were then incubated at room
temperature for at least 2 min before quantitation was performed
with the Qubit 3.0 fluorometer (Thermo Fisher Scientific).
TaqMan qPCR assay
DNA derived from FFPE tissue was quantified by the
TaqMan duplex assay and run on a QuantStudio 6 qPCR platform
(Thermo Fisher Scientific), following the manufacturer's
instructions. The TaqMan duplex assay is a fluorescent-based qPCR
assay consisting of two sets of primer probe oligos sets, QC1 and
QC2. QC1 (amplicon length ≤96 bp) measures short DNA fragments for
quantitation and QC2 measures the presence long DNA fragments
(amplicon length <190 bp). Human genomic DNA (Bioline) was
serially diluted to construct a standard curve ranging from 40 to
0.8 ng/μl. Each experimental DNA sample or dilution point of the
standard curve was run in triplicate for both QC1 and QC2 assays.
The qPCR reagent reaction volumes for both QC1 and QC2 were as
follows: 2 μl of stock or diluted DNA was mixed with 3.75 μl of 2X
PCR Master Mix, 0.375 μl of 20X QC1 or QC2 assay and 1.375 μl of
water. The cycling conditions for the qPCR reaction was as follows:
10 min at 50°C, 2 min at 95°C, 40 cycles of 15 sec at 95°C and 1
min at 60°C. ROX was used as passive reference.
Dual-probe SYBR-Green qPCR assay
DNA derived from FFPE and frozen tissue was
quantified by the two primer pair SYBR-Green qPCR assay on a
QuantStudio 6 qPCR platform (Thermo Fisher Scientific), following
the manufacturer's instructions. The two primer pair SYBR-Green
system is a fluorescent-based qPCR assay consisting of two sets of
oligos, DS1 and DS2. DS1 (amplicons length ≤85 bp) measures short
DNA fragments for quantitation and DS2 measures the presence of
long amplicons (length <190 bp). Human genomic DNA (Bioline) was
serially diluted to construct a standard curve ranging from 40 to
0.8 ng/μl. Each experimental DNA sample or dilution point of the
standard curve was run in triplicate for both DS1 and DS2 assays.
The qPCR reagent reaction volumes for both DS1 and DS2 were as
follows: 2 μl of stock or diluted DNA was mixed with 10 μl of 2×
PCR Master Mix, 1 μl of 20X DS1 or DS2 assay oligonucleotides and 7
μl of water. The cycling conditions for the qPCR reaction was as
follows: 2 min at 50°C, 2 min at 95°C, 40 qPCR cycles of 15 sec at
95°C and 1 min at 60°C, 15 sec at 95°C, 1 min at 60°C, and 15 sec
at 95°C. ROX was used as passive reference.
TaqMan RNase P qPCR
DNA derived from FFPE tissue was quantified by
TaqMan® Copy Number Reference Assay, human, RNase P
(Thermo Fisher Scientific) and run on a QuantStudio 6 qPCR platform
(Thermo Fisher Scientific), following the manufacturer's
instructions. Human genomic DNA (Bioline) was serially diluted to
construct a standard curve ranging from 40 to 0.8 ng/μl. Each
experimental DNA sample or dilution point of the standard curve was
run in triplicate. The qPCR reagent reaction volumes for RNase P
reactions were as follows: 2 μl of stock and or diluted DNA was
mixed with 3.75 μl of 2X PCR Master Mix, 0.375 μl of 20X RNase P
assay oligonucleotides and 1.375 μl of water. The cycling
conditions for the qPCR reaction was as follows: 10 min at 50°C, 2
min at 95°C, 40 cycles of 15 sec at 95°C and 1 min at 60°C. ROX was
used as passive reference.
Targeted NGS library preparation
The targeted cancer NGS panel (NextDay Seq-Pan
Cancer HotSpot Panel kit; CureSeq) was used for library preparation
(7). The libraries were prepared
using a 10 ng input of DNA based on quantitation by TaqMan RNase P,
the TaqMan QC2, SYBR-Green DS1 and SYBR-Green DS2. DNA was added to
a multiplexed PCR reaction and run for 22 cycles. The PCR products
were then ligated to universal adapters and barcodes. The ligated
PCR products were purified by using a magnetic bead-based protocol
and eluted in 30 μl of 1X LTE buffer to produce the final purified
libraries. Each library (1 μl) was run on a High Sensitivity DNA
chip (Agilent Technologies, Santa Clara, CA, USA; cat. no.
5067-4626) to evaluate the quality and library yield. The yield
from each library (pmol/l) was determined by a smear analysis of
the electropherogram in the 245–400 bp range, using the Bioanalyzer
2100 platform (Agilent Technologies) and software.
Library yield comparisons
Libraries were generated based on QC2, DS1 and DS2
quantitation to compare to libraries generated by RNase P
quantitation. QC1 was not chosen for the library preparation
comparison due to its similar quantitation values to RNase P. For
the QC2 and RNase P comparison 17 samples were chosen based on
their Dscore (ratio of the concentration of QC1 divided by the
concentration of QC2) for NDS library prep and divided into 3
categories: i) ‘High integrity DNA’ with Dscores ranging from 0.95
to 1.50 which were expected to generate libraries with similar or
better yields than libraries constructed based on the corresponding
RNase P quantitation; ii) ‘Rescue samples’ with high concentrations
by RNase P (>10 ng/μl) and low concentrations of QC2 (<10
ng/μl) which were suspected to perform poorly when using RNase P
concentrations and perform better with QC2 quantitation; and iii)
‘Poor integrity DNA’ with high Dscores (>4) or no expression for
QC2 which were expected to perform poorly with both quantitation
methods, but show greater yields for QC2 based libraries compared
to libraries based on than RNase P. For the DS1, DS2 and RNase P
comparison 11 samples were initially chosen based on their range of
Dscore (the ratio of the concentration of DS1 divided by the
concentration of DS2). After the initial 11 samples, 25 additional
samples were prepared based on DS1 and RNase P for comparison.
Results
Comparison of DNA quantitation by
PicoGreen vs. TaqMan RNase P
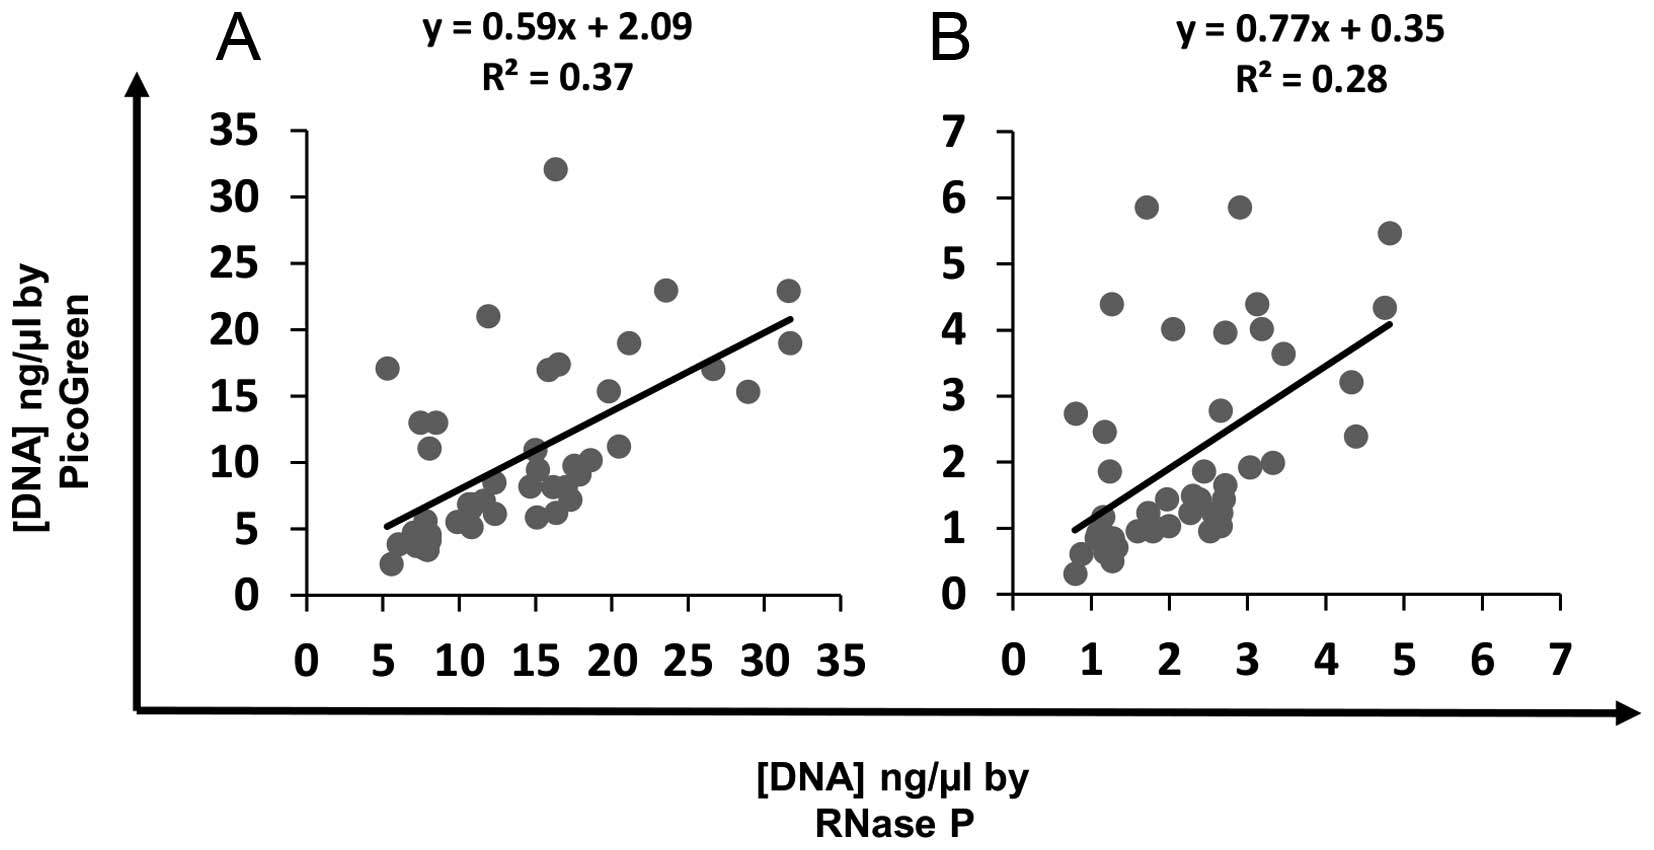
PicoGreen on average, quantified DNA samples at
lower concentrations compared to TaqMan RNase P quantitation. There
was a weak correlation between DNA concentrations by PicoGreen and
RNase P, for stock DNA (Fig. 2A;
slope=0.59; R2=0.37) and 1:5 diluted DNA samples
(Fig. 2B; slope=0.77;
R2=0.28). The DNA concentration measured by RNase P was
on average 1.41- and 1.58-fold higher than measured by fluorometry
for both the 1:5 dilution and stock DNA FFPE tissue specimens,
respectively.
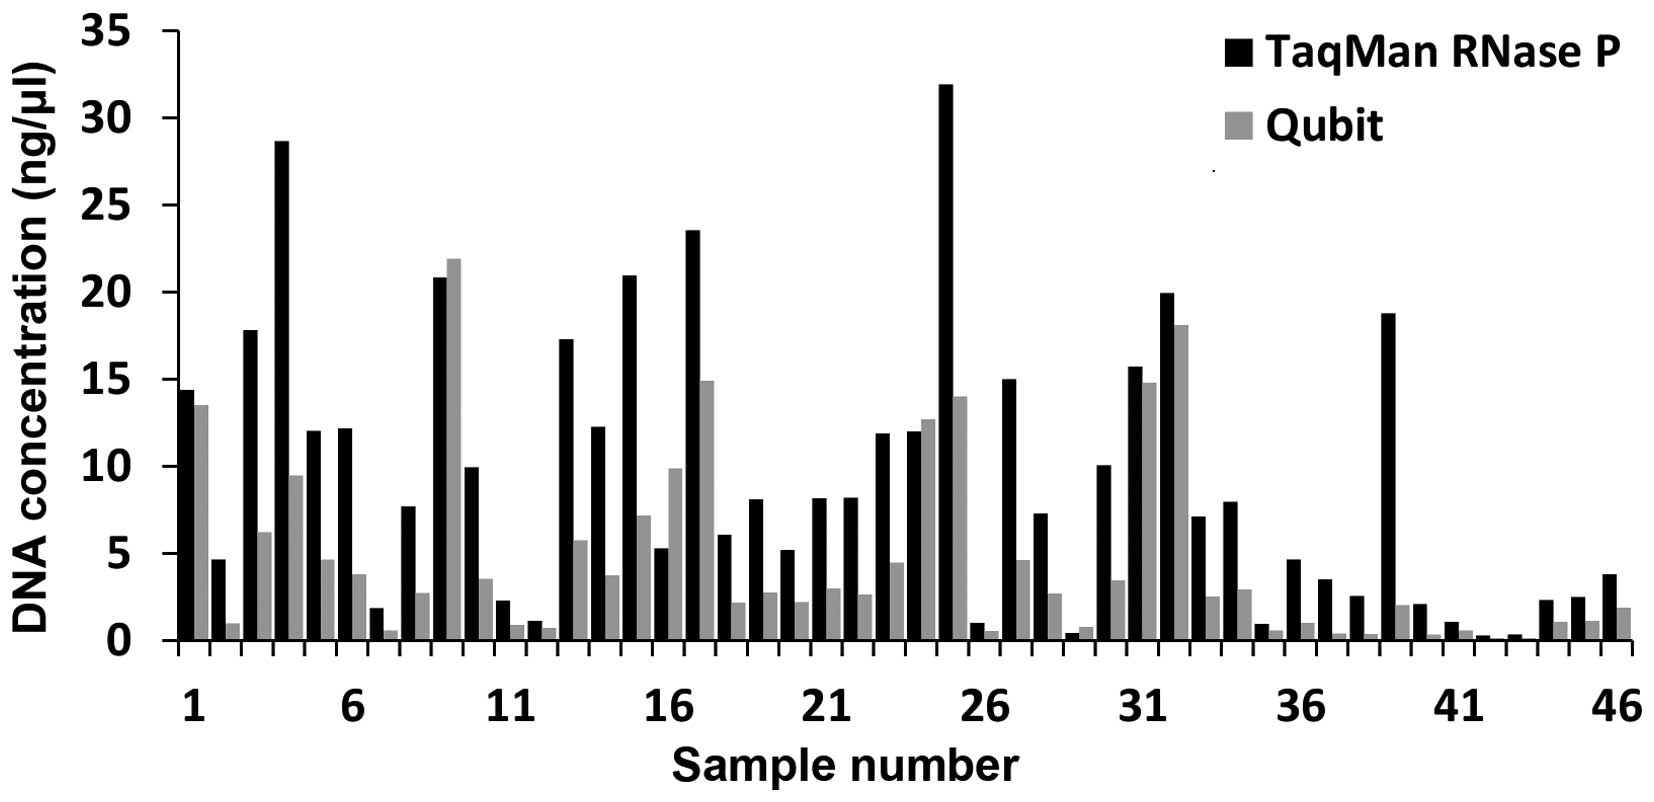
Comparison of DNA quantitation by Qubit
vs. TaqMan RNase P
In agreement with the data observed in the PicoGreen
comparison against TaqMan RNase P assay, the DNA was consistently
under quantified by Qubit fluorometry compared to RNase P. On
average the DNA concentration measured by RNase P was 2.88 times
greater than the concentration measured by Qubit, but the fold
change ranged from 0.53 to 9.24 times greater (Fig. 3).
Comparison of DNA quantitation by
in-house duplex TaqMan vs. TaqMan RNase P
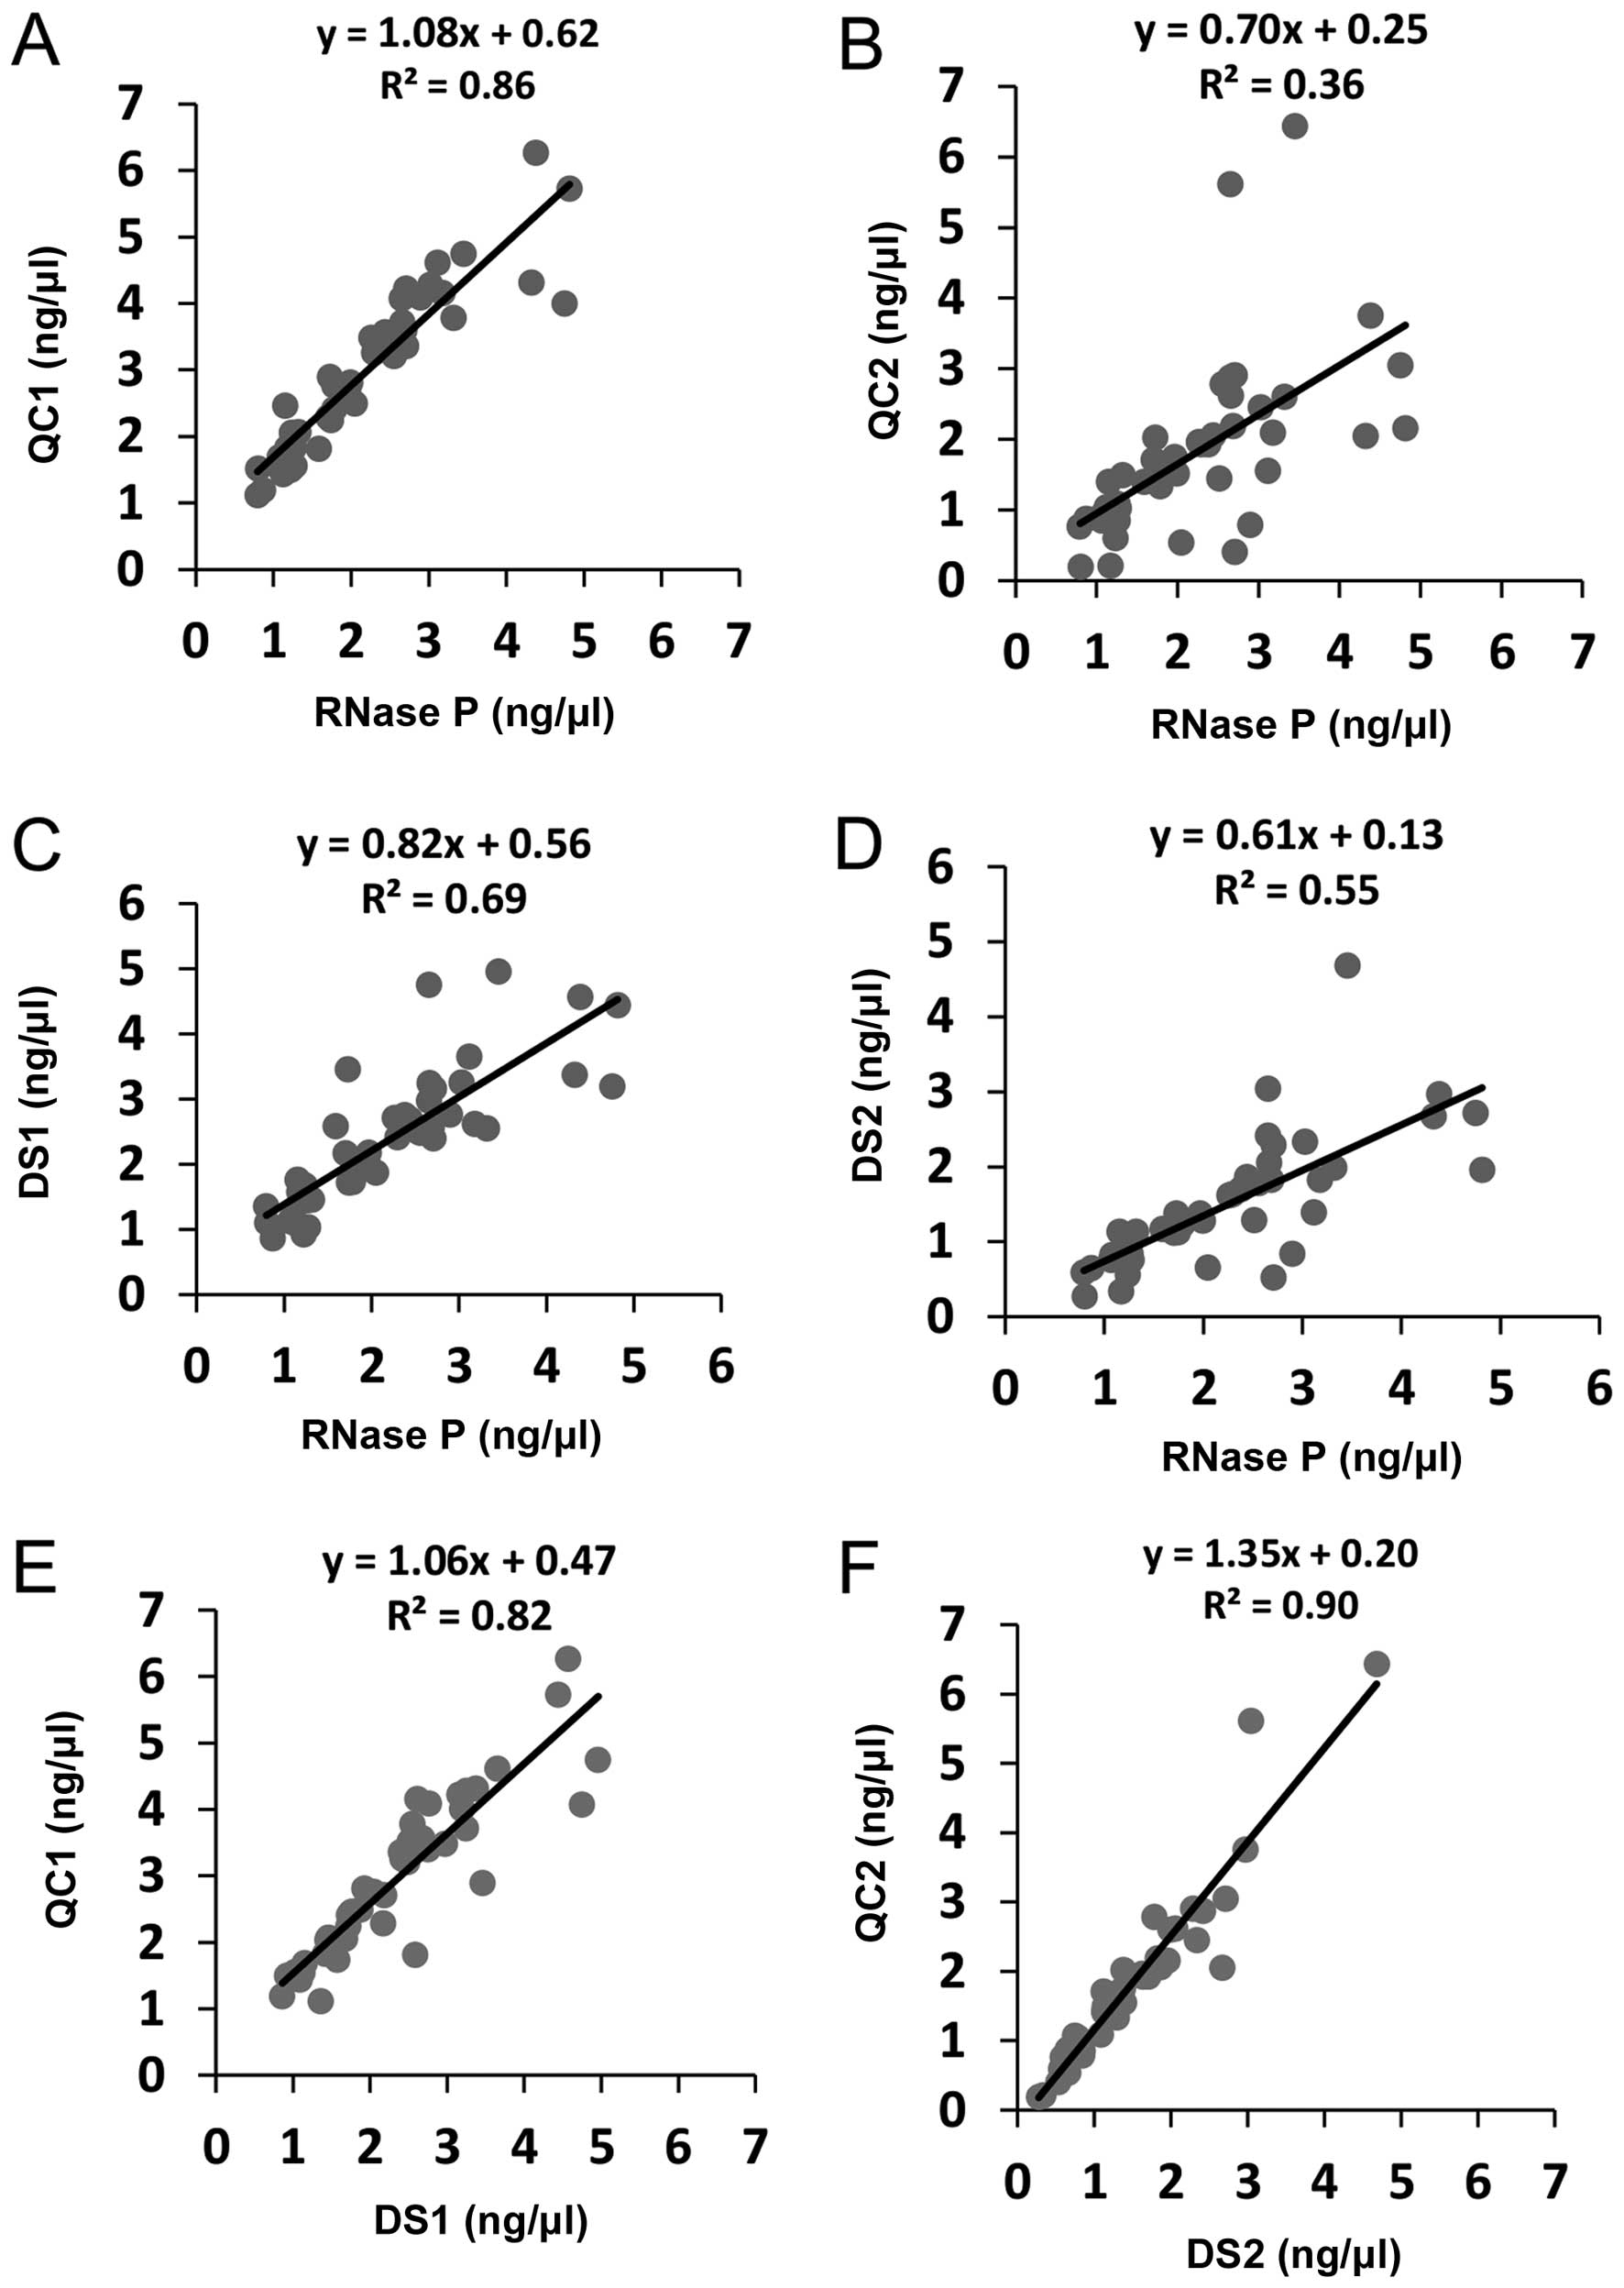
The DNA concentration measured by QC1 (TaqMan small
amplicon) and by TaqMan RNase P, showed a very strong correlation
(slope=1.08; R2=0.86; Fig.
4A), while the data obtained by QC2 (large amplicon) showed
weak correlation, with an important deviation in the slope, in the
TaqMan RNase P-values (slope=0.70; R2=0.36; Fig. 4B). QC1 consistently quantified DNA
at slightly higher concentrations than TaqMan RNase P, while QC2
under quantified when compared to RNase P. On average the DNA
concentration measured by RNase P was 0.73 less than QC1 and 1.62
times greater than QC2.
Comparison of DNA quantitation by
in-house duplex SYBR-Green qPCR vs. TaqMan RNase P
The DNA concentration by DS1 (small amplicon) was on
average 1.13-fold higher than by TaqMan RNase P although their
correlation proved to be very strong (slope=0.82;
R2=0.69; Fig. 4C). On
other hand, RNase P measurements were on average 1.70 times greater
than the concentration measured by DS2, with moderate correlation
(slope=0.61; R2=0.55; Fig.
4D).
Comparison of DNA quantitation by
in-house duplex TaqMan vs. in-house duplex SYBR-Green qPCR
The DNA concentration measured by TaqMan QC1 and by
SYBR DS1, showed a very strong correlation (slope=1.06;
R2=0.82; Fig. 4E).
TaqMan QC1 quantified DNA at higher concentrations than SYBR DS1.
On average the DNA concentration measured by QC1 was 1.29 times
greater than DS1. Likewise, the DNA concentration measured by
TaqMan QC2 and by SYBR DS2, showed a very strong correlation
(slope=1.35; R2=0.90; Fig.
4F) and TaqMan QC2 quantified DNA at slightly higher
concentrations than SYBR DS2. On average the DNA concentration
measured by QC2 was 1.18 times greater than DS2.
Frozen DNA evaluation with the in-house
duplex SYBR-Green qPCR compared to FFPE DNA evaluation with
in-house duplex SYBR-Green qPCR
On average, the DNA extracted from 26 frozen lung
cancer tissue provided higher yield compared to DNA derived from
FFPE tissue and lower Dscores. The average DS1 concentration for
fresh-frozen DNA was 21.59 ng/μl, while the average DS1
concentration of FFPE DNA was 1.15 ng/μl. The average Dscore for
frozen DNA was 1.07, while the FFPE DNA averaged 2.34 (data not
shown).
Comparison of FFPE DNA extraction methods
using in-house duplex SYBR-Green qPCR
FFPE DNA extracted using a column based purification
method showed similar yield and Dscores to the FFPE DNA extracted
using the method without purification when quantified with the
in-house SYBR-Green qPCR assay. The FFPE DNA using a column based
purification had an average DS1 concentration of 4.94 ng/μl and an
average Dscore of 1.48. When the same tissue samples were extracted
using the method without purification the average DS1 concentration
was 4.58 ng/μl and the average Dscore was 1.18 (data not
shown).
Library preparation comparison of duplex
TaqMan to TaqMan RNase P
Samples with Dscores between 0.95 and 1.50,
categorized as ‘High integrity DNA’ samples, produced similar
library yields of targeted fragments of NGS libraries, both for
RNase P (10,009.90 pM) and QC2 (9,922.60 pM) input methods. Three
of the 4 ‘high integrity DNA’ samples showed greater yields for
libraries using input based on QC2 compared to library yields using
input based on RNase P (Table
I).
 | Table ILibrary yields for libraries prepped
with input based on TaqMan RNase P and TaqMan QC2. |
Table I
Library yields for libraries prepped
with input based on TaqMan RNase P and TaqMan QC2.
| Sample
category | Sample no. | Library yield by
input method (pM) |
|---|
|
|---|
| RNase P | QC2 |
|---|
| High integrity
DNA | 1 | 11,340.00 | 12,450.20 |
| High integrity
DNA | 2 | 10,791.70 | 6,661.90 |
| High integrity
DNA | 3 | 9,479.40 | 10,613.80 |
| High integrity
DNA | 4 | 8,428.50 | 9,964.50 |
| Rescue sample | 5 | 8,192.40 | 9,191.60 |
| Rescue sample | 6 | 10,124.70 | 9,997.10 |
| Rescue sample | 7 | 9,608.30 | 7,981.90 |
| Rescue sample | 8 | 6,824.40 | 9,133.50 |
| Rescue sample | 9 | 8,106.30 | 3,035.20 |
| Poor integrity
DNA | 10 | 5,521.80 | 2,075.50 |
| Poor integrity
DNA | 11 | 4,835.40 | 409.37 |
| Poor integrity
DNA | 12 | 3,426.10 | 1,017.20 |
| Poor integrity
DNA | 13 | 3,676.80 | 1,526.20 |
| Poor integrity
DNA | 14 | 3,604.90 | 6,304.10 |
| Poor integrity
DNA | 15 | 1,753.80 | 134.8 |
| Poor integrity
DNA | 16 | 2,597.10 | 1,595.50 |
| Poor integrity
DNA | 17 | 3,576.10 | 53.80 |
The NGS libraries in three out of five samples
categorized as ‘Rescue samples’, were more productive than those
prepared based on QC2. The mean library yields for ‘Rescue samples’
were 8,571.22 and 7,867.86 pM for input based on RNase P and QC2,
respectively (Table I).
The sample categorized as ‘Poor integrity DNA’
samples, with high Dscores (>4) or no Cq value for QC2 amplicon,
had greater yields with RNase P inputs compared to libraries made
using QC2 input values. The mean library yields for ‘Poor integrity
DNA’ samples were 3,624.00 and 1,639.56 pM input based on RNase P
and QC2, respectively. Only 1 of the 8 ‘Poor integrity DNA’ samples
showed greater yields for libraries based on QC2 compared to 7 of 8
showing greater yields for libraries based on RNase P (Table I).
Comparison of library preparation of
SYBR-Green DS1 and DS2 to TaqMan RNase P
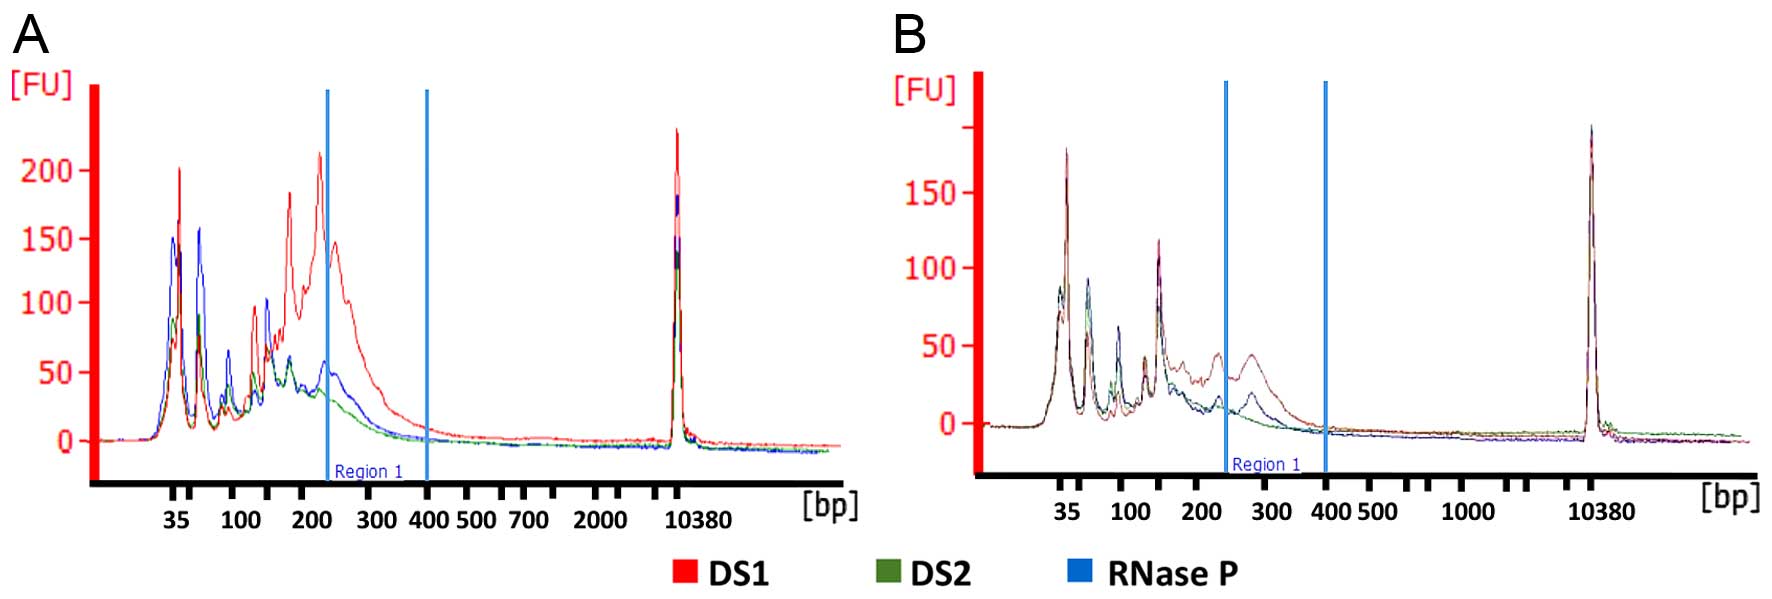
NGS libraries made based on DS2 quantification, had
the lowest yields, while DS1 based libraries showed similar or
greater yields for most samples when compared to libraries using
quantitation by RNase P (Fig. 5
and Table II). The average
library yields for the initial 11 samples based on inputs using the
DS1 quantitation values was 3,609.47 pM. When the same samples were
used to prepare NGS libraries based on the quantitation values from
DS2 and RNase P, the average yields were 1,773.60 and 1,196.51 pM,
respectively. Ten of the 11 samples showed greater yields for DS1
compared to DS2 and RNase P (Table
II).
| Table IILibrary yields for libraries prepped
with input based on DS1, DS2 and TaqMan RNase P. |
Table II
Library yields for libraries prepped
with input based on DS1, DS2 and TaqMan RNase P.
| Sample ID | Library yield by
input method (pM) |
|---|
|
|---|
| RNase P | DS1 | DS2 |
|---|
| 1 | 542.4 | 1291.6 | 306.5 |
| 2 | 1970.4 | 1376.8 | 1525 |
| 3 | 4637.7 | 10905.7 | 2155.4 |
| 4 | 704.5 | 1943.3 | 357.7 |
| 5 | 1230.1 | 1816.3 | 439.8 |
| 6 | 1378.1 | 2422.2 | 620.1 |
| 7 | 2881.4 | 4330.8 | 1047.8 |
| 8 | 1625.3 | 4161.4 | 1371.5 |
| 9 | 2475.6 | 5397 | 3246.6 |
| 10 | 52.2 | 1500.9 | 79.8 |
| 11 | 2011.9 | 4558.2 | 2011.4 |
| 12 | 7553.3 | 8535.1 | N/A |
| 13 | 6594.6 | 8391.7 | N/A |
| 14 | 3859.7 | 2578.1 | N/A |
| 15 | 6461.3 | 9272.6 | N/A |
| 16 | 4096.4 | 5847.4 | N/A |
| 17 | 8079.7 | 11336.4 | N/A |
| 18 | 3144.1 | 3582.5 | N/A |
| 19 | 2485.2 | 3836.4 | N/A |
| 20 | 3064.1 | 4629.1 | N/A |
| 21 | 2461.1 | 3446.5 | N/A |
| 22 | 2027.3 | 3462.8 | N/A |
| 23 | 4126.9 | 6945.8 | N/A |
| 24 | 3235.3 | 5278.9 | N/A |
| 25 | 3190.4 | 6423.3 | N/A |
| 26 | 3180.9 | 2834 | N/A |
| 27 | 2500.8 | 4047.5 | N/A |
| 28 | 11203.5 | 5380.5 | N/A |
| 29 | 5465.8 | 7226.6 | N/A |
| 30 | 4961.2 | 3737.4 | N/A |
| 31 | 5029.3 | 6090.5 | N/A |
| 32 | 2502.7 | 3450.3 | N/A |
| 33 | 2913.3 | 4478 | N/A |
| 34 | 3742.7 | 6940.8 | N/A |
| 35 | 3309.1 | 5378.1 | N/A |
| 36 | 2818.1 | 4009.1 | N/A |
The average library yields for the additional 25
samples used to prepare NGS libraries based on DS1 and RNase P were
5,485.58 and 4,320.27 pM, respectively (Table II). Twenty-two of the 25 samples
showed higher yields when prepared with DS1 inputs compared to the
corresponding library prepared with RNase P based inputs. Of the
total 36 libraries made with quantitation based on DS1 and RNase P,
DS1 provided the greatest yields for 32 out of the 36 samples
tested (89%), while RNase P quantitation input method provided the
greatest yields in 4 out of the 36 samples (11%). Examples of the
targeted NGS library preparation results from high and medium-bad
quality of DNA are shown in Fig.
5.
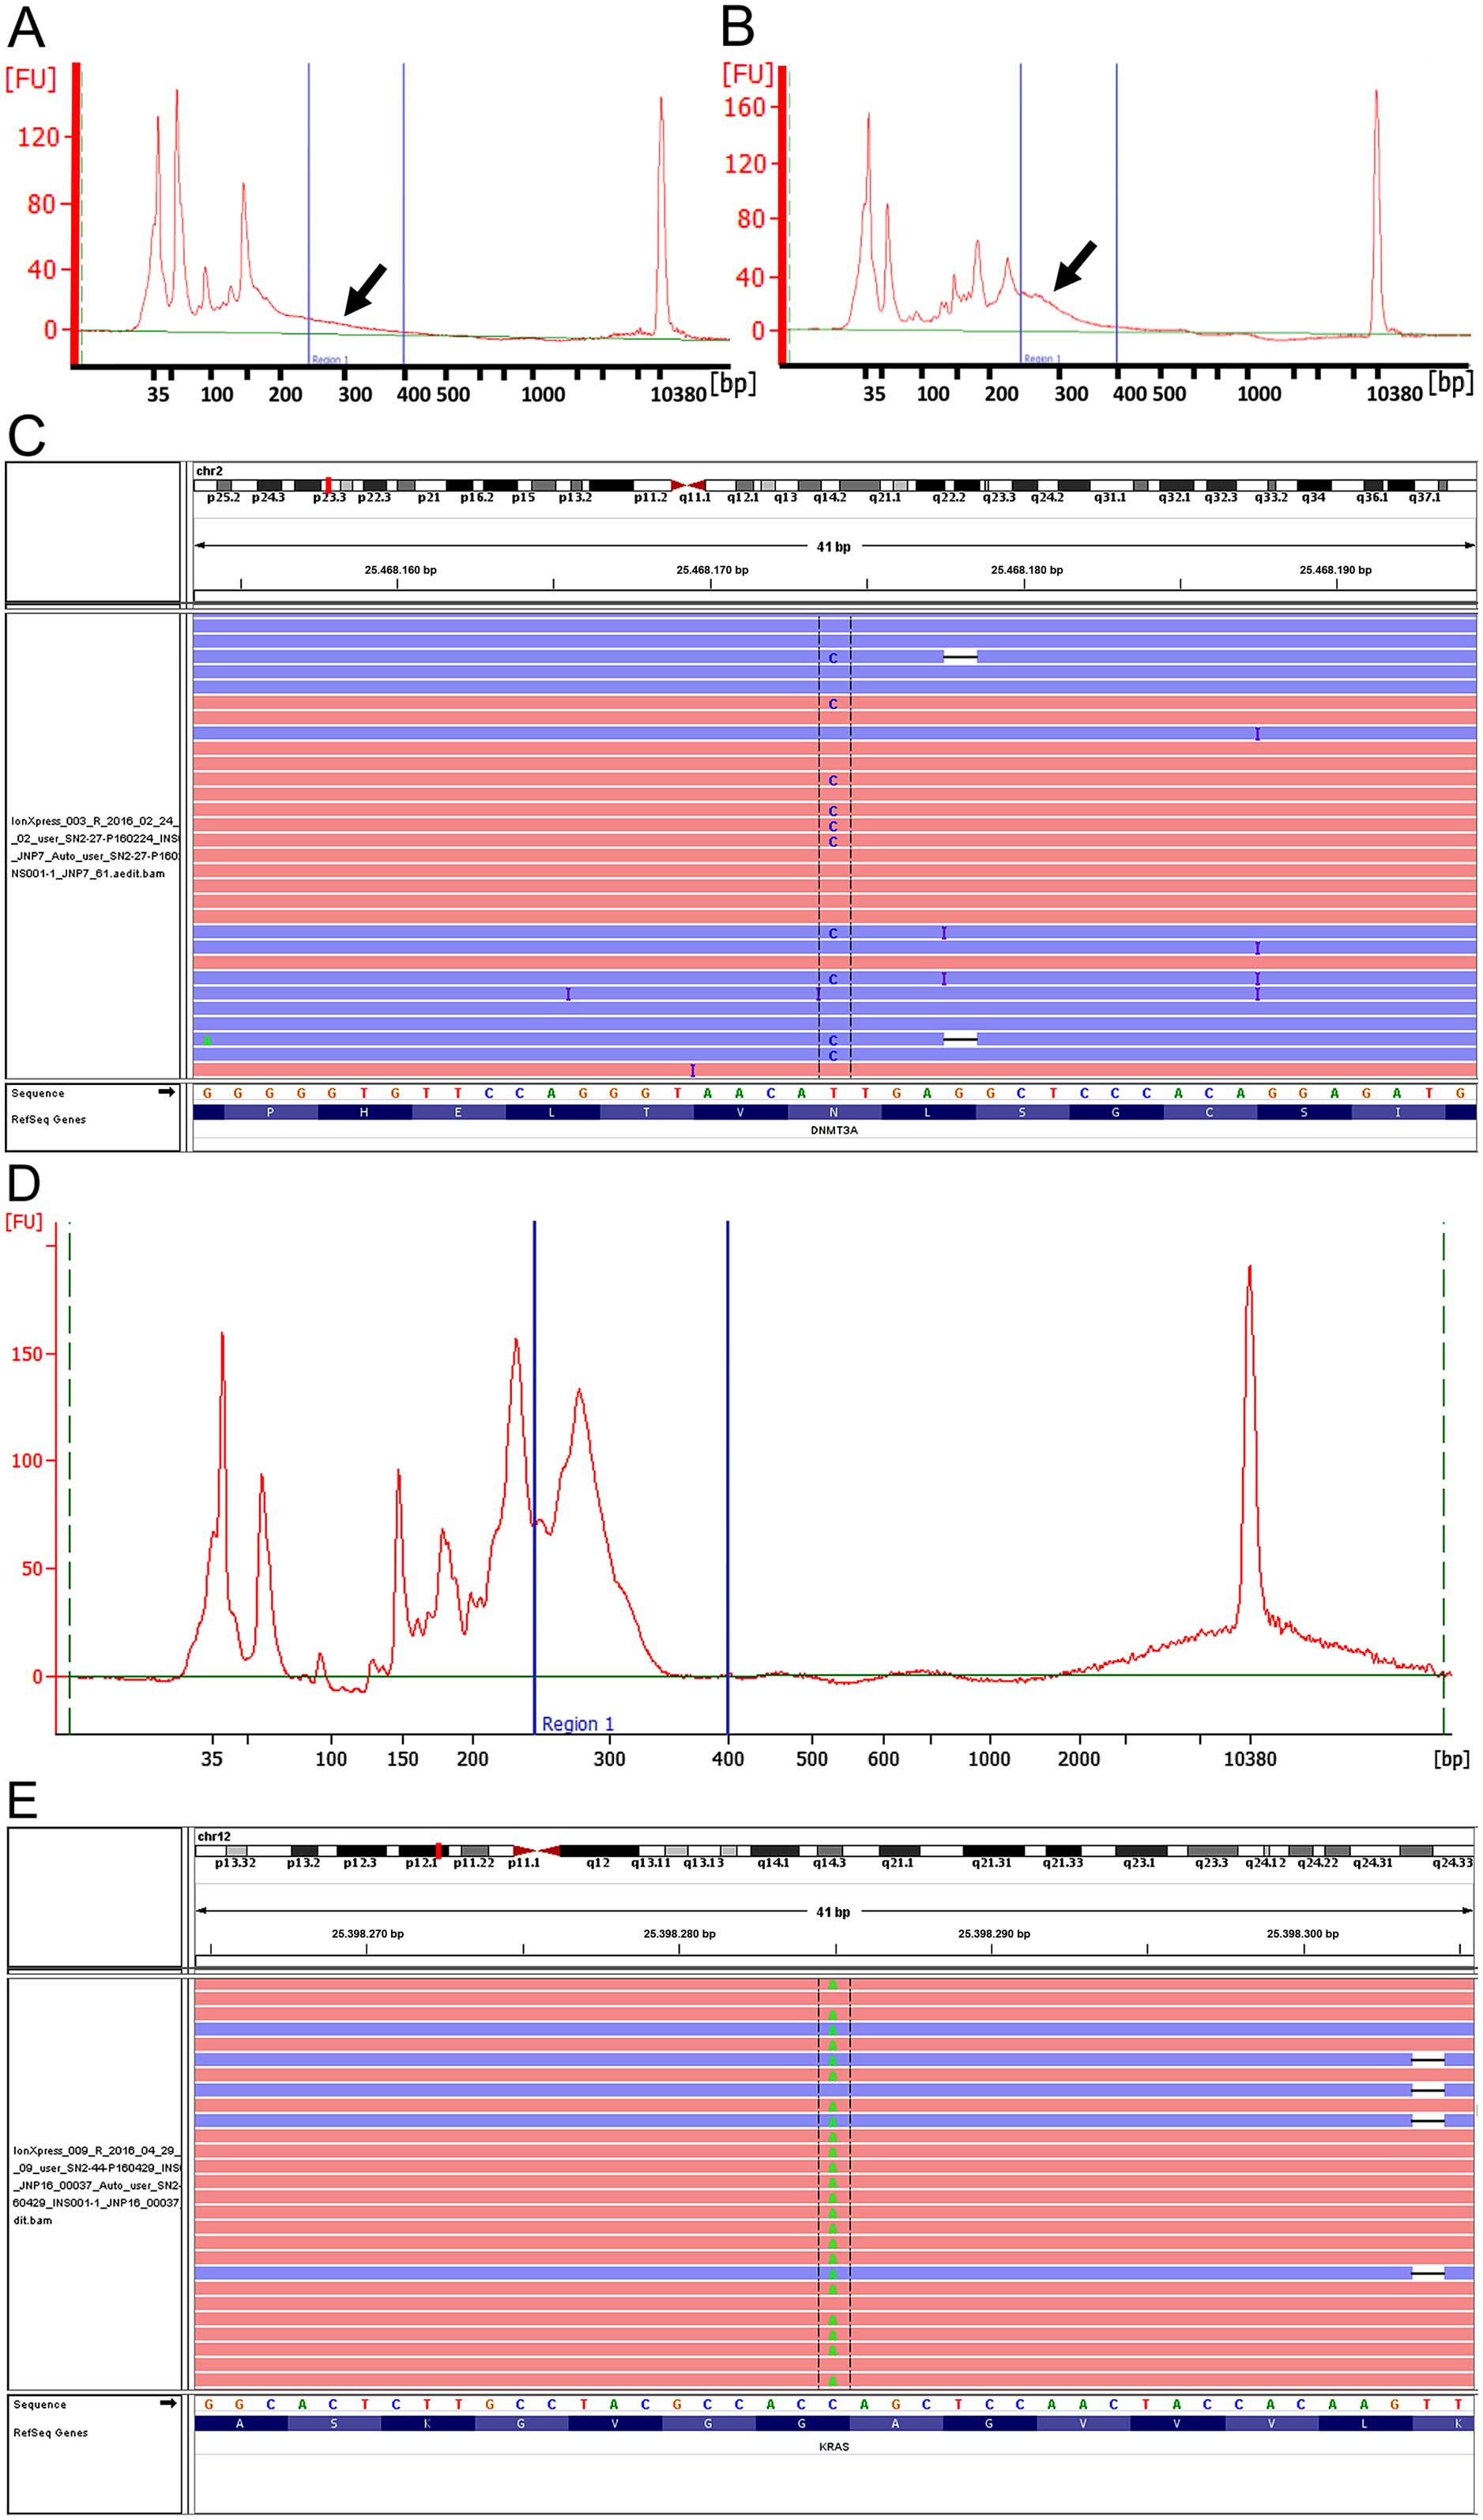
Clinical significance
Using the dual-primer pair SYBR-Green qPCR assay to
quantify and assess quality of FFPE DNA we were able to obtain
sequencing data and mutation results for a clinical sample taken
from a gastric mass indicated as upper GI/pancreaticobiliary
adenocarcinoma (clinical P12) that would not have been possible
using a single primer quantitation method. The concentration of
sample P12 quantified by DS1 was 7.20 and 0.03 ng/μl by DS2. The
ratio of DS1 to DS2 generated a Dscore of 226.67. NGS libraries
were prepared by using 10 ng input based on DS1 concentration and
by using the maximum input possible (5 μl of stock DNA), due to the
low concentration of DS2 and the degradation indicated by the high
Dscore. The library prep performed based on the DS1 concentration
quantified at 444.09 pM for the target library products (Fig. 6A). The library prep performed with
the maximum input of 5 μl of stock DNA quantified was 1,174.9 pM
for the library target regions (Fig.
6B). Sequencing of the maximum DNA input library revealed four
mutations including two non-synonymous mutations MAP2K1
p.F53V and DNMT3A p.N501S (Fig.
6C and Table III). Fig. 6D and E show library yield and
non-synonymous mutation KRAS p.G12C found in sample P37.
| Table IIISequencing result mutation report for
clinical sample P12. |
Table III
Sequencing result mutation report for
clinical sample P12.
| Gene symbol | Cosmic ID | CDS mutation | Amino acid
mutation | Chromosome | Mutation reads | Wild-type
reads | Mutation Allele
Freq. |
|---|
| MAP2K1 | COSM1562837 | c.158T>G | p.F53V | chr15 | 213 | 1301 | 14.0687 |
| DNMT3A | COSM231571 | c.1502A>G | p.N501S | chr2 | 1349 | 2147 | 38.587 |
| HRAS | COSM249860 | c.81T>C | p.H27H | chr11 | 2811 | 2068 | 57.6143 |
| EGFR | COSM1451600 | c.2361G>A | p.Q787Q | chr7 | 4208 | 6 | 99.8576 |
Discussion
We initially considered six DNA measurement methods
for targeted NGS. In addition to four methods tested in the present
study, UV spectrophotometer (i.e. NanoDrop) and a chip-based
capillary electrophoresis (i.e. Agilent Bioanalyzer) were initially
considered, but not selected for this testing. UV spectrophotometer
is the easiest and cheapest method among all and would be ideal if
it provided accurate results. However, in our previous testing, the
measured DNA amount was significantly overestimated causing a high
NGS library failure rate or lower library amplification rate due to
a small amount of DNA input (data not shown). This is not
surprising because it is known that UV spectrophotometers measure
all components that absorb within the designated wavelength ranges
(20,30). Thus, it is not recommended to use a
UV spectrophotometer for assessing DNA quantity for NGS analyses
especially for challenging clinical samples. The Bioanalyzer may be
a gold standard for RNA quantity and quality measurement for
transcriptome sequencing (RNAseq) or gene expression microarray
(31). The RNA integrity number
(RIN) provided by Bioanalyzer is regarded as a standard for quality
assessment of RNA (31). We also
use this method for checking the NGS library quality and quantity
as it provides not only quantity, but also size and quality pattern
(6,7). As targeted NGS library preparation
using amplification involves a ligation step of adaptors or
barcodes to the amplified DNA, it is critical to see the correct
size and the pattern of ligated products. For this purpose, the
Bioanalyzer is powerful and would be one of the best methods for
NGS library quality check (6,7).
However, we did not select this method for DNA quality and quantity
assessment for targeted NGS. First, it requires multiple
experimental steps and takes relatively longer experimental time.
Second, its cost is also higher than other methods. Third, the
throughput with a regular Bioanalyzer is limited to 11 samples
excluding the ladder control per run. As our goal for developing
DNA quality and quantity assessment method is to make a highly
accurate and easy-to-use assay with a reasonably low cost, we
excluded UV spectrophotometer and Bioanalyzer and tested four
remaining methods against TaqMan RNase P as a control
reference.
First, we tested PicoGreen fluorometry using FFPE
clinical samples and compared the results with TaqMan RNase P
assay. We tested FFPE DNA with around 0.5–35 ng/μl concentration
and found a strong correlation between the two methods
(R2=0.37; Fig. 2A).
Then we further tested 1:5 diluted DNAs in order to check whether a
small amount of DNA from clinical samples can be correctly repeated
and found worse correlation (R2=0.28; Fig. 2B).
Another test using a Qubit® fluorometry
using a similar approach with PicoGreen method showed a generally
lower DNA concentration compared to those from RNase P TaqMan
(Fig. 3). This is somewhat
surprising as TaqMan detects only ‘amplifiable’ or ‘functionally
intact’ DNAs while Qubit fluorometer method detects bulk dsDNA
(Fig. 3).
Next, we tested dual-probe qPCR system using frozen
and FFPE clinical samples. The goal of using two qPCR probes is to
measure degradation degree of DNA and provide better and more
accurate quantitation depending on the degradation status. We
thoroughly searched and investigated the TCGA copy number data to
identify the regions and genes showing no or least amplified or
deleted in various cancers and identified three loci, 22q12.3,
14q24.1 and 15q24.3. We designed probes targeting two amplicons
with different size for both TaqMan and SYBR-Green chemistries.
Clinical FFPE samples were tested by TaqMan (Fig. 4A and B) and SYBR-Green (Fig. 4C and D) methods. Quantification
based on small amplicons in both platforms (Fig. 4A and C) showed strong correlations
with RNase P data. Clinical frozen samples were tested with
SYBR-Green method. The frozen DNA yield compared to the yield of
the FFPE DNA was higher. The Dscore of the frozen DNA samples
indicated high quality intact DNA as expected from the frozen
sample type. We also compared a small set of samples from two
different FFPE DNA extraction methods with the SYBR-Green assay.
The extraction method did not affect the average DS1 or Dscore
results. This suggests the SYBR-Green method is suitable assessment
of DNA from various extraction methods.
We then made targeted NGS libraries based on TaqMan
RNase P and TaqMan QC2 quantification methods with the clinical
FFPE DNA samples. TaqMan QC2 quantification did not generate
libraries with greater yields than libraries made using TaqMan
RNase P quantification (Table I).
This suggests that QC2 is not a suitable indicator of DNA
quantitation for library preparation.
We then made targeted NGS libraries based on three
quantification methods, TaqMan RNase P, SYBR-Green DS1 (small
amplicon), and SYBR-Green DS2 (large amplicon) (Fig. 5). One high quality DNA (Fig. 5A) and a relatively degraded and low
quality of DNA (Fig. 5B) were used
for targeted NGS library preparation. There was a big difference
between SYBR-Green DS1-based quantification and others for the
library ligation efficiency in a high quality of DNA (Fig. 5A) while a relatively smaller but
still better ligation efficiency was found in SYBR-Green DS1-based
quantification in a low quality sample (Fig. 5B). This suggests that our designed
SYBR-Green DS1-based DNA quantification provides a good indication
for a various range of DNA samples in term of their quality. The
additional 34 FFPE samples with different Dscores (degradation
degrees, D=DS1/DS2) were tested and showed similar results as shown
in Table I.
Next, we identified one clinical sample, with a very
high DNA degradation, requested for targeted NGS analysis in a
clinical laboratory. This sample (P12) had a Dscore of 226.67
suggesting a very high degradation and poor quality of DNA. In
order to maximize the ligation efficiency, two different library
preparations were processed based on two DNA quantifications. First
is the original DS1-based quantification (Fig. 6A) and the other is 3.6-times more
DNA input based on the extremely high Dscore on this sample
(Fig. 6B). As shown in Fig. 6A, almost nothing was found in the
targeted size range in the original quantification without
considering Dscore or DNA degradation degree. However, by
considering the DNA degradation degree and adding more DNA, a
better and improved ligation efficiency was obtained (Fig. 6B). The subsequent sequencing of the
increased DNA library preparation was done well, satisfying our
standard and QC step (Fig. 6C).
This indicates the usefulness of Dscore by calculating DNA
quantification in two different sizes of amplicons. Samples with
high Dscore (high degradation) may need to be considered for a
different NGS ligation preparation protocol such as higher input
DNA or different amplification condition or ligation condition.
In summary, we tested four different DNA
quantification methods and compared them with RNase P TaqMan assay
to identify the best DNA analysis method for targeted NGS library
preparation. We concluded that SYBR-Green-based qPCR assay provides
accurate results in a cost effective way for DNA quantification for
NGS analyses. Our dual probe qPCR assay also provides a DNA
degradation ratio so that NGS library preparation can be optimized
based on the degradation status.
Acknowledgements
The present study was supported in part by funds
from the Thoracic Oncology Laboratory at University of California
San Francisco (UCSF) and CureSeq Inc.
References
|
1
|
Bennett ST, Barnes C, Cox A, Davies L and
Brown C: Toward the 1,000 dollars human genome. Pharmacogenomics.
6:373–382. 2005. View Article : Google Scholar : PubMed/NCBI
|
|
2
|
Hillier LW, Marth GT, Quinlan AR, Dooling
D, Fewell G, Barnett D, Fox P, Glasscock JI, Hickenbotham M, Huang
W, et al: Whole-genome sequencing and variant discovery in C.
elegans. Nat Methods. 5:183–188. 2008. View Article : Google Scholar : PubMed/NCBI
|
|
3
|
Parsons DW, Jones S, Zhang X, Lin JC,
Leary RJ, Angenendt P, Mankoo P, Carter H, Siu IM, Gallia GL, et
al: An integrated genomic analysis of human glioblastoma
multiforme. Science. 321:1807–1812. 2008. View Article : Google Scholar : PubMed/NCBI
|
|
4
|
Shah SP, Morin RD, Khattra J, Prentice L,
Pugh T, Burleigh A, Delaney A, Gelmon K, Guliany R, Senz J, et al:
Mutational evolution in a lobular breast tumour profiled at single
nucleotide resolution. Nature. 461:809–813. 2009. View Article : Google Scholar : PubMed/NCBI
|
|
5
|
Fang LT, Lee S, Choi H, Kim HK, Jew G,
Kang HC, Chen L, Jablons D and Kim IJ: Comprehensive genomic
analyses of a metastatic colon cancer to the lung by whole exome
sequencing and gene expression analysis. Int J Oncol. 44:211–221.
2014.
|
|
6
|
Kang HC, Kim HK, Lee S, Mendez P, Kim JW,
Woodard G, Yoon JH, Jen KY, Fang LT, Jones K, et al: Whole exome
and targeted deep sequencing identify genome-wide allelic loss and
frequent SETDB1 mutations in malignant pleural mesotheliomas.
Oncotarget. 7:8321–8331. 2016.PubMed/NCBI
|
|
7
|
Mendez P, Dang J, Kim JW, Lee S, Yoon JH,
Kim T, Sailey CJ, Jablons DM and Kim IJ: Comprehensive evaluation
and validation of targeted next-generation sequencing performance
in two clinical laboratories. Int J Oncol. 49:235–242.
2016.PubMed/NCBI
|
|
8
|
Hadd AG, Houghton J, Choudhary A, Sah S,
Chen L, Marko AC, Sanford T, Buddavarapu K, Krosting J, Garmire L,
et al: Targeted, high-depth, next-generation sequencing of cancer
genes in formalin-fixed, paraffin-embedded and fine-needle
aspiration tumor specimens. J Mol Diagn. 15:234–247. 2013.
View Article : Google Scholar : PubMed/NCBI
|
|
9
|
Han SW, Kim HP, Shin JY, Jeong EG, Lee WC,
Lee KH, Won JK, Kim TY, Oh DY, Im SA, et al: Targeted sequencing of
cancer-related genes in colorectal cancer using next-generation
sequencing. PLoS One. 8:e642712013. View Article : Google Scholar : PubMed/NCBI
|
|
10
|
Cancer Genome Atlas Research Network.
Comprehensive genomic characterization defines human glioblastoma
genes and core pathways. Nature. 455:1061–1068. 2008. View Article : Google Scholar : PubMed/NCBI
|
|
11
|
Kandoth C, McLellan MD, Vandin F, Ye K,
Niu B, Lu C, Xie M, Zhang Q, McMichael JF, Wyczalkowski MA, et al:
Mutational landscape and significance across 12 major cancer types.
Nature. 502:333–339. 2013. View Article : Google Scholar : PubMed/NCBI
|
|
12
|
Brennan CW, Verhaak RG, McKenna A, Campos
B, Noushmehr H, Salama SR, Zheng S, Chakravarty D, Sanborn JZ,
Berman SH, et al; TCGA Research Network. The somatic genomic
landscape of glioblastoma. Cell. 155:462–477. 2013. View Article : Google Scholar : PubMed/NCBI
|
|
13
|
Bass AJ, Thorsson V, Shmulevich I,
Reynolds SM, Miller M, Bernard B, Hinoue T, Laird PW, Curtis C,
Shen H, et al; Cancer Genome Atlas Research Network. Comprehensive
molecular characterization of gastric adenocarcinoma. Nature.
513:202–209. 2014. View Article : Google Scholar :
|
|
14
|
Imielinski M, Berger AH, Hammerman PS,
Hernandez B, Pugh TJ, Hodis E, Cho J, Suh J, Capelletti M,
Sivachenko A, et al: Mapping the hallmarks of lung adenocarcinoma
with massively parallel sequencing. Cell. 150:1107–1120. 2012.
View Article : Google Scholar : PubMed/NCBI
|
|
15
|
Ng SB, Turner EH, Robertson PD, Flygare
SD, Bigham AW, Lee C, Shaffer T, Wong M, Bhattacharjee A, Eichler
EE, et al: Targeted capture and massively parallel sequencing of 12
human exomes. Nature. 461:272–276. 2009. View Article : Google Scholar : PubMed/NCBI
|
|
16
|
Choi M, Scholl UI, Ji W, Liu T, Tikhonova
IR, Zumbo P, Nayir A, Bakkaloğlu A, Ozen S, Sanjad S, et al:
Genetic diagnosis by whole exome capture and massively parallel DNA
sequencing. Proc Natl Acad Sci USA. 106:19096–19101. 2009.
View Article : Google Scholar : PubMed/NCBI
|
|
17
|
Ng SB, Buckingham KJ, Lee C, Bigham AW,
Tabor HK, Dent KM, Huff CD, Shannon PT, Jabs EW, Nickerson DA, et
al: Exome sequencing identifies the cause of a mendelian disorder.
Nat Genet. 42:30–35. 2010. View
Article : Google Scholar :
|
|
18
|
Gawad C, Koh W and Quake SR: Single-cell
genome sequencing: Current state of the science. Nat Rev Genet.
17:175–188. 2016. View Article : Google Scholar : PubMed/NCBI
|
|
19
|
de Bourcy CF, De Vlaminck I, Kanbar JN,
Wang J, Gawad C and Quake SR: A quantitative comparison of
single-cell whole genome amplification methods. PLoS One.
9:e1055852014. View Article : Google Scholar : PubMed/NCBI
|
|
20
|
Nielsen K, Mogensen HS, Hedman J,
Niederstätter H, Parson W and Morling N: Comparison of five DNA
quantification methods. Forensic Sci Int Genet. 2:226–230. 2008.
View Article : Google Scholar : PubMed/NCBI
|
|
21
|
Navarro E, Serrano-Heras G, Castano MJ and
Solera J: Real-time PCR detection chemistry. Clin Chim Acta.
439:231–250. 2015. View Article : Google Scholar
|
|
22
|
Singer VL, Jones LJ, Yue ST and Haugland
RP: Characterization of PicoGreen reagent and development of a
fluorescence-based solution assay for double-stranded DNA
quantitation. Anal Biochem. 249:228–238. 1997. View Article : Google Scholar : PubMed/NCBI
|
|
23
|
Robin JD, Ludlow AT, LaRanger R, Wright WE
and Shay JW: Comparison of DNA quantification methods for next
generation sequencing. Sci Rep. 6:240672016. View Article : Google Scholar : PubMed/NCBI
|
|
24
|
White RA III, Blainey PC, Fan HC and Quake
SR: Digital PCR provides sensitive and absolute calibration for
high throughput sequencing. BMC Genomics. 10:1162009. View Article : Google Scholar : PubMed/NCBI
|
|
25
|
Panaro NJ, Yuen PK, Sakazume T, Fortina P,
Kricka LJ and Wilding P: Evaluation of DNA fragment sizing and
quantification by the agilent 2100 bioanalyzer. Clin Chem.
46:1851–1853. 2000.PubMed/NCBI
|
|
26
|
Arya M, Shergill IS, Williamson M,
Gommersall L, Arya N and Patel HR: Basic principles of real-time
quantitative PCR. Expert Rev Mol Diagn. 5:209–219. 2005. View Article : Google Scholar : PubMed/NCBI
|
|
27
|
Buh Gasparic M, Tengs T, La Paz JL,
Holst-Jensen A, Pla M, Esteve T, Zel J and Gruden K: Comparison of
nine different real-time PCR chemistries for qualitative and
quantitative applications in GMO detection. Anal Bioanal Chem.
396:2023–2029. 2010. View Article : Google Scholar : PubMed/NCBI
|
|
28
|
Vogelstein B, Papadopoulos N, Velculescu
VE, Zhou S, Diaz LA Jr and Kinzler KW: Cancer genome landscapes.
Science. 339:1546–1558. 2013. View Article : Google Scholar : PubMed/NCBI
|
|
29
|
Karro JE, Yan Y, Zheng D, Zhang Z,
Carriero N, Cayting P, Harrrison P and Gerstein M: Pseudogene.org:
A comprehensive database and comparison platform for pseudogene
annotation. Nucleic Acids Res. 35:Database. D55–D60. 2007.
View Article : Google Scholar
|
|
30
|
Bhat S, Curach N, Mostyn T, Bains GS,
Griffiths KR and Emslie KR: Comparison of methods for accurate
quantification of DNA mass concentration with traceability to the
international system of units. Anal Chem. 82:7185–7192. 2010.
View Article : Google Scholar : PubMed/NCBI
|
|
31
|
Kim IJ, Quigley D, To MD, Pham P, Lin K,
Jo B, Jen KY, Raz D, Kim J, Mao JH, et al: Rewiring of human lung
cell lineage and mitotic networks in lung adenocarcinomas. Nat
Commun. 4:17012013. View Article : Google Scholar : PubMed/NCBI
|