Introduction
Cancer is a genomic disease harboring a cocktail of
mutated genes. Personalized medicine approaches based on molecular
studies and cytogenetic analysis can treat with therapies directly
on mutated cancer driving genes (1–4). For
example, crizotinib (PF-02341066), a small-molecular inhibitor of
the anaplastic lymphoma kinase (ALK), and kinase inhibitor
vemurafenib (PLX4032) against BRAF (5–7),
both have dramatic effects on most patients with corresponding
driver mutations. In fact, hundreds of frequent somatic mutations,
which involved in multiple cellular pathways, have been identified
in different types of cancer during the past decades (8), and more comprehensive diagnostic
approaches are needed to identify the individual driver mutations
which have important impact on tumor progression in different
cancer patients (9) and thus,
could serve as therapeutic targets in clinical treatment. To assess
the status of these biomarkers, several approaches have been
implemented in clinical diagnosis, such as fluorescence in
situ hybridization (FISH), immunohistochemistry (IHC) and
Sanger methodology (10–13). However, due to the high cost and
technical limitations, it is unaffordable to do the multiplexed
assessment of driving somatic alterations.
NGS has already been used to identify hundreds of
driving mutations and analyze tens of thousands of tumor samples in
a high-throughput with increased performance and decreased costs
(14–16), which makes it possible to serve as
a clinical testing approach. In reality, commercial NGS-based
assays have already been developed and validated to provide
comprehensive genomic test in clinic (17–20).
These assays usually have a good performance when detecting
variants with high mutant allele frequencies (MAF >10%).
However, variants with low MAF usually appear in tumor tissues for
many reasons, including contaminating normal cells and intra-tumor
heterogeneity (21,22). Therefore, it is critical to develop
a robust clinical assay that can detect low allele frequency
mutations. Here we developed an ultra-high sensitive NGS-based
assay, which interrogates all 7011 exons of 483 cancer-related
genes and 94 introns of 18 genes with re-arrangement. Using the
Illumina HiSeq X platform, hybridization-based capture of target
regions reached a high-coverage (>2000X) with acceptable cost.
With in-house data analysis approaches, we could identify low MAF
(0.5%) variants from sequencing error accurately. We used pools of
mixed cell lines with known alterations to perform analytical
validation, and 35 FFPE tissue samples to confirm the specificity
of low MAF variants detection performance in clinic by dPCR
(23). In addition, ARMS-PCR
(24) was used to confirm the
overall specificity of our assay.
Materials and methods
NCP NGS design
Novo assay was developed to characterize SNV/INDEL,
CNV and gene fusion in 483 cancer-related genes. These genes were
selected based on My Cancer Genome database (https://www.mycancergenome.org), Catalogue of Somatic
Mutations in Cancer (COSMIC) and other sources (18,25).
Briefly, genes containing clinically important variants and genes
have been reported as cancer-related were included based on a
record of reimbursement in sequencing. All exons of these genes
were considered which underwent hybridization-based capture from
483 cancer-related genes (Table
I). For structural rearrangements detection, introns spanning
recurrent fusion breakpoints were also included. Agilent's
proprietary algorithm and synthetic process was used to generate
the baits. The hybrid selection was done using a pool of 120-mer
RNA-based baits (Agilent SureSelect) with overlap excess 3-fold for
target region. All 47660 hybrid baits for catching target region
constitute 2.3 Mb genomic positions, including 7011 exons and 94
introns.
 | Table IGenes and transcripts ID targeted in
hybridization capture. |
Table I
Genes and transcripts ID targeted in
hybridization capture.
| Gene symbol | Transcripts ID | Gene symbol | Transcripts ID | Gene symbol | Transcripts ID |
|---|
| ABCB1 | NM_000927 | ETV6 | NM_001987 | NUP93 | NM_001242796 |
| ABCC1 | NM_004996 | EWSR1 | NM_001163287 | PAK1 | NM_001128620 |
| ABCC2 | NM_000392 | EZH2 | NM_001203248 | PAK3 | NM_001128173 |
| ABCC4 | NM_001105515 | FAM46C | NM_017709 | PALB2 | NM_024675 |
| ABCC6 | NM_001079528 | FANCA | NM_001018112 | PARP1 | NM_001618 |
| ABCG2 | NM_004827 | FANCC | NM_001243744 | PARP2 | NM_001042618 |
| ABL1 | NM_005157 | FANCD2 | NM_033084 | PAX5 | NM_001280551 |
| ACVR1B | NM_020327 | FANCE | NM_021922 | PBRM1 | NM_018313 |
| AKT1 | NM_005163 | FANCF | NM_022725 | PDCD1 | NM_005018 |
| AKT2 | NM_001243027 | FANCG | NM_004629 | PDGFRA | NM_006206 |
| AKT3 | NM_005465 | FANCL | NM_001114636 | PDGFRB | NM_002609 |
| ALK | NM_004304 | FBXW7 | NM_001257069 | PDK1 | NM_002610 |
| AMER1 | NM_152424 | FCGR3A | NM_001127595 | PHF6 | NM_032335 |
| APC | NM_000038 | FGF10 | NM_004465 | PHKA2 | NM_000292 |
| AR | NM_001011645 | FGF14 | NM_004115 | PIGF | NM_002643 |
| ARAF | NM_001256197 | FGF19 | NM_005117 | PIK3CA | NM_006218 |
| ARFRP1 | NM_001267546 | FGF23 | NM_020638 | PIK3CB | NM_001256045 |
| ARID1A | NM_139135 | FGF3 | NM_005247 | PIK3CG | NM_002649 |
| ARID1B | NM_020732 | FGF4 | NM_002007 | PIK3R1 | NM_001242466 |
| ARID2 | NM_152641 | FGF6 | NM_020996 | PIK3R2 | NM_005027 |
| ASXL1 | NM_001164603 | FGFR1 | NM_001174064 | PLK1 | NM_005030 |
| ATIC | NM_004044 | FGFR2 | NM_001144919 | PPARD | NM_177435 |
| ATM | NM_000051 | FGFR3 | NM_000142 | PPP1R13L | NM_001142502 |
| ATP7A | NM_000052 | FGFR4 | NM_022963 | PPP2R1A | NM_014225 |
| ATR | NM_001184 | FGR | NM_001042729 | PRDM1 | NM_182907 |
| ATRX | NM_000489 | FKBP1A | NM_054014 | PRDX4 | NM_006406 |
| AURKA | NM_198435 | FLT1 | NM_001160031 | PRKAA1 | NM_206907 |
| AURKB | NM_001256834 | FLT3 | NM_004119 | PRKAR1A | NM_002734 |
| AXIN1 | NM_003502 | FLT4 | NM_002020 | PRKCA | NM_002737 |
| AXL | NM_001278599 | FOXL2 | NM_023067 | PRKCB | NM_002738 |
| B2M | NM_004048 | FRK | NM_002031 | PRKCE | NM_005400 |
| BAIAP3 | NM_001199096 | FUBP1 | NM_003902 | PRKCG | NM_002739 |
| BAP1 | NM_004656 | FYN | NM_153048 | PRKDC | NM_006904 |
| BARD1 | NM_000465 | FZD7 | NM_003507 | PRRT2 | NM_001256443 |
| BCL2 | NM_000657 | GALNT14 | NM_001253827 | PTCH1 | NM_001083607 |
| BCL2L2 | NM_001199839 | GATA1 | NM_002049 | PTEN | NM_000314 |
| BCL6 | NM_001706 | GATA2 | NM_001145662 | PTK2 | NM_001199649 |
| BCOR | NM_017745 | GATA3 | NM_002051 | PTK6 | NM_001256358 |
| BCORL1 | NM_021946 | GCK | NM_033508 | PTPN11 | NM_080601 |
| BCR | NM_004327 | GID4 | NM_024052 | PTPRD | NM_130391 |
| BIRC5 | NM_001168 | GINS2 | NM_016095 | RAC2 | NM_002872 |
| BLK | NM_001715 | GNA11 | NM_002067 | RAD50 | NM_005732 |
| BLM | NM_000057 | GNA13 | NM_001282425 | RAD51 | NM_001164270 |
| BRAF | NM_004333 | GNAQ | NM_002072 | RAF1 | NM_002880 |
| BRCA1 | NM_007297 | GNAS | NM_016592 | RARA | NM_001024809 |
| BRCA2 | NM_000059 | GPC3 | NM_001164619 | RB1 | NM_000321 |
| BRIP1 | NM_032043 | GPR124 | NM_032777 | RET | NM_020630 |
| BSG | NM_001728 | GRIN2A | NM_001134408 | RICTOR | NM_001285440 |
| BTK | NM_000061 | GSK3B | NM_001146156 | RMDN2 | NM_001170793 |
| C11orf30 | NM_020193 | GSTM1 | NM_000561 | RNF43 | NM_017763 |
| C18orf56 | NM_001012716 | GSTM3 | NM_000849 | ROCK1 | NM_005406 |
| C8orf34 | NM_001195639 | GSTP1 | NM_000852 | ROS1 | NM_002944 |
| CAMK2G | NM_001204492 | GSTT1 | NM_000853 | RPL13 | NM_033251 |
| CAMKK2 | NM_172215 | H3F3A | NM_002107 | RPS6KA1 | NM_001006665 |
| CARD11 | NM_032415 | HCK | NM_001172132 | RPS6KB1 | NM_001272044 |
| CASP8 | NM_033356 | HGF | NM_001010934 | RPTOR | NM_001163034 |
| CBFB | NM_001755 | HIF1AN | NM_017902 | RRM1 | NM_001033 |
| CBL | NM_005188 | HIST1H3B | NM_003537 | RUNX1 | NM_001122607 |
| CBR1 | NM_001757 | HNF1A | NM_000545 | SDHA | NM_004168 |
| CBR3 | NM_001236 | HRAS | NM_005343 | SDHAF1 | NM_001042631 |
| CCND1 | NM_053056 | HSP90AA1 | NM_005348 | SDHAF2 | NM_017841 |
| CCND2 | NM_001759 | IDH1 | NM_005896 | SDHB | NM_003000 |
| CCND3 | NM_001136126 | IDH2 | NM_002168 | SDHC | NM_003001 |
| CCNE1 | NM_001238 | IGF1 | NM_001111285 | SDHD | NM_001276506 |
| CCR4 | NM_005508 | IGF1R | NM_000875 | SETD2 | NM_014159 |
| CD19 | NM_001770 | IGF2 | NM_000612 | SF3B1 | NM_001005526 |
| CD22 | NM_001185100 | IGF2R | NM_000876 | SGK1 | NM_005627 |
| CD274 | NM_001267706 | IKBKB | NM_001556 | SHH | NM_000193 |
| CD33 | NM_001177608 | IKBKE | NM_001193322 | SIK1 | NM_173354 |
| CD38 | NM_001775 | IKZF1 | NM_001220768 | SKP2 | NM_005983 |
| CD3EAP | NM_012099 | IL7R | NM_002185 | SLC10A2 | NM_000452 |
| CD52 | NM_001803 | INHBA | NM_002192 | SLC15A2 | NM_001145998 |
| CD74 | NM_004355 | INSR | NM_001079817 | SLC22A1 | NM_153187 |
| CD79A | NM_001783 | IRF4 | NM_001195286 | SLC22A16 | NM_033125 |
| CD79B | NM_000626 | IRS2 | NM_003749 | SLC22A2 | NM_003058 |
| CDA | NM_001785 | ITK | NM_005546 | SLC22A6 | NM_153277 |
| CDC73 | NM_024529 | JAK1 | NM_002227 | SLCO1B1 | NM_006446 |
| CDH1 | NM_004360 | JAK2 | NM_004972 | SLCO1B3 | NM_019844 |
| CDK1 | NM_001170407 | JAK3 | NM_000215 | SMAD2 | NM_001135937 |
| CDK12 | NM_016507 | JUN | NM_002228 | SMAD4 | NM_005359 |
| CDK2 | NM_001798 | KAT6A | NM_001099413 | SMARCA4 | NM_001128845 |
| CDK4 | NM_000075 | KDM5A | NM_001042603 | SMARCB1 | NM_003073 |
| CDK5 | NM_001164410 | KDM5C | NM_001146702 | SMO | NM_005631 |
| CDK6 | NM_001259 | KDM6A | NM_021140 | SOCS1 | NM_003745 |
| CDK7 | NM_001799 | KDR | NM_002253 | SOD2 | NM_000636 |
| CDK8 | NM_001260 | KEAP1 | NM_012289 | SOX10 | NM_006941 |
| CDK9 | NM_001261 | KIT | NM_000222 | SOX2 | NM_003106 |
| CDKN1B | NM_004064 | KITLG | NM_003994 | SOX9 | NM_000346 |
| CDKN2A | NM_001195132 | KLC3 | NM_177417 | SPEN | NM_015001 |
| CDKN2B | NM_078487 | KLHL6 | NM_130446 | SPG7 | NM_199367 |
| CDKN2C | NM_078626 | KMT2A | NM_001197104 | SPOP | NM_003563 |
| CEBPA | NM_001285829 | KMT2B | NM_014727 | SRC | NM_198291 |
| CHEK1 | NM_001274 | KMT2C | NM_170606 | SRD5A2 | NM_000348 |
| CHEK2 | NM_001257387 | KMT2D | NM_003482 | SRMS | NM_080823 |
| CHST3 | NM_004273 | KRAS | NM_033360 | STAG2 | NM_006603 |
| CIC | NM_015125 | LCK | NM_001042771 | STAT1 | NM_139266 |
| COMT | NM_007310 | LIMK1 | NM_001204426 | STAT2 | NM_005419 |
| CREBBP | NM_004380 | LMO1 | NM_002315 | STAT3 | NM_003150 |
| CRKL | NM_005207 | LRP1B | NM_018557 | STAT4 | NM_003151 |
| CRLF2 | NM_022148 | LRP2 | NM_004525 | STAT5A | NM_003152 |
| CSF1R | NM_005211 | LYN | NM_002350 | STAT5B | NM_012448 |
| CSK | NM_001127190 | MAP2K1 | NM_002755 | STAT6 | NM_001178080 |
| CSNK1A1 | NM_001271742 | MAP2K2 | NM_030662 | STEAP1 | NM_012449 |
| CTCF | NM_001191022 | MAP2K4 | NM_003010 | STK11 | NM_000455 |
| CTLA4 | NM_001037631 | MAP3K1 | NM_005921 | STK3 | NM_006281 |
| CTNNA1 | NM_001903 | MAP4K4 | NM_145687 | STK4 | NM_006282 |
| CTNNB1 | NM_001904 | MAP4K5 | NM_198794 | SUFU | NM_001178133 |
| CYBA | NM_000101 | MAPK1 | NM_138957 | SULT1A1 | NM_177534 |
| CYLD | NM_001042412 | MAPK10 | NM_138981 | SULT1A2 | NM_001054 |
| CYP19A1 | NM_000103 | MAPK14 | NM_139013 | SULT1C4 | NM_006588 |
| CYP1A1 | NM_000499 | MAPK8 | NM_002750 | SYK | NM_001174167 |
| CYP1A2 | NM_000761 | MAPK9 | NM_001135044 | TCF7L1 | NM_031283 |
| CYP1B1 | NM_000104 | MAPKAPK2 | NM_004759 | TCF7L2 | NM_001198525 |
| CYP2A6 | NM_000762 | MARK1 | NM_001286129 | TEK | NM_000459 |
| CYP2B6 | NM_000767 | MCL1 | NM_001197320 | TET2 | NM_017628 |
| CYP2C19 | NM_000769 | MDM2 | NM_001278462 | TGFBR1 | NM_004612 |
| CYP2C8 | NM_001198853 | MDM4 | NM_001278516 | TGFBR2 | NM_003242 |
| CYP2C9 | NM_000771 | MED12 | NM_005120 | TK1 | NM_003258 |
| CYP2D6 | NM_001025161 | MEF2B | NM_001145785 | TMPRSS2 | NM_005656 |
| CYP2E1 | NM_000773 | MEN1 | NM_130803 | TNF | NM_000594 |
| CYP3A4 | NM_001202855 | MERTK | NM_006343 | TNFAIP3 | NM_006290 |
| CYP3A5 | NM_001190484 | MET | NM_001127500 | TNFRSF10A | NM_003844 |
| CYP4B1 | NM_000779 | MITF | NM_001184968 | TNFRSF10B | NM_003842 |
| DAXX | NM_001254717 | MKNK2 | NM_199054 | TNFRSF14 | NM_003820 |
| DDR1 | NM_001202523 | MLH1 | NM_001167617 | TNFRSF8 | NM_001243 |
| DDR2 | NM_001014796 | MPL | NM_005373 | TNFSF11 | NM_003701 |
| DNMT1 | NM_001130823 | MRE11A | NM_005590 | TNFSF13B | NM_001145645 |
| DNMT3A | NM_153759 | MS4A1 | NM_152866 | TNK2 | NM_005781 |
| DOT1L | NM_032482 | MSH2 | NM_000251 | TOP1 | NM_003286 |
| DPYD | NM_001160301 | MSH6 | NM_001281494 | TP53 | NM_001276698 |
| DSCAM | NM_001389 | MST1R | NM_001244937 | TPMT | NM_000367 |
| E2F1 | NM_005225 | MTDH | NM_178812 | TPX2 | NM_012112 |
| EGF | NM_001178131 | MTHFR | NM_005957 | TSC1 | NM_001162426 |
| EGFL7 | NM_201446 | MTOR | NM_004958 | TSC2 | NM_000548 |
| EGFR | NM_201283 | MTRR | NM_002454 | TSHR | NM_001018036 |
| EGR1 | NM_001964 | MUTYH | NM_001048174 | TYMS | NM_001071 |
| EMC8 | NM_001142288 | MYC | NM_002467 | TYRO3 | NM_006293 |
| EML4 | NM_019063 | MYCL | NM_005376 | U2AF1 | NM_001025204 |
| ENOSF1 | NM_001126123 | MYCN | NM_005378 | UBE2I | NM_194259 |
| EP300 | NM_001429 | MYD88 | NM_001172566 | UGT1A1 | NM_000463 |
| EPHA1 | NM_005232 | NAT1 | NM_001160174 | UGT1A9 | NM_021027 |
| EPHA2 | NM_004431 | NAT2 | NM_000015 | UGT2B15 | NM_001076 |
| EPHA3 | NM_182644 | NCAM1 | NM_001076682 | UGT2B17 | NM_001077 |
| EPHA4 | NM_004438 | NCF4 | NM_013416 | UGT2B7 | NM_001074 |
| EPHA5 | NM_001281767 | NCOA3 | NM_001174088 | UMPS | NM_000373 |
| EPHA7 | NM_004440 | NCOR1 | NM_001190438 | VEGFA | NM_001171627 |
| EPHA8 | NM_001006943 | NEK11 | NM_145910 | VEGFB | NM_003377 |
| EPHB1 | NM_004441 | NF1 | NM_001128147 | VHL | NM_000551 |
| EPHB2 | NM_004442 | NF2 | NM_181830 | WEE1 | NM_001143976 |
| EPHB3 | NM_004443 | NFE2L2 | NM_001145413 | WISP3 | NM_198239 |
| EPHX1 | NM_000120 | NFKBIA | NM_020529 | WNK3 | NM_020922 |
| ERBB2 | NM_004448 | NKX2-1 | NM_003317 | WT1 | NM_001198552 |
| ERBB3 | NM_001005915 | NOS3 | NM_001160111 | XPC | NM_001145769 |
| ERBB4 | NM_005235 | NOTCH1 | NM_017617 | XPO1 | NM_003400 |
| ERCC1 | NM_202001 | NOTCH2 | NM_001200001 | XRCC1 | NM_006297 |
| ERCC2 | NM_001130867 | NPM1 | NM_001037738 | XRCC4 | NM_022406 |
| ERG | NM_001136155 | NQO1 | NM_000903 | YES1 | NM_005433 |
| ESR1 | NM_000125 | NRAS | NM_002524 | ZAP70 | NM_207519 |
| ETV1 | NM_001163151 | NTRK1 | NM_002529 | ZC3HAV1 | NM_024625 |
| ETV4 | NM_001261439 | NTRK2 | NM_001007097 | ZNF217 | NM_006526 |
| ETV5 | NM_004454 | NTRK3 | NM_001007156 | ZNF703 | NM_025069 |
|
| Genes targeted for
rearrangement detection |
|
| Gene symbol | Transcripts ID | Gene symbol | Transcripts ID | Gene symbol | Transcripts ID |
|
| ALK | NM_004304 | ETV6 | NM_001987 | MYC | NM_002467 |
| BCR | NM_004327 | EWSR1 | NM_001163287 | NTRK1 | NM_002529 |
| BRAF | NM_004333 | KMT2A | NM_001197104 | PDGFRA | NM_006206 |
| EGFR | NM_201283 | RAF1 | NM_002880 | ROS1 | NM_002944 |
| ETV1 | NM_001163151 | RARA | NM_001024809 | CRLF2 | NM_022148 |
| ETV4 | NM_001261439 | RET | NM_020630 | | |
| ETV5 | NM_004454 | TMPRSS2 | NM_005656 | | |
Clinical specimens
Tumor specimens were collected from non-small cell
lung cancer (NSCLC) and breast cancer patients at Chinese PLA
General Hospital with informed consent according to the internal
Review and rules of Ethics. In the very beginning of this assay,
clinical samples should match several standards as follows to
ensure downstream analysis. At least 10 slices of 5 μm FFPE
sections or tissues with a volume of >1 was required. For each
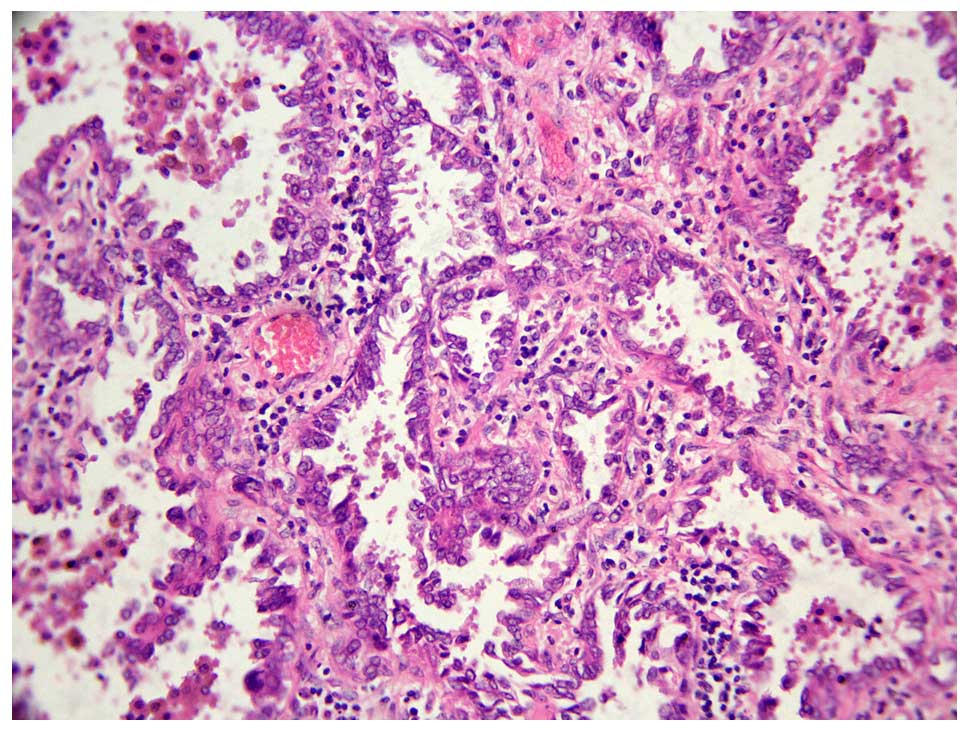
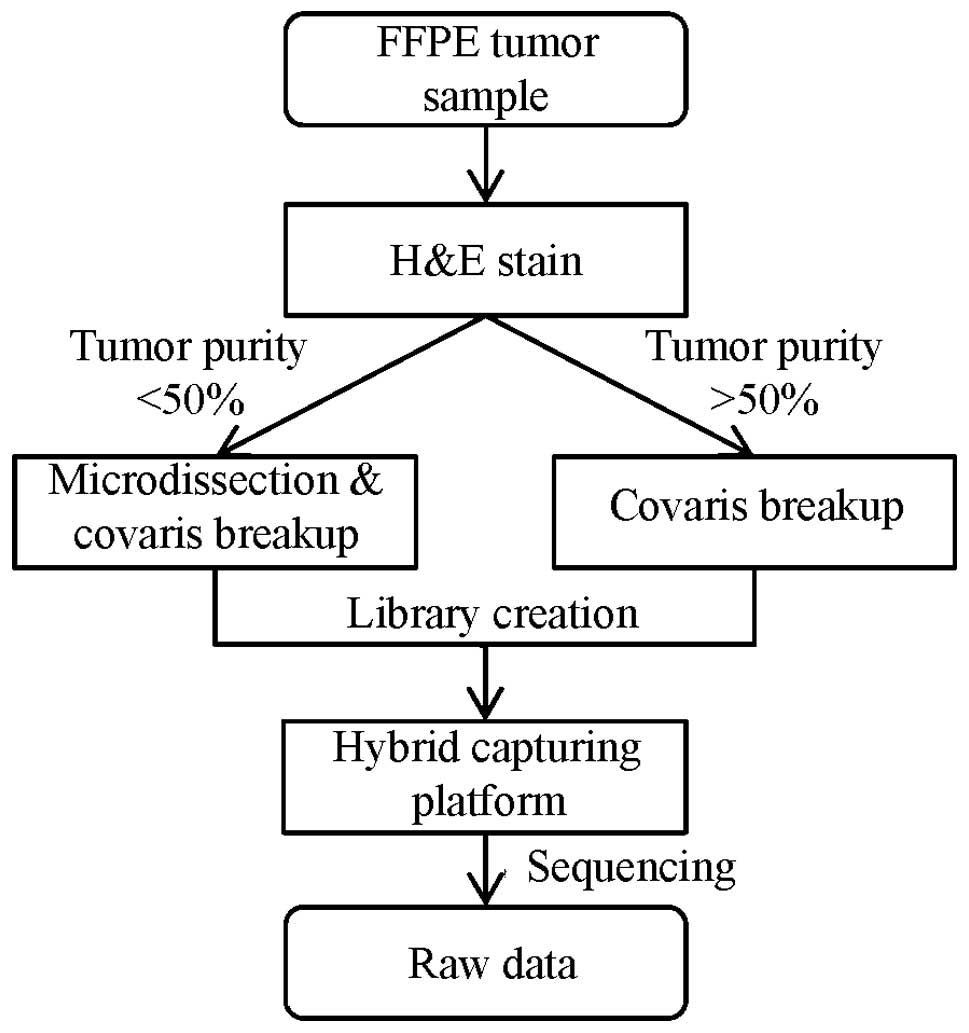
sample, hematoxylin-eosin stained slides (Fig. 1) were prepared and reviewed by a
pathologist to estimate tumor purity. All samples with <50%
tumor purity were marked for tumor enrichment by microdis-section
to minimize contamination from normal cells (Fig. 2).
Cell line sample collection
Normal cell lines harboring the population
distribution of known germ line variants were mixed, and
multiplexed pools with low MAF variants were used to assess and
validate the limit of variant detection. First of all, to get the
variants set for assessment, we sequenced 5 cell lines from the
1000 Genomes Project (26)
individually and got the SNP and INDEL sites from dbSNP database
(build 146) consistent with a homozygous (MAF >90%) or
heterozygous (40%<MAF<60%). To estimate the INDEL detection
performance, 3 additional cell lines from COSMIC database
(http://cancer.sanger.ac.uk/cancergenome/projects/cosmic/)
which also were sequenced individually to get the original MAF of
cancer-related somatic variants in each sample. All 8 cell lines
were mixed together in designed proportions, and the expected MAF
of each variant was calculated on the mixed ratios (Table II). Eventually, we achieved the
2625 variants spanning a range of expected MAF (0.5–20%) and INDEL
lengths (1–40 base pair, bp) as gold-standard (Table III). Cell lines obtained from
Coriell Institute (http://ccr.coriell.org/) and ATCC (http://www.atcc.org/) were routinely cultured in
Dulbecco's modified Eagle's media (DMEM) with 10% heat-inactivated
fetal bovine serum (FBS; Invitrogen, Waltham, MA, USA) in a
75-cm2 cell culture flask. The cells were seeded into
cell culture flasks at a concentration of 1×10⁵ viable
cells/ml and incubated at 37°C in a humidified atmosphere
containing 5% CO2.
| Table IIMix ratio for cell lines. |
Table II
Mix ratio for cell lines.
| Cell line | Volume | Ratio |
|---|
| GM19114 | 0.04 | 1 |
| GM19108 | 0.08 | 2 |
| RL95-2 | 0.08 | 2 |
| LOVO | 0.16 | 4 |
| GM18511 | 0.16 | 4 |
| HCT-15 | 0.32 | 8 |
| GM18488 | 0.64 | 16 |
| GM18957 | 6.52 | 163 |
| Total | 8 | 200 |
| Table IIIDistribution of expected mutant
allele frequencies in SNV and INDEL test set. |
Table III
Distribution of expected mutant
allele frequencies in SNV and INDEL test set.
| Expected mutant
allele frequency | No. of sites
(SNV) | No. of sites
(INDEL) |
|---|
| <0.5% | 568 | 32 |
| 0.5–1% | 446 | 31 |
| 1–2% | 224 | 29 |
| 2–3% | 81 | 10 |
| 3–4% | 390 | 31 |
| 4–5% | 278 | 17 |
| 5–10% | 393 | 19 |
| >10% | 73 | 3 |
| Total | 2453 | 172 |
Library preparation and sequencing
Generally, genome DNA extracted was performed using
DNeasy Blood & Tissue kit (Qiagen, Hilden, Germany). For FFPE
sample special, DNA was isolated using the GeneRead DNA FFPE kit
(Qiagen, Valencia, CA, USA) following the protocol. Besides the
purification of high yields of DNA from FFPE tissue sections, this
kit could remove deaminated cytosine to prevent false results in
sequencing (27). The ratio of
absorbance at 260 and 280 nm is used to assess the purity of
extracted DNA, and we used the Qubit® Quantitation
Platform to quantitated DNA. A Covaris S220 focused-ultrasonicator
(Covaris, Woburn, MA, USA) was used to fragment genomic DNA (500
ng) and an Agilent Bioanalyzer 2100 (Agilent Technologies) to
ensure an average fragment size of 200 to 400 base pair (bp). The
library preparation after fragmentation were done using instruction
manual of KAPA Hyper Prep kit. The protocol included: i) repairing
the DNA ends; ii) adding ‘A’ base to the DNA fragments; iii)
ligating the paired-end adaptor; iv) purifying the sample using
AMPure XP beads; and v) amplifying the adaptor-ligated library and
purifying the sample using AMPure XP beads. Prepared library was
hybridized using NCP custom designed baits as described in
SureSelectQXT (Agilent Technologies) and the product was then
amplified for 14 PCR cycles. The size range of the prepared library
was assessed using Agilent 2100 Bioanalyzer and qualified using ABI
StepOnePlus. The concentration of each library was quantified using
qPCR NGS Library Quantification kit and Protocol was used to
calculate the final pooling volume to sequencing. The products were
sequenced using the Illumina HiSeq X platform with paired-end
sequencing runs (2×150) under Illumnina recommended protocols.
Data analysis
Clean data were generated by data processing steps
including base calling, demultiplexing and adapter trimming. All
these steps were performed using Illumina HiSeq X vendor software
on default parameters. We further performed our in-house software
for clean data quality control (QC) which included: i) removing
read pairs if any one of the two reads containing base ‘N’ >10%;
ii) removing read pairs if any one of the two reads containing base
with quality below Q10 >50%; iii) trimming the 3′ end of the
read from the first base below Q20; and iv) removing reads shorter
than 100 bp. Clean data after QC were mapped to the human reference
genome (GRCh37) using BWA aligner v0.7.8 (28) with the default parameters. PCR
duplicate read removal was done using Picard 1.119 (http://picard.sourceforge.net/index.html). According
to the result, a sequence metric collection was generated including
the number of total reads, percentage of reads mapped, on target
reads number, average target coverage and percentage of target
region with >200X and 1000X coverage. Before SNV and INDEL
calling, local realignment was performed using Genome Analysis
Toolkit (GATK version 2.7–2-g6bda569) (29,30)
with default parameters and recommended ‘known sites’ in GATK best
practice (https://software.broadinstitute.org/gatk/best-practices/).
For SNV detection, we denote the reference allele and the coverage
of each site as r and d and denote the error rate
corresponding to the base calling at read i (i = 1…d)
as ei. We used a null model to explain the
data in which there is no SNV at that site and all non-reference
alleles to be sequencing error. The number of variant bases (k)
with ei <1e−3 (associated
Phred-like quality score qi>30) in each
site was then given a binomial distribution. The probability under
this null model was given by the following formula:
P(X≥k∣d)=1-∑i=0k-1P(X=i∣d)
where P(X = i|d) was the probability of
observing i variants in the d reads of the site.
Assuming the sequencing errors were independent across reads and
occurred with probability e0
(e0 = 1e−3/3) to each non-reference
allele. We could obtain
P(X=i∣d)=(dk)e0k(1-e0)d-k
The P-value was then given by P(X≥k|d) and the
cut-off (P-value <1e−6) was established to eliminate
random sequencing error. For INDEL detection, we simply kept
variants supporting reads >10. We also employed several filters
to reduce systematic errors. Empirical filters including strand
bias (Fisher's exact test, P<1e−6), site median base
quality (MBQ >30), site median mapping quality (MMQ >30),
variant MAF (MAF >0.5%). Variants pass filters were annotated by
dbSNP b146, My Cancer Genome database (https://www.mycancergenome.org) and Oncomine database
v1.4.1 to get the clinical relevant information. However, cross
library contamination may occur and a report would not be generated
once the sample contained >10 variants with low-MAF (MAF ≤10%)
in dbSNP. In the report stage, all annotated variants with MAF ≥5%
would be reported and other cancer-related variants would be
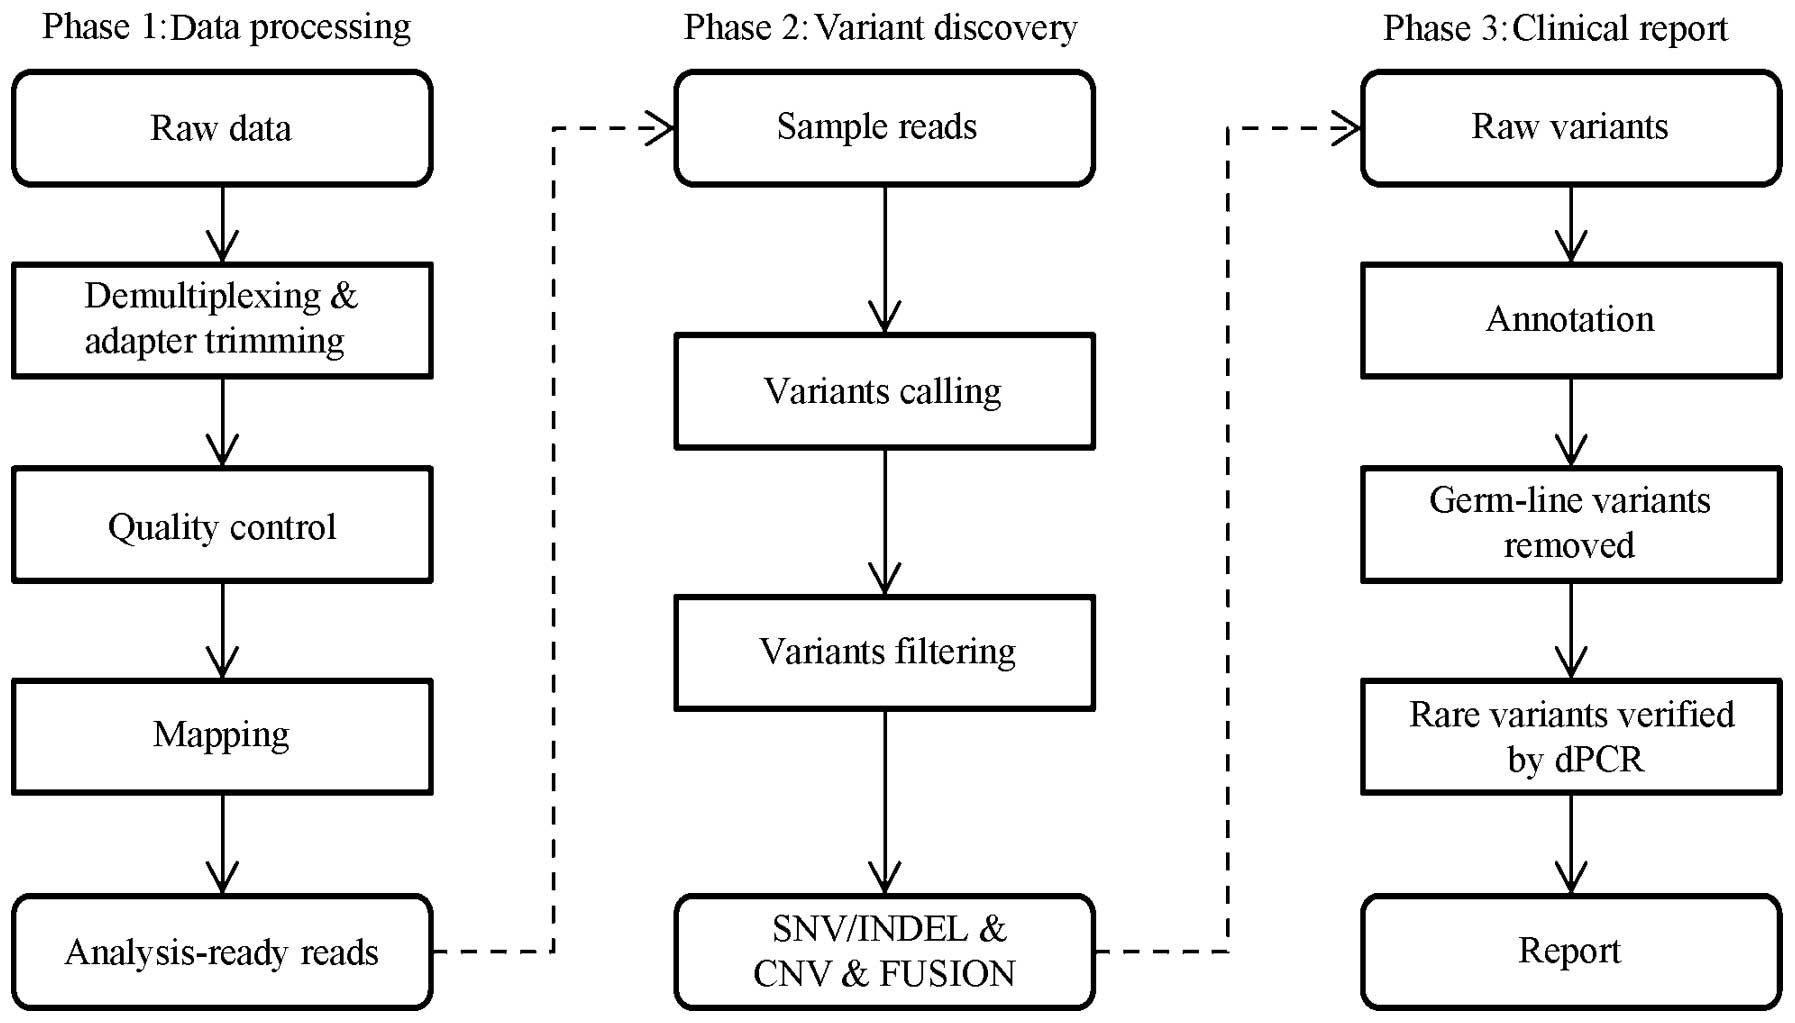
validated by 3dPCR. The whole workflow for the data analysis is
outlined in Fig. 3. The parameters
and descriptions used are listed in Table IV.
| Table IVDescription of filters in data
analysis. |
Table IV
Description of filters in data
analysis.
| Data analysis | Description and
thresholds |
|---|
| Quality
control | Remove read pairs
with low quality, which may lead to false positive in downstream
process. Four tests are used to identify such read pairs: i) read
pair with one of the two reads containing base ‘N’ >10%; ii)
read pairs with any one of the two reads containing base with
quality below Q10 >50%; iii) trimming the 3′ end of the read
from the first base below Q20; and iv) removing reads <100
bp. |
| Mapping | Reads are mapped to
human reference using BWA aligner v0.7.8 with BWA-MEM algorithm and
relevant default parameters. |
| Realignment | The GATK
realignment is used to correct the misalignment due to the presence
of an INDEL. This step use two files
‘Mills_and_1000G_gold_standard.indels.b37.sites.vcf’ and
‘1000G_phase1.indels.b37.vcf’ (https://software.broadinstitute.org/gatk/best-practices/)
to get these INDEL. The default parameters are used to perform the
realignment. |
| Call SNV | A binomial test is
used to separate true positive from noises. The P-value cut-off is
1e−6, and the probability of sequencing error is
1e−3/3. |
| Call INDEL | A cut-off of 10
support reads is used to call INDEL. |
| Hard filter | To further remove
false positives, several hard filters have been used as follows: i)
Fisher's exact test for strand bias, P-value <1e−6.
Some false positives are generated in sequencing step and have
close relationship to the front of the sequence (homopolymer or
other special sequence); ii) site median base quality >30. In
case of the base quality of each read could not represent the true
error rate, the median base quality of each site is used to
evaluate such error rate; iii) site median mapping quality >30.
This filter is used to avoid the misalignment of repeat sequences
with small difference in human reference which are easily mistaken
as SNV. |
Compared with other software
To measure the effect of our approach, we compared
the pooled cell-line result with GATK, a widely used software. We
followed the ‘GATK best practice’, the ‘IndelRealigner’ parameter
‘LOD_Threshold_For_Cleaning’ was 0.3, the ‘BaseRecalibrator’ was
with default parameters, the SNV/INDEL calling type was
‘HaplotypeCaller’ with parameters
‘standard_min_confidence_threshold_for_emitting’ as 10 and
‘standard_min_confidence_threshold_for_calling’ as 30.
Performance statistics calculation
For sensitivity estimation, variants detected in
pools would be assigned as true positive (TP), or false negative
(FN) if not detected. Sensitivity was calculated as TP/(TP+FN). For
specificity estimation, the pool variants also detected in the pure
sample were assigned as true positive (TP), or false positive (FP)
if none was detected. PPV was calculated as TP/(TP+FP).
Mutation detection by dPCR
dPCR is a method used in absolute quantification
analysis of clonally amplified nucleic acids (including DNA, cDNA,
methylated DNA or RNA). With dPCR, a sample is partitioned so that
individual nucleic acid molecules within the sample are localized
and concentrated within many separate regions. After PCR
amplification, nucleic acids may be quantified by counting the
regions that contain PCR end-product, positive reactions. Here, we
used the QuantStudio™ 3D Digital PCR System platform (Life
Technologies) regarding SNP mutation quantitation. For dPCR, the
first step is preparing and loading samples onto QuantStudio™ 3D
Digital PCR 20K chips. Mutations were analysed by
TaqMan® SNP Genotyping Assays (Life Technologies), which
containing TaqMan®-MGB probes and primers. We prepared
15 μl reaction mixes according to the manufacturer's instructions,
and loaded 14.5 μl onto each chip. The Mix contains ROX®
dye, which served as a passive reference. After chips were loaded,
we run the Digital PCR 20K Chips with a ProFlex™ 2x Flat PCR System
under the following conditions: 96°C for 10 min, 39 cycles at 56°C
for 2 min and at 98°C for 30 sec, followed by a final extension
step at 56°C for 2 min. After thermo-cycling, we analyzed the
prepared chips using dPCR instrument.
Mutation detection by ARMS-PCR
ARMS-PCR is a real-time PCR-based test which covers
the 29 EGFR hotspots from exon 18–21. The assay was performed
according to the manufacturer's protocol for the ADx EGFR29
Mutation kit (Amoy Diagnostics, Co., Ltd., Xiamen, China) with the
MX3000P (Stratagene, La Jolla, CA, USA) real-time PCR system.
Template DNA (0.4 μl), 3.6 μl deionized water and 16 μl other
reaction components was used in the RT-PCR reaction system. PCR was
performed with initial denaturation at 95°C for 10 min, followed by
40 cycles of amplification (at 95°C for 30 sec and 61°C for 1 min).
The results were analyzed according to the criteria defined by the
manufacturer's instructions. Positive results were defined as
[Ct(sample) − Ct(control)] < Ct(cut-off).
Results
Overview
NCP is a NGS-based clinical test for detection of
somatic cancer related mutations. DNA was extracted from tumor
tissues and FFPE samples, 500 ng of which was fragmented, captured
using custom-designed hybridization-based biotinylated cRNA
reagents and amplified via limited-cycle PCR to enrich 7,011 exons
and 94 introns of 483 cancer related genes (totaling ~2.3 million
sites). We used clinical samples to generate the bioinformatics
pipeline for data analysis (Table
IV) and cell lines to validate the whole work flow. For the 8
single cell lines, using the Illumina HiSeq X platform, achieving
an average of 13,330 Mb (SD=3,995 Mb) total bases with 38.09%
on-target (SD=4.78%), target regions were sequenced to 2148X
(SD=537X) median coverage across targeted bases, with 99.05%
(SD=0.28%) of targeted bases covered by at least 200 reads
(Table V). The 2453 SNV and 172
INDEL detected in single cell line consistent with database would
be used for assessment of SNV/INDEL detection. Pools of mixed cell
lines were used to get the relationship between median coverage and
performance, which achieved total bases of 4,762, 10,896 and 16,351
Mb, the median coverage of 1,029X, 2,237X and 3,194X (Table VI). Due to the high sensitivity
NGS benefit from high coverage, the hotspot mutations with MAF
<5% detected by this assay in 35 FFPE samples were confirmed by
dPCR. All samples used in this test are summarized in Table VII. Finally, 33 hotspot mutations
detected by NGS in FFPE samples with a MAF from 2 to 63% in NGS
were tested by ARMS-PCR.
| Table VSummary of sequencing metrics for
cell lines. |
Table V
Summary of sequencing metrics for
cell lines.
| Cell line | Total read pairs
(M) | Total bases
(Mb) | Mapped baseNum
(Mb) | BaseNum on target
(Mb) | Covered at least
200X (%) | Median target
coverage (X) |
|---|
| GM18511 | 151 | 22,595 | 13,567 | 7,920 | 99.60 | 3405.41 |
| GM18957 | 84 | 12,633 | 8,875 | 5,215 | 99.30 | 2242.34 |
| GM19114 | 61 | 9,130 | 7,216 | 4,438 | 99.10 | 1908.01 |
| GM19108 | 73 | 10,923 | 7,745 | 4,004 | 98.80 | 1721.50 |
| GM18488 | 82 | 12,295 | 8,810 | 4,472 | 98.90 | 1922.71 |
| RL95-2 | 83 | 12,405 | 8,893 | 4,161 | 98.80 | 1788.99 |
| HCT-15 | 88 | 13,217 | 9,254 | 4,811 | 99.00 | 2068.53 |
| LoVo | 90 | 13,444 | 9,453 | 4,950 | 98.90 | 2128.07 |
| Table VISummary of sequencing metrics for
mixed cell lines pool. |
Table VI
Summary of sequencing metrics for
mixed cell lines pool.
| Pool name | Total read pairs
(M) | Total bases
(Mb) | Mapped baseNum
(Mb) | BaseNum on target
(Mb) | Covered at least
200X (%) | Median target
coverage (X) |
|---|
| 5G | 32 | 4,762 | 4,591 | 2,393 | 97.50 | 1028.96 |
| 10G | 73 | 10,896 | 10,316 | 5,202 | 99.20 | 2236.63 |
| 20G | 109 | 16,351 | 15,138 | 7,429 | 99.50 | 3194.21 |
| Table VIIOverview of study objectives and
strategy. |
Table VII
Overview of study objectives and
strategy.
| Objective | Sample set | #Samples | Sample type | DNA input (ng) | Sequencing
platform |
|---|
| Individual cell
line SNP consistent with database gold standard | Cell lines with
known SNPs and INDELs | 8 | Cell line | 500 | Hiseq-X |
| Cell line pools to
validate SNP/INDEl performance | Cell lines at
specific ratio in 3 pools | 3 | Cell line | 500 | |
| Confirm specificity
(MAF <5%) | Clinical FFPE
samples | 35 | FFPE | 300–500 | |
| Confirm specificity
(all MAF) | Clinical FFPE
samples | 33 | FFPE | 300–500 | |
SNV detection performance
SNV detection was performed using a Binomial
methodology allowing the detection of low MAF somatic mutations
across the 2.3 Mb assayed with high sensitivity. For the mixed cell
line pools, overall SNV detection performance was high, the results
of different depth are shown in Table VIII, for an average depth of
2237, 100% (95% CI, 95.1–100%) of SNV at MAF >10% were
successfully detected, as well as 99% (95% CI, 98.6–100%) of SNV at
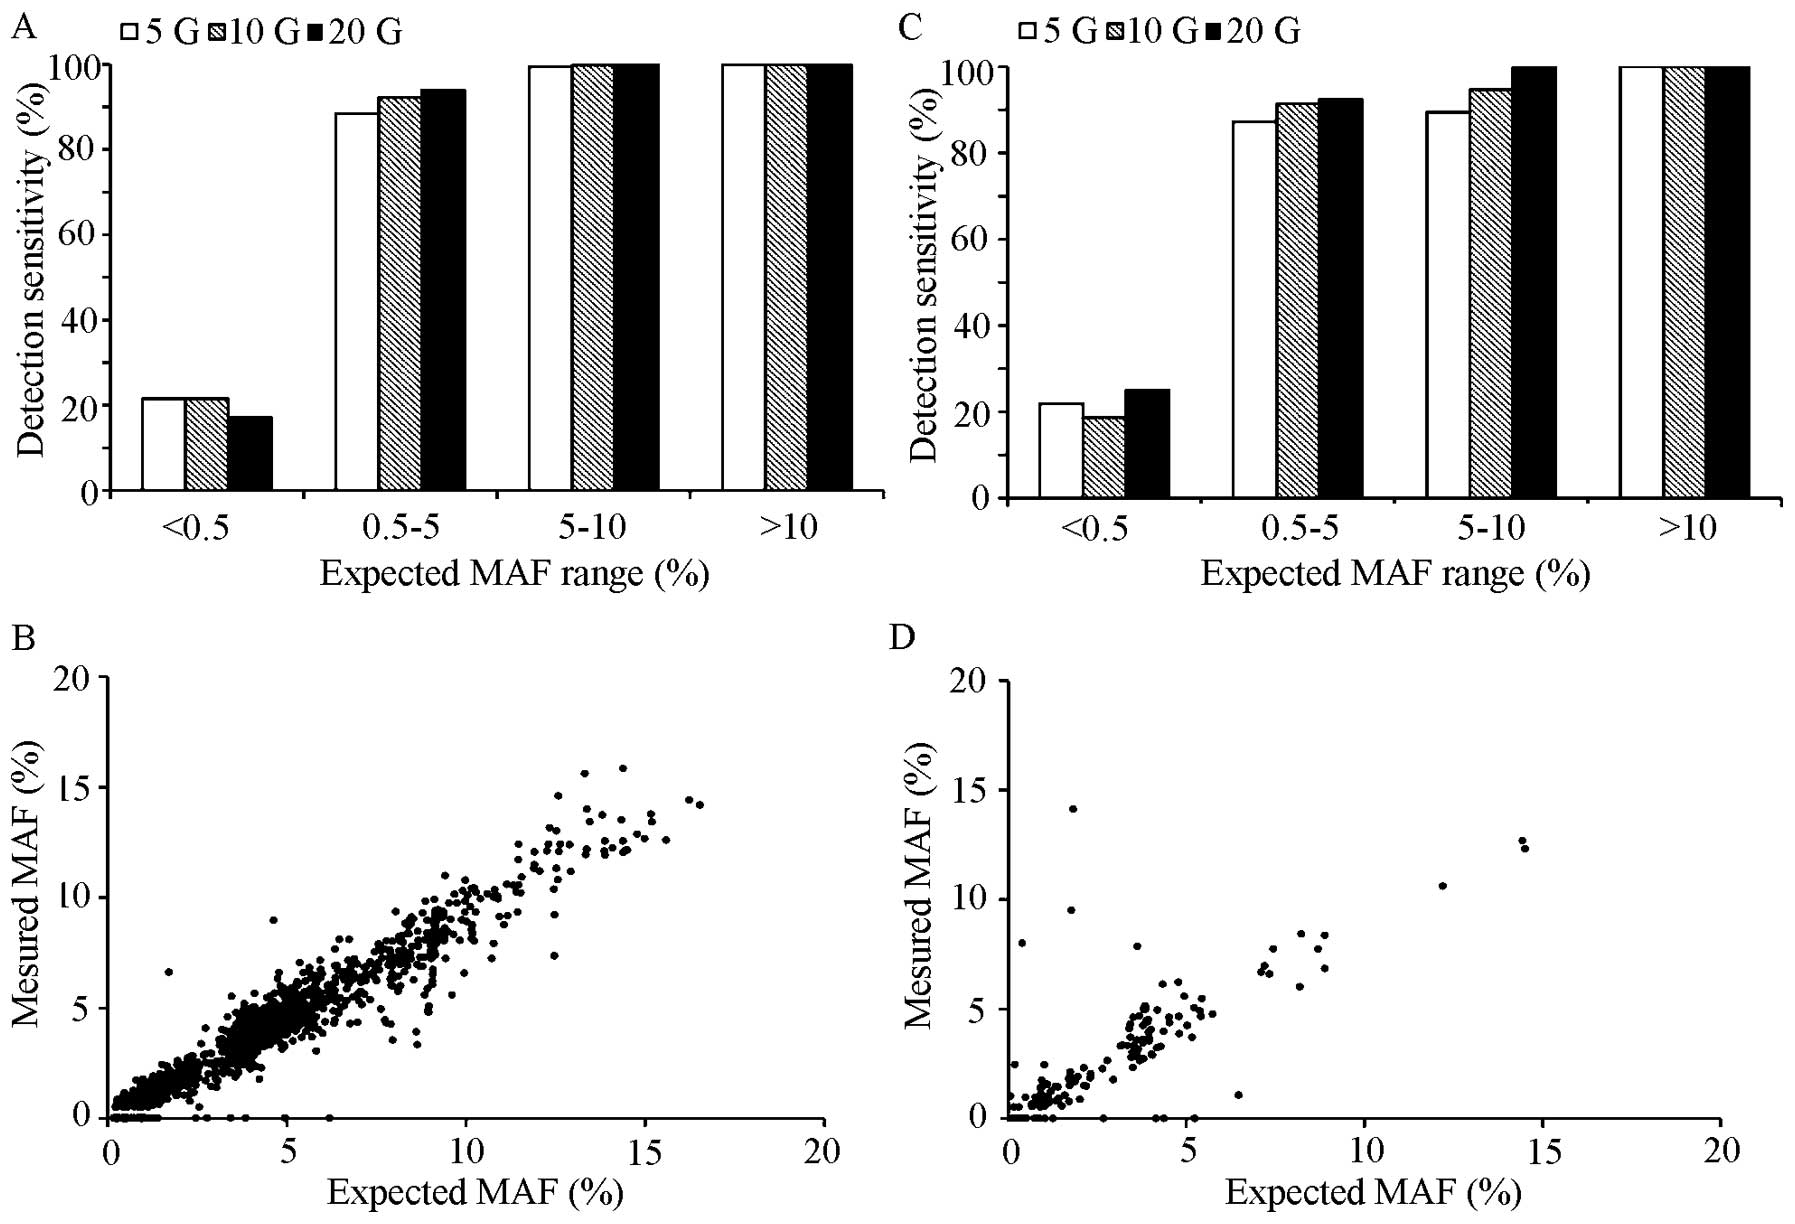
MAF 5–10%. The detection of SNV with MAF between 0.5–5% performance
was 92.2% (95% CI, 90.7–93.5%) (Fig.
4A and C and Table VIIIA).
In addition, high sensitivity was accompanied with good PPV (the
fraction of SNV calls in the pools can also be detected in any of
the individual cell lines; Table
VIIIB) 99.2% (95% CI, 99–99.4%). The false positives may be due
to variants with such a low MAF (<5%) no difference with
sequencing noise could hardly be identified. A dPCR confirmation
for cancer-related SNV with MAF <5% reported by NGS is necessary
before reporting.
| Table VIIISummary of SNV detection performance
(sensitivity, ppv). |
Table VIII
Summary of SNV detection performance
(sensitivity, ppv).
| A, Summary of SNV
detection performance (sensitivity) |
|---|
|
|---|
| Average
coverage | MAF
<0.5%
n=568 | MAF
0.5–5%
n=1419 | MAF 5–10%
n=393 | MAF
>10%
n=73 |
|---|
|
|
|
|
|---|
| FN | SEN (%) | CI (%) | FN | SEN (%) | CI (%) | FN | SEN (%) | CI (%) | FN | SEN (%) | CI (%) |
|---|
| 3194 | 471 | 17.1 | 14.1–20.4 | 86 | 93.9 | 92.6–95.1 | 0 | 100 | 99.1–100 | 0 | 100 | 95.1–100 |
| 2237 | 446 | 21.5 | 18.2–25.1 | 111 | 92.2 | 90.7–93.5 | 1 | 99.8 | 98.6–100 | 0 | 100 | 95.1–100 |
| 1029 | 446 | 21.5 | 18.2–25.1 | 164 | 88.4 | 86.7–90.1 | 2 | 99.5 | 98.2–100 | 0 | 100 | 95.1–100 |
|
| B, Summary of SNV
detection performance (specificity) |
|
| | FP | PPV |
| |
|
|
| Average
coverage | TP | MAF ≥5% | MAF <5% | Mean (%) | CI (%) |
|
| 3194 | 5720 | 0 | 84 | 98.5 | 98.2–98.8 |
| 2237 | 5619 | 0 | 43 | 99.2 | 99.0–99.4 |
| 1029 | 4661 | 0 | 4 | 99.9 | 99.8–100 |
INDEL detection performance
For INDEL detection, we simply discarded the
variants supporting less than 10 reads. The results of different
depth are shown in Table IX, for
an average depth of 2237, 100% (95% CI, 29.2–100%) of INDEL at MAF
>10% were successfully detected, as well as 94.7% of INDEL (95%
CI, 74–99.9%) with MAF between 5–10%. Low MAF sites detected
performance was 91.5% (95% CI, 85–100%), the performance of
variants with MAF <0.5% was also calculated (Fig. 4B and D and Table IXA). Few false-positive calls were
observed, with a PPV of 98.2% (95% CI, 97.2–98.9%) (Table IXB). Like SNV detection, due to
the false positive under 10%, a dPCR confirmation of these
cancer-related INDEL with MAF <10% before reporting is
needed.
| Table IXSummary of INDEL performance
(sensitivity, ppv). |
Table IX
Summary of INDEL performance
(sensitivity, ppv).
| A, Summary of small
insert and deletion detection performance (sensitivity) |
|---|
|
|---|
| Average
coverage | MAF
<0.5%
n=32 | MAF
0.5–5%
n=118 | MAF 5–10%
n=19 | MAF
>10%
n=3 |
|---|
|
|
|
|
|---|
| FN | SEN(%) | CI (%) | FN | SEN (%) | CI (%) | FN | SEN (%) | CI (%) | FN | SEN (%) | CI (%) |
|---|
| 3194 | 24 | 25.0 | 11.5–43.4 | 9 | 92.4 | 86–96.5 | 0 | 100 | 82.4–100 | 0 | 100 | 29.2–100 |
| 2237 | 26 | 18.8 | 7.2–36.4 | 10 | 91.5 | 85–95.9 | 1 | 94.7 | 74–99.9 | 0 | 100 | 29.2–100 |
| 1029 | 25 | 21.9 | 9.3–40 | 15 | 87.3 | 79.9–92.7 | 2 | 89.5 | 66.9–98.7 | 0 | 100 | 29.2–100 |
|
| B, Summary of small
insert and deletion detection performance (specificity) |
|
| | FP | PPV |
| |
|
|
| Average
coverage | TP | MAF >10% | MAF <10% | Mean (%) | CI (%) |
|
| 3194 | 1119 | 0 | 24 | 97.9 | 96.8–98.6 |
| 2237 | 1050 | 0 | 19 | 98.2 | 97.2–98.9 |
| 1029 | 794 | 0 | 13 | 98.4 | 97.2–99.1 |
Comparison with other bioinformatics
approaches
We evaluated the performance of our bioinformatics
pipeline with the cell line models above, focusing on two key steps
of our approach. First, we applied statistical models that allow
for the identification of a mutation at low MAF from random errors
in Illumina sequencing. Second, we used priori knowledge to
identify systematic errors always accompanied with specific
characteristics, such as strand bias and low base/mapping quality.
To measure the effect of our approach, we compared the pooled
cell-line result with GATK - widely used software. The GATK
detection sensitivity of SNV with MAF >10% was 64.38% (95% CI,
52.3–75.3%), and SNV with 5%<MAF<10% was under 10% but the
PPV was 100% (95% CI, 99.7–100%). The sensitivity of INDEL with MAF
>10% was 67% (95% CI, 9.4–99.2%), and a high PPV 100% (95% CI,
99–100%) (Tables X and XI), possibly because this widely used
tool is designed for whole-genome or whole-exon sequencing data
with relatively low depth and variants with high allele frequency,
which underline that appropriate filters for ultra-deep sequencing
data analysis were critical. Actually, compared with slight
performance upgrades under increased coverage depth, the effect of
appropriate filters was remarkable in this test.
| Table XSummary of SNV detection performance
by GATK (sensitivity, ppv). |
Table X
Summary of SNV detection performance
by GATK (sensitivity, ppv).
| A, Summary of SNV
detection performance by GATK (sensitivity) |
|---|
|
|---|
| Average
coverage | MAF
<0.5%
n=568 | MAF
0.5–5%
n=1419 | MAF 5–10%
n=393 | MAF
>10%
n=73 |
|---|
|
|
|
|
|---|
| FN | SEN (%) | CI (%) | FN | SEN (%) | CI (%) | FN | SEN (%) | CI (%) | FN | SEN (%) | CI (%) |
|---|
| 3194 | 567 | 0.18 | 0–1 | 1417 | 0.14 | 0–0.5 | 374 | 4.83 | 2.9–7.4 | 18 | 75.34 | 63.9–84.7 |
| 2237 | 568 | 0.00 | 0–0.6 | 1417 | 0.14 | 0–0.5 | 370 | 5.85 | 3.7–8.7 | 26 | 64.38 | 52.3–75.3 |
| 1029 | 567 | 0.18 | 0–1 | 1416 | 0.21 | 0–0.6 | 375 | 4.58 | 2.7–7.1 | 25 | 65.75 | 53.7–76.5 |
|
| B, Summary of SNV
detection performance by GATK (specificity) |
|
| | FP | PPV |
| |
|
|
| Average
coverage | TP | MAF ≥5% | MAF <5% | Mean (%) | CI (%) |
|
| 3194 | 2212 | 1 | 0 | 100.0 | 99.7–100 |
| 2237 | 2213 | 1 | 0 | 100.0 | 99.7–100 |
| 1029 | 2188 | 0 | 0 | 100.0 | 99.8–100 |
| Table XISummary of INDEL detection
performance by GATK (sensitivity, ppv). |
Table XI
Summary of INDEL detection
performance by GATK (sensitivity, ppv).
| A, Summary of INDEL
detection performance by GATK (sensitivity) |
|---|
|
|---|
| Average
coverage | MAF
<0.5%
n=32 | MAF
0.5–5%
n=118 | MAF 5–10%
n=19 | MAF
>10%
n=3 |
|---|
|
|
|
|
|---|
| FN | SEN (%) | CI(%) | FN | SEN (%) | CI (%) | FN | SEN (%) | CI (%) | FN | SEN (%) | CI (%) |
|---|
| 3194 | 31 | 3.13 | 0.1–16.2 | 116 | 1.69 | 0.2–6 | 16 | 15.79 | 3.4–39.6 | 0 | 100.00 | 29.2–100 |
| 2237 | 31 | 3.13 | 0.1–16.2 | 116 | 1.69 | 0.2–6 | 18 | 5.26 | 0.1–26 | 1 | 67 | 9.4–99.2 |
| 1029 | 31 | 3.13 | 0.1–16.2 | 116 | 1.69 | 0.2–6 | 17 | 10.53 | 1.3–33.1 | 0 | 100.00 | 29.2–100 |
|
| B, Summary of INDEL
detection performance by GATK (specificity) |
|
| | FP | PPV |
| |
|
|
| Average
coverage | TP | MAF >10% | MAF <10% | Mean (%) | CI (%) |
|
| 3194 | 385 | 0 | 0 | 100.0 | 99–100 |
| 2237 | 386 | 0 | 0 | 100.0 | 99–100 |
| 1029 | 380 | 0 | 0 | 100.0 | 99–100 |
Concordance between NGS and other
approaches
The above studies demonstrate that the NGS-based
test has the performance characteristics necessary to accurately
detect SNV and INDEL. We further validated test accuracy by
comparisons to dPCR for 35 FFPE cancer specimens. To assess the
accuracy of low MAF SNV and INDEL detection in routine clinical
cancer samples, we selected 35 FFPE resection specimens (31
non-small cell lung cancer, 1 parathyroid carcinoma, 3 breast
cancers) previously tested for hotspot mutations in PIK3Ca, EGFR,
KRAS and BRAF by NGS, every hotspot mutations detected by NGS, but
with MAF <5% would be tested by dPCR. In addition, 32 of 35
(PPV=91.43%, 95% CI, 76.94–98.20%) variants have been supported to
be true-positive by dPCR (Tables
XII and XIII). Three
variants were present at <3% MAF in NGS that were not detected
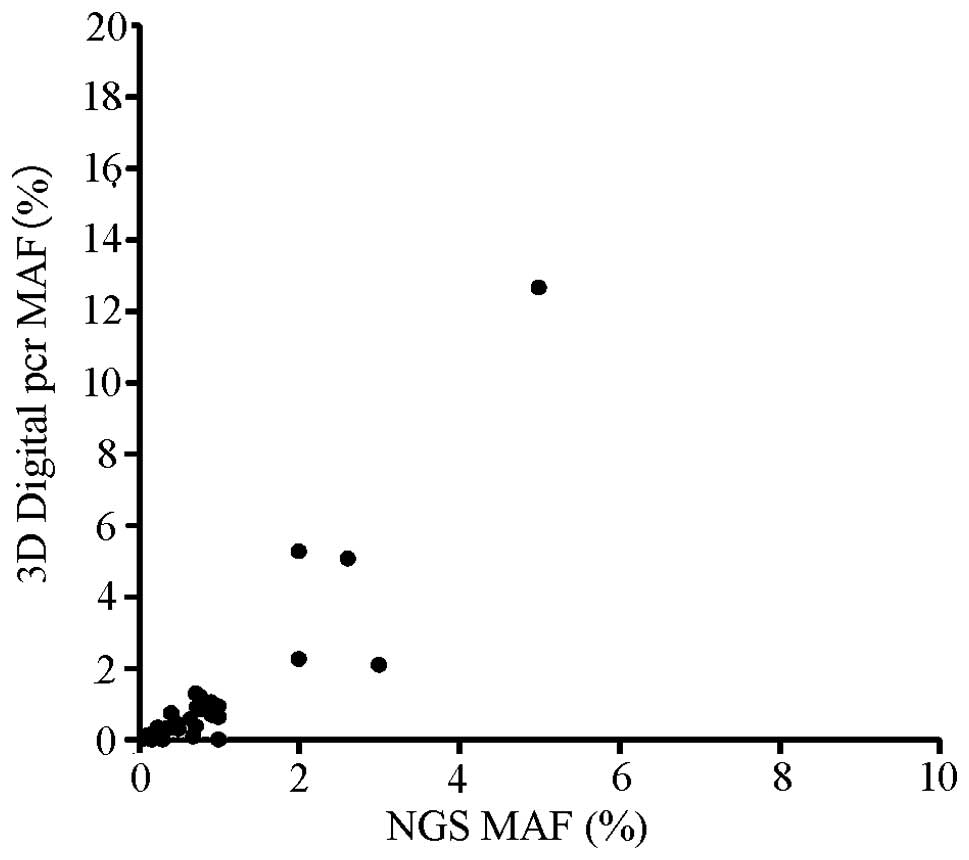
by dPCR. The detected MAF of the two technologies is shown in
Fig. 5. Finally, we random
selected 33 FFPE samples (NSCLC) with hotspot mutations and
performed the ARMS-PCR to verify the overall PPV of our assay. As a
result, all 33 mutations could be detected by ARMS-PCR and the PPV
was 100% (95% CI, 89.42–100%; Table
XIV).
| Table XII3D digital PCR correlation
results. |
Table XII
3D digital PCR correlation
results.
| Genes and
exons | NGS (no.) | Supported by 3d
digital pcr (no.) |
|---|
| PPIK3CA exon 9 | 1 | 1 |
| PPIK3CA exon
10 | 3 | 3 |
| PPIK3CA exon
21 | 1 | 1 |
| EGFR exon 18 | 1 | 0 |
| EGFR exon 19 | 6 | 6 |
| EGFR exon 20 | 11 | 10 |
| EGFR exon 21 | 5 | 4 |
| KRAS exon 2 | 5 | 5 |
| BRAF exon 15 | 1 | 1 |
| KRAS exon 3 | 1 | 1 |
| Table XIIISummary of concordance between NGS
and 3D Digital PCR. |
Table XIII
Summary of concordance between NGS
and 3D Digital PCR.
| Sample id | Mutation | NGS (%) | dPCR (%) | Cancer type | Stage |
|---|
| d001 |
EGFR:exon19:c.2235_2249del:p.746_750del | 5.00 | 12.64 | NSCLC | - |
| d002 |
PIK3CA:exon21:c.A3140G:p.H1047R | 3.00 | 2.09 | Breast cancer | - |
| d003 |
KRAS:exon2:c.G35A:p.G12D | 2.61 | 5.07 | NSCLC | 4 |
| d004 |
EGFR:exon19:c.2235_2249del:p.746_750del | 2.00 | 5.26 | NSCLC | 4 |
| d005 |
BRAF:p.V600Ec.1799T>A | 2.00 | 2.25 | NSCLC | 4 |
| d006 |
EGFR:exon21:c.T2573G:p.L858R | 1.00 | 0.00 | NSCLC | 4 |
| d007 |
EGFR:exon20:c.C2369T:p.T790M | 1.00 | 0.62 | NSCLC | 4 |
| d008 |
KRAS:exon2:c.G35A:p.G12D | 1.00 | 0.93 | Parathyroid
carcinoma | 4 |
| d009 |
PIK3CA:exon9:c.1633G>A:p.E545K | 0.92 | 0.68 | NSCLC | - |
| d010 |
EGFR:exon20:c.C2369T:p.T790M | 0.90 | 1.05 | NSCLC | 4 |
| d011 |
EGFR:exon19:c.2236_2250del:p.746_750del | 0.79 | 0.84 | NSCLC | 3 |
| d012 |
KRAS:exon2:c.G35A:p.G12D | 0.77 | 1.20 | NSCLC | 4 |
| d013 |
EGFR:exon20:c.C2369T:p.T790M | 0.73 | 0.90 | NSCLC | 2 |
| d014 |
EGFR:exon19:c.2235_2249delGGAATTAAGAGAAGC:
p.E746_A750del | 0.71 | 1.29 | NSCLC | 4 |
| d015 |
EGFR:exon21:c.T2573G:p.L858R | 0.71 | 0.38 | NSCLC | 4 |
| d016 |
KRAS:p.G12C:c.34G>T | 0.68 | 0.08 | NSCLC | 4 |
| d017 |
PIK3CA:exon10:c.G1633A:p.E545K | 0.64 | 0.57 | NSCLC | 4 |
| d018 |
EGFR:exon21:c.2573T>G:p.L858R | 0.50 | 0.29 | NSCLC | |
| d019 |
KRAS:exon2:c.G37T:p.G13C | 0.47 | 0.44 | NSCLC | - |
| d020 |
PIK3CA:c.1633G>A:p.E545K | 0.42 | 0.37 | NSCLC | 4 |
| d021 |
PIK3CA:exon10:c.G1624A:p.E542K | 0.41 | 0.73 | Breast cancer | 3 |
| d022 |
EGFR:exon19:c.2235_2249del:p.745_750del | 0.40 | 0.32 | NSCLC | 4 |
| d023 |
EGFR:exon21:c.2573T>G:p.L858R | 0.38 | 0.33 | NSCLC | 4 |
| d024 |
EGFR:p.L858R:c.2573T>G | 0.32 | 0.25 | NSCLC | - |
| d025 |
EGFR:exon20:c.C2369T:p.T790M | 0.32 | 0.31 | NSCLC | 4 |
| d026 | EGFR
exon18:c.2155G>T:p.G719C | 0.30 | 0.00 | Breast cancer | 3 |
| d027 |
EGFR:exon20:c.C2369T:p.T790M | 0.27 | 0.22 | NSCLC | 4 |
| d028 | EGFR:exon20
c.C2369T:p.T790M | 0.25 | 0.22 | NSCLC | 4 |
| d029 |
EGFR:exon19:c.2236_2250del:p.746_750del | 0.24 | 0.34 | NSCLC | 3 |
| d030 |
KRAS:c.35G>A:p.G12D | 0.18 | 0.17 | NSCLC | 4 |
| d031 |
EGFR:exon20:c.C2369T:p.T790M | 0.16 | 0.00 | NSCLC | 4 |
| d032 |
EGFR:exon20:c.C2369T:p.T790M | 0.10 | 0.08 | NSCLC | - |
| d033 |
EGFR:exon20:c.C2369T:p.T790M | 0.09 | 0.04 | NSCLC | 4 |
| d034 |
EGFR:exon20:c.C2369T:p.T790M | 0.09 | 0.10 | NSCLC | 4 |
| d035 |
EGFR:exon20:c.C2369T:p.T790M | 0.07 | 0.03 | NSCLC | 4 |
| Table XIVSummary of concordance between NGS
and ARMS-PCR. |
Table XIV
Summary of concordance between NGS
and ARMS-PCR.
| Sample id | Mutation | NGS (%) | ΔCt | Results | Cancer type | Stage |
|---|
| a001 | EGFR:exon20:
c.C2369T: p.T790M | 2.00 | 6.64 | Positive | NSCLC | 4 |
| a002 | EGFR: exon21:
c.T2573G: p.L858R | 14.00 | 5.2 | Positive | NSCLC | 4 |
| a003 | EGFR: exon21:
c.T2573G: p.L858R | 14.00 | 4.47 | Positive | NSCLC | 4 |
| a004 | EGFR: exon21:
c.T2573G: p.L858R | 3.00 | 7.38 | Positive | NSCLC | 3 |
| a005 | EGFR: exon21:
c.T2573G: p.L858R | 4.00 | 6.01 | Positive | NSCLC | 4 |
| a006 | EGFR: exon21:
c.T2573G: p.L858R | 13.00 | 4.51 | Positive | NSCLC | 3 |
| a007 | EGFR: exon21:
c.T2573G: p.L858R | 9.00 | 5.45 | Positive | NSCLC | - |
| a008 | EGFR: exon21:
c.T2573G: p.L858R | 2.00 | 10.81 | Positive | NSCLC | 3 |
| a009 | EGFR: exon21:
c.T2573G: p.L858R | 16.00 | 3.96 | Positive | NSCLC | 4 |
| a010 | EGFR: exon21:
c.T2573G: p.L858R | 63.00 | 2.13 | Positive | NSCLC | 4 |
| a011 | EGFR: exon21:
c.T2573G: p.L858R | 31.00 | 2.32 | Positive | NSCLC | 4 |
| a012 | EGFR: exon21:
c.T2573G: p.L858R | 13.00 | 8.3 | Positive | NSCLC | 4 |
| a013 |
EGFR:exon21:c.T2582A:p.L861Q | 8.00 | 13.61 | positive | NSCLC | 4 |
| a014 |
EGFR:exon20:c.C2369T:p.T790M | 13.00 | 5.47 | Positive | NSCLC | 4 |
| a015 |
EGFR:exon19:c.2235_2249del:p.745_750del | 15.00 | 2.21 | Positive | NSCLC | - |
| a016 |
EGFR:exon19:c.2235_2249del:p.745_750del | 9.00 | 3.36 | Positive | NSCLC | 4 |
| a017 |
EGFR:exon19:c.2235_2249del:p.745_750del | 7.00 | 3.28 | Positive | NSCLC | 4 |
| a018 |
EGFR:exon19:c.2239_2256del:p.747_752del | 12.00 | 7.9 | Positive | NSCLC | 4 |
| a019 |
EGFR:exon19:c.2236_2250del:p.746_750del | 8.00 | 5.39 | Positive | NSCLC | 4 |
| a020 |
EGFR:exon19:c.2236_2250del:p.746_750del | 13.00 | 4.57 | Positive | NSCLC | 3 |
| a021 |
EGFR:exon19:c.2236_2250del:p.746_750del | 10.00 | 4.18 | Positive | NSCLC | 3 |
| a022 |
EGFR:exon19:c.2254_2277del:p.752_759del | 8.00 | 3.1 | Positive | NSCLC | 4 |
| a023 |
EGFR:exon19:c.2237_2254del:p.746_752del | 9.00 | 3.99 | Positive | NSCLC | 4 |
| a024 |
EGFR:exon19:c.2237_2254del:p.746_752del | 12.00 | 3.22 | Positive | NSCLC | 4 |
| a025 |
EGFR:exon19:c.2238_2252del:p.746_751del | 15.00 | 2.91 | Positive | NSCLC | - |
| a026 |
EGFR:exon19:c.2235_2249del:p.745_750del | 7.00 | 3.36 | Positive | NSCLC | 4 |
| a027 |
EGFR:exon19:c.2235_2249del:p.745_750del | 11.00 | 2.95 | Positive | NSCLC | 4 |
| a028 |
EGFR:exon19:c.2240_2254del:p.747_752del | 20.00 | 3.88 | Positive | NSCLC | 4 |
| a029 |
EGFR:exon19:c.2236_2250del:p.746_750del | 19.00 | 5.21 | Positive | NSCLC | 4 |
| a030 |
EGFR:exon19:c.2235_2249del:p.745_750del | 16.00 | 2.33 | Positive | NSCLC | 4 |
| a031 |
EGFR:exon19:c.2235_2249del:p.745_750del | 9.05 | 3.06 | Positive | NSCLC | - |
| a032 |
EGFR:exon19:c.2237_2253del:p.746_751del | 11.00 | 3.22 | Positive | NSCLC | 4 |
| a033 |
EGFR:exon19:c.2235_2249del:p.745_750del | 13.00 | 2.8 | Positive | NSCLC | 4 |
Discussion
Cancer diagnostic is undergoing a rapid development
(31), routine tests like FISH and
IHC can only detect limited known variants, besides it fully relies
on the doctor's experience. PCR-based approach, like Sanger
sequencing or dPCR used by us in this study, still cannot test
multiple sites in one run. Furthermore, Sanger sequencing cannot
detect variants with MAF under 10% (32) and dPCR waste too many samples,
which remain problems for clinical application. The NGS-based test
with increased access and decreased cost has more advantages in
comprehensive detection of the cancer-related mutations (33–35).
For detecting mutations with low frequency, NGS-based test with
high sensitivity is needed. However, high sensitivity always comes
with false-positives, which may lead to suboptimal treatment.
Finally, some other factors, like DNA damage and contamination in
clinical samples (36,37), make it critical to generate a
complex validation of NGS assay.
In the present study, we developed and validated the
NGS-based assay, using germ line mutations in 1000 genome cell
lines and certain somatic INDEL in cosmic database to simulate the
tumor heterogeneity or impurity in clinical samples. We mixed these
samples to measure the analytic sensitivity and PPV of NCP assay at
low MAF and used 3 pools to obtain the correlation between median
coverage and variants detection performance. The performance of our
test was high for variants with MAF >5%. In cell line model with
2236X median coverage, sensitivity was 99.8% for SNP, 94.7% for
INDEL with a PPV of 99 and 98%. The 0.5%<MAF<5% variant
sensitivity was 92.2% for SNV and 91.5% for INDEL which was not
desirable. Because of the complexity of 483 genes, it was difficult
to ensure such low MAF variant detection sensitivity. On the other
hand, we confirmed the low MAF detection by dPCR which could
identify rare mutations specifically. We also compared our
bioinformatics pipeline with common pipeline GATK (29,30),
which is widely used in genotype analysis. The overall PPV was high
at the expense of sensitivity, which may be due to these approaches
being developed to call germ line variants. The results highlighted
that appropriate filtering approach is critical for low MAF variant
detection. Actually, the filters were more important than the
increase of coverage depth as showed in the different coverage
tests. For specificity analysis, each called variant was classified
as a false positive if a matching alteration was not detected in
the pure sample. However, this approach could not recognize the
false positive generated by systematic errors. Given the high
sensitivity of this technology, high-throughput clinical trials are
required to confirm its reliability for the molecular diagnosis of
cancer (38). Therefore, 35
patient specimens previously tested by NCP assay and having low MAF
<5% variants were used to test in parallel by dPCR. The
correlation coefficient of NGS and dPCR was low (0.78) and 32 of 35
(91.43%) NGS detected variants could be confirmed by dPCR. The
discordance was possibly due to the heterogeneity in tumor
specimens or false positive in NGS, the dPCR verification is needed
for such low MAF variants before reporting. Like low MAF variants,
we used ARMS-PCR to test the 33 random selected FFPE samples with
hotspot mutations detected by NGS and obtained a high concordance
(PPV=100%).
Taken together, we used high sequencing coverage and
a statistical test with several hard filters generated from
clinical samples to separate low MAF SNV/INDEL from false
positives. To balance the cost of NGS and accuracy of variant calls
for low MAF variants, we used pooled cell line models with certain
germ line SNP in different data size to get the relationship
accuracy between data size and variants. From this test, we
validated the best target median coverage (2000X) that can meet the
analysis requirement, whereas the low MAF variants detection needed
to be corrected by dPCR. On the other hand, the overall performance
of this assay was good in the ARMS-PCR test. However, our results
cannot meet the requirement of different variant types in clinical
use like other NGS-based approaches (17–20,39),
which is one of the most important aspects for NGS compared to
other traditional approaches. Furthermore, due to the DNA
requirement of dPCR verification and quantity of extraction in
plasma (40,41), this NGS-dPCR combined approach
could only be used in FFPE sample but not plasma. With the
advantages of non-invasive and overcome tumor-heterogeneity
(42–44), the sequencing of plasma sample
still needed more study. To reduce the sequencing errors confound
with rare mutations, a NGS method termed Duplex sequencing was
developed these years and may be useful in future plasma sequencing
(45–47). In addition, given the capability of
NGS test to detect variants with low MAF, the correlation between
the NGS clinical report and the effect of targeted therapy still
need further assessment (48).
Finally, our NCP assay can give more mutation information and thus
expand the treatment choices for patients, but more efforts still
need to be done for future cancer diagnostics.
References
|
1
|
Renfro LA, An MW and Mandrekar SJ:
Precision oncology: A new era of cancer clinical trials. Cancer
Lett. S0304-3835(16)30163-X. 2016. View Article : Google Scholar : PubMed/NCBI
|
|
2
|
Arteaga CL and Baselga J: Impact of
genomics on personalized cancer medicine. Clin Cancer Res.
18:612–618. 2012. View Article : Google Scholar : PubMed/NCBI
|
|
3
|
MacConaill LE, Van Hummelen P, Meyerson M
and Hahn WC: Clinical implementation of comprehensive strategies to
characterize cancer genomes: Opportunities and challenges. Cancer
Discov. 1:297–311. 2011. View Article : Google Scholar : PubMed/NCBI
|
|
4
|
Romano E, Schwartz GK, Chapman PB,
Wolchock JD and Carvajal RD: Treatment implications of the emerging
molecular classification system for melanoma. Lancet Oncol.
12:913–922. 2011. View Article : Google Scholar : PubMed/NCBI
|
|
5
|
Kwak EL, Bang YJ, Camidge DR, Shaw AT,
Solomon B, Maki RG, Ou SH, Dezube BJ, Jänne PA, Costa DB, et al:
Anaplastic lymphoma kinase inhibition in non-small-cell lung
cancer. N Engl J Med. 363:1693–1703. 2010. View Article : Google Scholar : PubMed/NCBI
|
|
6
|
Shaw AT, Kim DW, Nakagawa K, Seto T, Crinó
L, Ahn MJ, De Pas T, Besse B, Solomon BJ, Blackhall F, et al:
Crizotinib versus chemotherapy in advanced ALK-positive lung
cancer. N Engl J Med. 368:2385–2394. 2013. View Article : Google Scholar : PubMed/NCBI
|
|
7
|
Bollag G, Tsai J, Zhang J, Zhang C,
Ibrahim P, Nolop K and Hirth P: Vemurafenib: The first drug
approved for BRAF-mutant cancer. Nat Rev Drug Discov. 11:873–886.
2012. View
Article : Google Scholar : PubMed/NCBI
|
|
8
|
Garraway LA and Lander ES: Lessons from
the cancer genome. Cell. 153:17–37. 2013. View Article : Google Scholar : PubMed/NCBI
|
|
9
|
Pao W: New approaches to targeted therapy
in lung cancer. Proc Am Thorac Soc. 9:72–73. 2012. View Article : Google Scholar : PubMed/NCBI
|
|
10
|
Thomas RK, Baker AC, Debiasi RM, Winckler
W, Laframboise T, Lin WM, Wang M, Feng W, Zander T, MacConaill L,
et al: High-throughput oncogene mutation profiling in human cancer.
Nat Genet. 39:347–351. 2007. View
Article : Google Scholar : PubMed/NCBI
|
|
11
|
MacConaill LE, Campbell CD, Kehoe SM, Bass
AJ, Hatton C, Niu L, Davis M, Yao K, Hanna M, Mondal C, et al:
Profiling critical cancer gene mutations in clinical tumor samples.
PLoS One. 4:e78872009. View Article : Google Scholar : PubMed/NCBI
|
|
12
|
Tao YF, Wu D, Pang L, Zhao WL, Lu J, Wang
N, Wang J, Feng X, Li YH, Ni J, et al: Analyzing the gene
expression profile of pediatric acute myeloid leukemia with
real-time PCR arrays. Cancer Cell Int. 12:1946–1958. 2012.
|
|
13
|
McCourt CM, Boyle D, James J and
Salto-Tellez M: Immunohistochemistry in the era of personalised
medicine. J Clin Pathol. 66:58–61. 2013. View Article : Google Scholar
|
|
14
|
Forbes SA, Bindal N, Bamford S, Cole C,
Kok CY, Beare D, Jia M, Shepherd R, Leung K, Menzies A, et al:
COSMIC: Mining complete cancer genomes in the Catalogue of Somatic
Mutations in Cancer. Nucleic Acids Res. 39(Database issue):
D945–D950. 2010. View Article : Google Scholar : PubMed/NCBI
|
|
15
|
Lawrence MS, Stojanov P, Mermel CH,
Robinson JT, Garraway LA, Golub TR, Meyerson M, Gabriel SB, Lander
ES and Getz G: Discovery and saturation analysis of cancer genes
across 21 tumour types. Nature. 505:495–501. 2014. View Article : Google Scholar : PubMed/NCBI
|
|
16
|
Lawrence MS, Stojanov P, Polak P, Kryukov
GV, Cibulskis K, Sivachenko A, Carter SL, Stewart C, Mermel CH,
Roberts SA, et al: Mutational heterogeneity in cancer and the
search for new cancer-associated genes. Nature. 499:214–218. 2013.
View Article : Google Scholar : PubMed/NCBI
|
|
17
|
Frampton GM, Fichtenholtz A, Otto GA, Wang
K, Downing SR, He J, Schnall-Levin M, White J, Sanford EM, An P, et
al: Development and validation of a clinical cancer genomic
profiling test based on massively parallel DNA sequencing. Nat
Biotechnol. 31:1023–1031. 2013. View
Article : Google Scholar : PubMed/NCBI
|
|
18
|
Hovelson DH, McDaniel AS, Cani AK, Johnson
B, Rhodes K, Williams PD, Bandla S, Bien G, Choppa P, Hyland F, et
al: Development and validation of a scalable next-generation
sequencing system for assessing relevant somatic variants in solid
tumors. Neoplasia. 17:385–399. 2015. View Article : Google Scholar : PubMed/NCBI
|
|
19
|
Choudhary A, Mambo E, Sanford T,
Boedigheimer M, Twomey B, Califano J, Hadd A, Oliner KS, Beaudenon
S, Latham GJ, et al: Evaluation of an integrated clinical workflow
for targeted next-generation sequencing of low-quality tumor DNA
using a 51-gene enrichment panel. BMC Med Genomics. 7:622014.
View Article : Google Scholar : PubMed/NCBI
|
|
20
|
Cheng DT, Mitchell TN, Zehir A, Shah RH,
Benayed R, Syed A, Chandramohan R, Liu ZY, Won HH, Scott SN, et al:
Memorial Sloan Kettering-Integrated Mutation Profiling of
Actionable Cancer Targets (MSK-IMPACT): A hybridization
capture-based next-generation sequencing clinical assay for solid
tumor molecular oncology. J Mol Diagn. 17:251–264. 2015. View Article : Google Scholar : PubMed/NCBI
|
|
21
|
Cibulskis K, McKenna A, Fennell T, Banks
E, DePristo M and Getz G: ContEst: Estimating cross-contamination
of human samples in next-generation sequencing data.
Bioinformatics. 27:2601–2602. 2011.PubMed/NCBI
|
|
22
|
Gerlinger M, Rowan AJ, Horswell S, Larkin
J, Endesfelder D, Gronroos E, Martinez P, Matthews N, Stewart A,
Tarpey P, et al: Intratumor heterogeneity and branched evolution
revealed by multiregion sequencing. N Engl J Med. 366:883–892.
2012. View Article : Google Scholar : PubMed/NCBI
|
|
23
|
Kinz E, Leiherer A, Lang AH, Drexel H and
Muendlein A: Accurate quantitation of JAK2 V617F allele burden by
array-based digital PCR. Int J Lab Hematol. 37:217–224. 2015.
View Article : Google Scholar
|
|
24
|
Shao D1, Lin Y, Liu J, Wan L, Liu Z, Cheng
S, Fei L, Deng R, Wang J, Chen X, et al: A targeted next-generation
sequencing method for identifying clinically relevant mutation
profiles in lung adenocarcinoma. Sci Rep. 6:223382016. View Article : Google Scholar : PubMed/NCBI
|
|
25
|
Forbes SA1, Tang G, Bindal N, Bamford S,
Dawson E, Cole C, Kok CY, Jia M, Ewing R, Menzies A, et al: COSMIC
(the Catalogue of Somatic Mutations in Cancer): A resource to
investigate acquired mutations in human cancer. Nucleic Acids Res.
8(Database issue): D652–D657. 2009.
|
|
26
|
Abecasis GR, Altshuler D, Auton A, Brooks
LD, Durbin RM, Gibbs RA, Hurles ME and McVean GA; 1000 Genomes
Project Consortium. A map of human genome variation from
population-scale sequencing. Nature. 467:1061–1073. 2010.
View Article : Google Scholar : PubMed/NCBI
|
|
27
|
Warrick JI, Hovelson DH, Amin A, Liu CJ,
Cani AK, McDaniel AS, Yadati V, Quist MJ, Weizer AZ, Brenner JC, et
al: Tumor evolution and progression in multifocal and paired
non-invasive/invasive urothelial carcinoma. Virchows Arch.
466:297–311. 2015. View Article : Google Scholar
|
|
28
|
Li H and Durbin R: Fast and accurate
long-read alignment with Burrows-Wheeler transform. Bioinformatics.
26:589–595. 2010. View Article : Google Scholar : PubMed/NCBI
|
|
29
|
McKenna A, Hanna M, Banks E, Sivachenko A,
Cibulskis K, Kernytsky A, Garimella K, Altshuler D, Gabriel S, Daly
M, et al: The Genome Analysis Toolkit: A MapReduce framework for
analyzing next-generation DNA sequencing data. Genome Res.
20:1297–1303. 2010. View Article : Google Scholar : PubMed/NCBI
|
|
30
|
DePristo MA, Banks E, Poplin R, Garimella
KV, Maguire JR, Hartl C, Philippakis AA, del Angel G, Rivas MA,
Hanna M, et al: A framework for variation discovery and genotyping
using next-generation DNA sequencing data. Nat Genet. 43:491–498.
2011. View
Article : Google Scholar : PubMed/NCBI
|
|
31
|
Li H, Handsaker B, Wysoker A, Fennell T,
Ruan J, Homer N, Marth G, Abecasis G and Durbin R; 1000 Genome
Project Data Processing Subgroup. The sequence alignment/map format
and SAMtools. Bioinformatics. 25:2078–2079. 2009. View Article : Google Scholar : PubMed/NCBI
|
|
32
|
Arsenic R, Treue D, Lehmann A, Hummel M,
Dietel M, Denkert C and Budczies J: Comparison of targeted
next-generation sequencing and Sanger sequencing for the detection
of PIK3CA mutations in breast cancer. BMC Clin Pathol. 15:202015.
View Article : Google Scholar : PubMed/NCBI
|
|
33
|
Borad MJ, Champion MD, Egan JB, Liang WS,
Fonseca R, Bryce AH, McCullough AE, Barrett MT, Hunt K, Patel MD,
et al: Integrated genomic characterization reveals novel,
therapeutically relevant drug targets in FGFR and EGFR pathways in
sporadic intrahepatic cholangiocarcinoma. PLoS Genet.
10:e10041352014. View Article : Google Scholar : PubMed/NCBI
|
|
34
|
Hadd AG, Houghton J, Choudhary A, Sah S,
Chen L, Marko AC, Sanford T, Buddavarapu K, Krosting J, Garmire L,
et al: Targeted, high-depth, next-generation sequencing of cancer
genes in formalin-fixed, paraffin-embedded and fine-needle
aspiration tumor specimens. J Mol Diagn. 15:234–247. 2013.
View Article : Google Scholar : PubMed/NCBI
|
|
35
|
Roychowdhury S, Iyer MK, Robinson DR,
Lonigro RJ, Wu YM, Cao X, Kalyana-Sundaram S, Sam L, Balbin OA,
Quist MJ, et al: Personalized oncology through integrative
high-throughput sequencing: A pilot study. Sci Transl Med.
3:111ra1212011. View Article : Google Scholar : PubMed/NCBI
|
|
36
|
Kerick M, Isau M, Timmermann B, Sültmann
H, Herwig R, Krobitsch S, Schaefer G, Verdorfer I, Bartsch G,
Klocker H, et al: Targeted high throughput sequencing in clinical
cancer settings: Formaldehyde fixed-paraffin embedded (FFPE) tumor
tissues, input amount and tumor heterogeneity. BMC Med Genomics.
4:682011. View Article : Google Scholar : PubMed/NCBI
|
|
37
|
Schweiger MR, Kerick M, Timmermann B,
Albrecht MW, Borodina T, Parkhomchuk D, Zatloukal K and Lehrach H:
Genome-wide massively parallel sequencing of formaldehyde
fixed-paraffin embedded (FFPE) tumor tissues for copy-number- and
mutation-analysis. PLoS One. 4:e55482009. View Article : Google Scholar : PubMed/NCBI
|
|
38
|
Chevrier S, Arnould L, Ghiringhelli F,
Coudert B, Fumoleau P and Boidot R: Next-generation sequencing
analysis of lung and colon carcinomas reveals a variety of genetic
alterations. Int J Oncol. 45:1167–1174. 2014.PubMed/NCBI
|
|
39
|
Cottrell CE, Al-Kateb H, Bredemeyer AJ,
Duncavage EJ, Spencer DH, Abel HJ, Lockwood CM, Hagemann IS, O'Guin
SM, Burcea LC, et al: Validation of a next-generation sequencing
assay for clinical molecular oncology. J Mol Diagn. 16:89–105.
2014. View Article : Google Scholar
|
|
40
|
Haber DA and Velculescu VE: Blood-based
analyses of cancer: Circulating tumor cells and circulating tumor
DNA. Cancer Discov. 4:650–661. 2014. View Article : Google Scholar : PubMed/NCBI
|
|
41
|
Arnedos M, Vicier C, Loi S, Lefebvre C,
Michiels S, Bonnefoi H and Andre F: Precision medicine for
metastatic breast cancer--limitations and solutions. Nat Rev Clin
Oncol. 12:693–704. 2015. View Article : Google Scholar : PubMed/NCBI
|
|
42
|
Newman AM, Bratman SV, To J, Wynne JF,
Eclov NC, Modlin LA, Liu CL, Neal JW, Wakelee HA, Merritt RE, et
al: An ultrasensitive method for quantitating circulating tumor DNA
with broad patient coverage. Nat Med. 20:548–554. 2014. View Article : Google Scholar : PubMed/NCBI
|
|
43
|
Ignatiadis M and Dawson SJ: Circulating
tumor cells and circulating tumor DNA for precision medicine: Dream
or reality? Ann Oncol. 25:2304–2313. 2014. View Article : Google Scholar : PubMed/NCBI
|
|
44
|
Lipson EJ, Velculescu VE, Pritchard TS,
Sausen M, Pardoll DM, Topalian SL and Diaz LA Jr: Circulating tumor
DNA analysis as a real-time method for monitoring tumor burden in
melanoma patients undergoing treatment with immune checkpoint
blockade. J Immunother Cancer. 2:422014. View Article : Google Scholar : PubMed/NCBI
|
|
45
|
Schmitt MW, Kennedy SR, Salk JJ, Fox EJ,
Hiatt JB and Loeb LA: Detection of ultra-rare mutations by
next-generation sequencing. Proc Natl Acad Sci USA.
109:14508–14513. 2012. View Article : Google Scholar : PubMed/NCBI
|
|
46
|
Kennedy SR, Schmitt MW, Fox EJ, Kohrn BF,
Salk JJ, Ahn EH, Prindle MJ, Kuong KJ, Shen JC, Risques RA, et al:
Detecting ultralow-frequency mutations by Duplex Sequencing. Nat
Protoc. 9:2586–2606. 2014. View Article : Google Scholar : PubMed/NCBI
|
|
47
|
Newman AM, Lovejoy AF, Klass DM, Kurtz DM,
Chabon JJ, Scherer F, Stehr H, Liu CL, Bratman SV, Say C, et al:
Integrated digital error suppression for improved detection of
circulating tumor DNA. Nat Biotechnol. 34:547–555. 2016. View Article : Google Scholar : PubMed/NCBI
|
|
48
|
Luo H, Li H, Hu Z, Wu H, Liu C, Li Y,
Zhang X, Lin P, Hou Q, Ding G, et al: Noninvasive diagnosis and
monitoring of mutations by deep sequencing of circulating tumor DNA
in esophageal squamous cell carcinoma. Biochem Biophys Res Commun.
471:596–602. 2016. View Article : Google Scholar : PubMed/NCBI
|