Introduction
Neuroblastoma is a childhood malignancy arising from
primitive neuroblasts of the sympathetic part of the peripheral
nervous system. The disease is characterized by evident age
dependence, which affects prevalence and prognosis (1). Hence, neuroblastoma is the most
common type of tumor diagnosed in infancy, and the majority of
cases are diagnosed in patients up to 5 years of age (after
http://www.cancer.org/cancer/neuroblastoma/detailedguide/neuroblastoma-key-statistics).
More importantly, children above 18 months of age
have poor prognosis for overall survival (2). It should be stressed that
heterogeneity is an intrinsic feature of neuroblastoma, despite
limited landscape of genetic alterations (3). Thus, on the one hand, the disease may
spontaneously regress in some patients, but on the other hand in
about half of patients advanced aggressive tumors are diagnosed,
which demand intensive multiagent and multimodal treatment
(4). The fact that children with
high risk neuroblastoma have poor prognosis fuels approaches to
broaden treatment options for the group of patients.
GD2-ganglioside (GD2), a cell surface-exposed and
sialic acid-containing glycosphingolipid, is a marker of
neuroblastoma and a relevant target for anti-neuroblastoma
immunotherapy with monoclonal antibodies (5). Since 2015, the treatment options for
high risk patients that at least partially responded to first line
therapy were widened with FDA-approval of a chimeric human mouse
monoclonal antibody dinutuximab (ch14.18) (6). The antibody is used in line with
13-cis retinoic acid, IL-2 and GM-CSF to control minimal
residual disease (7). Other
GD2-specific antibodies such as mouse monoclonal antibodies 14G2a
(sharing a paratope with ch14.18) or 3F8 either had been or are
continuously being tested in clinics, respectively (5).
Several researchers have set goals to investigate
mechanism of interactions of ganglioside-binding antibodies with
cancer cells (reviewed in ref. 8).
It is evident that, in addition to involvement of antibodies in
immune-based mechanisms of cancer eradication, direct cytotoxic
effects may result from binding of antibodies to tumor cells. Such
data, including ours, are also available for anti-GD2 ganglioside
antibodies and neuroblastoma (9,10).
Thus, we showed that some neuroblastoma cell lines are sensitive to
direct cytotoxicity of the anti-GD2 antibody 14G2a (mAb).
Furthermore, we have already reported an increase in p53, but a
drop of MYCN in nuclear protein fractions, a decrease in Aurora A
kinase, and downregulation of activity of the Akt/mTOR signaling
network, which correlated with decreased cellular ATP levels in
IMR-32 neuroblastoma cells after the mAb treatment (10,11).
Also, we were able to show that 13-cis retinoic acid, Aurora
A inhibitor MK-5108, a dual PI3K and mTOR inhibitor BEZ-235, when
combined with 14G2a, can further decrease cellular ATP levels in
some neuroblastoma cell lines (10,11).
The data add to efforts to screen for new drug combinations to
improve survival of cancer patients.
Integrins are a group of transmembrane proteins
connecting cells to extracellular matrix of intercellular spaces
and basement membranes, via binding to proteins such as
fibronectin, collagens, laminin and vitronectin. The receptors are
responsible for signal transduction regulated from cell outside,
after ligand-induced activation of integrin complexes, and from
cell inside, due to activity of specific protein complexes
associating with cytoplasmic domains of integrins (12,13).
In mammals, 24 heterodimeric complexes, differing in their ligand
selectivity, can be formed utilizing one of 18 α and one of 8 β
subunits (12). In cancer cells,
roles of specific integrin subunits or complexes in regulation of
migration, survival, angiogenesis and metastasis are intensively
studied (14). Characterization of
biological roles of integrins fuelled development and clinical
trials of their antagonists, in the form of antibodies such as
etaracizumab (15), volociximab
(16), and inhibitors, e.g.,
cilengitide (17). Some links
between neuroblastoma phenotype and integrins have also been
established. Thus, in 2015 Young et al (18) showed that integrin α4 may be
correlated with poor outcome of neuroblastoma patients diagnosed
with tumors without MYCN amplification and possibly allows
for their further classification. Also, Lee et al (19) showed that overexpression of
gastrin-releasing peptide in neuroblastoma increases expression of
integrins α2, α3, β1 and used siRNA to show that integrin β1 was
necessary for SK-N-SH migration. Additionally, links between tumor
cell attachment, integrins and gangliosides are one of the areas of
research. Cheresh et al (20) reported that M21 human melanoma
cells are detached from fibronectin-coated wells by the anti-GD3
ganglioside (GD3) MB3.6 mAb. Ohkawa et al (21) found that GD3-positive melanoma
cells exhibited stronger adhesion to collagen I and collagen IV, as
compared to GD3-negative counterparts. They also showed that β1
integrin and GD3 co-localized at points of focal adhesion.
One of the features often observed in cells cultures
treated with ganglioside binding antibodies are changes in their
morphology, i.e., more rounded appearance, aggregation, loose
surface adherence, or detachment. Thus, Dippold et al
(22) reported such changes in a
panel of melanoma cell lines treated with the anti-GD3 mouse R-24
mAb. Cochonneau et al (9)
showed morphology changes of IMR-5 cells treated with the
anti-O-acetyl GD2 8B6 and the anti-GD2 10B8 mAbs. We noted
such features in IMR-32 and LA-N-1 neuroblastoma cell cultured with
the anti-GD2 14G2a mAb (10,23).
Also, we showed that 14G2a in a dose-dependent manner interferes
with attachment of IMR-32 cells to fibronectin (23). Therefore, we applied selective
inhibitors of integrin complexes α1β1 (obtustatin) (24), α4β1 (BIO 1211) (25) and αVβ3/αVβ5 [cilen-gitide (26), SB273005 (27)] to seek answers whether inhibition
of integrin binding to extracellular matrix proteins affects
sensitivity of neuroblastoma cells to treatment with the anti-GD2
14G2a mAb.
Based on our previous results, we used five
GD2-positive neuroblastoma cell lines with varying sensitivity to
the 14G2a mAb (10), i.e., IMR-32,
LA-N-1, LA-N-5, CHP-134, Kelly and GD2-negative SK-N-SH cells to
characterize expression of some integrin subunits and complexes.
Also, we measured effects of the aforementioned inhibitors on cell
attachment and survival. Finally, as our goal was to broaden
knowledge on factors affecting cytotoxicity of the 14G2a mAb
against neuroblastoma cell lines, we report effects of the
inhibitors and the 14G2a mAb, used as single agents or combined, on
attachment and cell survival.
Materials and methods
Cell culture of neuroblastoma cell
lines
In our experiments, we used six human neuroblastoma
cell lines obtained from cell collections, i.e., IMR-32 (ATTC, LCG
Standards, Lomianki, Poland; cat no. CCL-127), LA-N-1 (ECACC,
Sigma-Aldrich, Poznan, Poland; cat. no. 06041201), CHP-134 (ECACC,
cat. no. 06122002), LA-N-5 (cat. no. ACC 673; Leibniz-Institut
DSMZ-Deutsche Sammlung von Mikroorganismen und Zellkulturen GmbH),
Kelly (cat. no. ACC 355; DSMZ) and SK-N-SH (cat. no. ATCC HTB11).
Cells were cultured in 5% CO2 atmosphere in media as
previously described in detail (10).
Anti-GD2 ganglioside antibody
purification
The hybridoma cell line producing the 14G2a mAb,
which is a mouse IgG2a that binds to GD2, was kindly provided by Dr
R.A. Reisfeld (Scripps Research Institute, La Jolla, CA, USA). Cell
culture and the antibody purification from fetal bovine serum (FBS)
free-cell culture supernatant using HiTrap™ Protein G columns (cat.
no. 17-0404-03; GE Healthcare Bio-Sciences AB, Uppsala, Sweden)
were previously described in detail (10).
Detection of integrins expressed on
neuroblastoma cell lines with a cell adhesion array
Analyses of integrin content of cells were performed
with Alpha/Beta Integrin-Mediated Cell Adhesion Array Combo kit
(cat. no. ECM532; Chemicon International, Merck Sp. z o.o.,
Warszawa, Poland) with protocol optimized based on the
manufacturer's suggestions. Prior to the tests, neuroblastoma cells
were detached from culture plastic vessels with 2 mM EDTA in
phosphate-buffered saline (PBS, cat. no. PBS404.2;
BioShop® Canada, Lab Empire, Rzeszów, Poland), at room
temperature and then centrifuged (for 10 min, at 4°C, at 315 × g).
The cell pellets were resuspended in assay buffer provided by the
kit manufacturer and cells were counted using the trypan blue
exclusion method. Between 0.1×10⁶ and 0.2×10⁶
of cells in 100 µl of assay buffer (depending on the cell
line tested) were added per well, followed by incubation for 2 h at
37°C in an incubator with 5% of CO2. Single wells with
antibodies binding respective integrin subunits or complexes (also
single negative control wells, NC) were used per experiment. Then,
the cells were processed according to the manufacturer's
instructions. Signals of absorbance at 560 nm were collected with
an Infinite M200 reader (Tecan Schweiz AG, Männedorf, Switzerland).
To normalize signals between experiments, we calculated ratios
between signals from wells coated with, respective, anti-integrin
antibodies and signals of negative control wells (NC). Two
experiments are shown for IMR-32, CHP-134, LA-N-5, Kelly (marked as
ex-1, ex-2 in Fig. 4). One
experiment was performed for LA-N-1 cells.
Flow cytometry
Cells were detached using 2 mM EDTA in PBS at room
temperature, and 2% FBS in PBS (FBS, cat. no. 10270-106; Life
Technologies, Warszawa, Poland) was used for cell staining and
washing. Following antibodies were applied: the 14G2a mAb for GD2
staining, while PK136 mAb (mouse IgG2a) (10) was used as an isotype control;
FITC-conjugated anti-CD49d (integrin α4) antibody (IgG1, cat. no.
304315; BioLegend, BioCourse.pl, Katowice, Poland), while
FITC-conjugated mouse IgG1 mAb (cat. no. 400109; BioLegend) was
used as an isotype control; mouse anti-human CD29 (integrin β1) mAb
(IgG1, cat. no. 303001; BioLegend), mouse anti-human integrin αVβ3
mAb (IgG1, cat. no. MAB1976Z; EMD Millipore Corp.), mouse
anti-human integrin αVβ5 mAb (IgG1, cat. no. MAB1961Z; EMD
Millipore), while purified mouse IgG1 was used as an isotype
control (cat. no. 554721; BD Biosciences, Diag Med, Warszawa,
Poland). Were appropriate, mouse Ig-specific FITC-conjugated goat
F(ab')2 fragments (cat. no. 55526; Cappel, MP
Biomedicals, LLC, Warszawa, Poland) were used to detect binding of
the primary antibodies. Cells were analyzed using flow cytometer
BD™ LSR II with BD FACSDiva software (BD Biosciences, Warszawa,
Poland). Single cells were analyzed. Dead cells were excluded with
7-AAD viability staining solution (cat. no. 420403; BioLegend). For
GD2 analyses, histograms showing levels of FITC fluorescence were
analyzed. Pools of the positively stained cells were gated based on
the signals from control cell samples, in which the PK136 mAb was
used instead of the 14G2a mAb for staining (Table I). For measurements of integrin
expression, scatter plots (showing levels of 7-AAD fluorescence vs.
levels of FITC fluorescence) were analyzed. Gates to measure
percentage of positively stained cells of the analyzed pools were
set based on signals from cells stained with respective isotype
control antibodies (Table
II).
 | Table IFlow cytometric analysis of GD2
expression on neuroblastoma cell lines.a |
Table I
Flow cytometric analysis of GD2
expression on neuroblastoma cell lines.a
| Cell line | Percentage of
positive staining (%) | Median fluorescence
intensity (MFI) |
|---|
| IMR-32 | 95.1 | 37018 |
| CHP-134 | 98.6 | 31427 |
| LA-N-5 | 97.1 | 40311 |
| Kelly | 93.8 | 37872 |
| SK-N-SH | 1 | –b |
| Table IIFlow cytometric analysis of selected
integrin expression on neuroblastoma cell lines.a |
Table II
Flow cytometric analysis of selected
integrin expression on neuroblastoma cell lines.a
| α4 (%) | β1 (%) | αVβ3 (%) | αVβ5 (%) |
|---|
| IMR-32 | 31.1±7.3 | 68.0±0.5 | 0.3±0.2 | 0.2±0.1 |
| CHP-134 | 2.8±0.6 | 96.4±0.1 | 2.2±0.5 | 2.1±0.5 |
| LA-N-5 | 1.2±0.4 | 71.1±8.5 | 1.8±0.0 | 3.0±0.4 |
| Kelly | 6.5±0.5 | 84.7±3.3 | 2.2±0.2 | 62.2±6.5 |
| SK-N-SH | 70.1±6.4 | 99.6±0.3 | 88.5±5.2 | 86.4±10.4 |
Plates used in experiments
We used several types of 96- or 6-well plates for
cell culture. The plates include: a standard cell culture plate
(cat. no. 353072; BD Falcon, Immunogen Polska, Chorzów, Poland),
white/clear tissue culture treated plates (cat. no. 353377; BD
Falcon, Immunogen Polska), human vitronectin coated plates (BSA,
bovine serum albumin-blocked by the manufacturer, with only
BSA-blocked wells included on the same plate, cat. no. CWP003;
R&D Systems, Biokom Sp.j, Janki, Poland), Nunclon™ Sphera™ flat
bottom cellware (cat. no. 174927; Thermo Fisher Scientific,
Biokom), collagen type IV plates (cat. no. 354429; BD BioCoat™,
Immunogen Polska); and human fibronectin cellware (cat. no. 354409;
Corning BioCoat™, Immunogen Polska, cat. no. 354402; Corning
BioCoat™, Diag Med). For some attachment assays and for western
blots, cells were grown on wells coated with human vitronectin
(cat. no. G5381; Promega Gmbh, Mannheim, Germany) and blocked with
BSA (cat. no. A9418; Sigma-Aldrich) based on the manufacturer's
protocol.
Scrambled and GD2-mimicking peptides,
integrin inhibitors
#94-12-F/W-AAEGD peptide [GD2 MIMIC
(RCNPNMEPPRCWAAEGD) (28,29)] and the scrambled peptide [SCR
CONTROL (NPERCNRWMPCPAEADG)] were obtained from GenScript Biotech
Corp. (Piscataway, NY, USA; dissolved in water). We used four
integrin inhibitors: obtustatin, an inhibitor of α1β1 (dissolved in
water, cat. no. 4664; Tocris Bioscience, Biokom); BIO 1211, an
inhibitor of active α4β1 (dissolved in 20X PBS, cat. no. 3910,
Tocris Bioscience, Biokom); cilengitide, an inhibitor of αVβ3 and
αVβ5 (dissolved in DMSO, cat. no. S7077; Selleck Chemicals LLC,
STI, Poznań, Poland); and SB273005, an inhibitor of αVβ3 and αVβ5
(dissolved in DMSO, cat. no. S7540; Selleck Chemicals LLC,
STI).
Treatment of cells with the 14G2a mAb,
the peptides and the inhibitors of integrins
Prior to the tests, neuroblastoma cells were
detached from culture plastic with 2 mM EDTA in PBS, at room
temperature, and then centrifuged (for 10 min, at 4°C, at 139 × g).
The cell pellets were resuspended in respective complete media and
counted using the trypan blue exclusion method. The seeding density
for IMR-32 and LA-N-1 was 2×10⁴ cells/100 µl/well
and for CHP-134, LA-N-5, Kelly, SK-N-SH was 5×10³
cells/100 µl/well. For 14G2a-treatment of cells, the
antibodies in PBS were added (control samples were treated with PBS
alone when necessary). All samples with cells were incubated on ice
for 1 h with mixing after every 15 min of incubation, before
transfer of 100 µl to wells of respective plates.
Where appropriate, inhibitors (see above) were added
to cells, after incubation with the 14G2a mAb (controls treated
with solvents of inhibitors were included where necessary).
Obtustatin was tested at the concentrations of 0.012, 0.06, 0.3 and
1.5 µM; BIO 1211 was tested at the concentrations of 1, 2.5
and 5 µM; cilengitide was tested at the concentrations of 3
and 10 µM; and SB273005 was tested at the concentrations
0.3, 1, 3, 10 and 30 µM.
For testing of effects of #94-12-F/W-AAEGD or
scrambled control peptides on cytotoxicity of the 14G2a mAb, the
seeding density for IMR-32 and CHP-134 cell lines was
2×10⁴ cells/100 µl/well to better fit microscopic
examinations. The peptides were added to cells after incubation
with antibodies on ice (from 10 mM stock solution) to the final
concentrations of 0.23 or 0.114 mM. Separate controls cells (when
necessary) were also treated with peptides, and/or diluent of
peptides, and/or PBS (diluent for 14G2a) to check for any effects
on cellular ATP levels.
After the above treatments, cells were incubated for
72 h at 37°C in an incubator with 5% of CO2. On the
third day of incubation microscopic pictures were taken of some
cell cultures using the Leica microscope DM IL LED Fluo equipped
with the DFC450C camera, using 10x-(506263, HI PLAN I, 10x/0.22) or
×20-magnification objectives (506264, HI PLAN I, 20x/0.30) and
collected using the Leica Application Suite Version 4.3.0 (Leica
Microsystems GMBH, Wetzlar, Germany). Cellular survival (based on
measurements of ATP levels) or caspase-3/-7 activities were
determined as described below.
For attachment assays, the seeding density for all
cell lines was 2×10⁴ cells/100 µl/well. Cells
were treated with integrin inhibitors, 14G2a, or their combinations
(see above), and then incubated for 2 h at 37°C in an incubator
with 5% of CO2. Control cells treated with diluents were
included (were necessary). Next, unattached cells were removed by
inversion of plates, while the remaining cells were analyzed using
cellular ATP measurements (see below). For western blot analysis,
LA-N-5, Kelly and SK-N-SH cells were treated with 3 µM
SB273005 for 6 and 24 h, IMR-32 cells were treated with 5 µM
BIO 1211 for 6 and 24 h. Control cells were treated with
diluents.
Measurements of viable cell number
through determination of levels of ATP and analysis of apoptosis
through determination of caspase-3/-7 activities in cell
cultures
We used an ATP assay as a sensitive method to
estimate viable cell number in attachment experiments, and to
determine effects of tested agents (the 14G2a mAb, the peptides and
the integrin inhibitors) on neuroblastoma cell viability
(proliferation and cytotoxicity). Cellular ATP contents were
analyzed using ATPlite, luminescence ATP detection assay system
(cat. no. 6016947; Perkin-Elmer, Warszawa, Poland) based on the
protocol of the manufacturer to measure cell survival in
experiments. For measurements of activities of apoptosis-executing
caspase-3/-7, we used Caspase-Glo® 3/7 assay (cat. no.
G8091; Promega) according to the manufacturer's protocol. Where
necessary, equal volumes of cell lysates were transferred to white
plates and luminescence signals were collected using the Infinite
M200 reader.
Western blot analysis
Cells were collected using trypsin-EDTA (cat. no.
T3924; Sigma-Aldrich) and centrifuged for 5 min (2,500 × g at 4°C).
Cell pellets were washed twice with ice-cold PBS (with
centrifugation steps to recover cells as pellet). Next, cells were
lysed with gentle mixing by inversion (for 45 min, at 4°C) using
buffer containing: 25 mM Tris-HCl (pH 7.6, cat. no. TRS001.1;
BioShop), 10 mM NaCl (cat. no. 794121116; Avantor Performance
Materials Poland S.A., POCH, Gliwice, Poland), 1% NP-40 (cat. no.
NON999.500; BioShop), 1% sodium deoxycholate (cat. no. D6570;
Sigma-Aldrich), 0.1% SDS (cat. no. L4390; Sigma-Aldrich), Halt
Phosphatase Inhibitor Cocktail (cat. no. 78420; Thermo Fisher
Scientific, ALAB Laboratoria, Warszawa, Poland), and Complete
Protease Inhibitor Cocktail (cat. no. 11697498001; Roche, Warszawa,
Poland). Then, samples were centrifuged 14,000 × g, at 4°C, for 15
min. Samples were resolved using SDS-PAGE (12% gels) as described
in detail (10). Western blot
analyses were performed with application of the following
antibodies (all from Cell Signaling Technology-Lab-JOT Ltd.,
Warszawa, Poland): anti-FAK (cat. no. 13009, dilution 1:1,00),
anti-phospho-FAK (Tyr397) (cat. no. 8556, dilution 1:1,000),
anti-α-tubulin (cat. no. 2125, dilution 1,000–2,000), anti-rabbit
IgG, HRP-linked antibody (cat. no. 7074, 1:2,000). Chemiluminescent
signals were developed with the Immobilon Western HRP Substrate
(cat. no. WBKLS0500; Millipore, Warszawa, Poland) and collected
using the MicroChemi System (DNR Bio Imaging Systems, ALAB
Laboratoria, Warszawa, Poland).
Statistical analyses
Multivariate analysis was performed with one-way
repeated measures ANOVA with a Greenhouse-Geisser correction. Then,
we performed post hoc pairwise comparisons by Dunnett's test at the
significance levels set at 0.05, 0.01, 0.001 were applicable. In
multivariate analyses data were analyzed without normalization
(30). Data shown on graphs were
normalized to control set as 1 for clarity. Data on graphs (except
for Fig. 4) are presented as means
of experiments (n, numbers of experiments performed were from 2 to
5, performed in duplicate, triplicate or quadruplicate, as
described in the figure legends) ± SEM (a standard error of the
mean). Data in Table II are
presented as means of two experiments ± SEM. Some normalized
samples were analyzed using two-sample t-tests, comparing, e.g.,
values of control cells with values of treated cells to measure
statistical significance [p-values: P<0.05, P<0.01,
P<0.001]. Statistical analyses were performed with the OriginPro
2017 (b9.4.0.220; OriginLab Corp., Northampton, MA, USA; one-way
repeated measures ANOVA) and Microsoft Excell (Microsoft Corp., Way
Redmond, WA, USA; t-tests). Microsoft software was used for the
preparation of the graphs.
Results
A peptide mimicking GD2 ganglioside
blocks cytotoxic effects of 14G2a mAb
Phage-displayed peptide libraries can be screened
with monoclonal antibodies with various specificities and yield
mimicking peptides binding to the screening molecules and
inhibiting interactions with the cognate antigens. Previously, we
reported optimization and characterization of binding to the 14G2a
mAb of cyclic peptides mimicking GD2 ganglioside (28,29).
In the present study, we show that peptide #94-12F/W-AAEGD
(RCNPNMEPPRCWAAEGD, marked as GD2 MIMIC in Fig. 1), used at the concentration 0.23 mM
(also 0.114 mM concentration; data not shown), can abolish the
cytotoxic effects of the 14G2a mAb as compared to the control
scrambled sequence (marked as SCR PEPTIDE, NPERCNRWMPCPAEADG).
IMR-32 and CHP-134 cells grown in the presence of the 14G2a mAb
exhibited morphological changes such as cell aggregation. The
effects were abolished by the GD2 MIMIC (Fig. 1A, images taken 72 h after
incubation). Also, for both cell lines, the ATP levels in the
presence of the GD2 MIMIC and the 14G2a mAb were statistically
significantly higher than in cells treated with the SCR PEPTIDE and
the mAb (Fig. 1B; GD2 MIMIC +
14G2a vs. SCR PEPTIDE + 14G2a by Dunnett's test with the
significance level set at 0.001; and Fig. 1C, GD2 MIMIC + 14G2a vs. SCR PEPTIDE
+ 14G2a by Dunnett's test with the significance level set at 0.05).
There was no statistically significant difference between ATP cell
levels in samples treated with 14G2a or 14G2a and SCR peptide
(Dunnett's test), thus, the scrambled control peptide did not
affect sensitivity of cells to the mAb. Moreover, there was no
statistically significant difference between cells treated with SCR
PEPTIDE and GD2 MIMIC (Dunnett's test). Therefore, the fact that
the GD2 mimicking peptide, but not the control sequence, eliminated
the cytotoxic effects of 14G2a confirms that the observed effects
rely on binding of the mAb to GD2 ganglioside. In our previous
study, we used the PK136 mAb as a negative control (10). Hence, the data obtained with the
peptide provide additional evidence that the cytotoxic effects of
14G2a are specific and require binding between GD2 and 14G2a.
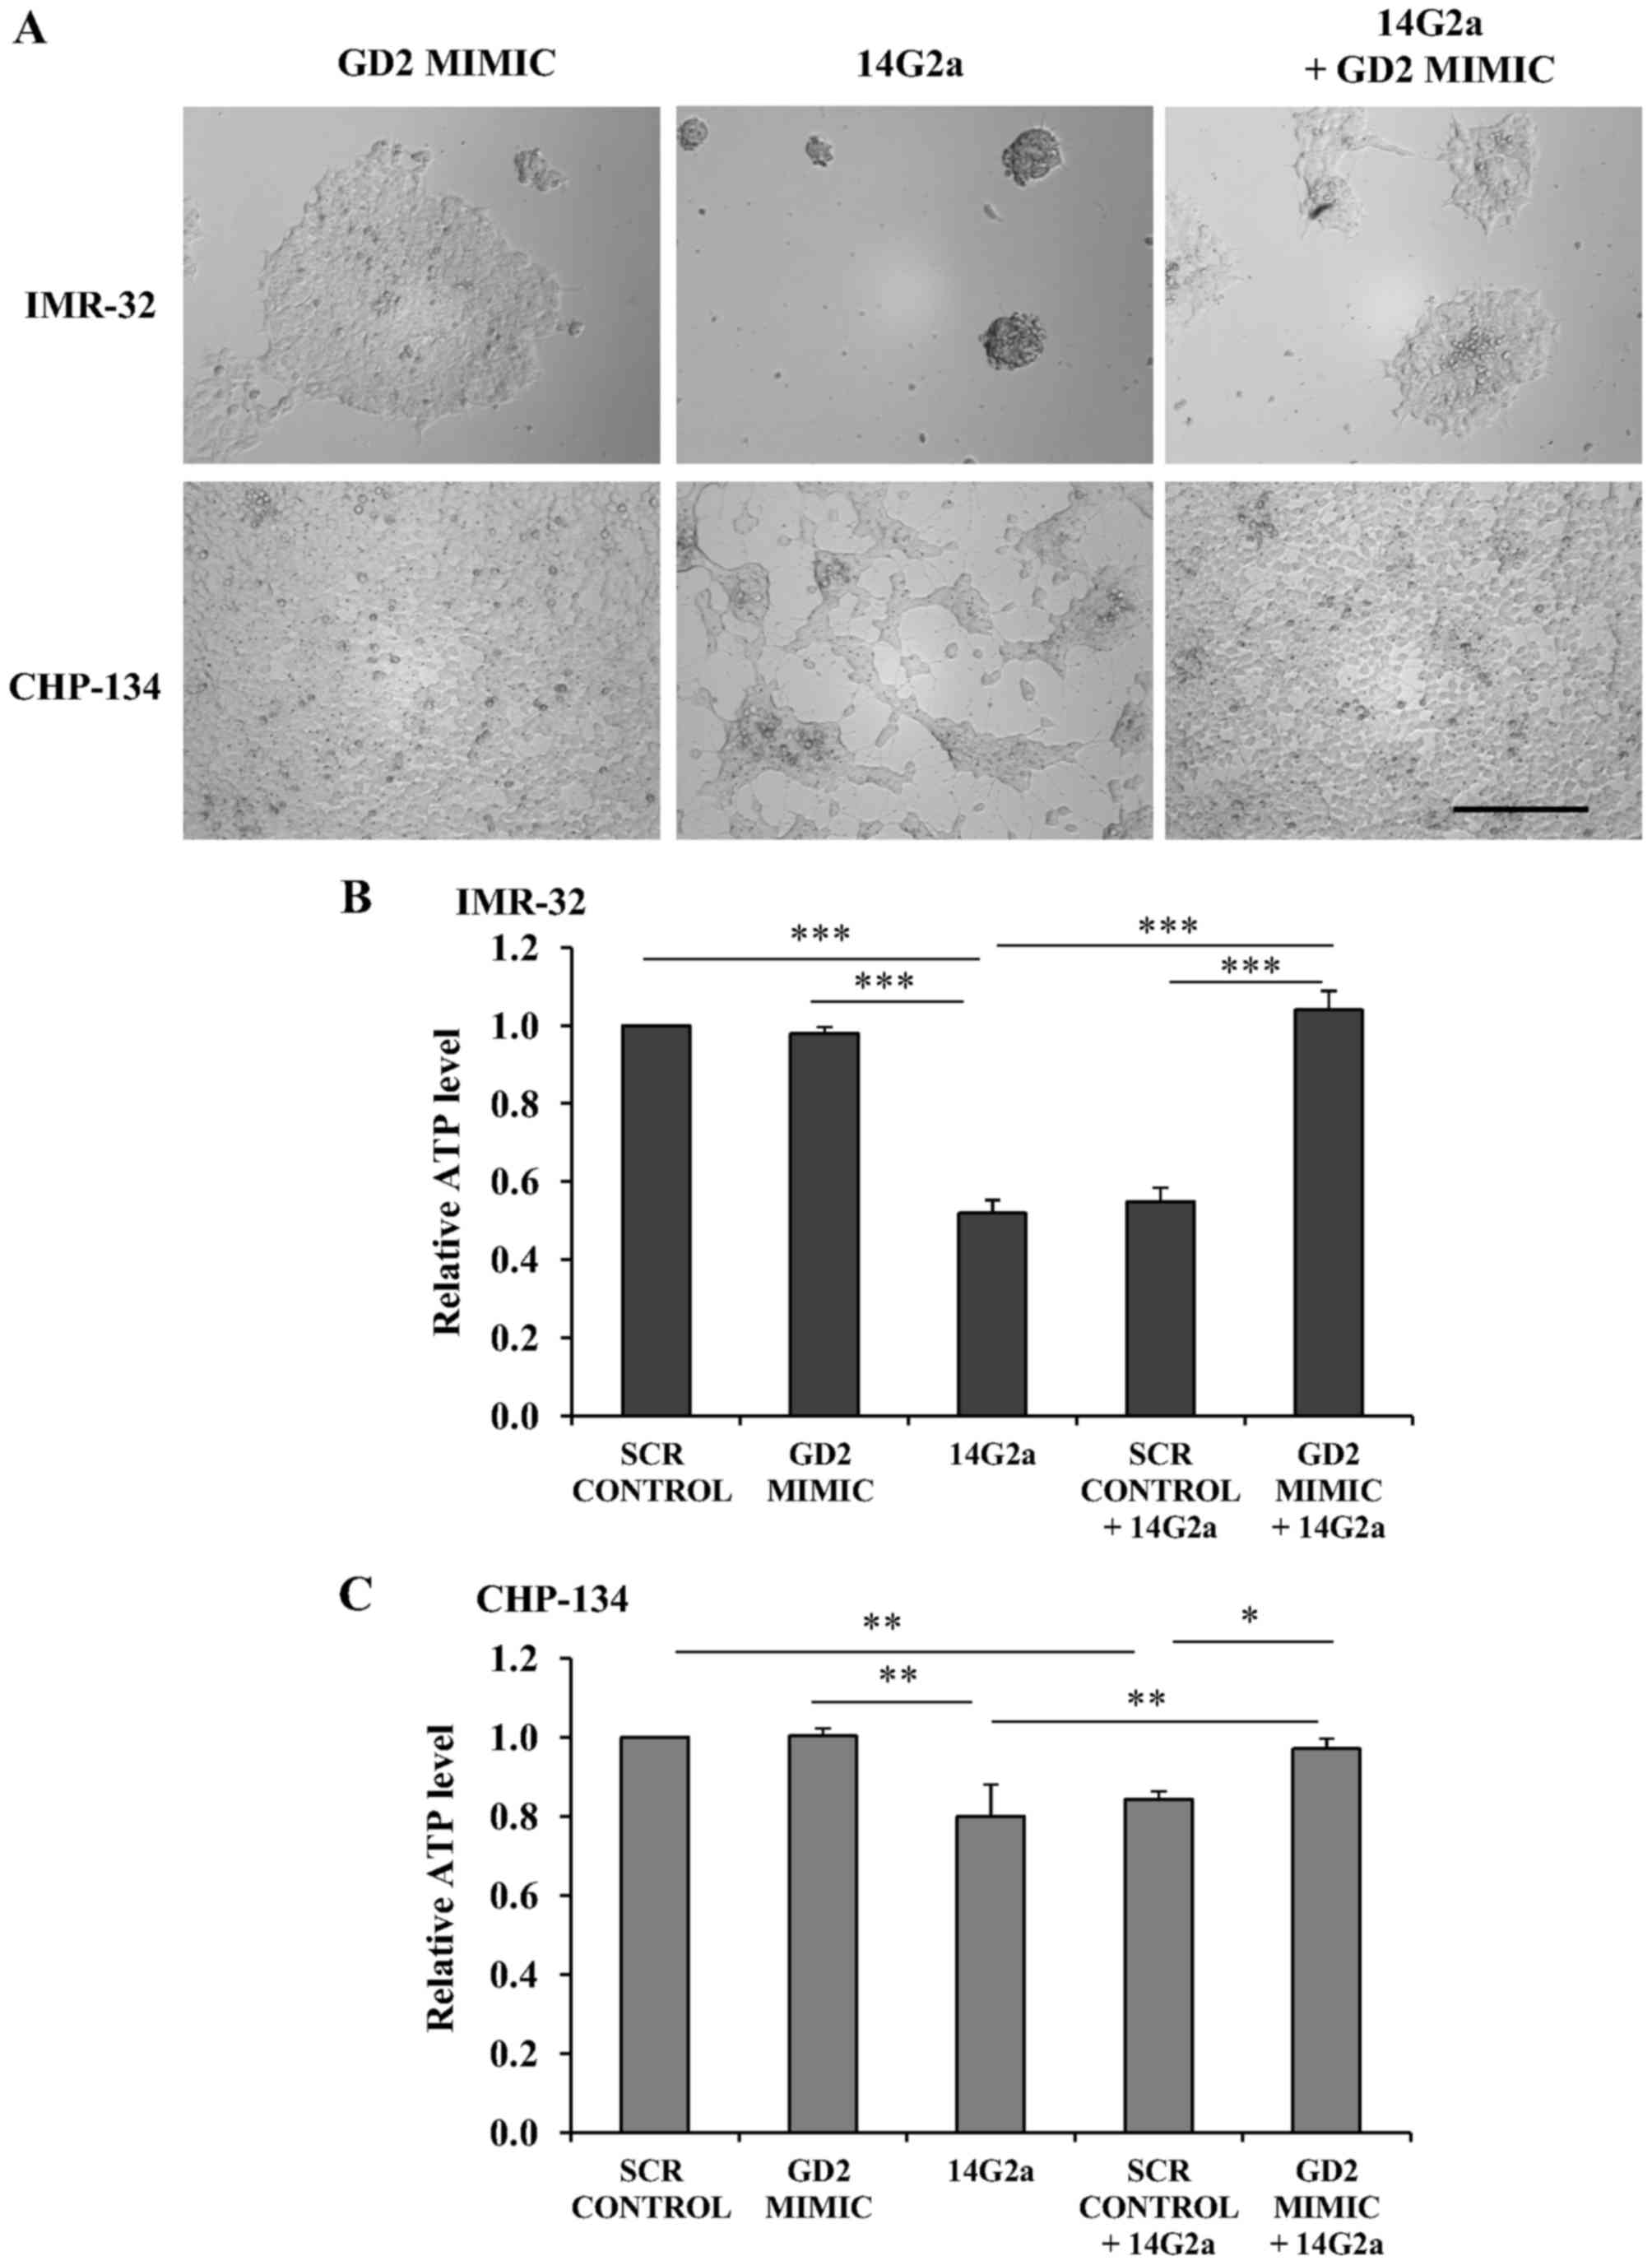 | Figure 1The peptide mimicking GD2-ganglioside
blocks cytotoxic effects of the 14G2a mAb. (A) Representative
microscopic pictures of IMR-32 and CHP-134 cells treated with the
0.23 mM concentration of the GD2-mimcking peptide
(RCNPNMEPPRCWAAEGD, marked as GD2 MIMIC on the figure) and PBS
(left panel); the 14G2a mAb (20 µg/ml, middle panel) and
peptide diluent; and the GD2 MIMIC and the 14G2a mAb (right panel).
The magnification objective ×20 was used, scale bar, 250 µm.
ATP levels in (B) IMR-32 and (C) CHP-134 cells were measured 72 h
after the treatment with the scramble control peptide (SCR CONTROL,
0.23 mM) and PBS; GD2 MIMIC (0.23 mM) and PBS; 14G2a (20
µg/ml) and peptide diluent; and each peptide and the 14G2a
mAb. ATP levels were calculated relative to values of cells treated
with SCR CONTROL (set as 1 in the figures). Data were calculated as
means of three experiments, run in triplicate, with SEM on the
error bars. Multivariate analysis was performed with one-way
repeated measures ANOVA with a Greenhouse-Geisser correction [(B) -
F(1.397, 2.795)=54.178, P<0.0062, (C) - F(1.516, 3.031)=12.062,
P=0.0374]. Pairwise comparisons by Dunnett's test at the
significance levels *P<0.05, **P<0.01 and
***P<0.001 vs. SCR CONTROL, vs. 14G2a, vs. SCR
PEPTIDE + 14G2a. (B) The means of SCR CONTROL or GD2 MIMIC vs. SCR
CONTROL + 14G2a were statistically different at the level set at
0.001 (omitted from the graph for clarity). (C) The means of SCR
CONTROL vs. 14G2a, and GD2 MIMIC vs. SCR CONTROL + 14G2a were
statistically different at the level set at 0.01 (omitted from the
graph for clarity). |
Survival of the neuroblastoma cell lines
is dependent on attachment
We have previously published data showing that
selected neuroblastoma cell lines are sensitive to direct
cytotoxicity of the anti-GD2 antibody 14G2a mAb (10,23).
Thus, we measured that cellular ATP levels decreased in time- and
dose-dependent manner in cultures of some neuroblastoma cells
treated with the mAb (10).
Additionally, for IMR-32 and LA-N-1 cell lines treatment with the
mAb induced clear changes in appearance such as cell rounding,
aggregation, detachment (10)
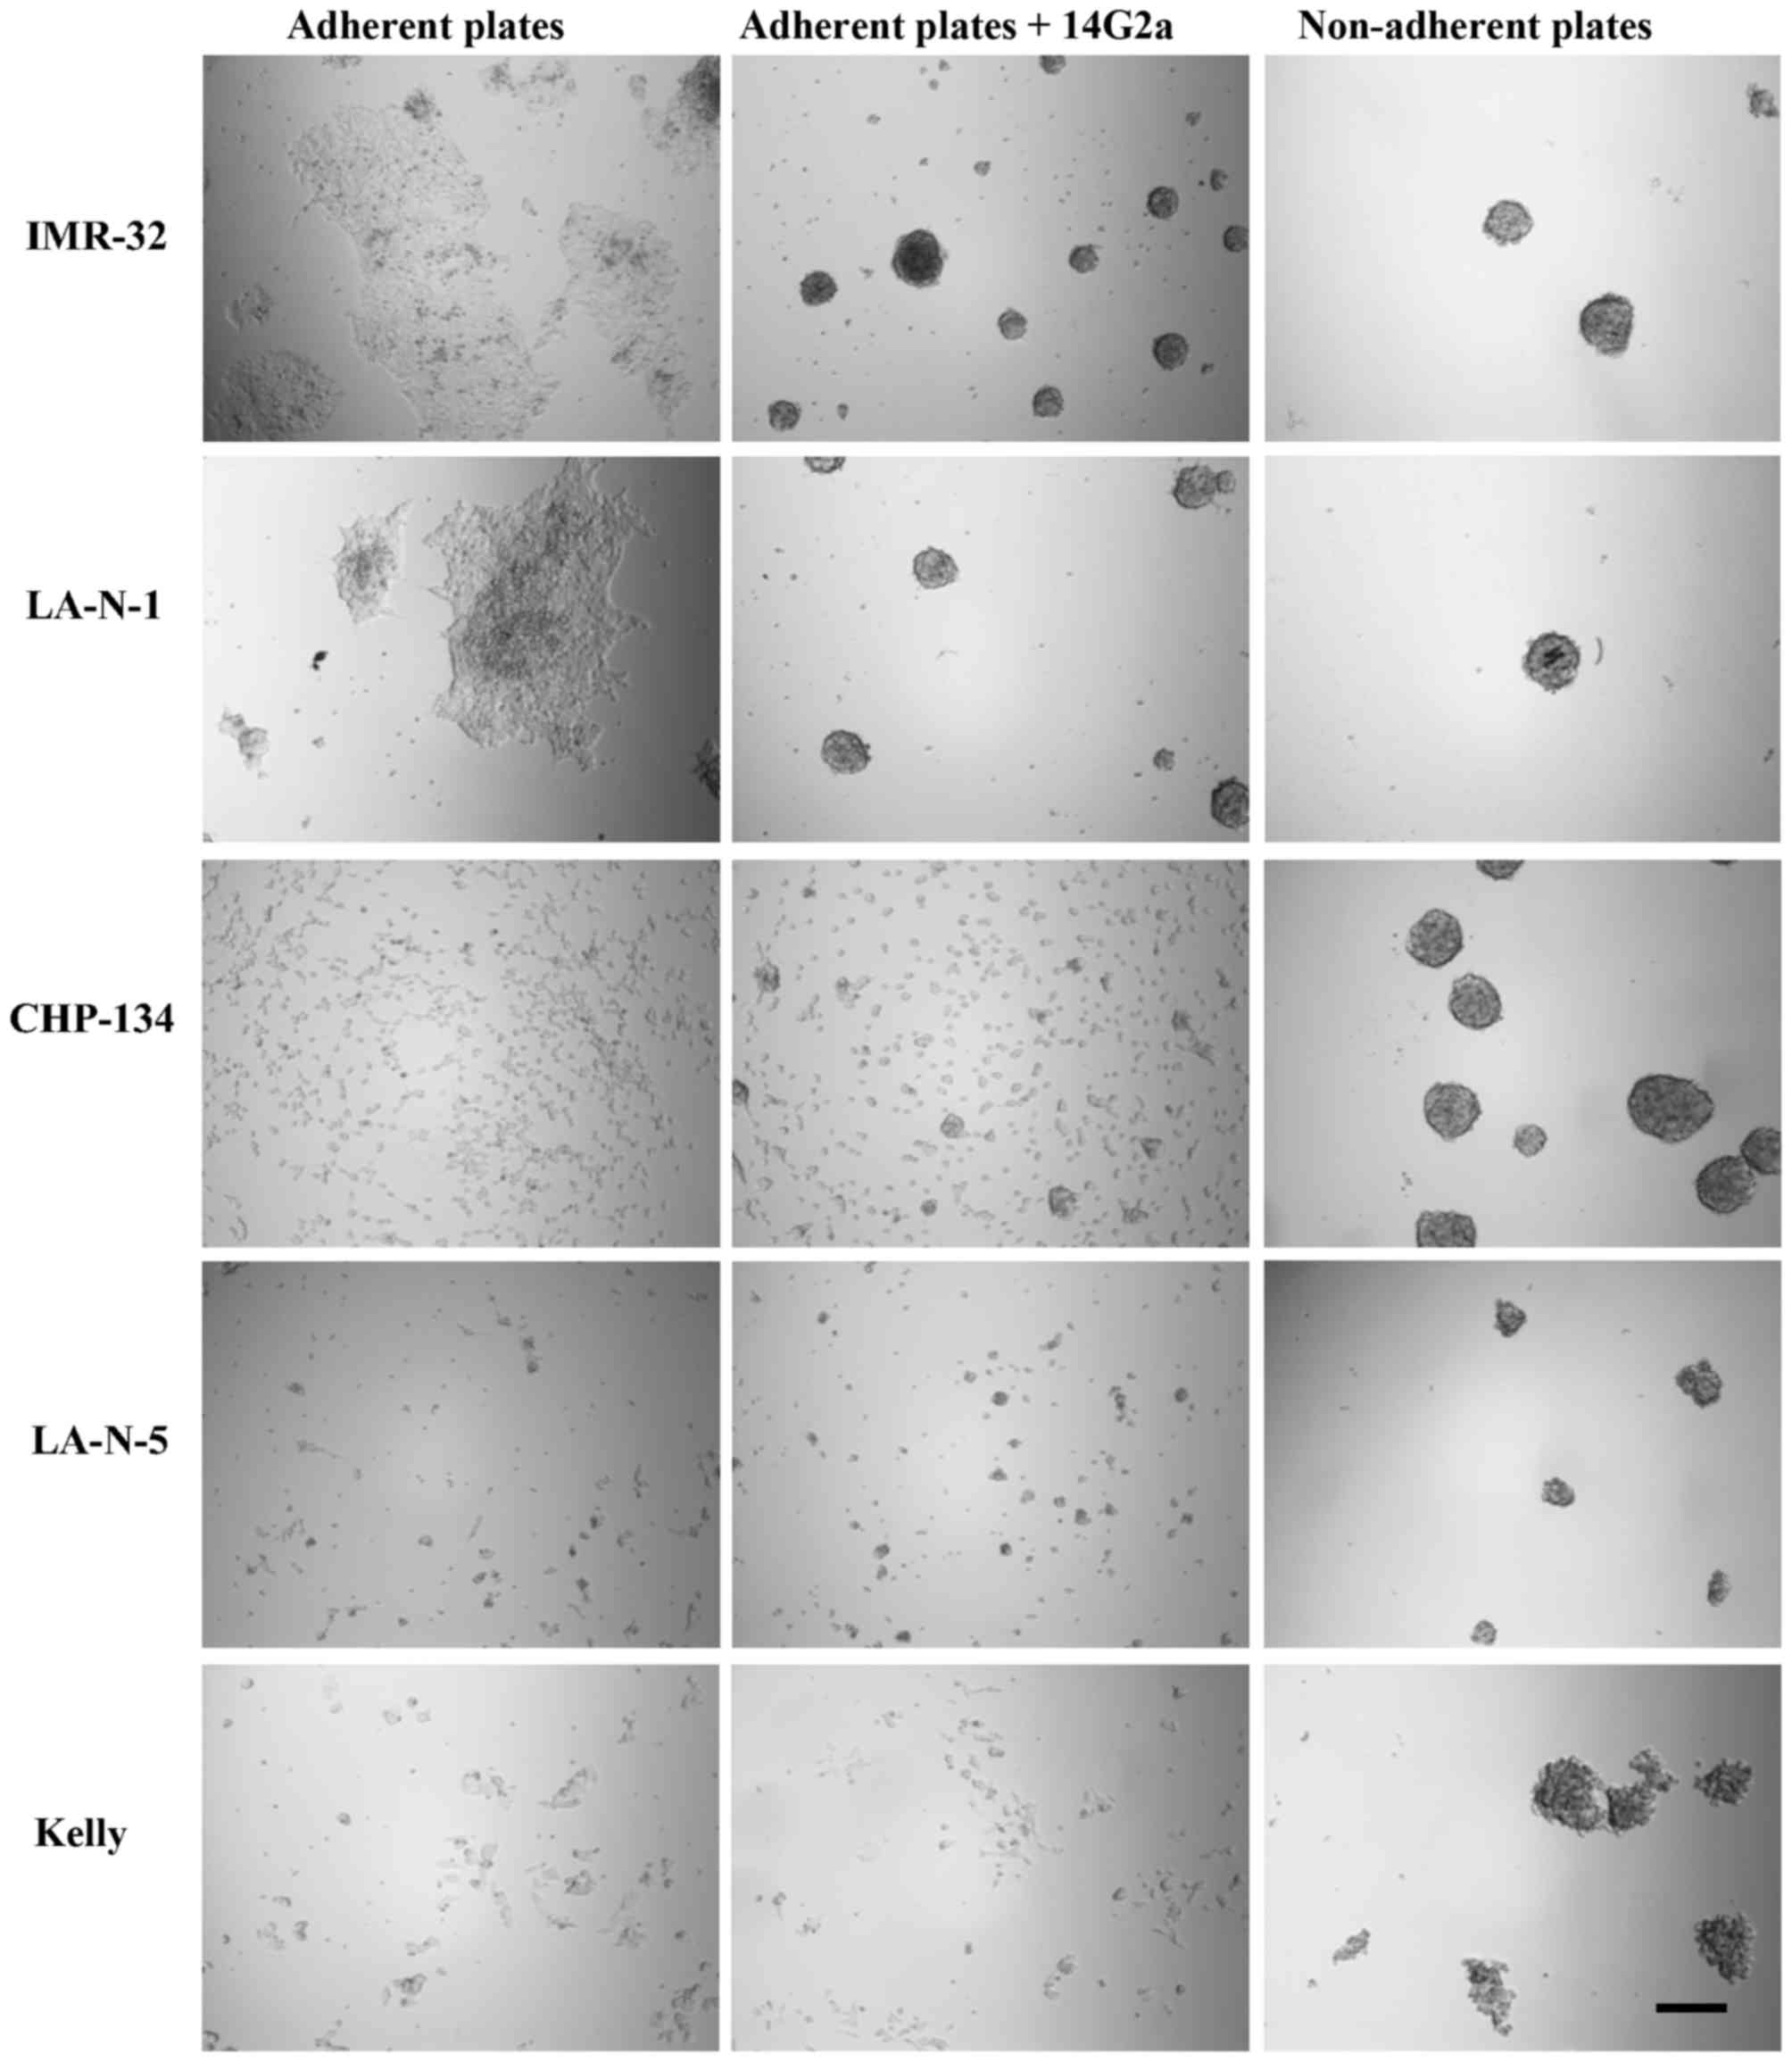
(Fig. 2). For other cells, such as
LA-N-5 and CHP-134 the changes were less pronounced (10) (Fig.
2). Kelly cells did not exhibit easily visible changes in their
morphology and were only to a limited extent sensitive to the mAb
treatment (10) (Fig. 2).
The above findings prompted us to hypothesize that
modulation of attachment of cells may influence sensitivity of
neuroblastoma cell lines to 14G2a. Hence, we used IMR-32, LA-N-1,
LA-N-5, CHP-134 and Kelly neuroblastoma cell lines, as they are
highly GD2-positive (Table I shows
GD2 analyses on IMR-32, LA-N-5, CHP-134 and Kelly cells) and are to
various extent sensitive to the antibody (10). We compared effects of attachment on
survival of neuroblastoma cell lines, also in the presence of the
mAb 14G2a (used in the concentration of 20 µg/ml). First, we
used ultra-low binding plates (non-adherent conditions) and
standard cell culture plates (adherent conditions) to compare
effects of such culture plastic vessels on cell morphology by
microscopic observation and cell survival by measurements of
cellular ATP. We report that all tested cell lines formed large
aggregates on non-adherent plates (Fig. 2, right panel).
Also, we compared levels of cellular ATP in cultures
after 72 h of incubation, with or without treatment with the mAb,
on both types of plates (normalized to control cells treated with
PBS and grown in adherent conditions, set as 1; Fig. 3A–E). We report a statistically
significant decrease in cellular ATP of cell cultures grown on
non-adherent plates as compared to standard culture plates. Thus,
the measured values were from 0.62±0.03 (for Kelly cells) to
0.75±0.045 (for LA-N-5 cells) of the values of cells grown on the
standard plates (P<0.05 for CHP-134, LA-N-1, LA-N-5; P<0.01
for IMR-32 and Kelly). For the cells treated with 14G2a (for the
great majority of the tests), we measured lower ATP levels in
cultures grown on non-adherent surfaces as compared to standard
plates (Fig. 3A–E). Out of five
cell lines tested, for CHP-134 cells the ATP levels decreased
approximately by additional 10% on non-adherent plates and were
statistically meaningful for the 20 µg/ml concentrations of
the 14G2a mAb (P<0.05). For Kelly cells, the levels of ATP were
statistically significantly lower for the 20 µg/ml
concentration of the 14G2a mAb used (P<0.01; Fig. 3E). For IMR-32, LA-N-1 and LA-N-5
cells the results of 14G2a treatment obtained compared between
adherent and non-adherent conditions in the presence of the 14G2a
mAb were not statistically meaningful.
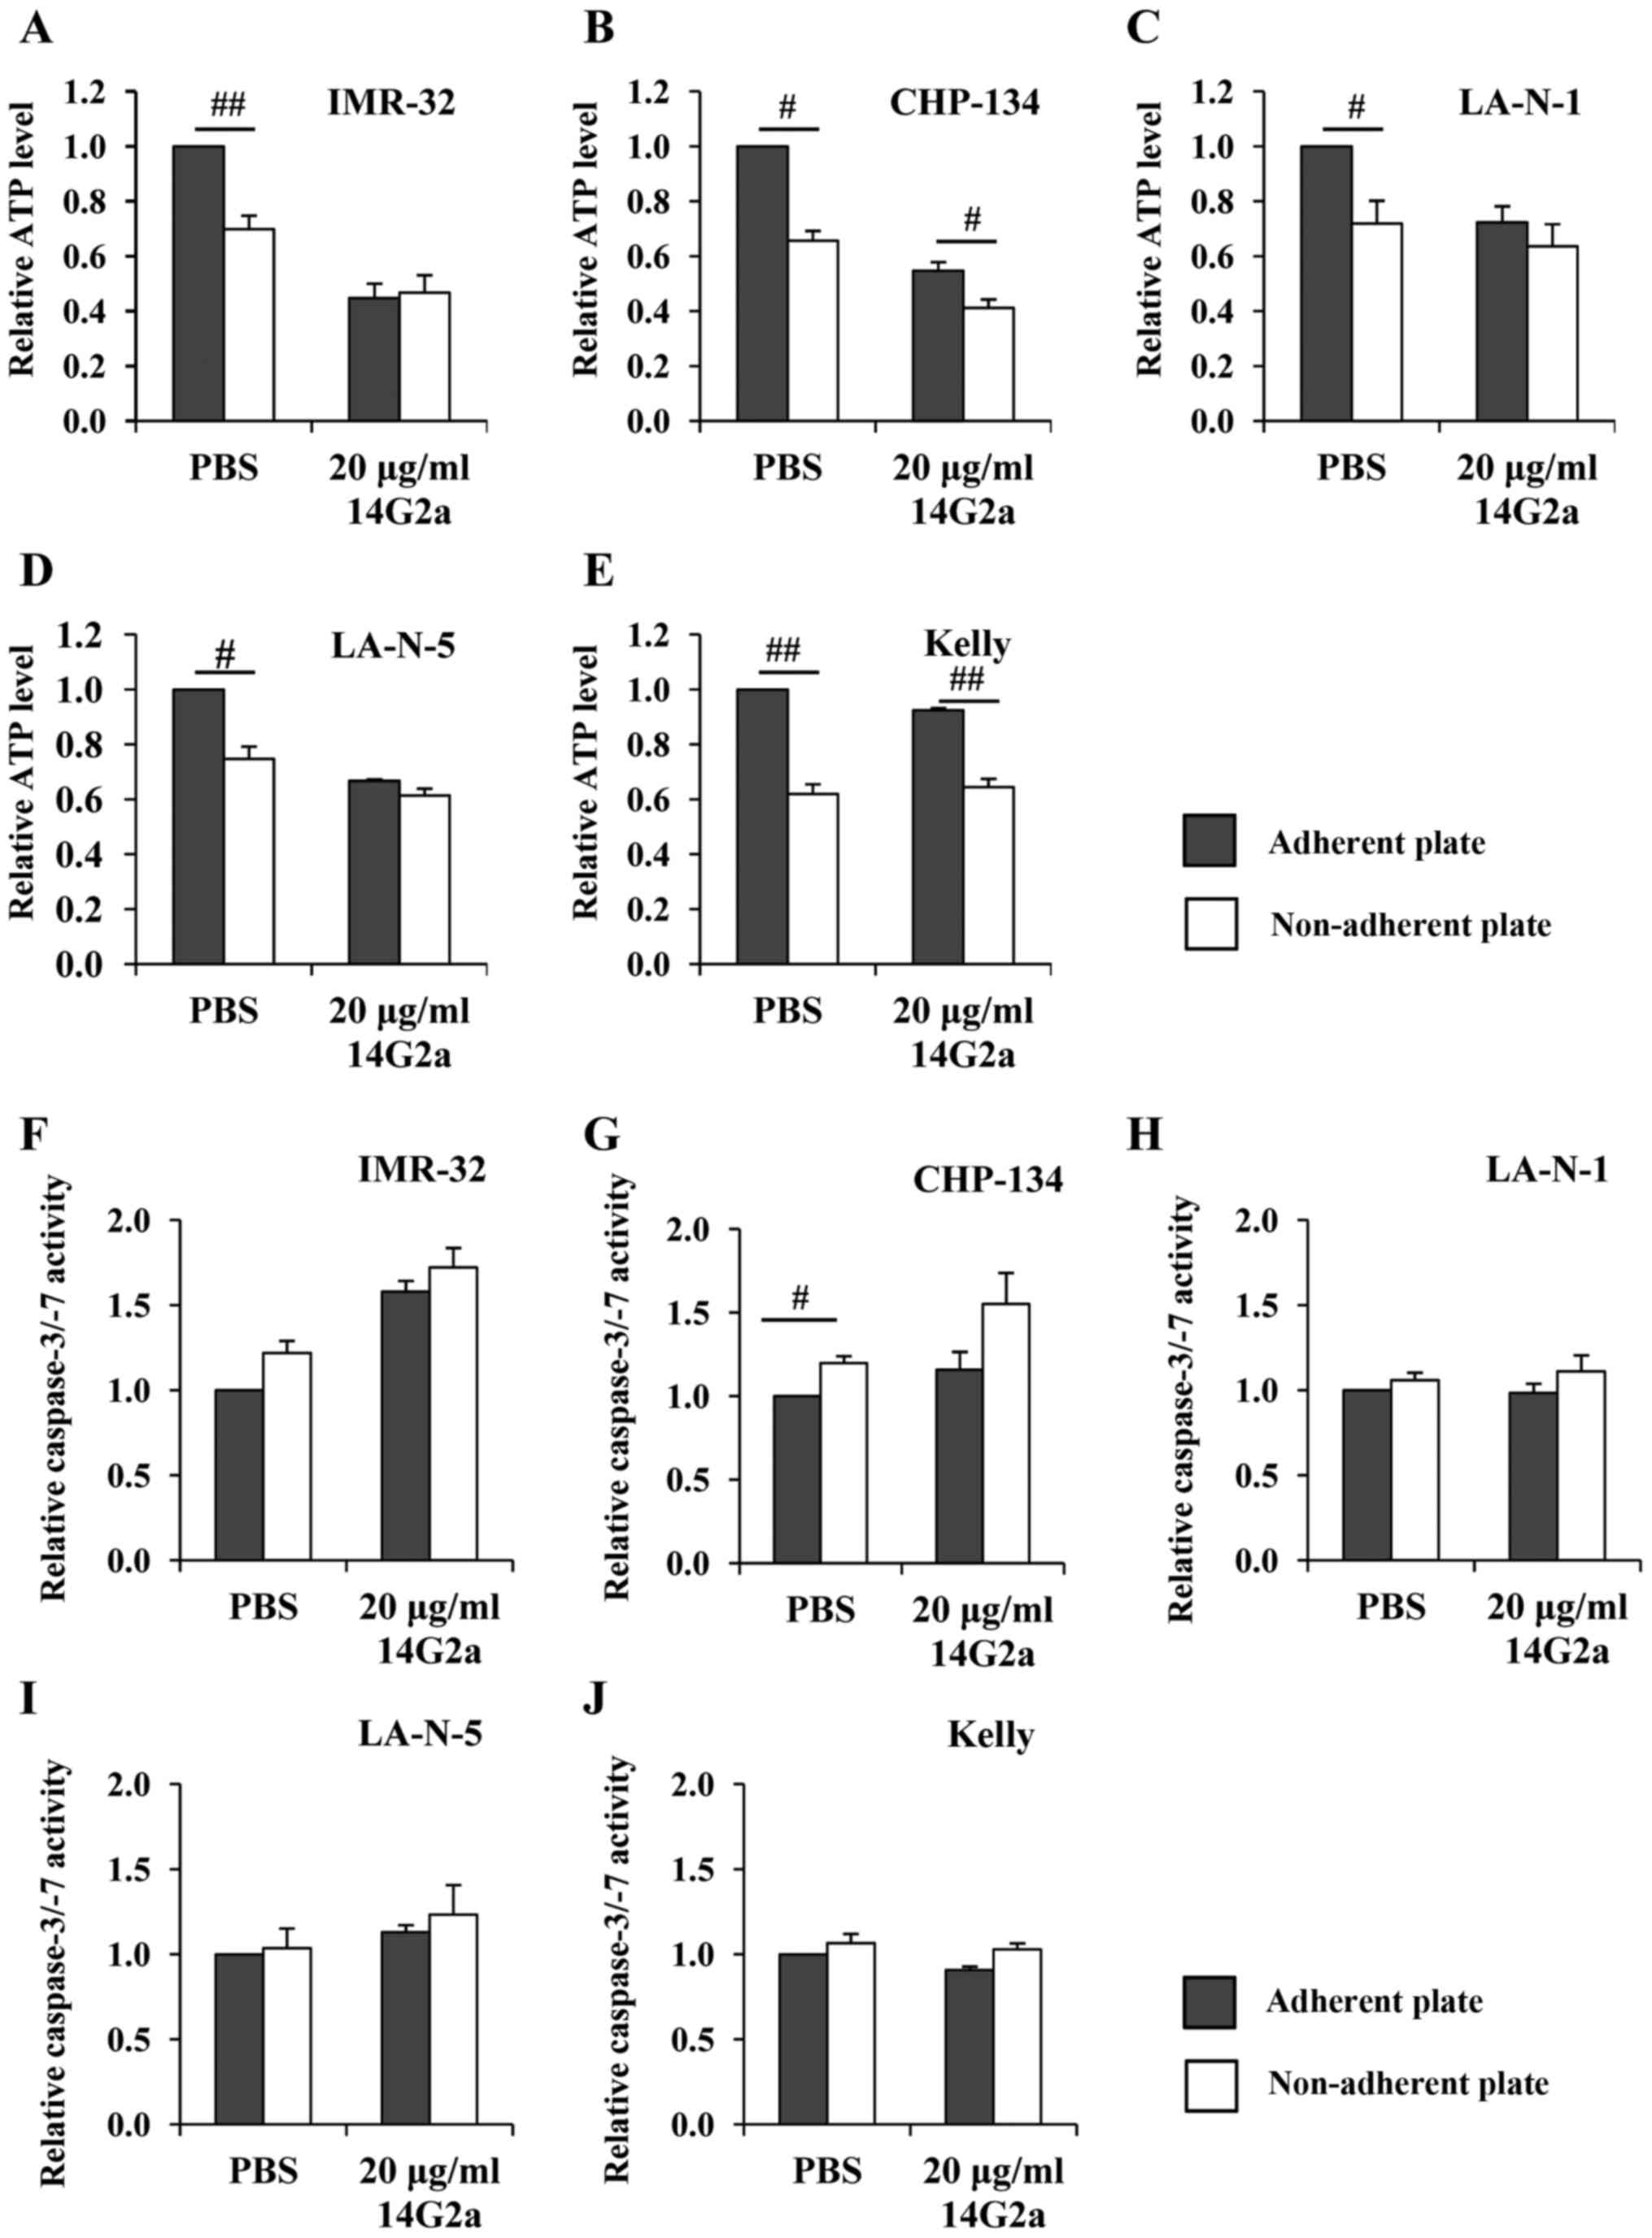 | Figure 3Effects of culture conditions on cell
survival (measured with determination of cellular ATP levels) and
activities of caspase-3/-7 of neuroblastoma cells. (A) IMR-32, (B)
CHP-134, (C) LA-N-1, (D) LA-N-5 and (E) Kelly cells were cultured
for 72 h on adherent plates (dark grey), or non-adherent plates
(white) with the 14G2a mAb (20 µg/ml). Control cells treated
with PBS were also included. ATP levels were calculated relative to
values of cells treated with PBS that were cultured on adherent
plates (set as 1). Data were calculated as means of three (B and E)
or four experiments (A, C and D), run in triplicate, with SEM on
the error bars. (F) IMR-32, (G) CHP-134, (H) LA-N-1, (I) LA-N-5 and
(J) Kelly cells were cultured for 72 h on adherent plates (dark
grey), or non-adherent plates (white) with the 14G2a mAb (20
µg/ml). Control cells treated with PBS were also included.
Caspase-3/-7 activities were calculated relative to values of cells
treated with PBS that were cultured on adherent plates (set as 1).
Data were calculated as means of three experiments, run in
duplicate, with SEM on the error bars. P-value for the t-test is as
follows: #p<0.05, ##p<0.01. |
Previously, we reported that treatment with the mAb
caused a rise in caspase-3/-7 activities in IMR-32 cells after 24
and 48 h of treatment (10). Here,
we provide more data, showing that culturing of the IMR-32 cells
for 72 h on non-adherent plates resulted in an increase of
activities of caspase-3/-7 ~20%, but without statistical
significance. However, for both adherent and non-adherent plates in
the presence of 14G2a (20 µg/ml), the increase of activities
of caspase-3/-7 was ~60 and 70%, respectively (Fig. 3F, when compared to control cells
treated with PBS grown in adherent conditions, set as 1). Also, for
CHP-134, LA-N-1 and LA-N-5 the highest activities of caspase-3/-7
were measured for cells cultured on low-binding plates and in the
presence of the 14G2a mAb (20 µg/ml), when compared to other
conditions tested, but the data did not reach statistical
significance due to variation between experiments (Fig. 3G–I).
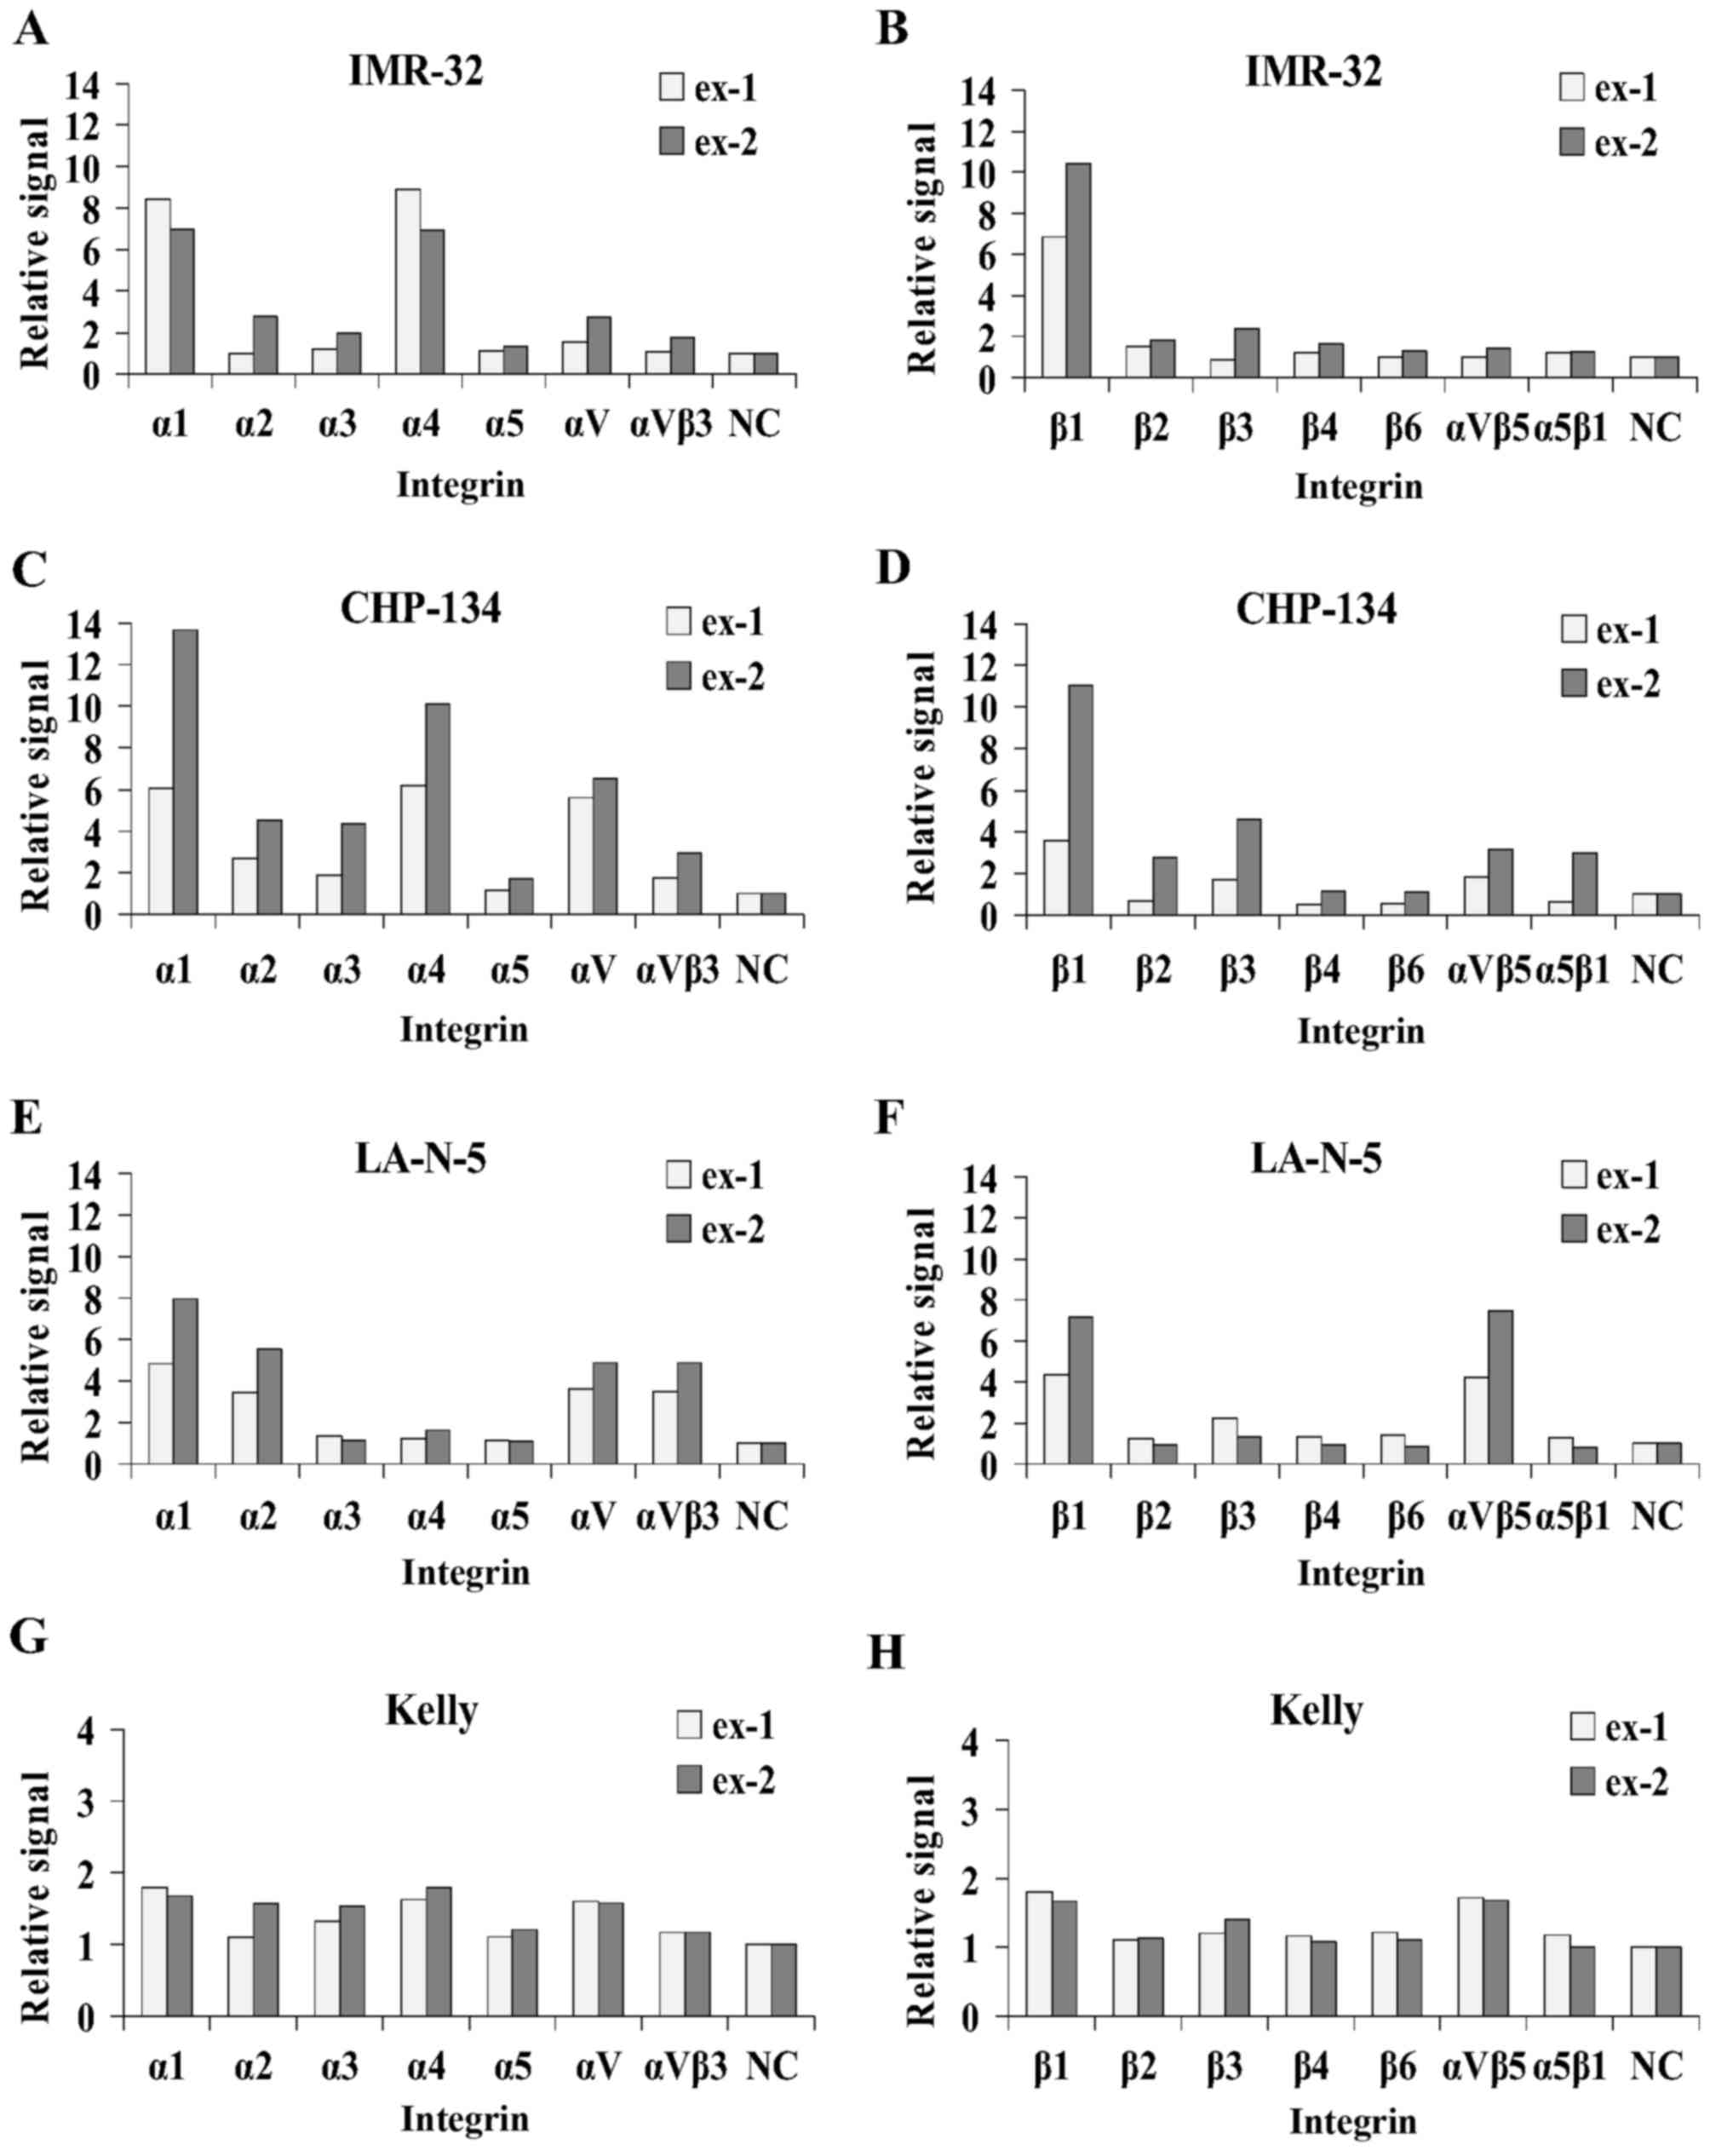
Characterization of selected integrins on
the cell surface of neuroblastoma cell lines
We made an attempt to preliminary characterize
presence of integrins on IMR-32, CHP-134, LA-N-1, LA-N-5 and Kelly
cell lines with application of an α/β integrin-mediated cell
adhesion array that uses antibody-coated wells to retain cells
expressing given integrin chains or their complexes (Fig. 4, data from two experiments are
shown, marked as ex-1 and ex-2 on the graphs). For the analyses, we
assumed that a relative signal >2 is a positive sign that a
given integrin subunit or complex is present on cells. For IMR-32
and CHP-134 cells clear signals of binding of α1, α4 and β1 chains
were measured. Additionally, on CHP-134 cells α2 and α3 subunits
were detected. On LA-N-5 cells α1, α2, and β1 but no α4 were
detected. Also, for CHP-134, LA-N-5 signals of binding to αV, αVβ3
and αVβ5 were measured. For Kelly cells due to high background
measured in wells of controls it is hard to draw unequivocal
conclusions, hence the line was included in the further tests
(described below). Also for LA-N-1 cells, in one experiment, we
measured positive signals from α1, α2, α4, αV and β1 (data not
shown). Further testing was performed using flow cytometry
(Table II shows percentage of
positively stained cells in the analyzed pools). We showed that in
concordance with the aforementioned array, β1 integrin was
expressed on majority of IMR-32, CHP-134, LA-N-5 and Kelly cells.
Furthermore, α4 chain was unequivocally present in pools of
analyzed IMR-32 cells (i.e., on ~30% cells). On CHP-134 and Kelly
cells, expression of α4 chain was detectable, yet restricted only
to small percentage of cells (i.e., ~3% of CHP-134 cells and ~6.5%
of Kelly cells). Lack of αVβ3 and αVβ5 heterodimers was confirmed
on IMR-32 cells. The presence of the αVβ3 integrin complex was
detectable on CHP-134, LA-N-5 and Kelly cell cultures, yet
restricted only to minority of cells (~2%). The αVβ5 complex was
unequivocally present in Kelly cell pools (~60%), while it was
detectable only on minority of LA-N-5 and CHP-134 cells. Notably,
in six measurements on LA-N-5 cells, percentage of cells positive
for αVβ3 ranged approximately from 2 to 6%, and for αVβ5 from 2.5
to 15% (data not shown). This suggests need for further
characterization of levels of integrins and relationships between
their expression and cell culture conditions (such as cell time in
culture, culture cell density, or specific cell banks used).
Additionally, we included GD2-negative SK-N-SH cells to the
analyses (Table I) and showed that
α4, β1 chains and αVβ3, αVβ3 complexes are present in majority of
the analyzed cells (Table II).
Hence, the cell line was included in some research described in
following chapters.
Characterization of sensitivity of
neuroblastoma cell lines to treatment with the 14G2a mAb on
surfaces coated with fibronectin and collagen IV
The above data prompted us to investigate effects of
extracellular matrix proteins, i.e., fibronectin, collagen IV on
changes of ATP levels induced after treatment of cells with the
14G2a mAb.
We compared cellular ATP levels of cells cultured on
fibronectin- and collagen IV-coated wells to control cells grown on
standard cell culture plates, after treatment with the mAb in the
concentrations of 20 µg/ml (PBS treated cells were also
included). The effects were subtle; hence we calculated data as
means ± SEM from three experiments (data not shown). For IMR-32,
CHP-134 and LA-N-1 cells, we observed an increase in levels of
cellular ATP on plates coated with fibronectin or collagen IV, when
compared to cells grown on uncoated plates. However, the
statistically meaningful increases in ATP levels (~10%) were
measured only for the LA-N-1 cells treated with 14G2a and cultured
on collagen IV plates (P<0.05). The smallest changes (and
without statistical significance) were measured for CHP-134 cells.
Thus, we find that interaction of neuroblastoma cells with the ECM
proteins can lead to lower sensitivity of some cell lines to the
mAb treatment.
Effects of inhibitors of α1β1 and α4β1
integrin complexes on appearance, attachment, survival of
neuroblastoma cell lines and their sensitivity to 14G2a mAb
We decided to use two inhibitors of integrin
complexes α1β1 or α4β1, i.e., obtustatin or BIO 1211, to test their
effects on IMR-32, CHP-134 and Kelly cells. The inhibitors were
tested alone and in combination with the 14G2a mAb (20
µg/ml) on plates coated with collagen IV or fibronectin,
respectively.
Obtustatin used in the concentrations 0.012, 0.06,
0.3 and 1.5 µM did not affect ATP levels of IMR-32, CHP-134,
Kelly cells (data not shown). Moreover, no change in sensitivity to
treatment with 14G2a was observed when the inhibitor (applied in
the above mentioned concentrations) was combined with 20
µg/ml of 14G2a (after 72 h of treatment; data not shown).
This is in line with the observations that the inhibitor did not
induce changes of the cell morphology and attachment of the three
lines, when investigated on the third day of culture by microscopic
observation. Some cell rounding was observed 2 h after obtustatin
(e.g., 1.5 µM) addition to IMR-32 cells (data not
shown).
BIO 1211 used in the concentrations 1, 2.5 and 5
µM affected appearance of IMR-32 cells, as visible after 72
h of culture, especially for 2.5 and 5 µM BIO 1211 (Fig. 5A for 5 µM BIO 1211), while
no changes were observed for CHP-134 and Kelly cells. This was
further analyzed with application of attachment assays on
fibronectin-coated wells. The signals of cells remaining in wells
were detected using ATP measurements. Results of multivariate
analyses did not yield statistically significant P-values for the
three cell lines, hence, further pairwise tests were not conducted
(Fig. 5B and data not shown). For
IMR-32, when mean values from three experiments were compared, the
14G2a mAb (20 µg/ml) reduced signal to 0.7±0.06, 5 µM
BIO 1211 reduced signal to 0.62±0.1, and both agents reduced signal
to 0.43±0.1 of control cells set as 1 (Fig. 5B). For Kelly cells, the 14G2a mAb
(20 µg/ml) did not affect attachment, 5 µM BIO 1211
reduced signal to 0.93±0.4, and both agents reduced signal to
0.89±0.04, when compared to control cells (set as 1, data not
shown). For CHP-134 cells, the 14G2a mAb (20 µg/ml) and 5
µM BIO 1211 did reduce signals, and both agents reduced
signal to 0.86±0.05, when compared to control cells (set as 1, data
not shown). Also after 72 h of culture, the inhibitor reduced
cellular ATP levels of the IMR-32 cells to 0.9±0.02 (of control
cells treated with diluent, set as 1), 0.84±0.03 (of control) and
0.86±0.04 (of control); when used at the concentrations of 1, 2.5
and 5 µM, respectively (Fig.
5C).
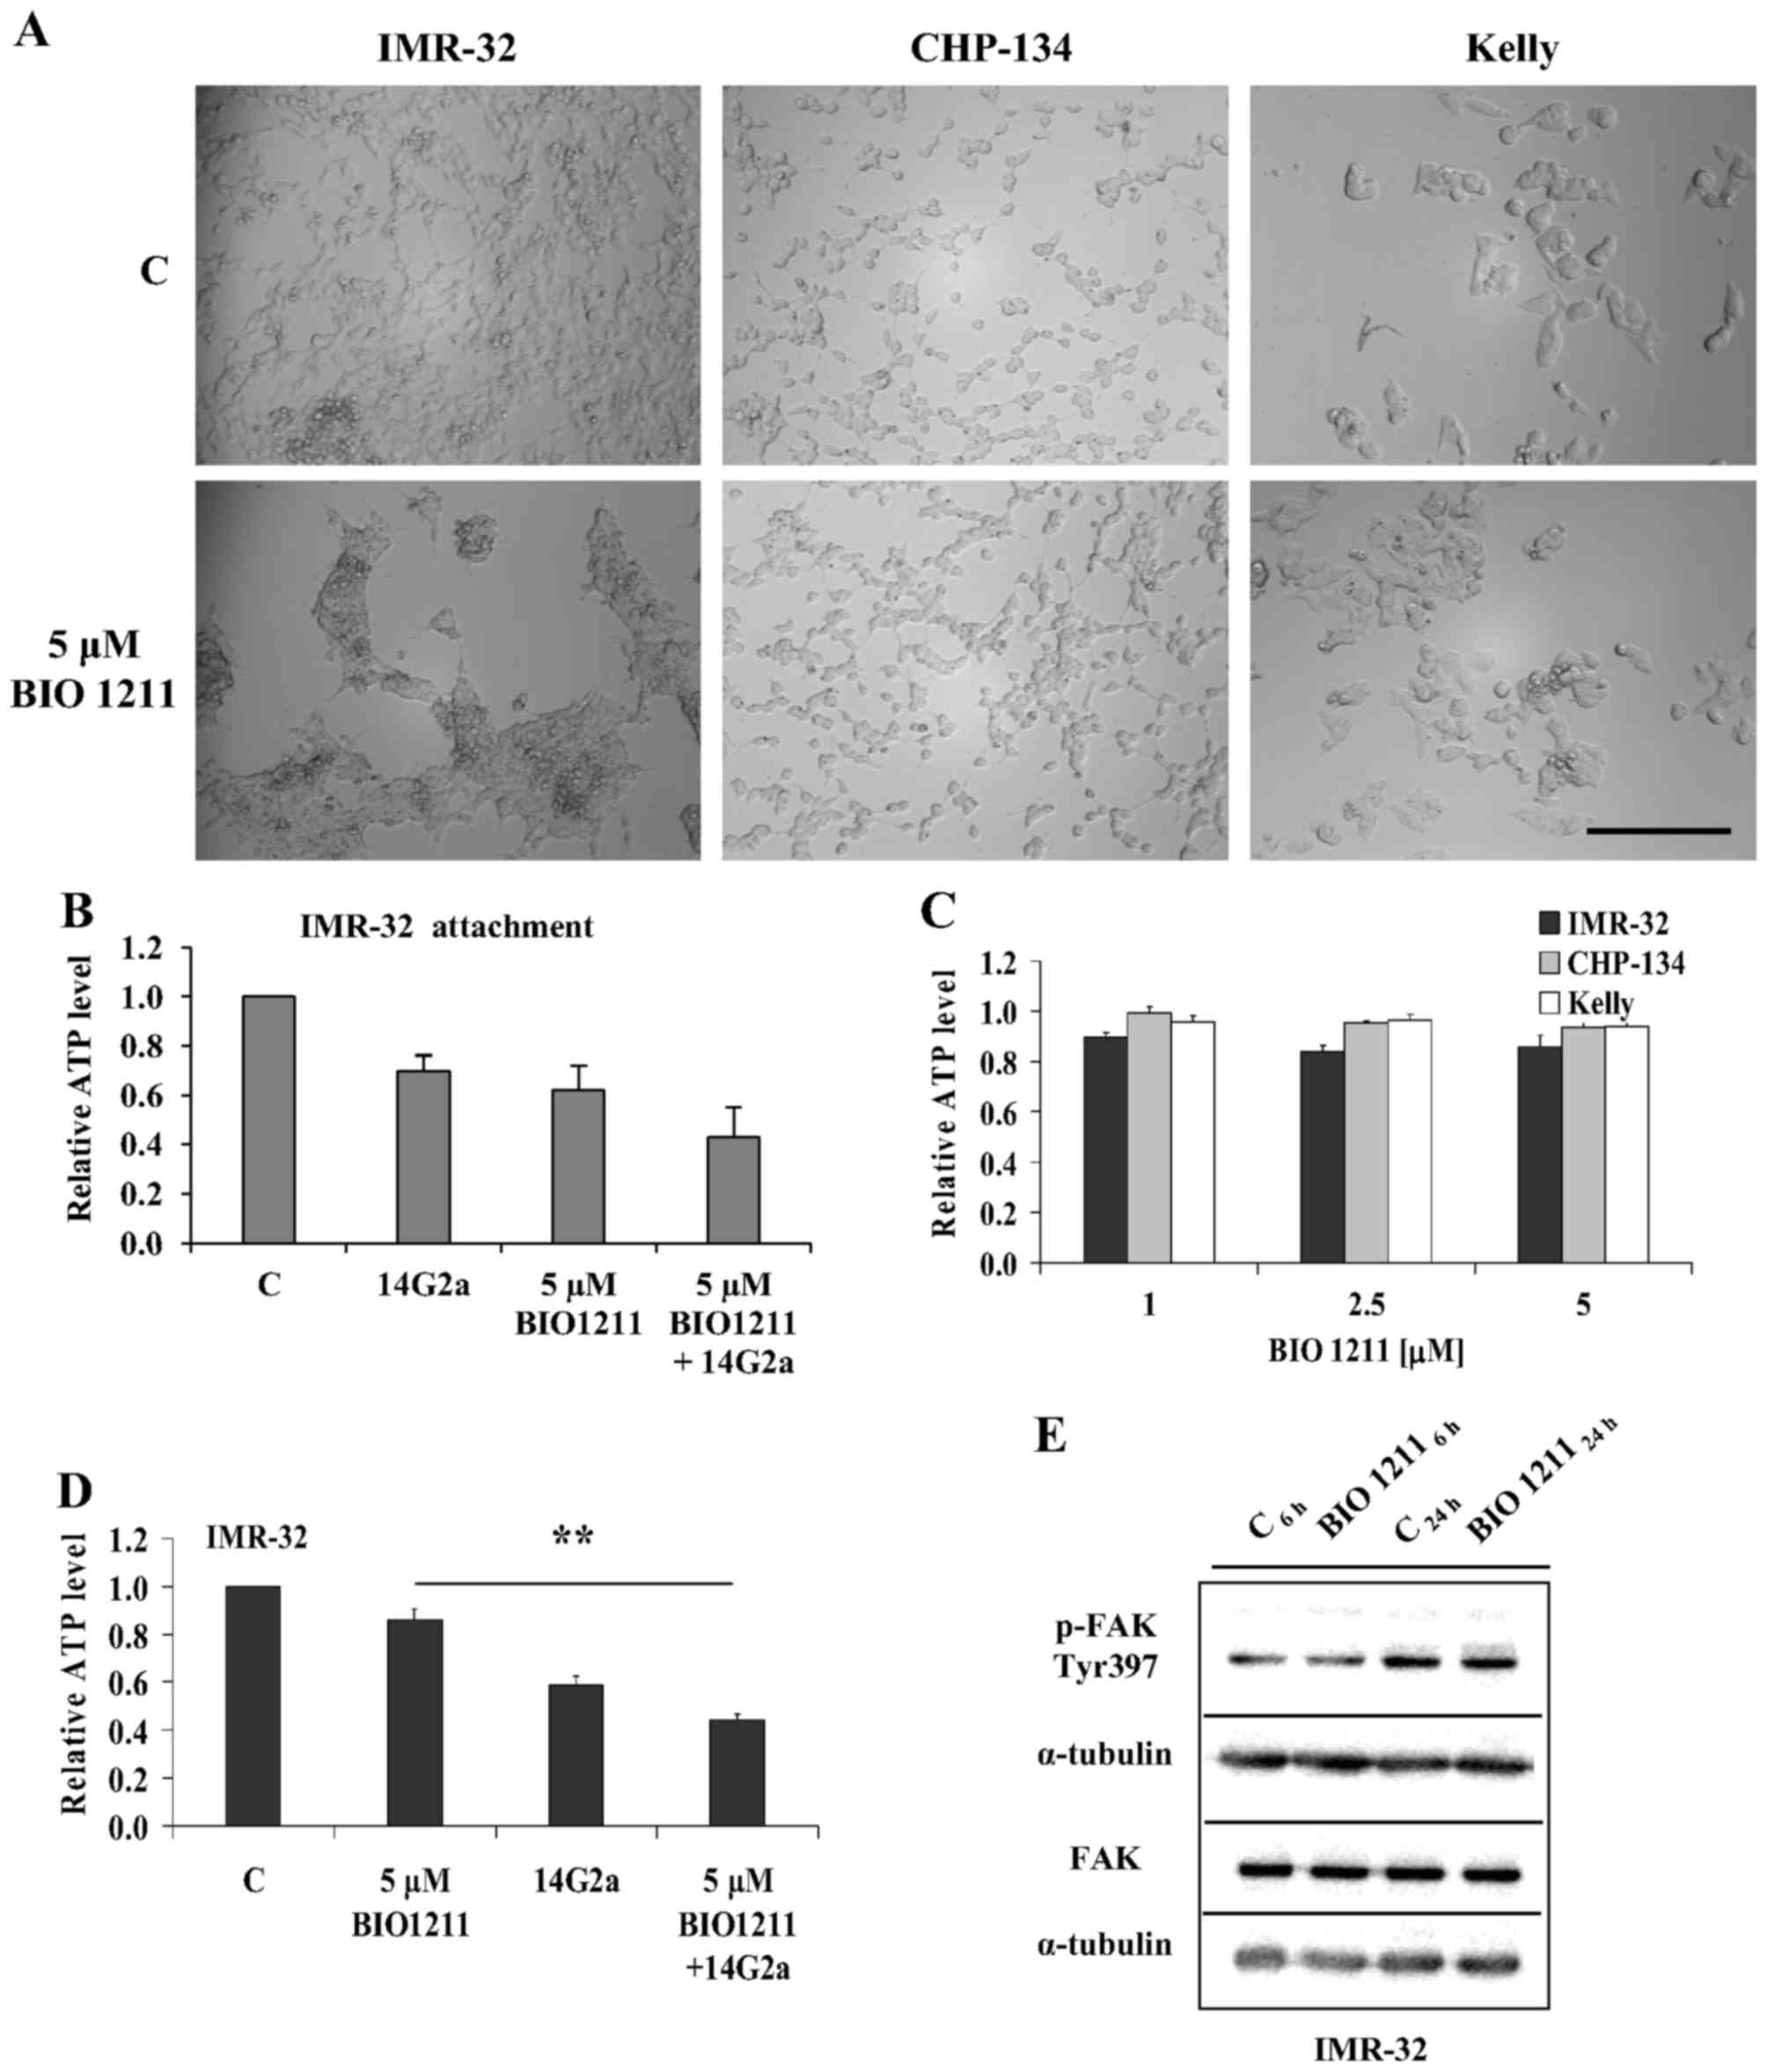 | Figure 5Effects of the specific inhibitor of
active α4β1 integrin complex (BIO 1211) on appearance, attachment
and cell survival of neuroblastoma cells cultured on fibronectin.
(A) Representative microscopic pictures of IMR-32, CHP-134 and
Kelly cells treated with diluents (marked as C) and 5 µM BIO
1211. The magnification objective ×20 was used, scale bar, 250
µm. (B) Attachment assay of IMR-32 cells on
fibronectin-coated wells in the presence of 14G2a (20 µg/ml)
and BIO 1211 (5 µM). After 2 h of incubation unattached
cells were removed, remaining cells were lysed, and levels of ATP
were measured. (C) Survival of IMR-32, CHP-134 and Kelly cells
treated with diluents and 1, 2.5 and 5 µM BIO 1211, and
cultured on fibronectin-coated plates (for 72 h). (D) Survival of
IMR-32 treated with diluent (marked as C) and 5 µM BIO 1211,
the 14G2a mAb (20 µg/ml), and the combination of the 14G2a
mAb and BIO 1211 on fibronectin-coated plates (for 72 h). Survival
was measured through determination of ATP levels that were
calculated relative to values of respective cells treated with
diluents (set as 1). Multivariate analysis was performed with
one-way repeated measures ANOVA with a Greenhouse-Geisser
correction: [(B) F (1.149, 2.298)=12.475, P>0.058, (C) IMR-32,
F(1.207, 2.415)=6.213, P>0.1; CHP-134, F(1.381, 2.761)=3.604,
P>0.16; Kelly, F(1.995, 3.99)=4.09, P>0.10; (D) F(1.087,
2.175)=16.046, P<0.05]. Pairwise comparisons by Dunnett's test
at the significance levels **P<0.01, vs. 5 µM
BIO 1211. (D) Means 14G2a vs. C, and 5 µM BIO 1211 + 14G2a
vs. C were statistically different at the level 0.01 by Dunnett's
test (omitted from the graph for clarity). Data on the graphs were
calculated as means of three experiments, run in triplicate (C and
D) or quadruplicate (B), with SEM on the error bars. (E) Western
blot analysis of levels of p-FAK (Tyr397) and total FAK is IMR-32
cells treated with BIO 1211 (5 µM) for 6 and 24 h. Control
cells (treated with diluent, marked as C, were also included). One
of three experiments performed is shown. α-tubulin was used as the
reference protein. |
When compared to IMR-32 cells treated with mAb
alone, lower levels of ATP were observed for cells treated with
combinations of 1, 2.5 and 5 µM of BIO 1211 and 20
µg/ml of 14G2a (after 72 h of treatment), i.e., 0.45±0.03
(of control cells treated with diluent); 0.42±0.02 (of control
cells treated with diluent); 0.44±0.03 (of control cells treated
with diluent); respectively, yet the values did not reach
statistical significance when compared to signals from samples
treated only with 14G2a by Dunnett's test (Fig. 5D, also data not shown). For CHP-134
and Kelly cells treated with BIO 1211 in the concentrations 1, 2.5
and 5 µM the reduction levels were either not observed
(e.g., CHP-134 cells treated with 1 µM) or <10% (Fig. 5C). No additional statistically
meaningful effects were observed when the 14G2a mAb (20
µg/ml) was combined with 2.5 and 5 µM BIO 1211 for
the CHP-134 cells [when compared to the antibody (20 µg/ml)
used alone, data not shown]. For Kelly cells, in the settings where
BIO 1211 (1 or 2.5 or 5 µM) and 14G2a (20 µg/ml) were
used alone or the inhibitor and the mAb were used in combinations,
multivariate analyses did not yield statistically significant
P-values (data not shown). As a result, further pairwise tests were
not conducted. Using western blot analysis, we showed that 5
µM BIO 1211, added for 6 and 24 h to IMR-32 cells, did not
change levels of p-FAK (Tyr397) and total FAK (Fig. 5E).
Effects of inhibitors of αVβ3 and αVβ5
integrin complexes on appearance, attachment, survival of
neuroblastoma cell lines and their sensitivity to the 14G2a
mAb
We decided to use two inhibitors of integrin
complexes αVβ3 or αVβ5, i.e., cilengitide (CGT) or SB273005 (SB),
to test their effects on LA-N-5, CHP-134 and Kelly cells. The
inhibitors were tested alone and in combination with the 14G2a mAb
(20 µg/ml) on plates coated with vitronectin.
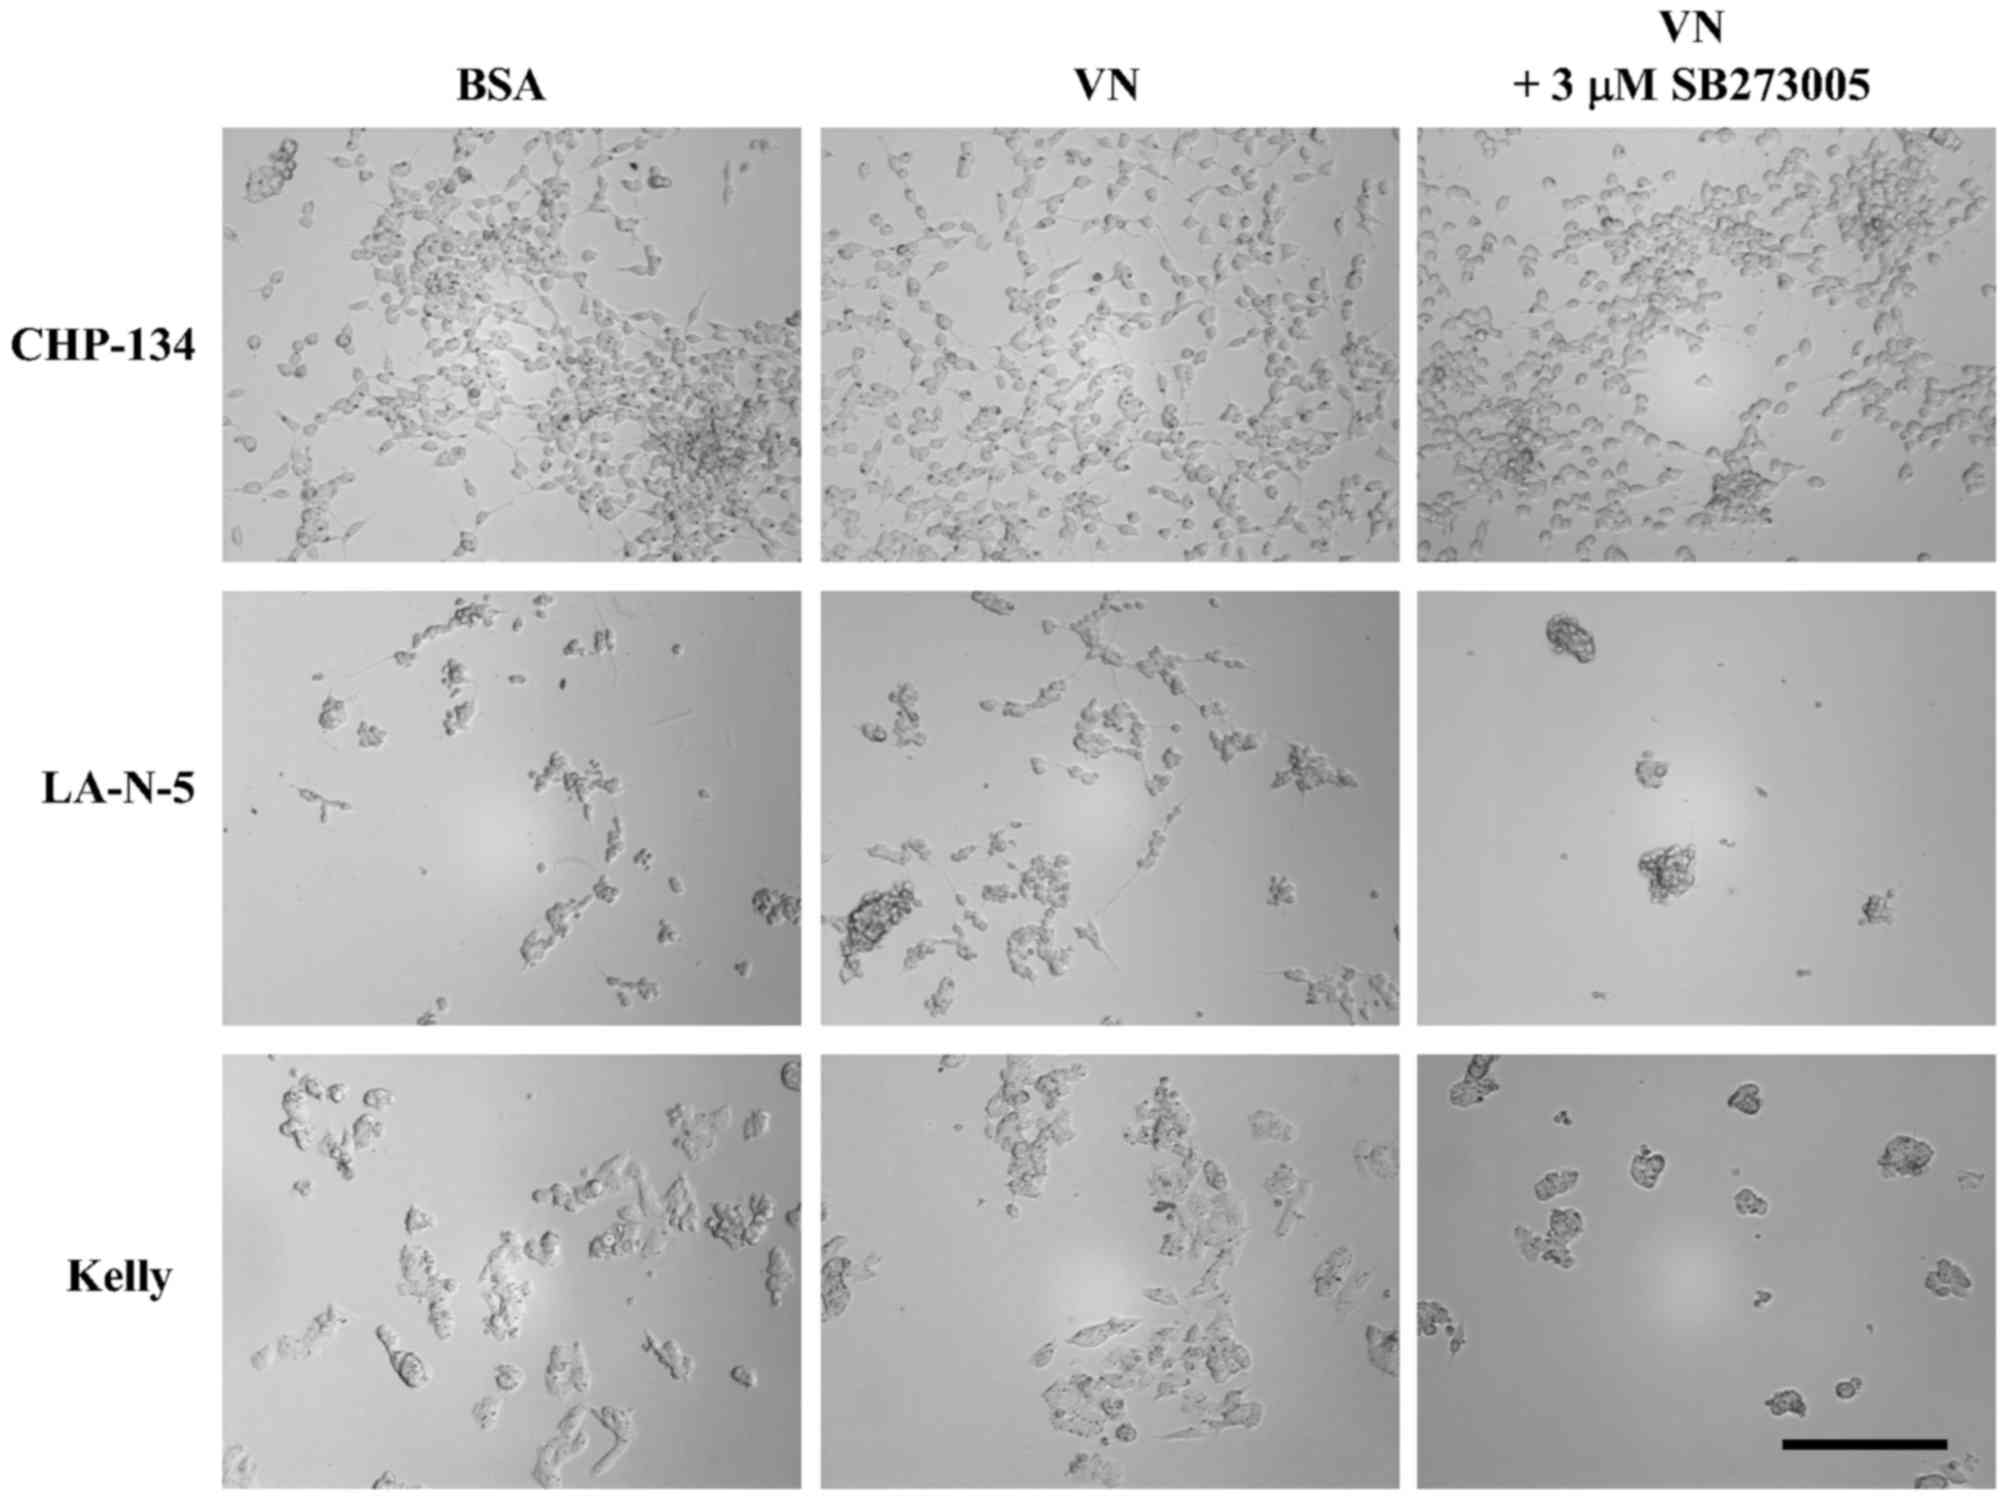
In cell cultures grown on vitronectin (VN), SB37005
(Fig. 6) and cilengitide (data not
shown) induced changes: in shape (in Kelly cells), cell spreading
(of CHP-134 cells), and aggregation (of LA-N-5 cells). Aggregation
was evident for LA-N-5 cells, but for Kelly cells the cell rounding
was quite subtle. CHP-134 cells tend to cover vitronectin-coated
surface more evenly without SB273005 suggesting that their
migration may be affected by it. Effects were observed for 3 and 10
µM concentrations of both inhibitors (Fig. 6 and data not shown). Microscopic
observations have been extended with attachment assays on
vitronectin-coated wells. First, we report that vitronectin-coated
wells retained more cells, ~80% more for LA-N-5, ~40% more for
Kelly, and approximately 30% more for CHP-134, as compared to
control, BSA blocked wells (after 2 h of incubation, P<0.01 for
LA-N-5, by two sample t-test, data not shown). Moreover, 3 and 10
µM SB273005 used alone or in combination with 14G2a
statistically meaningfully reduced attachment of LA-N-5, CHP-134
(as compared to controls set as 1, Fig. 7C and G) after 2 h of incubation.
For Kelly cells, the inhibitor used alone or combined with 14G2a
reduced cell attachment by ~40% (Fig.
7E). However, multivariate analysis did not yield statistically
significant P-values (data not shown). As a result, further
pairwise tests were not conducted.
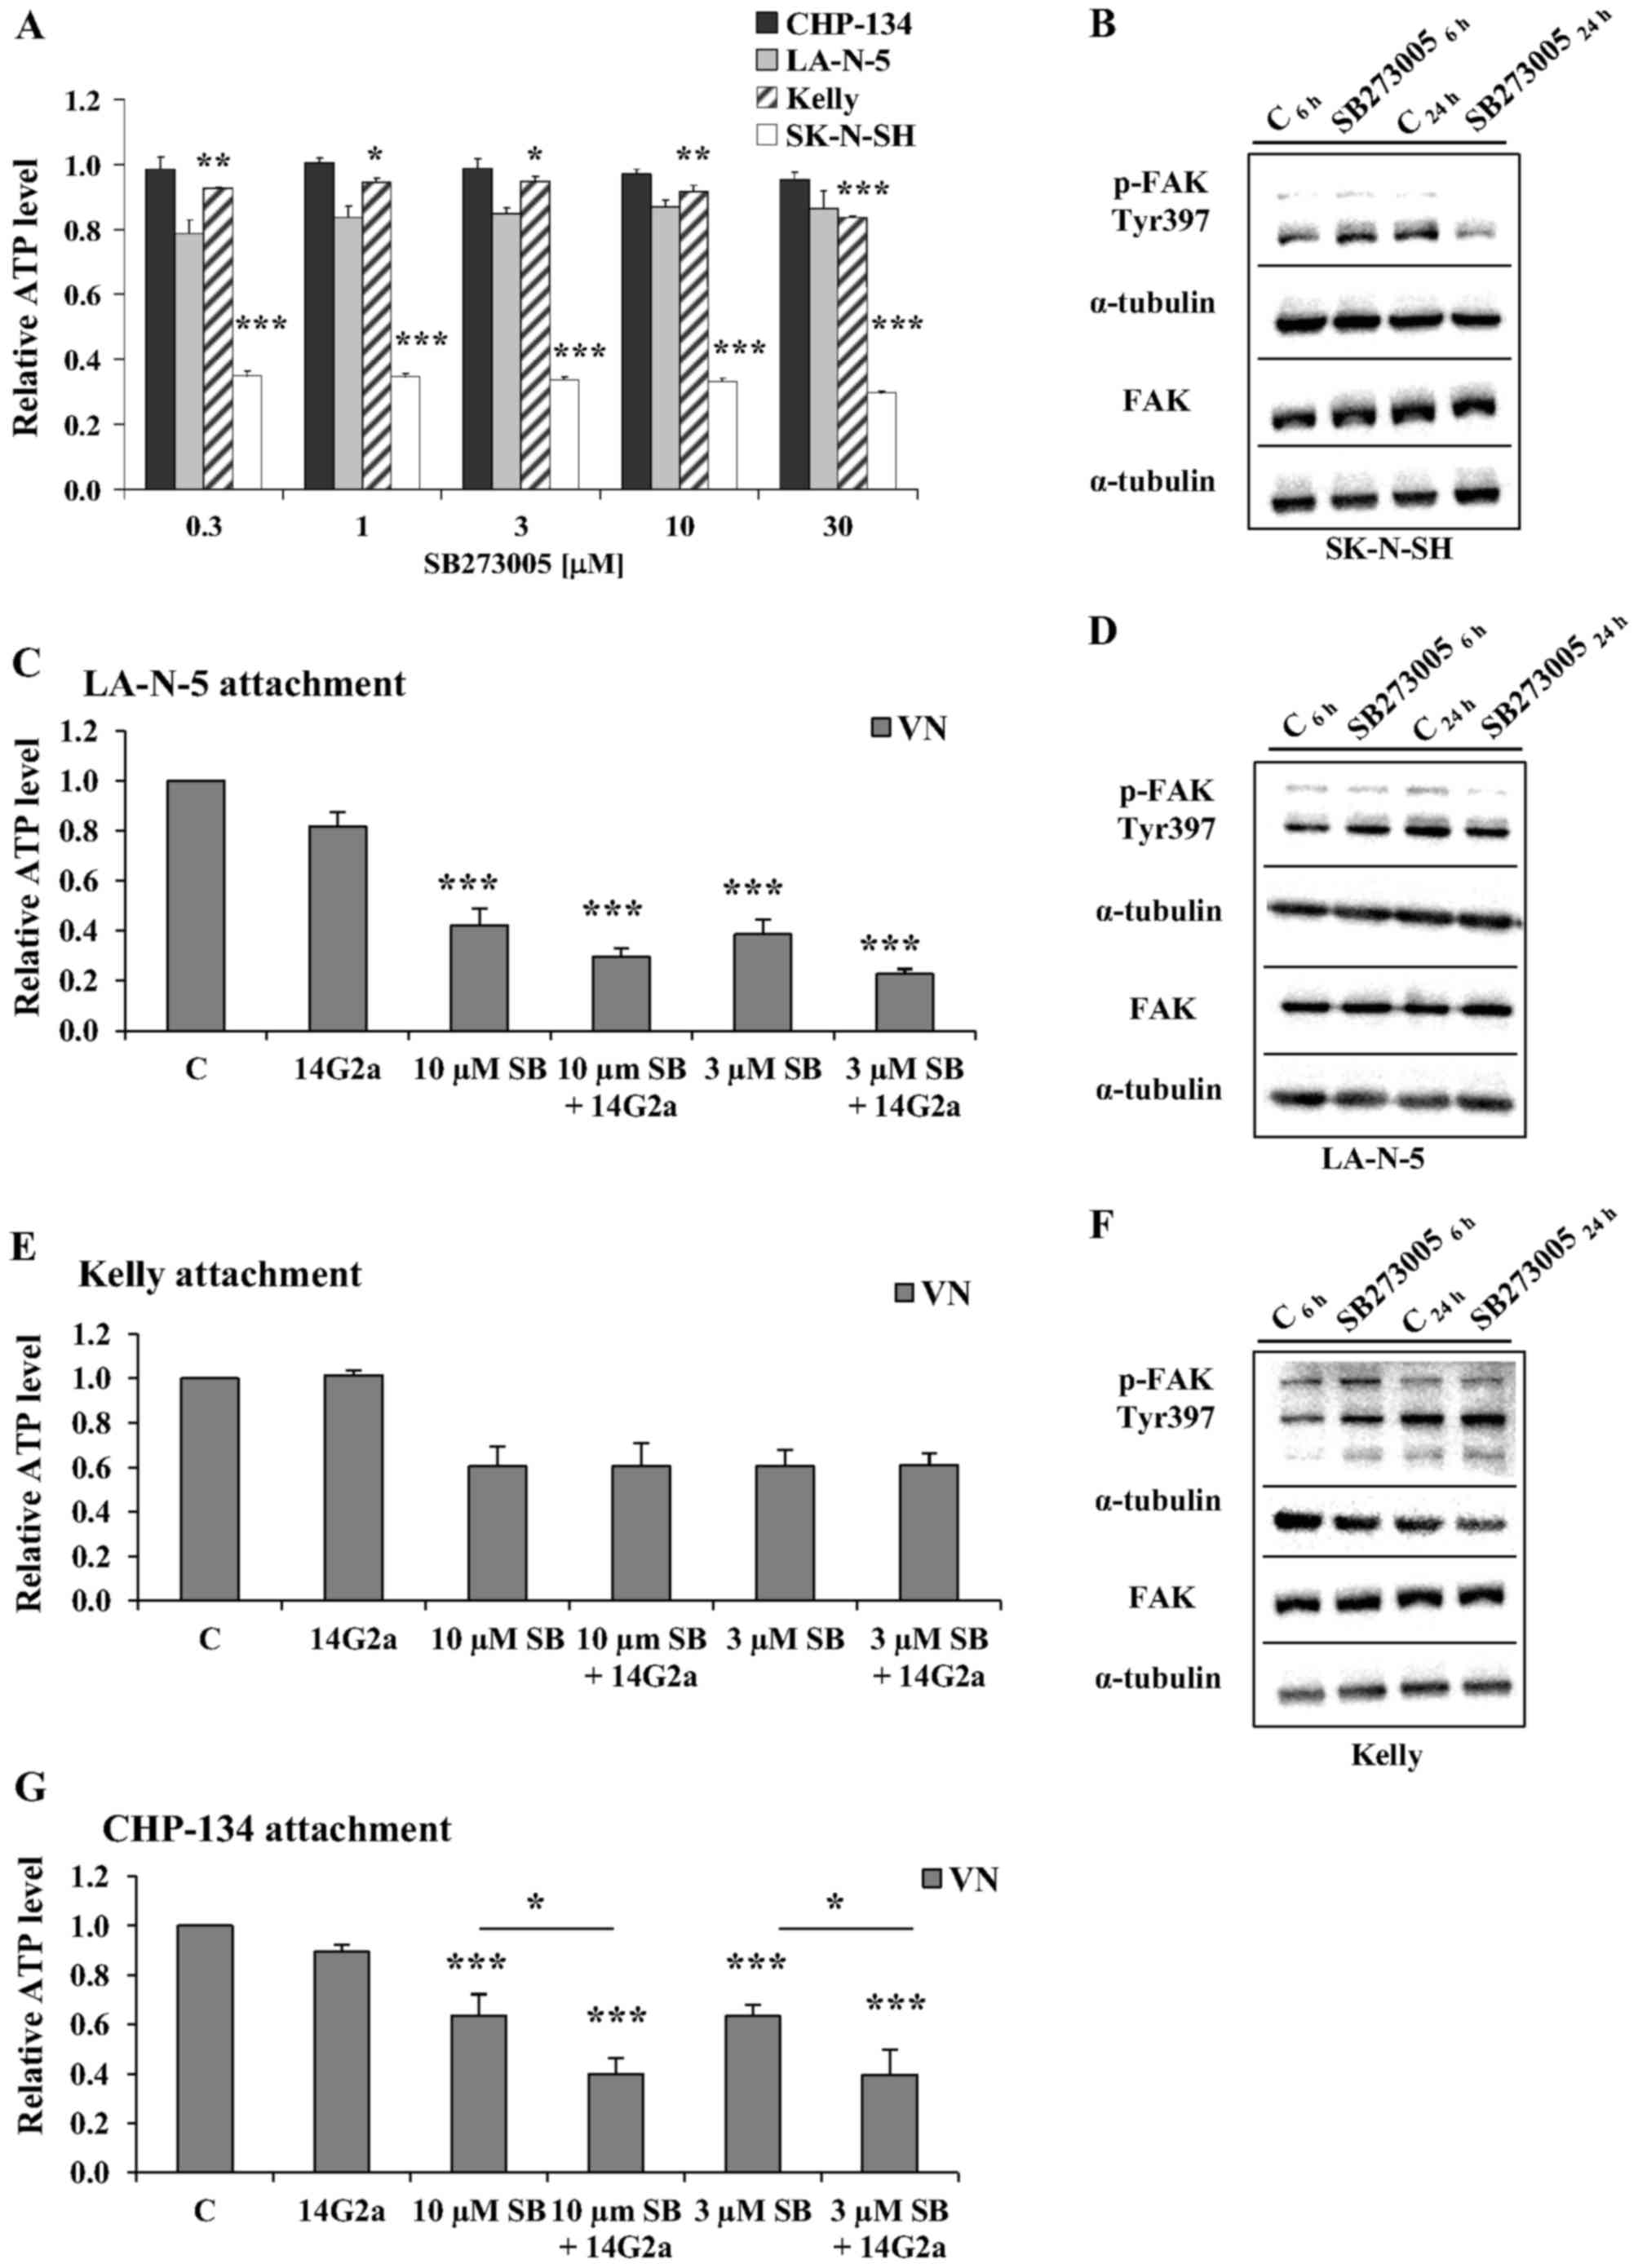 | Figure 7Effects of the specific inhibitor of
αVβ3 and αVβ5 integrin complexes (SB273005) on attachment and
survival of neuroblastoma cells. (A) Cellular ATP levels of
neuroblastoma cells grown on uncoated plates. CHP-134, LAN-5, Kelly
and SK-N-SH cells were treated with the inhibitor diluent (where
appropriate, data not shown) or SB273005 (used in the
concentrations ranging from 0.3 to 30 µM), and cultured on
uncoated plates (for 72 h). ATP levels were calculated relative to
values of respective cells treated with diluent (set as 1).
Attachment assay of (C) LA-N-5, (E) Kelly and (G) CHP-134 cells on
fibronectin-coated wells. After 2 h of incubation unattached cells
were removed, remaining cells were lysed, and levels of ATP were
measured. Some cells were incubated in the presence of 14G2a (20
µg/ml) and/or SB273005 (3 and 10 µM). Multivariate
analysis was performed with one-way repeated measures ANOVA with a
Greenhouse-Geisser correction: [(A), CHP-134 - F(1.456,
2.912)=2.939, P>0.19, LA-N-5 - F(1.189, 2.378)=9.048,
P>0.077; Kelly - F(1.707, 3.413)=20.226, P<0.014; SK-N-SH -
F(1.057, 2.115) =152.193, P<0.005; (Fig. 5C) - F(1.424, 2.848)=27.359,
P<0.015; (Fig. 5E) - F (1.015,
2.030)=9.371, P>0.09; (Fig. 5G)
- F(1.379, 2.757)=28.575, P<0.016]. Pairwise comparisons by
Dunnett's test at the significance levels *P<0.05,
**P<0.01, ***P<0.001. Selected
statistically significant comparisons are shown, while others were
omitted (for clarity of C and G graphs). Data were calculated as
means of three experiments, run in triplicate (A) or quadruplicate
(C, E and G), with SEM on the error bars. (B, D and F) Western blot
analysis of levels of p-FAK (Tyr397) and total FAK in SK-N-SH,
LA-N-5 and Kelly cells treated with SB273005 (3 µM) for 6 h
(three experiments for LA-N-5, and two experiments for SK-N-SH and
Kelly cells were performed) and 24 h (three experiments for
SH-N-SH, LA-N-5 and Kelly cells were performed). One experiment is
shown for each cell line. Control cells (treated with diluent,
marked as C, were also included). α-tubulin was used as the
reference protein. |
Also, we tested SB273005 on uncoated plates in the
range of concentrations from 0.3 to 30 µM. GD2-negative
SK-N-SH cells known from the literature to express αV (19) and from our cytometry data to
express αVβ3 and αVβ5 were also included (Table II). When ATP levels were measured
72 h after addition of the inhibitor to cell cultures grown on
standard uncoated wells, for SK-N-SH a clear cytotoxic effect was
observed, as the cells were decimated for all conditions tested
(Fig. 7A). The ATP levels of
SH-N-SH dropped by ~70% (Dunnett's test with the significance level
set at 0.001, as compared to control cells). In case of LA-N-5
cells, the ATP levels decreased ~15% (but no significant P-value
was obtained from multivariate analysis). For Kelly, ATP levels
decreased <10% (with statistical significance by Dunnett's test;
Fig. 7A). No effects on cellular
ATP levels were observed for CHP-134 incubated with SB273005 for 72
h. Additionally, we analyzed levels of phosphorylated FAK, pFAK
(Tyr397), and total FAK in SK-N-SH, LA-N-5 and Kelly treated with 3
µM SB273005 for 6 and 24 h (Fig. 7B, D and F). No changes of levels of
total FAK were observed. A clear drop in the level of
phosphorylated FAK (Tyr397) was observed in SK-N-SH cell treated
with the inhibitor for 24 h (Fig.
7B), which correlates with high toxicity of the inhibitor
against the cell line.
Clear changes in cellular appearance, i.e., cell
rounding, partial or complete aggregation and detachment, were
observed for CHP-134, LA-N-1 and Kelly when cilengitide or SB273305
(10 and 3 µM) were combined with the 14G2a mAb (for 72 h,
data not shown). Importantly the combination of cilengitide or
SB273005 (10 and 3 µM) and 14G2a (20 µg/ml) resulted
in lower ATP levels, when compared to cells treated with the single
drug, although the effects were rather small, possibly due to
restricted expression of αVβ3 in cultures of CHP-134, LA-N-5, Kelly
cells, and αVβ5 in cultures of CHP-134, LA-N-5 (Fig. 8 and Table II). For all cells effects of 14G2a
where statistically significant when compared to control cells
(Dunnett's test, not marked on Fig.
8). For LA-N-5 the effects of the mAb were statistically
significantly potentiated by 3 and 10 µM SB273005 (Fig. 8D, Dunnett's test) and for Kelly for
3 µM cilengitide and 10 µM SB273005 (Fig. 8E and F, Dunnett's test). Also,
SB273005 increased caspase-3/-7 activities in CHP-134, LA-N-5,
Kelly cells (Fig. 9), and the
effects were statistically meaningful for the last two cell lines
mentioned (Fig. 9B and C;
Dunnett's test). Importantly, for LA-N-5 and Kelly cells, the
effects of the mAb were statistically significantly potentiated by
3 and 10 µM SB273005 (Fig. 9B
and C, Dunnett's test).
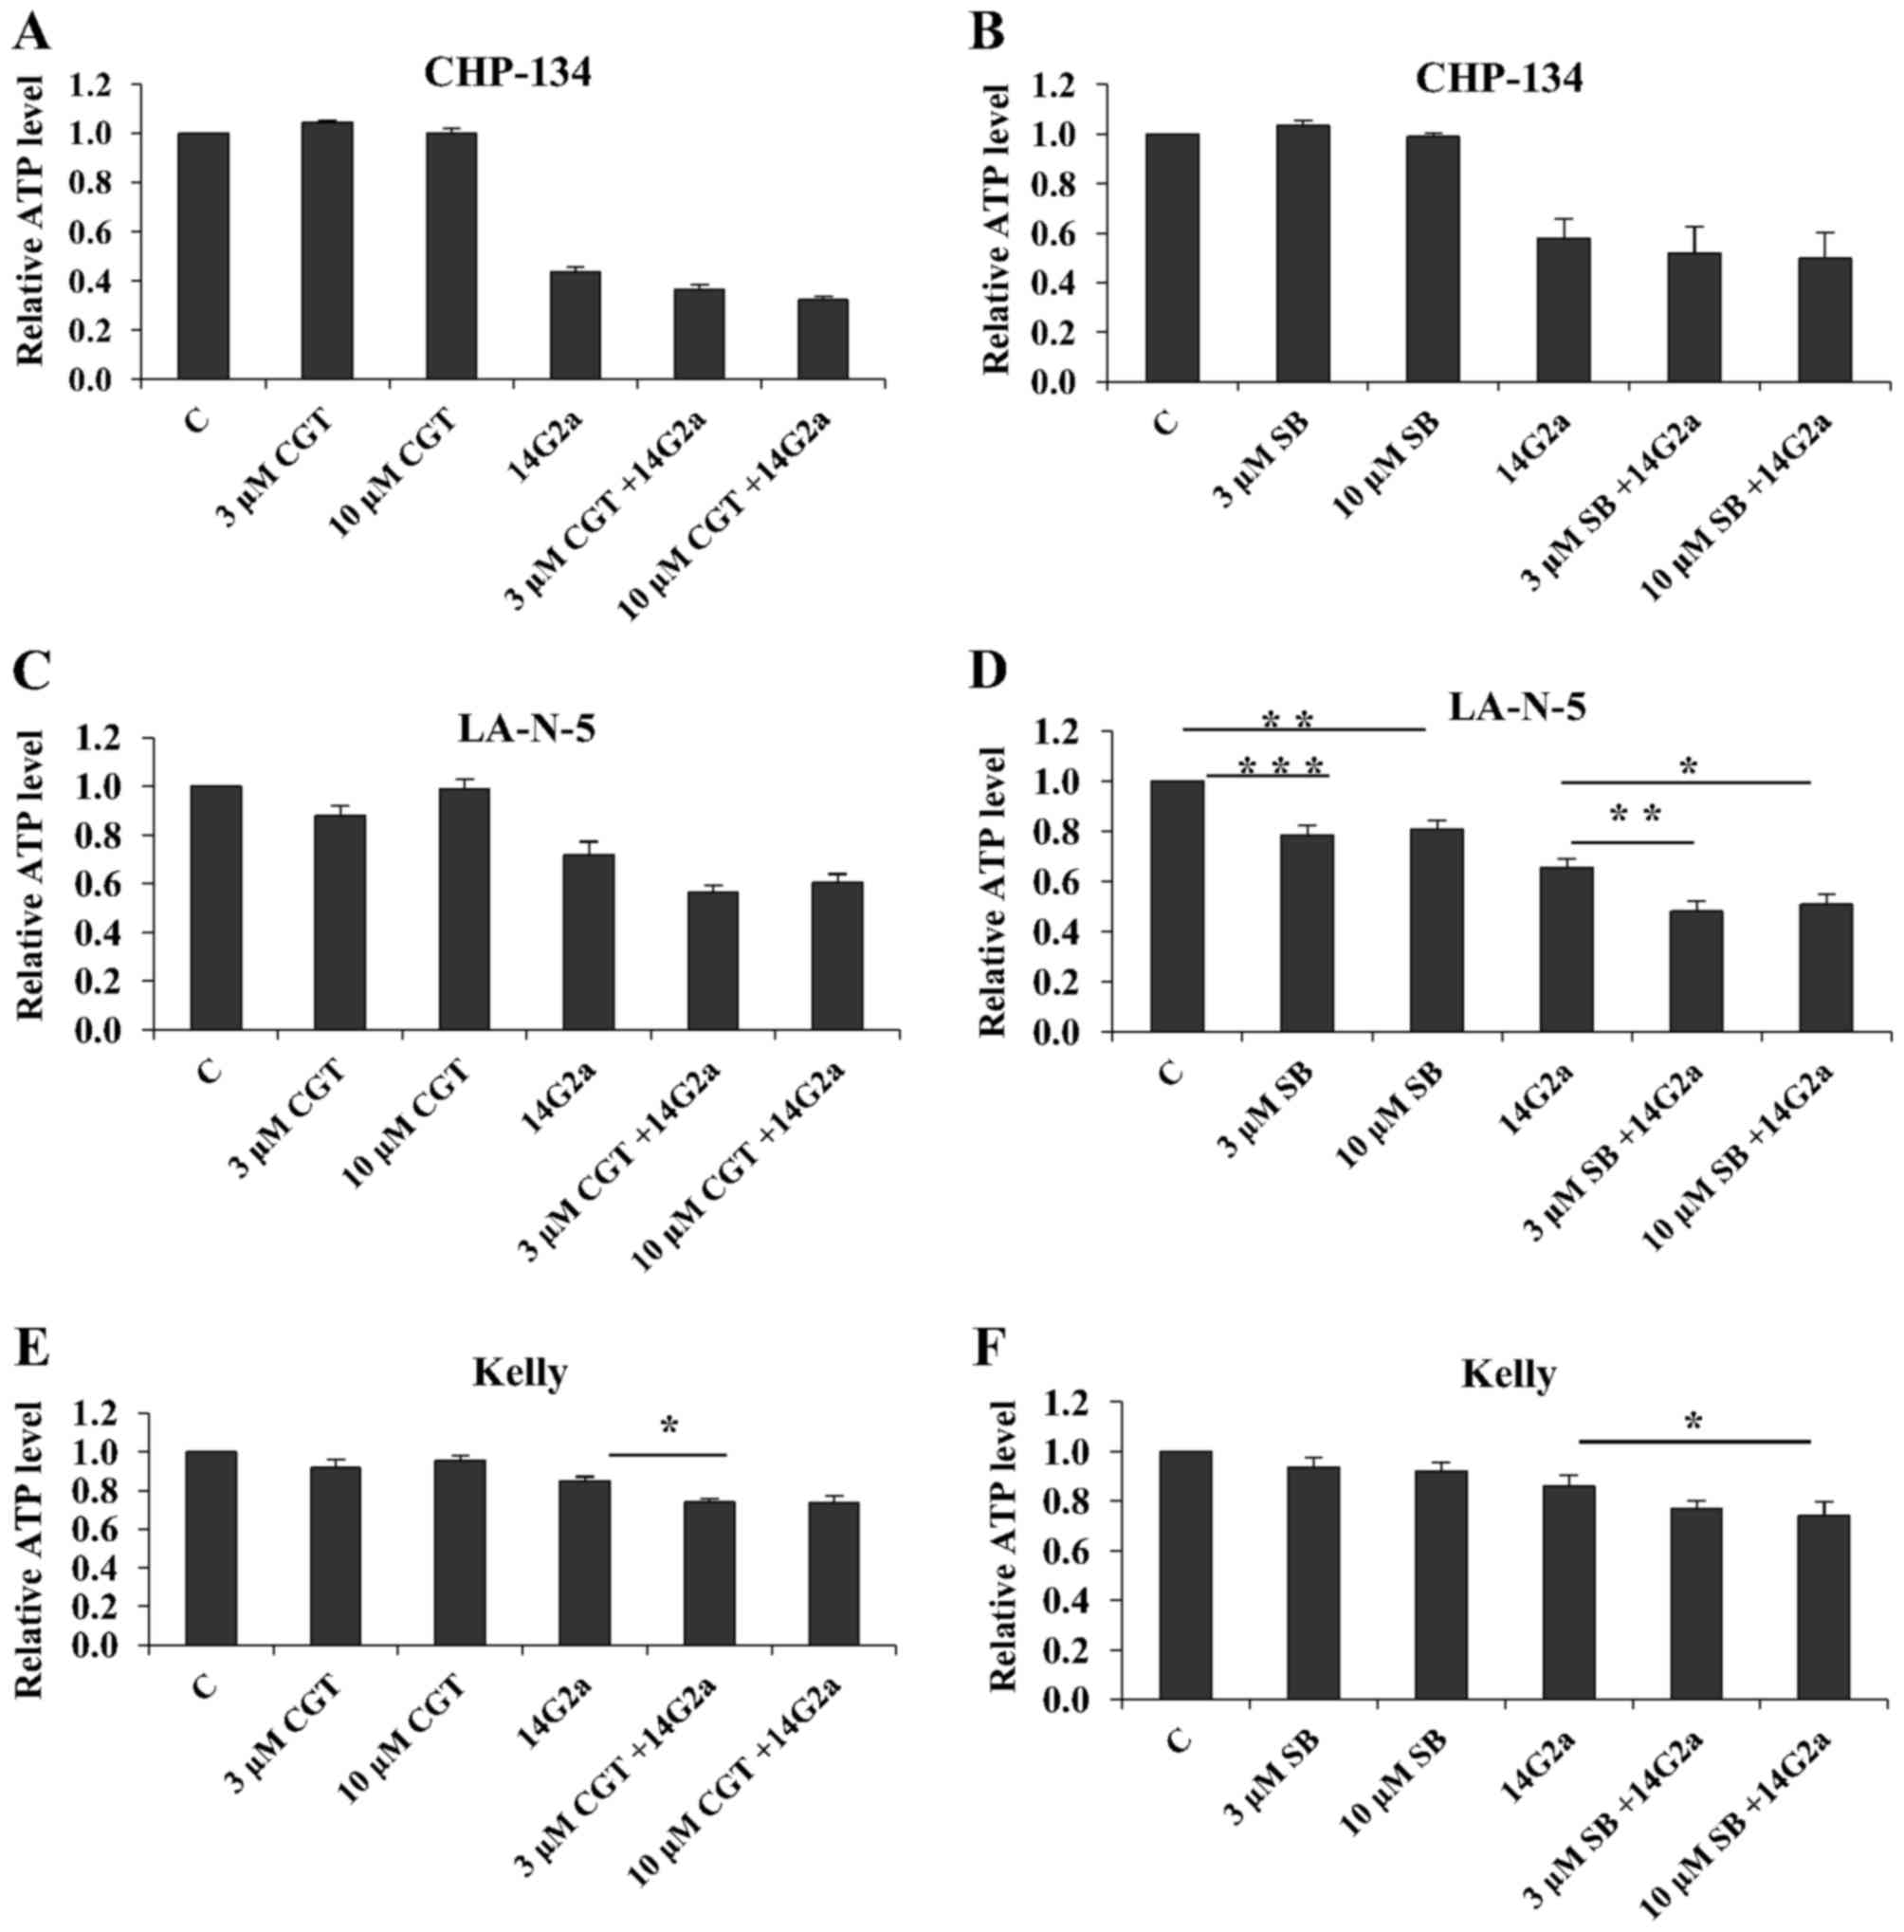 | Figure 8Effects of the specific inhibitors of
αVβ3 and αVβ5 integrin complexes (cilengitide and SB273005) on
cellular ATP levels of neuroblastoma cells. CHP-134, LAN-5 and
Kelly cells treated with the inhibitor diluent (where appropriate,
set as 1 in the figures), cilengitide (used in the concentrations
of 3 and 10 µM, marked as CGT in A, C and E), SB273005 (used
in the concentrations of 3 and 10 µM, marked as SB in B, D
and F), combinations of the inhibitors and the 14G2a mAb (20
µg/ml) and cultured on vitronectin-coated and BSA-blocked
wells (for 72 h). ATP levels were calculated relative to values of
cells treated with diluent (set as 1 in the figures). Multivariate
analysis was performed with one-way repeated measures ANOVA with a
Greenhouse-Geisser correction: [(A) - F(1, 1)=13.813, P>0.16; (B) - F(1.042,
4.169)=18.114, P<0.012; (C) - F(1.276, 2.552)=14.608,
P<0.042; (D)- F(1.368, 4.104)=39.227, P<0.0026; (E) -
F(1.604, 3.207)=14.943, p<0.025; (F) - F(1.7, 6.799)=10.987,
P<0.009]. Pairwise comparisons by Dunnett's test at the
significance levels *P<0.05, **P<0.01
and ***P<0.001 vs. C, and vs. 14G2a. Note that only
significances between C vs. 10 and 3 µM inhibitors, and
14G2a vs. combined treatments are shown, where present, while other
were omitted (for clarity of graphs). Data were calculated as means
of (A) two, (C and E) three, (D) four and (B and F) five
experiments, run in triplicate, with SEM on the error bars. |
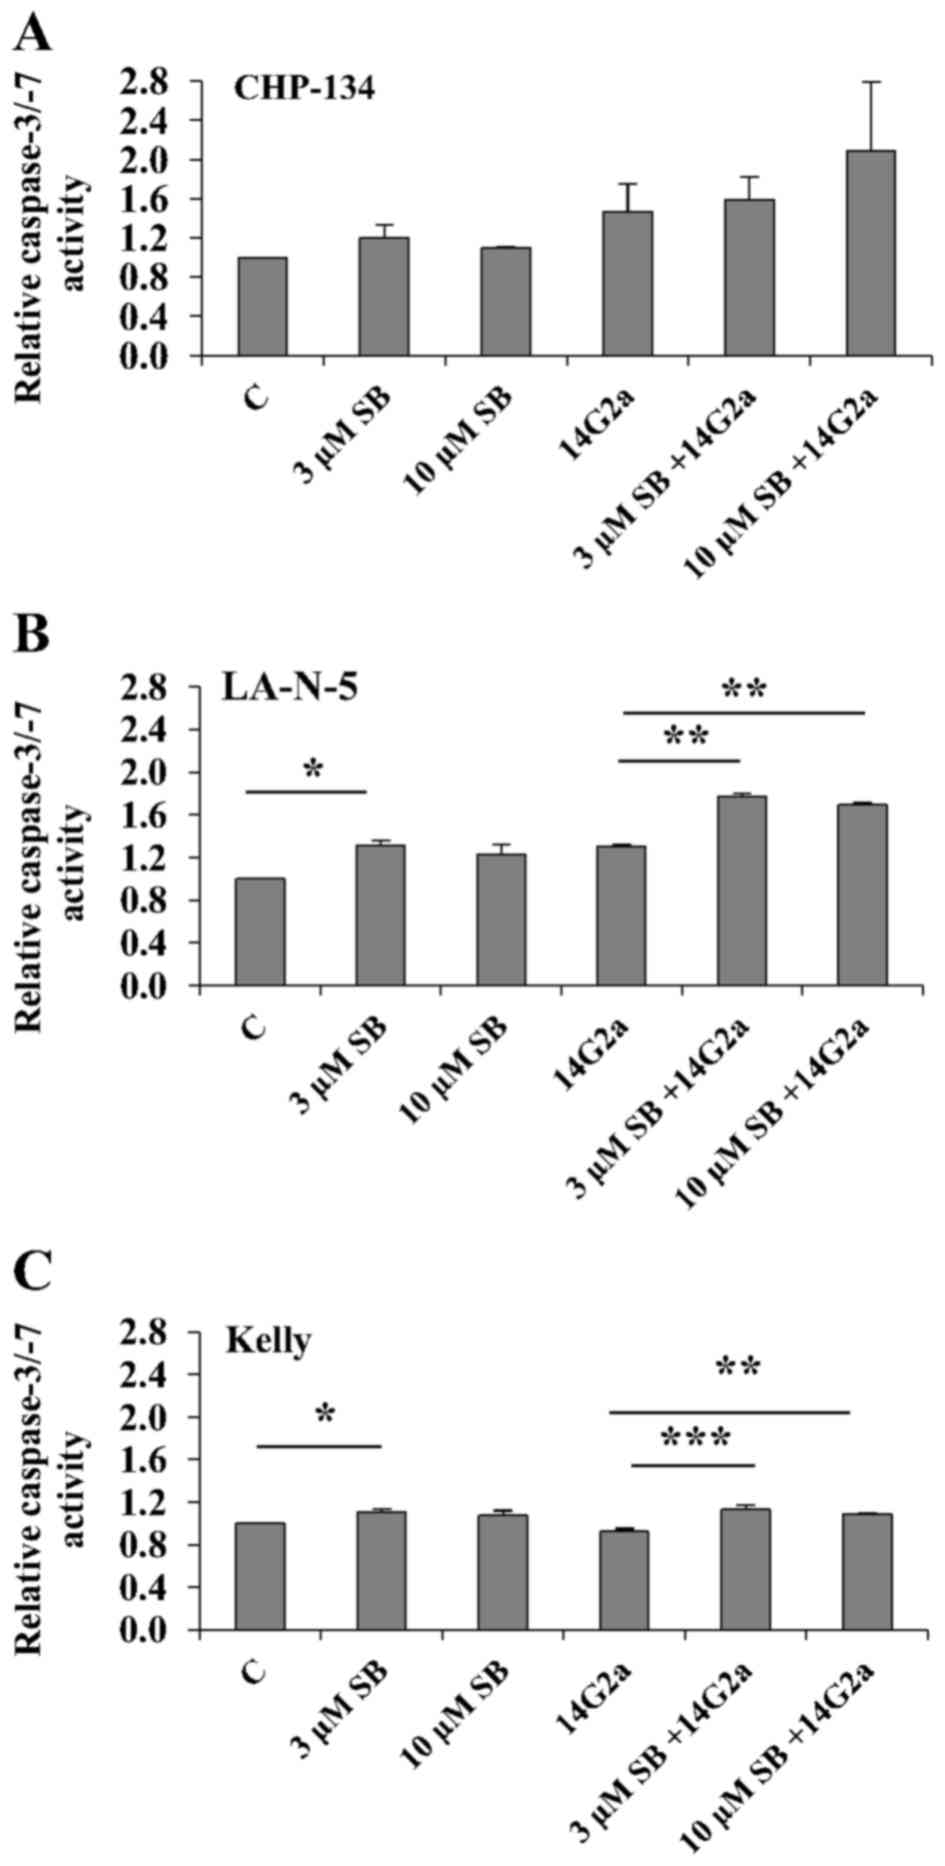 | Figure 9Effects of the specific inhibitor of
αVβ3 and αVβ5 integrin complexes (SB273005) on caspase-3/-7
activities of neuroblastoma cells. CHP-134, LAN-5 and Kelly cells
treated with the inhibitor diluent (where appropriate, set as 1 in
the figures), SB273005 (used in the concentrations of 3 and 10
µM, marked as SB in A–C), combinations of the inhibitor and
the 14G2a mAb (20 µg/ml), and cultured on vitronectin-coated
and BSA-blocked wells (for 72 h). Activities of caspase-3/-7 were
calculated relative to values of cells treated with diluent.
Multivariate analysis was performed with one-way repeated measures
ANOVA with a Greenhouse-Geisser correction: [(A) - F(1.034,
2.068)=3.825, P>0.186, (B) - F(1.39, 2.779)=20.318, P<0.023;
(C) - F(1.744, 3.487)=9.887, P<0.038]. Pairwise comparisons by
Dunnett's test at the significance levels *P<0.05,
**P<0.01 and ***P<0.001. Selected
statistically significant comparisons are shown, while others were
omitted (for clarity of B and C graphs). Data were calculated as
means of three experiments, run in duplicate, with SEM on the error
bars. |
Discussion
Numerous data support the view that cell signaling
arising from interactions of tumor cells via integrins with the
surrounding environment affects phenotype of the cells including
their survival, degree of differentiation, potential to metastasize
and resistance to drugs (reviewed in ref. 31). Over the past decades, reports on
the expression of integrin in samples of neuroblastoma tumors from
patients and established cell lines have accumulated (reviewed in
ref. 32). Hence, it was shown
that α4 and α5 integrins are expressed on stage III and IV
neuroblastoma tumors, as well as on numerous neuroblastoma cell
lines, where the receptors regulate cell motility (33). Additionally, Young et al
(18) showed that integrin α4 may
be associated with poor outcome in neuroblastoma patients without
MYCN amplification. Hsu et al (34) reported that expression of the
B4GALNT3 protein in tumor samples correlated with good outcome.
More importantly, the authors showed that levels of the protein
increased in SK-N-SH cells by all-trans retinoic
acid-treatment. Also, they showed that B4GALNT3 expression
suppressed cell migration and invasion along with downregulation of
β1 signaling (34). Furthermore,
Leblond et al (35) showed
expression of αVβ3 and αVβ5 on some neuroblastoma cell lines along
with their sensitivity to cilengitide.
The results presented by us stemmed from our
observation that in cell lines such as IMR-32, LA-N-1 and CHP-134,
the treatment with the anti-GD2 14G2a mAb was accompanied by
changes in cellular morphology (10) (Fig.
2). Additionally, we found that the nonadherent surface used
for culture of all tested neuroblastoma cell lines led to decreased
ATP levels. On the contrary, presence of fibronectin or collagen IV
in wells where IMR-32 and LA-N-1 cells were treated with the 14G2a
mAb, led to increased values of cellular ATP. The above data
encouraged us to investigate how selected inhibitors of integrins
influenced cell sensitivity to 14G2a. Also, our report on the
integrin expression on IMR-32, CHP-134, LA-N-1, LA-N-5, Kelly and
SK-N-SH cells add to already published data and allowed us to plan
experiments with the inhibitors used.
Based on the findings, we decided to take advantage
of selective inhibitors of integrin complexes: obtustatin
(inhibitor of α1β1), BIO 1211 (inhibitor of active α4β1),
cilengitide and SB273005 (inhibitors of αVβ3, αVβ5) that were used
alone or in combination with the 14G2a mAb in our experiments. Our
data showed that cellular ATP levels of IMR-32, CHP-134 and Kelly
cells grown on collagen IV were not affected by obtustatin in the
concentrations tested, with or without the 14G2a mAb. Effects of
BIO 1211 on cellular appearance and ATP levels were evident only
for IMR-32 cells grown on fibronectin, possibly due to very
restricted expression of α4 subunit in CHP-134 and Kelly cell
cultures. No data on expression of α4β1 on the cell lines was
obtained, due to the fact that no commercially available antibody
specific for the human integrin complex was found. Due to limited
expression of α4 and possibly of α4β1, multivariate analyses showed
no significant differences of viability between cells treated with
the 14G2a mAb and combination of BIO 1211 and the mAb. Availability
of antibodies recognizing αVβ3, αVβ5 complexes of integrins allows
for correlation of observed effects of inhibitors with levels of
expression of the hetrodimers on cells. Despite low percentages of
cells expressing αVβ3, αVβ5 in cultures of LA-N-5 and CHP-134
cells, and αVβ3 in Kelly cell cultures, SB273005 and cilengitide
caused aggregation and rounding in LA-N-5 and Kelly cultures,
respectively, and seemed to affect cell spreading of CHP-134 cells,
and SB273005 reduced attachment of the three cell lines. The
changes were accompanied by decreased ATP levels after 72 h of
incubation in LA-N-5 and Kelly cells. LA-N-5 cells were the most
sensitive to combination of SB273005 and 14G2a. Notably, SB273005
was highly cytotoxic to the SK-N-SH cell line, even when the cells
were grown on uncoated wells. The sensitivity of the cell line to
the inhibitor may reflect the fact that >85% of SK-N-SH cells
express αVβ3 or αVβ5.
Future experiments should be planned on
integrin-enriched pools of cells to characterize sensitivity of
neuroblastoma cells positive for α4β1, αVβ3 and αVβ5 to inhibitors
and the 14G2 mAb, as α4 was shown to be linked to outcome in
neuroblastoma (18) and the αVβ3
complex contributes to cancer stem cells, and along with α4β1 to
bone metastasis (31). To gather
more information, our future experiments should include testing
other concentrations of the inhibitors. Also, testing for
caspase-3/-7 activation in treated cell lines in additional
time-points, such as 24 or 48 h, to find if there is
time-dependence in our models. Effects of our drugs on caspase-8
activity can be tested (if expressed), as unligated or antagonized
integrins promote caspase-8 activation (36). Furthermore, the data could be
extended with experiments investigating how the 14G2a mAb (alone or
in combination with the integrin antagonists) affect neuroblastoma
migration and invasion. In that context, it would be interesting to
characterize if expression and localization of integrins is
affected by the 14G2a in neuroblastoma. It is already established
that treatment of some neuroblastoma cell lines with
all-trans retinoic acid and fenretinide decreased levels of
β1 integrin (37). Combination of
the inhibitors could also be used, as from the evidence of
expression of several integrins in the cell lines and known overlap
of their ligand specificities redundancy effects may be expected.
It should be noted that a dual antagonist of α1β1/α2β1 integrins
was recently reported (38). Also,
other proteins, i.e., galectins affecting integrin clustering, can
be inhibited in our models (39).
Wu et al (33) reported that migration of NB8
neuroblastoma cells mediated by α5β1 integrin involved pathways
engaging SRC and FAK, but movement mediated by α4β1 integrin
involved only SRC. We have already shown that dephosphorylation of
β-catenin (phosphorylation of the protein is involved in anoikis
resistance) (40), Tyr397 of FAK
(the phosphorylation is important for cell survival) (41), an increase in activating
phosphorylation of Tyr420 of FYN (expression of active FYN is
linked to good outcome in neuroblastoma independently of
MYCN amplification) (42),
downregulation of AKT/mTOR network, a decrease in nuclear levels of
MYCN (a known regulator of FAK expression) (43) are all linked among other changes of
proteins to treatment of IMR-32 with 14G2a (10,11).
From the available literature, it is known that targeting kinases
linked to integrin signaling can be exploited in neuroblastoma
therapy. Therefore, a small molecule inhibitor of FAK affects
neuroblastoma cell growth in vitro and in vivo, with
greatest effects observed for cells with higher MYCN levels
(41). Also, FAK/PAK1/MAPK cascade
is linked to promotion of anchorage-independent growth by integrin
β1 in breast cancer cells (44).
Thus, our data encourage for further characterization of signaling
pathways involving integrins, also in neuroblastoma cells treated
with integrin inhibitors, used alone or in combination with the
14G2a mAb. Again, in this context, neuroblastoma cell populations
enriched for α4, αVβ3 and αVβ5 integrins should be used.
Finally, although our goals were focused on
application of the inhibitors to verify involvement of their
targets in sensitivity of selected cell lines to the 14G2a mAb,
additional aspects of such drug combinations could be examined
using in vivo models of neuroblastoma. This include testing
of potential of tumor cells to metastasize to sites characteristic
for high risk neuroblastoma such as bones or lymph nodes, in the
presence of 14G2a and inhibitors of integrins, used alone and in
combinations, possibly with neuroblastoma cell populations enriched
for α4, αVβ3 and αVβ5 integrins. Such experiments could yield
clinically relevant data. Effects on tumor growth, angiogenesis and
immune system should be carefully evaluated, especially as the
recent findings show that cilengitide failed to improve survival in
glioblastoma in clinical trials (17). Also, Su et al (45) reported that targeting integrin β3
with cilengitide increased immunosuppression in cancer models.
To summarize, we applied small molecule inhibitors
of selected integrin complexes: obtustatin (inhibiting α1β1), BIO
1211 (inhibiting active α4β1), cilengitide and SB273005 (inhibitors
of αVβ3, αVβ5) and verified their effects on appearance, attachment
and survival of neuroblastoma cell lines, for the compounds used
alone or in combination with the mAb. Our results broaden knowledge
on factors influencing cytotoxicity against neuroblastoma cell
lines evoked by 14G2a.
Abbreviations:
|
ECM
|
extracellular matrix
|
|
FBS
|
fetal bovine serum
|
|
FAK
|
focal adhesion kinase
|
|
GD2
|
GD2 ganglioside
|
|
GD3
|
GD3 ganglioside
|
|
mAb
|
monoclonal antibody
|
|
SB
|
SB273005
|
|
CGT
|
cilengitide
|
|
BSA
|
bovine serum albumin
|
|
VN
|
vitronectin
|
|
PBS
|
phosphate-buffered saline
|
Acknowledgments
We are grateful to Dr R. Reisfeld for providing us
with the hybridoma cell line producing the 14G2a mAb. We are
grateful to Dr K. Stalińska, from the Department of Cellular
Biochemistry; Faculty of Biochemistry, Biophysics and Biotechnology
of the Jagiellonian University (Kraków, Poland) for her help with
the collection of the microscopic images. We are grateful to Dr
Małgorzata Bzowska (Department of Immunology of the Faculty of
Biochemistry, Biophysics and Biotechnology, Jagiellonian
University) for her help with the flow cytometric analyses. We are
grateful to SelleckChem. com for providing free aliquots of
cilengitide and SB273005. This project was supported by grant no.
NCN -2012/07/B/NZ 1/02808 from the Polish National Science Center
(to H.R.) and DS/8/WBBiB UJ. We are grateful to the Departments of
Medical Biotechnology and Cellular Biochemistry (Faculty of
Biochemistry, Biophysics and Biotechnology of the Jagiellonian
University, Kraków, Poland) for access to some equipment. Faculty
of Biochemistry, Biophysics and Biotechnology is a partner of the
Leading National Research Center (KNOW) supported by the Ministry
of Science and Higher Education.
References
|
1
|
Cheung NK and Dyer MA: Neuroblastoma:
Developmental biology, cancer genomics and immunotherapy. Nat Rev
Cancer. 13:397–411. 2013. View Article : Google Scholar : PubMed/NCBI
|
|
2
|
Schmidt ML, Lal A, Seeger RC, Maris JM,
Shimada H, O'Leary M, Gerbing RB and Matthay KK: Favorable
prognosis for patients 12 to 18 months of age with stage 4
nonamplified MYCN neuroblastoma: A Children's Cancer Group Study. J
Clin Oncol. 23:6474–6480. 2005. View Article : Google Scholar : PubMed/NCBI
|
|
3
|
Pugh TJ, Morozova O, Attiyeh EF,
Asgharzadeh S, Wei JS, Auclair D, Carter SL, Cibulskis K, Hanna M,
Kiezun A, et al: The genetic landscape of high-risk neuroblastoma.
Nat Genet. 45:279–284. 2013. View Article : Google Scholar : PubMed/NCBI
|
|
4
|
Smith MA, Seibel NL, Altekruse SF, Ries
LA, Melbert DL, O'Leary M, Smith FO and Reaman GH: Outcomes for
children and adolescents with cancer: Challenges for the
twenty-first century. J Clin Oncol. 28:2625–2634. 2010. View Article : Google Scholar : PubMed/NCBI
|
|
5
|
Navid F, Santana VM and Barfield RC:
Anti-GD2 antibody therapy for GD2-expressing tumors. Curr Cancer
Drug Targets. 10:200–209. 2010. View Article : Google Scholar : PubMed/NCBI
|
|
6
|
Hoy SM: Dinutuximab: A review in high-risk
neuroblastoma. Target Oncol. 11:247–253. 2016. View Article : Google Scholar : PubMed/NCBI
|
|
7
|
Yu AL, Gilman AL, Ozkaynak MF, London WB,
Kreissman SG, Chen HX, Smith M, Anderson B, Villablanca JG, Matthay
KK, et al Children's Oncology Group: Anti-GD2 antibody with GM-CSF,
interleukin-2, and isotretinoin for neuroblastoma. N Engl J Med.
363:1324–1334. 2010. View Article : Google Scholar : PubMed/NCBI
|
|
8
|
Horwacik I and Rokita H: Targeting of
tumor-associated ganglio-sides with antibodies affects signaling
pathways and leads to cell death including apoptosis. Apoptosis.
20:679–688. 2015. View Article : Google Scholar : PubMed/NCBI
|
|
9
|
Cochonneau D, Terme M, Michaud A,
Dorvillius M, Gautier N, Frikeche J, Alvarez-Rueda N, Bougras G,
Aubry J, Paris F, et al: Cell cycle arrest and apoptosis induced by
O-acetyl-GD2-specific monoclonal antibody 8B6 inhibits tumor growth
in vitro and in vivo. Cancer Lett. 333:194–204. 2013. View Article : Google Scholar : PubMed/NCBI
|
|
10
|
Horwacik I, Durbas M, Boratyn E, Węgrzyn P
and Rokita H: Targeting GD2 ganglioside and aurora A kinase as a
dual strategy leading to cell death in cultures of human
neuroblastoma cells. Cancer Lett. 341:248–264. 2013. View Article : Google Scholar : PubMed/NCBI
|
|
11
|
Durbas M, Horwacik I, Boratyn E, Kamycka E
and Rokita H: GD2 ganglioside specific antibody treatment
downregulates PI3K/Akt/mTOR signaling network in human
neuroblastoma cell lines. Int J Oncol. 47:1143–1159.
2015.PubMed/NCBI
|
|
12
|
Hynes RO: Integrins: Bidirectional,
allosteric signaling machines. Cell. 110:673–687. 2002. View Article : Google Scholar : PubMed/NCBI
|
|
13
|
Bouvard D, Pouwels J, De Franceschi N and
Ivaska J: Integrin inactivators: Balancing cellular functions in
vitro and in vivo. Nat Rev Mol Cell Biol. 14:430–442. 2013.
View Article : Google Scholar : PubMed/NCBI
|
|
14
|
Jin H and Varner J: Integrins: Roles in
cancer development and as treatment targets. Br J Cancer.
90:561–565. 2004. View Article : Google Scholar : PubMed/NCBI
|
|
15
|
Hersey P, Sosman J, O'Day S, Richards J,
Bedikian A, Gonzalez R, Sharfman W, Weber R, Logan T, Buzoianu M,
et al Etaracizumab Melanoma Study Group: A randomized phase 2 study
of etaracizumab, a monoclonal antibody against integrin
αvβ3, ± dacarbazine in patients with stage IV
metastatic melanoma. Cancer. 116:1526–1534. 2010. View Article : Google Scholar : PubMed/NCBI
|
|
16
|
Bell-McGuinn KM, Matthews CM, Ho SN, Barve
M, Gilbert L, Penson RT, Lengyel E, Palaparthy R, Gilder K, Vassos
A, et al: A phase II, single-arm study of the anti-α5β1 integrin
antibody volociximab as monotherapy in patients with
platinum-resistant advanced epithelial ovarian or primary
peritoneal cancer. Gynecol Oncol. 121:273–279. 2011. View Article : Google Scholar : PubMed/NCBI
|
|
17
|
Stupp R, Hegi ME, Gorlia T, Erridge SC,
Perry J, Hong YK, Aldape KD, Lhermitte B, Pietsch T, Grujicic D, et
al European Organisation for Research and Treatment of Cancer
(EORTC); Canadian Brain Tumor Consortium; CENTRIC study team:
Cilengitide combined with standard treatment for patients with
newly diagnosed glioblastoma with methylated MGMT promoter (CENTRIC
EORTC 26071–22072 study): A multi-centre, randomised, open-label,
phase 3 trial. Lancet Oncol. 15:1100–1108. 2014. View Article : Google Scholar : PubMed/NCBI
|
|
18
|
Young SA, McCabe KE, Bartakova A, Delaney
J, Pizzo DP, Newbury RO, Varner JA, Schlaepfer DD and Stupack DG:
Integrin α4 enhances metastasis and may be associated with poor
prognosis in MYCN-low neuroblastoma. PLoS One. 10:e01208152015.
View Article : Google Scholar
|
|
19
|
Lee S, Qiao J, Paul P and Chung DH:
Integrin β1 is critical for gastrin-releasing peptide
receptor-mediated neuroblastoma cell migration and invasion.
Surgery. 154:369–375. 2013. View Article : Google Scholar : PubMed/NCBI
|
|
20
|
Cheresh DA, Pierschbacher MD, Herzig MA
and Mujoo K: Disialogangliosides GD2 and GD3 are involved in the
attachment of human melanoma and neuroblastoma cells to
extracellular matrix proteins. J Cell Biol. 102:688–696. 1986.
View Article : Google Scholar : PubMed/NCBI
|
|
21
|
Ohkawa Y, Miyazaki S, Miyata M, Hamamura K
and Furukawa K and Furukawa K: Essential roles of integrin-mediated
signaling for the enhancement of malignant properties of melanomas
based on the expression of GD3. Biochem Biophys Res Commun.
373:14–19. 2008. View Article : Google Scholar : PubMed/NCBI
|
|
22
|
Dippold WG, Knuth A and Meyer zum
Büschenfelde KH: Inhibition of human melanoma cell growth in vitro
by monoclonal anti-GD3-ganglioside antibody. Cancer Res.
44:806–810. 1984.PubMed/NCBI
|
|
23
|
Kowalczyk A, Gil M, Horwacik I, Odrowaz Z,
Kozbor D and Rokita H: The GD2-specific 14G2a monoclonal antibody
induces apoptosis and enhances cytotoxicity of chemotherapeutic
drugs in IMR-32 human neuroblastoma cells. Cancer Lett.
281:171–182. 2009. View Article : Google Scholar : PubMed/NCBI
|
|
24
|
Marcinkiewicz C, Weinreb PH, Calvete JJ,
Kisiel DG, Mousa SA, Tuszynski GP and Lobb RR: Obtustatin: A potent
selective inhibitor of alpha1beta1 integrin in vitro and
angiogenesis in vivo. Cancer Res. 63:2020–2023. 2003.PubMed/NCBI
|
|
25
|
Lin K, Ateeq HS, Hsiung SH, Chong LT,
Zimmerman CN, Castro A, Lee WC, Hammond CE, Kalkunte S, Chen LL, et
al: Selective, tight-binding inhibitors of integrin alpha4beta1
that inhibit allergic airway responses. J Med Chem. 42:920–934.
1999. View Article : Google Scholar : PubMed/NCBI
|
|
26
|
Taga T, Suzuki A, Gonzalez-Gomez I, Gilles
FH, Stins M, Shimada H, Barsky L, Weinberg KI and Laug WE: alpha
v-integrin antagonist EMD 121974 induces apoptosis in brain tumor
cells growing on vitronectin and tenascin. Int J Cancer.
98:690–697. 2002. View Article : Google Scholar : PubMed/NCBI
|
|
27
|
Gomes N, Vassy J, Lebos C, Arbeille B,
Legrand C and Fauvel-Lafeve F: Breast adenocarcinoma cell adhesion
to the vascular subendothelium in whole blood and under flow
conditions: Effects of alphavbeta3 and alphaIIbbeta3 antagonists.
Clin Exp Metastasis. 21:553–561. 2004. View Article : Google Scholar
|
|
28
|
Horwacik I, Kurciński M, Bzowska M,
Kowalczyk AK, Czaplicki D, Koliński A and Rokita H: Analysis and
optimization of interactions between peptides mimicking the GD2
ganglioside and the monoclonal antibody 14G2a. Int J Mol Med.
28:47–57. 2011.PubMed/NCBI
|
|
29
|
Horwacik I, Golik P, Grudnik P, Kolinski
M, Zdzalik M, Rokita H and Dubin G: Structural basis of GD2
ganglioside and mimetic peptide recognition by 14G2a antibody. Mol
Cell Proteomics. 14:2577–2590. 2015. View Article : Google Scholar : PubMed/NCBI
|
|
30
|
Lew M: Good statistical practice in
pharmacology. Problem 2. Br J Pharmacol. 152:299–303. 2007.
View Article : Google Scholar : PubMed/NCBI
|
|
31
|
Seguin L, Desgrosellier JS, Weis SM and
Cheresh DA: Integrins and cancer: Regulators of cancer stemness,
metastasis, and drug resistance. Trends Cell Biol. 25:234–240.
2015. View Article : Google Scholar : PubMed/NCBI
|
|
32
|
Young SA, Graf R and Stupack DG:
Neuroblastoma integrins. Neuroblastoma. Hiroyuki S: InTech Press;
Rijeka, Croatia: pp. 189–216. 2013
|
|
33
|
Wu L, Bernard-Trifilo JA, Lim Y, Lim ST,
Mitra SK, Uryu S, Chen M, Pallen CJ, Cheung NK, Mikolon D, et al:
Distinct FAK-Src activation events promote alpha5beta1 and
alpha4beta1 integrin-stimulated neuroblastoma cell motility.
Oncogene. 27:1439–1448. 2008. View Article : Google Scholar
|
|
34
|
Hsu WM, Che MI, Liao YF, Chang HH, Chen
CH, Huang YM, Jeng YM, Huang J, Quon MJ, Lee H, et al: B4GALNT3
expression predicts a favorable prognosis and suppresses cell
migration and invasion via β1 integrin signaling in
neuroblastoma. Am J Pathol. 179:1394–1404. 2011. View Article : Google Scholar : PubMed/NCBI
|
|
35
|
Leblond P, Dewitte A, Le Tinier F,
Bal-Mahieu C, Baroncini M, Sarrazin T, Lartigau E, Lansiaux A and
Meignan S: Cilengitide targets pediatric glioma and neuroblastoma
cells through cell detachment and anoikis induction. Anticancer
Drugs. 24:818–825. 2013. View Article : Google Scholar : PubMed/NCBI
|
|
36
|
Stupack DG, Puente XS, Boutsaboualoy S,
Storgard CM and Cheresh DA: Apoptosis of adherent cells by
recruitment of caspase-8 to unligated integrins. J Cell Biol.
155:459–470. 2001. View Article : Google Scholar : PubMed/NCBI
|
|
37
|
Rozzo C, Chiesa V, Caridi G, Pagnan G and
Ponzoni M: Induction of apoptosis in human neuroblastoma cells by
abrogation of integrin-mediated cell adhesion. Int J Cancer.
70:688–698. 1997. View Article : Google Scholar : PubMed/NCBI
|
|
38
|
Momic T, Katzehendler J, Benny O, Lahiani
A, Cohen G, Noy E, Senderowitz H, Eble JA, Marcinkiewicz C and
Lazarovici P: Vimocin and vidapin, cyclic KTS peptides, are dual
antagonists of α1β1/α2β1 integrins with antiangiogenic activity. J
Pharmacol Exp Ther. 350:506–519. 2014. View Article : Google Scholar : PubMed/NCBI
|
|
39
|
Cagnoni AJ, Pérez Sáez JM, Rabinovich GA
and Mariño KV: Turning-off signaling by siglecs, selectins, and
galectins: Chemical inhibition of glycan-dependent interactions in
cancer. Front Oncol. 6:1092016. View Article : Google Scholar : PubMed/NCBI
|
|
40
|
Yoo BH, Masson O, Li Y, Khan IA, Gowda PS
and Rosen KV: Anoikis of colon carcinoma cells triggered by
β-catenin loss can be enhanced by tumor necrosis factor receptor 1
antagonists. Oncogene. 34:4939–4951. 2015. View Article : Google Scholar
|
|
41
|
Beierle EA, Ma X, Stewart J, Nyberg C,
Trujillo A, Cance WG and Golubovskaya VM: Inhibition of focal
adhesion kinase decreases tumor growth in human neuroblastoma. Cell
Cycle. 9:1005–1015. 2010. View Article : Google Scholar : PubMed/NCBI
|
|
42
|
Berwanger B, Hartmann O, Bergmann E,
Bernard S, Nielsen D, Krause M, Kartal A, Flynn D, Wiedemeyer R,
Schwab M, et al: Loss of a FYN-regulated differentiation and growth
arrest pathway in advanced stage neuroblastoma. Cancer Cell.
2:377–386. 2002. View Article : Google Scholar : PubMed/NCBI
|
|
43
|
Beierle EA, Trujillo A, Nagaram A,
Kurenova EV, Finch R, Ma X, Vella J, Cance WG and Golubovskaya VM:
N-MYC regulates focal adhesion kinase expression in human
neuroblastoma. J Biol Chem. 282:12503–12516. 2007. View Article : Google Scholar : PubMed/NCBI
|
|
44
|
Cagnet S, Faraldo MM, Kreft M, Sonnenberg
A, Raymond K and Glukhova MA: Signaling events mediated by α3β1
integrin are essential for mammary tumorigenesis. Oncogene.
33:4286–4295. 2014. View Article : Google Scholar
|
|
45
|
Su X, Esser AK, Amend SR, Xiang J, Xu Y,
Ross MH, Fox GC, Kobayashi T, Steri V, Roomp K, et al: Antagonizing
integrin β3 increases immunosuppression in cancer. Cancer Res.
76:3484–3495. 2016. View Article : Google Scholar : PubMed/NCBI
|