Introduction
Lung cancer is the leading cause of cancer-related
mortality worldwide (1). According
to the results from the National Lung Screening Trial, an increase
in the detection and treatment of early stage lung cancer is
expected (2). However, despite
curative-intent surgical resection, tumor recurrence and metastasis
remain the primary causes of cancer-related death even among
patients with early stage lung cancer (3). Furthermore, lung cancer is still
usually not detected until it is at an advanced stage, which makes
it more challenging to treat due to high frequency of metastasis.
The 5-year survival for patients with regional lymph node (LN)
metastasis shows poor prognosis (1,4).
Inadequacy of major improvements in the survival rate for lung
cancer in spite of advances in surgery, chemotherapy, and
radiotherapy has driven a search for new strategies aimed at
improving lung cancer management and treatment, which requires a
better understanding of lung cancer biology. In an effort to
identify relevant molecular targets for diagnosis and/or treatment
of lung cancer (5,6). We analyzed expression profiles of our
previously performed microarray using endobronchial
ultrasound-guided transbronchial needle aspiration (EBUS-TBNA)
samples (7) and various types of
database (8). Confirmatory
quantitative reverse transcription-polymerase chain reaction
(qRT-PCR) analysis was performed against 122 possible candidate
genes using tumor samples achieved by EBUS-TBNA (8). These genes are i) overexpressed in
the majority of EBUS-TBNA samples taken from advanced lung cancer
cases, ii) overexpressed in at least one lung cancer cell line for
RNAi screening, and iii) expressed most in the testis and less
expressed in other human vital organs, which provides further
evidence supporting these genes as promising molecular targets.
Throughout these screenings, we selected
melanoma-associated antigens (MAGE) family member A2 (MAGEA2) as a
possible candidate therapeutic gene of lung cancer. MAGE genes were
initially discovered as cancer-associated antigens in melanoma
patients (9) and are now known to
comprise of a super-family of more than 60 genes in humans
(10,11). This family of genes has been shown
to be overexpressed in a variety of cancers including non-small
cell lung cancer (NSCLC) and rarely expressed in normal human
organs, therefore, they are potential biomarkers for early
diagnosis and screening of lung cancer (12–16).
MAGE family member A (MAGEA) has also been used as immunogenic
target gene, and for adjuvant immunotherapy using vaccination with
MAGEA3 fusion protein in resected MAGEA3 positive lung cancer,
which is currently ongoing Phase III clinical trials (17,18).
Compelling evidence has been reported that MAGEA2
blocks the association between the potent tumor suppressor p53 and
its cognate sites on chromatin, silencing the downstream
p53-dependent transactivation during tumor development (19). MAGEA2 also binds histone
deacetylase 3, suppresses p53-dependent apoptosis in response to
chemotherapeutic drugs, decreases cellular senescence and increases
cell proliferation (20,21). However, genetic p53 mutations are
found in approximately 50% of NSCLC and 70% of small cell carcinoma
(SCC) (22). Although it is
recognized that the functional loss of p53 has an established role
in the lung carcinogenesis, other multiple mechanisms of activation
and inactivation are thought to also contribute to the progression
of lung cancer (23–25). Currently, little is known about the
relationship between MAGEA genes and p53 aberrant expression in
lung cancer.
In the present study, we examined the expression of
MAGEA2 in human lung cancer, and the role of MAGEA2 in cancer cell
growth and/or survival using lung cancer cell lines with p53
mutation. We then examined its clinicopathologic significance and
evaluated MAGEA2 expression as a prognostic biomarker according to
histology and p53 expression. Our results demonstrate the
functional role of MAGEA2 in p53 aberrant lung tumors and the
therapeutic and prognostic potential of targeting MAGEA2 for lung
cancer.
Materials and methods
Lung cancer clinical EBUS samples and
tissue samples
Thirty-one samples obtained via EBUS-TBNA from
metastatic LNs in patients with advanced lung cancers, including 13
lung adenocarcinomas (ADCs), eight lung squamous cell carcinomas
(SqCCs), five lung large cell carcinomas (LCCs), and five small
cell lung cancers (SCCs) were used (Toronto General Hospital,
Toronto, ON, Canada, study number: 11-0109-CE). Thirty-six of the
primary lung cancer samples, including 23 lung ADCs and 13 lung
SqCCs, paired with normal lung tissue were also used in this study,
and a total RNA of 21 normal human tissues (Human Total RNA Master
Panel II) were purchased from Clontech Laboratories, Inc. (Mountain
View, CA, USA) to detect MAGEA2 expression in normal tissue
distribution. A total of 353 lung cancer and adjacent normal lung
tissue samples to be used for immunohistochemical (IHC) staining on
tissue microarrays (TMA) and additional statistical analysis were
obtained from patients who underwent surgery at Hokkaido University
and its affiliated hospitals with informed consent (26–28).
These were consecutive patients with lung cancer who underwent
surgical lobectomy or pneumonectomy. Detailed clinical and
pathological information was collected retrospectively for all
patients.
Histopathological examination of resected tumors
revealed that ADC was the dominant histological group (241 cases),
followed by 89 cases of SqCC, 19 cases of LCC, and 4 cases of SCC.
Postoperative staging evaluation identified stage IA disease in 120
cases, stage IB disease in 108 cases, stage IIA disease in 38
cases, stage IIB disease in 27 cases, stage IIIA disease in 57
cases, and stage IIIB disease in 3 cases. Follow-up lasted through
October 30, 2009, with a median follow-up period of 60.5 months for
living patients (range, 48.1–165.8 months). The primary end point
was overall survival as measured from the date of surgery to the
time of death of the patients. All specimens were fixed in formalin
and embedded in paraffin wax. Representative blocks were selected
(based primarily on greatest dimensions of each tumor), and serial
4-μm-thick sections were examined by immunohistochem-istry.
Histological diagnoses of tumors were based on the 2015 World
Health Organization Classification (29). All tumors were staged according to
the pathological tumor/node/metastasis (pTNM) classification (7th
edition) of the American Joint Committee on Cancer (30). All available hematoxylin and eosin
(H&E) stained tumor slides were histologically reviewed by a
pathologist.
Lung cancer cell lines
The human lung cancer cell lines used in this study
were as follows: lung ADC NCI-H1437; lung LCC H661; and lung SCC
SBC-5. All cancer cells were grown in monolayers in appropriate
medium supplemented with 10% FCS and were maintained at 37°C in
atmospheres of humidified air with 5% CO2.
Specimen handling and EBUS-TBNA sample
preparation
EBUS-TBNA was performed as previously described
(31). Briefly, a dedicated
22-gauge needle equipped with an internal stylet was used
(NA-201SX-4022; Olympus, Japan). Multiple passes were performed
from the target LNs. After confirmation of adequate sampling for
cytological evaluation, an additional pass was performed for the
preservation of RNA. The aspirate was mixed with Allprotect Tissue
Reagent® (Qiagen, Valencia, CA) following the
manufacturer's instructions and stored at -80°C. The samples were
equilibrated to room temperature, and the stabilizing solution was
completely removed. QIAzol Lysis Reagent (Qiagen) and one 5-mm
stainless steel bead (Qiagen) were added before homogenizing with a
TissueLyser Adapter Set (Qiagen) for 2 min at 20 Hz. Total RNA was
then purified using a miRNeasy mini kit (Qiagen). The amount and
purity were measured using a spectrophotometer (NanoDrop; Thermo
Scientific, Wilmington, DE, USA).
Quantitative RT-PCR analysis
The cDNA was synthesized from 2 μg total RNA
using QuantiTect® Reverse Transcription kit (Qiagen).
The primers were designed as follows: for MAGEA2, A2B, forward
primer, 5′-gggacaggctgacaagtagg-3′, and reverse primer
5′-ttgcagtgctgactcctctg-3′; for p21, forward primer,
5′-gcagaccagcatgacagattt-3′ and reverse primer 5′-ggatt
agggcttcctcttgga-3′; for MDM2, forward primer, 5′-ggatttcgg
acggctctcgc-3′ and reverse primer 5′-cgcgcagcgttcacactactg-3′; for
actin, β (ACTB), forward primer, 5′-gaaatcgtgcgtgacattaa-3′, and
reverse primer, 5′-aaggaaggctggaagagtg-3′. qRT-PCR analysis was
performed using LightCycler 480® SYBR Green I Master
Ready-to-use hot start reaction mix and LightCycler 480 system
(Roche, South San Francisco, CA, USA). The thermal cycler
conditions were as follows: 5 min at 95°C for denaturation, 45
cycles at 95°C for 10 sec, 56°C for 10 sec, and 72°C for 10 sec for
PCR amplification, and 1 min at 65°C for melting. The threshold
cycle value was defined as the value obtained in the PCR cycle when
the fluorescence signal increased above the background threshold.
PCR reactions were carried out in duplicates.
RNA interference and cell viability
assay
All siRNA oligo-nucleotide sequences for this study
were purchased from Qiagen. Negative Control siRNA and
AllStar® Negative Control siRNA (Qiagen) were used as
the negative control (NC-siRNAs-#1, -#2). siRNAs with a final
concentration of 5–10 nM were incubated with HiPerFect®
Transfection Reagent (Qiagen) according to the manufacturer's
instructions. The CellTiter 96® AQueous One Solution
Cell Proliferation Assay (Promega, Madison, WI, USA) was used for
the evaluation of the number of viable cells according to the
manufacturer's instructions, and measured using a microplate
spectrophotometer (μQuant; Bio-Tek Inc., Winooski, VT, USA).
Each experiment was performed in triplicates.
Tissue microarray construction and
immunohistochemistry
Tissue areas for sampling were selected based on
visual alignment with the corresponding H&E stained sections on
slides. A core (diameter, 2 mm; height, 3–5 mm) taken from each
donor-tumor block was placed into a recipient block using a tissue
microprocessor (Azumaya Medical Instruments, Tokyo, Japan). MAGEA2
[anti-MAGEA2 antibody (ab64894), Abcam Japan, Tokyo, Japan] and p53
immunostaining [DO-7 anti-human p53 mouse monoclonal antibody (Dako
Japan, Tokyo, Japan)] were performed using an automated IHC
platform (Autostainer Plus, Dako, Carpinteria, CA, USA). Antigen
retrieval was performed in pH 9.0 for 20 min. EnVision™+Dual Link
(K4063, Dako) was used for detection, with post-primary incubation
for 60 min at room temperature. A polymer-based detection system
(EnVision™+Dual Link #K4063, Dako) was used with 3′,
3-diaminobenzidine (DAB) as the chromogen. The positive control
included a sample of testis, and normal lung samples were used as
negative controls. Slides were dehydrated and placed on
coverslips.
Evaluation of immunohistochemical
staining
Digital images of IHC-stained TMA slides were
obtained at ×20 magnification using a whole slide scanner
(ScanScope CS, Aperio ePathology; Leica Microsystems Inc., ON,
Canada). Images were saved in SVS format (Aperio) and annotation of
tumor regions on whole slides was performed blinded to clinical
follow-up data using Aperio annotation software (ImageScope Viewing
Software, Positive Pixel Count version 9.1, Aperio) (32). MAGEA2 was quantified by IHC
scoring, which summated the percentage of area stained at each
intensity level multiplied by the weighted intensity (0, 1, 2, or
3) reported in other studies (33–36).
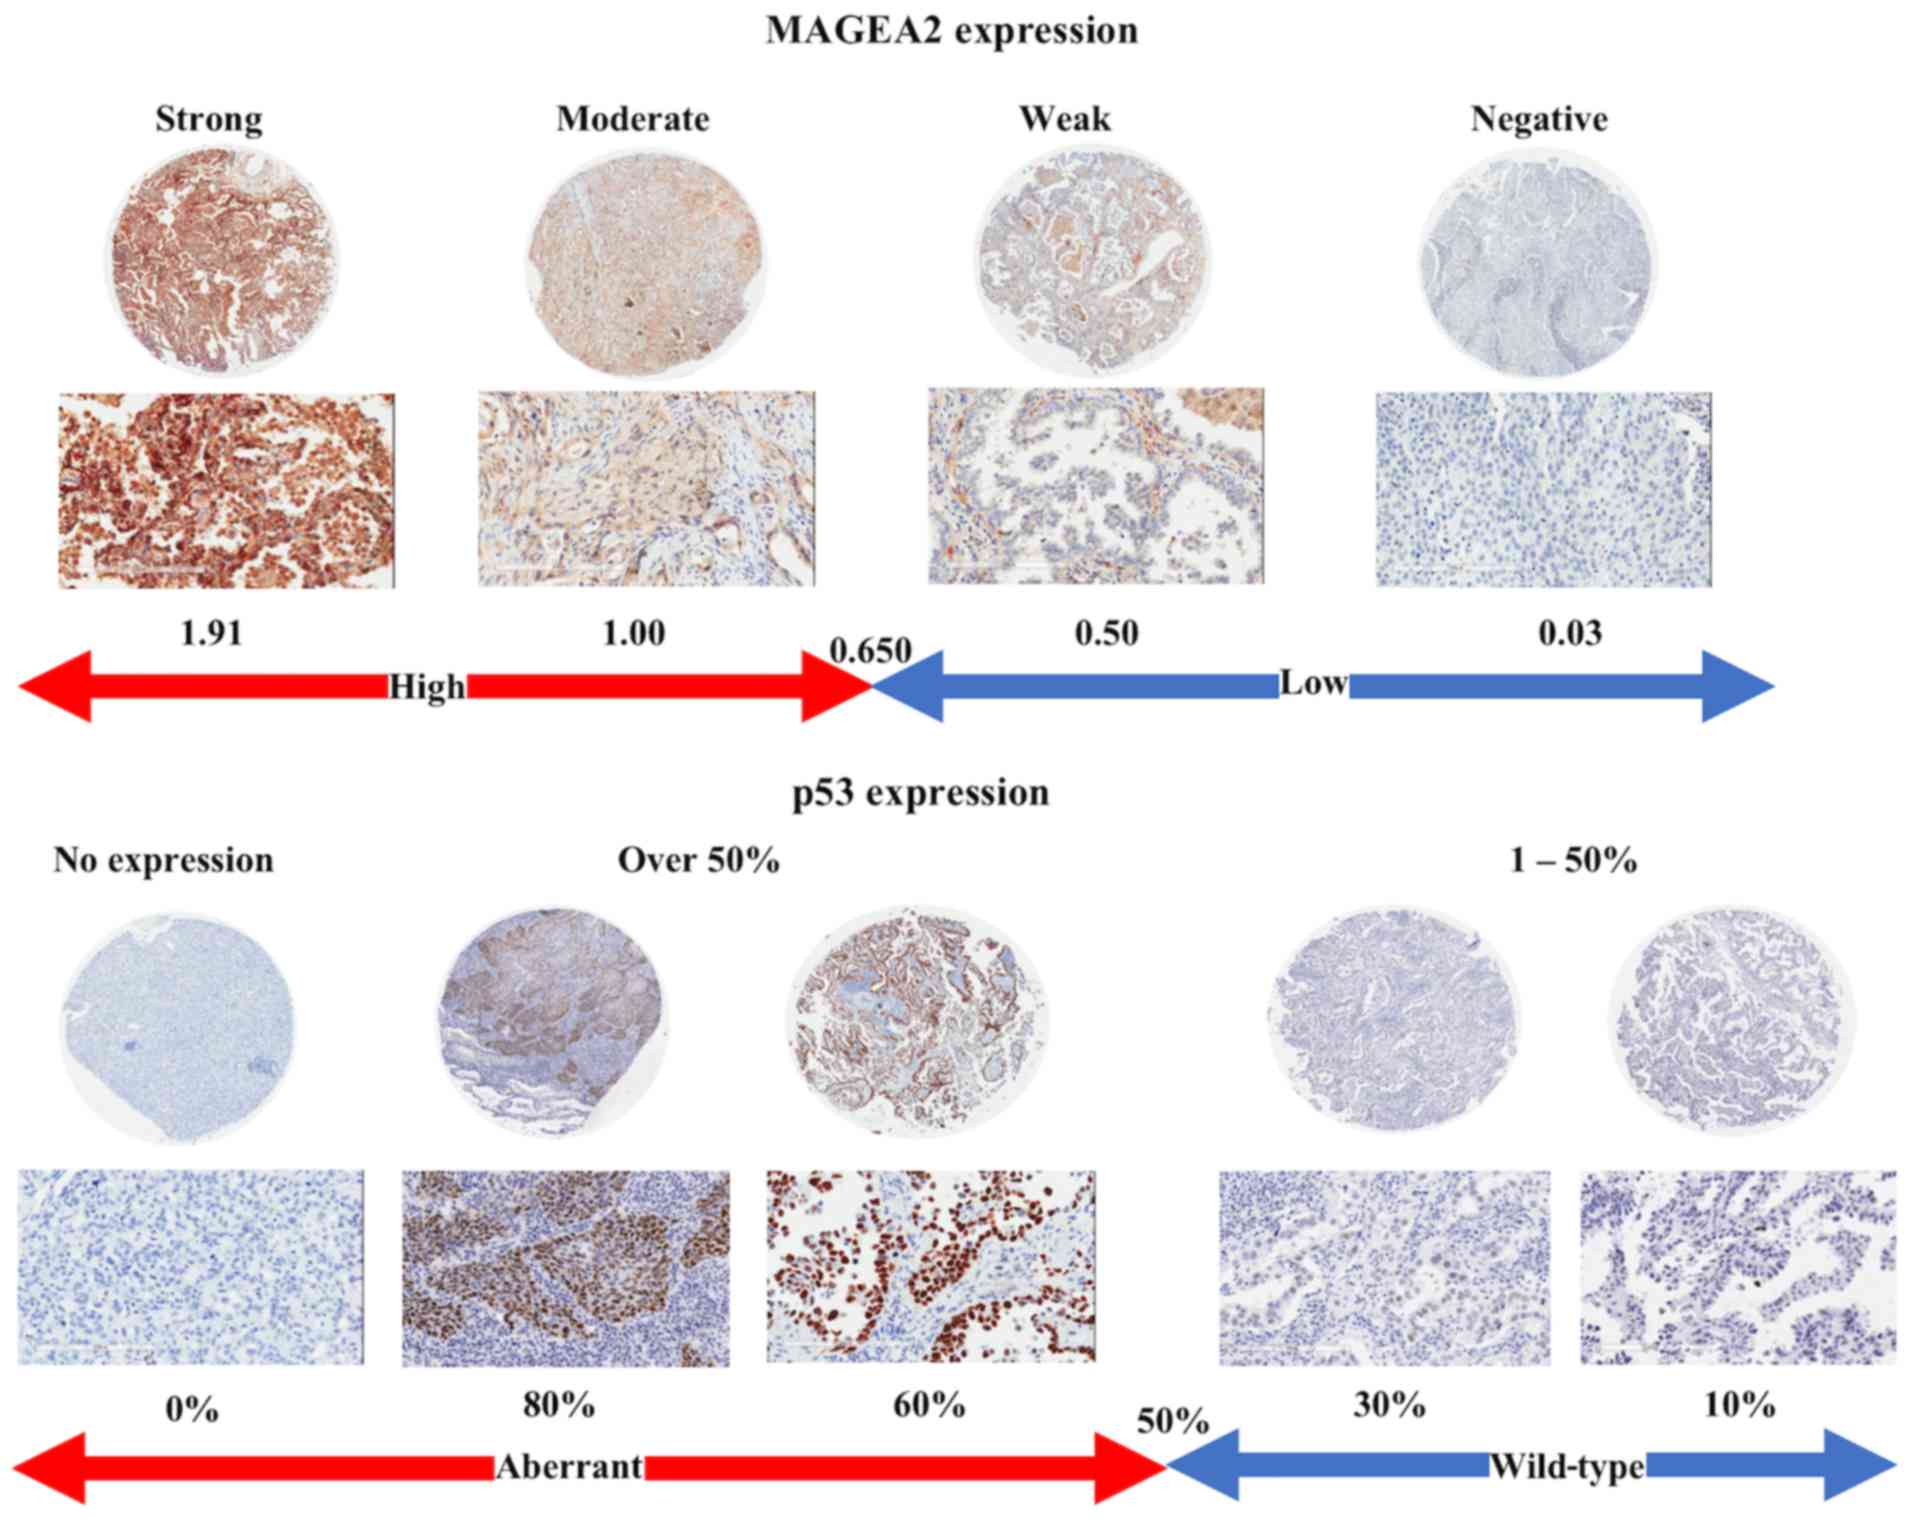
Initially, the weighted intensity of staining was graded as
follows; grade 0 (negative), 1+ [weak positive: intensity Threshold
Weak (upper limit)=240, (lower limit)=220], 2+ [moderate positive:
Medium (upper)=220, (lower)=180)], and 3+ (strong positive: Strong
(upper)=180, (lower)=0) according to Aperio annotation software).
According to the total amount of IHC scores, MAGEA2 was
dichotomized into high versus low using optimal cut-points, which
were found using a maximally selected log-rank statistics:
low-level MAGEA2 expression (Low-MAGEA2, with an IHC score
<0.65) and high-level MAGEA2 expression (High-MAGEA2, with an
IHC score ≥0.65). For p53 evaluation, each core was scored
semi-quantitatively for the degree of positive nuclear expression
in tumor cell under a high-power field (magnification, ×200).
Percentage of positive nuclear expression was calculated. p53 IHC
was defined as 'aberrant expression' if tumor cells showed either
nuclear expression in >50% or complete absence of staining and
as 'wild-type expression' if tumor cells showed no aberrant
expression (1–50% staining) (36–39).
Statistical analysis
We attempted to correlate clinicopathological
variables such as age, gender, pathological TNM stage, pleural
invasion, histological classification, and smoking history with
expression levels of MAGEA2 protein and aberrant p53 as determined
by TMA analysis. MAGEA2 and aberrant p53 immunoreactivities were
assessed for association with clinicopathologic variables using the
χ2 test for variables. Overall survival (OS) was
estimated using the Kaplan-Meier method starting at the time of
surgery. Patients who survived during study follow-up were censored
at the last time they were known to be alive. Differences in OS
between patient subgroups were compared using the log-rank test.
Multivariate analysis was performed using the Cox proportional
hazards regression model to estimate the effect of markers of
interest on OS, with adjustments for the clinicopathologic factors
that were found to be significantly associated with OS in
univariate analyses. All significance tests were two-sided and used
a 5% level of significance. In vitro experiments, tumor
treated with MAGEA2 vs. no transfection were analyzed by paired
Student's t-test. Statistical analyses were conducted using the
'survival' and 'maxstat' packages in R (version 3.0.1; R
Development Core Team).
Results
Transcriptional expression of MAGEA2 in
lung tumors and normal tissues
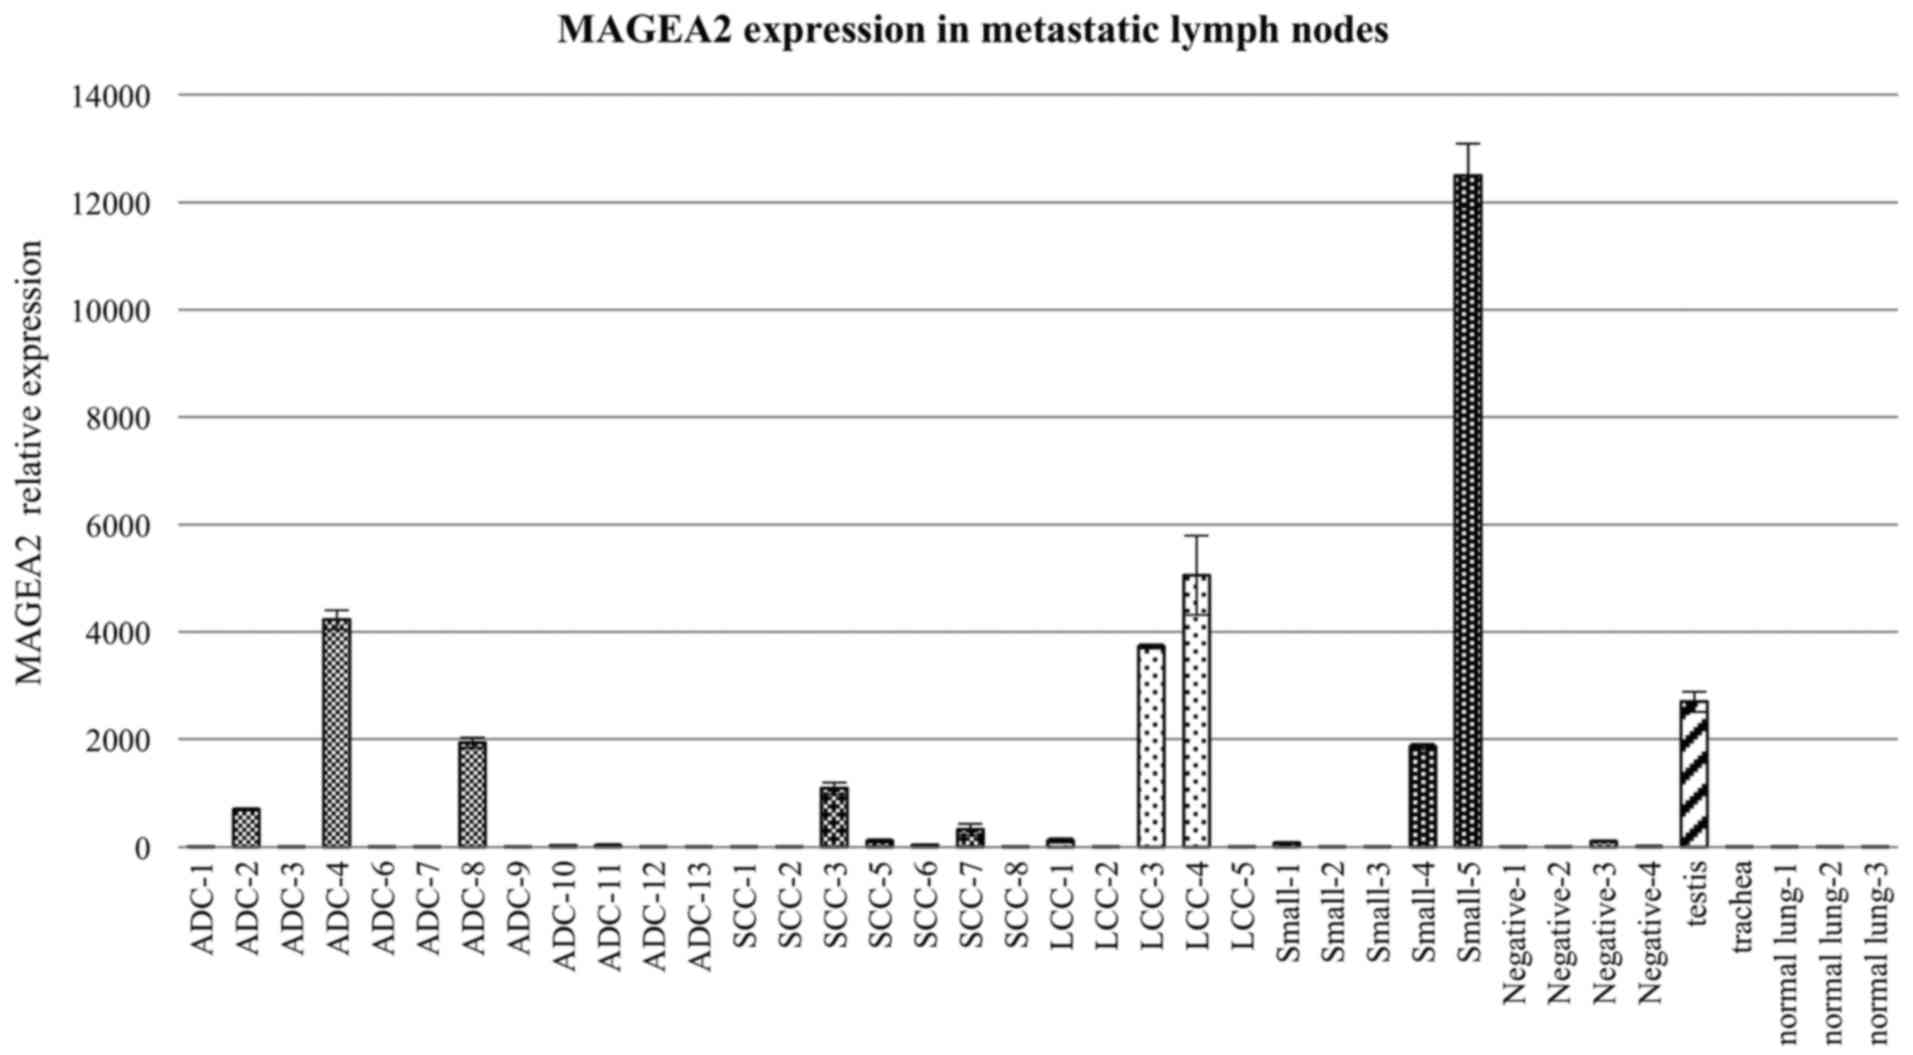
Expression of MAGEA2 was significantly higher in
metastatic lymph node samples obtained from patients with advanced
lung cancer with EBUS-TBNA compared to those taken from healthy
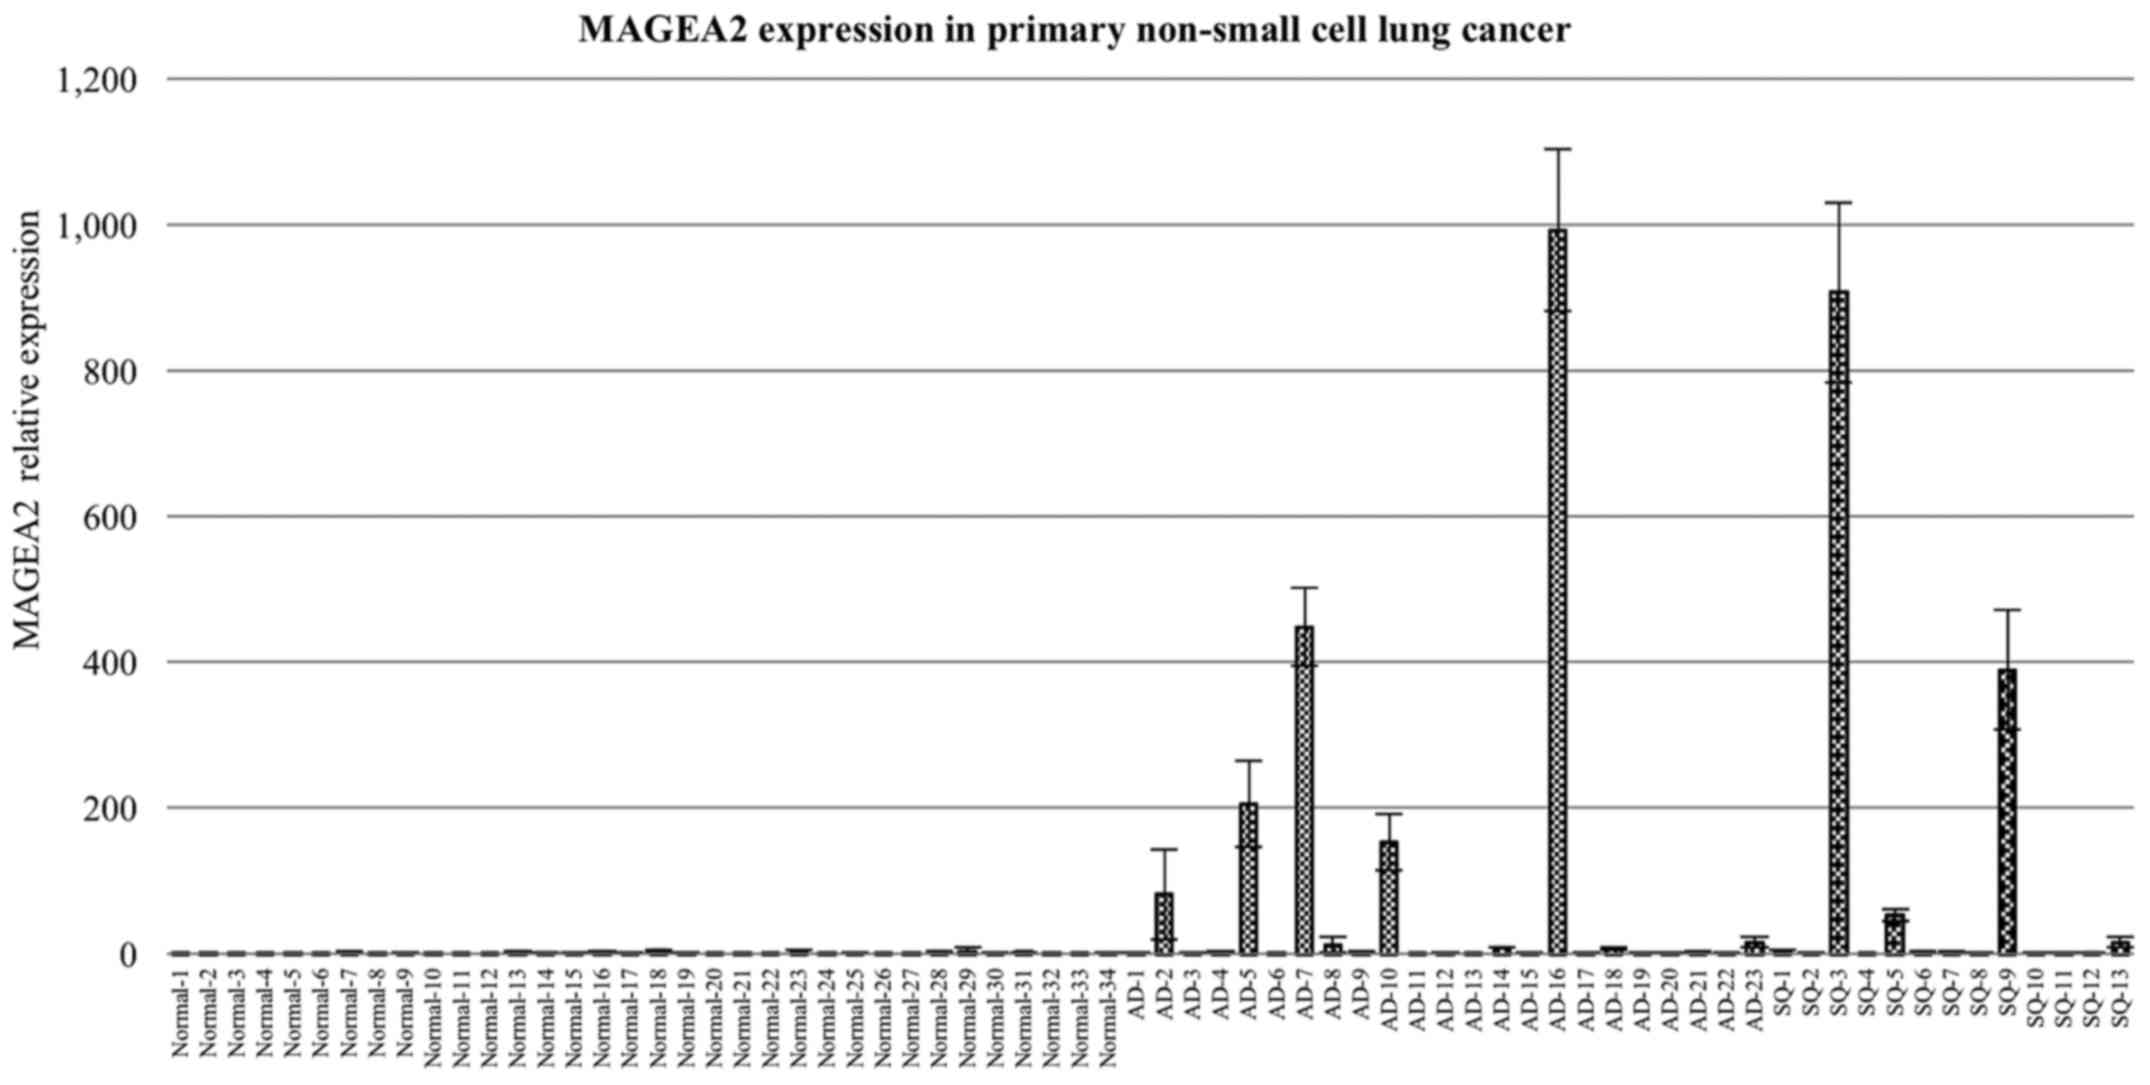
individuals and non-malignant (negative) LN tissues (Fig. 1). MAGEA2 expression was also higher
in primary tissue from 34 lung cancer samples taken, from patients
who underwent surgery, of which 23 had lung ADCs and 13 had lung
SqCCs, compared to paired normal lung tissue (Fig. 2). qRT-PCR analysis using cDNA panel
containing normal human tissues also identified MAGEA2 as being
expressed only in the testis with almost no expression in the other
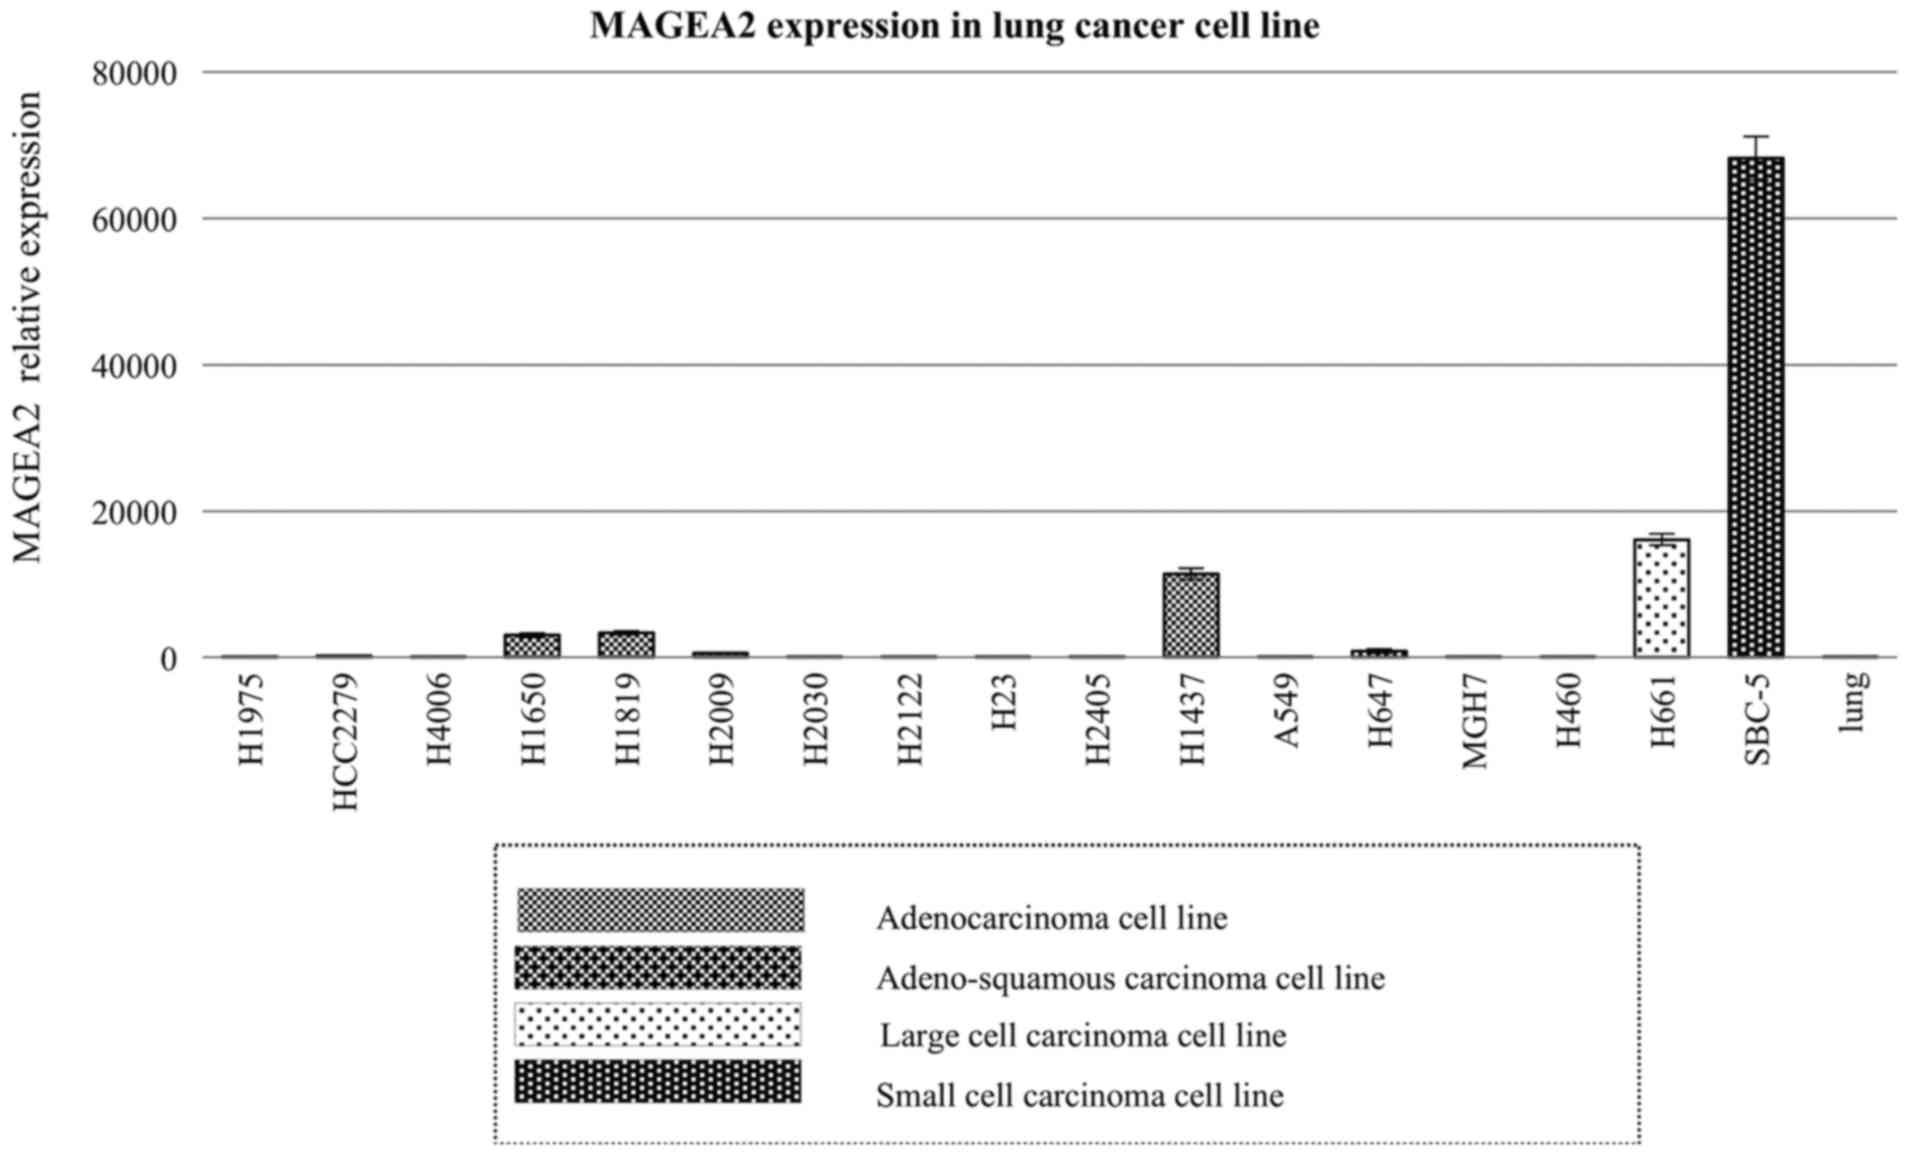
vital organs (data not shown). We also confirmed high expression
levels of MAGEA2 using 17 lung cancer cell lines (Fig. 3). This step also allowed
identification of relevant cell lines for RNAi experiments.
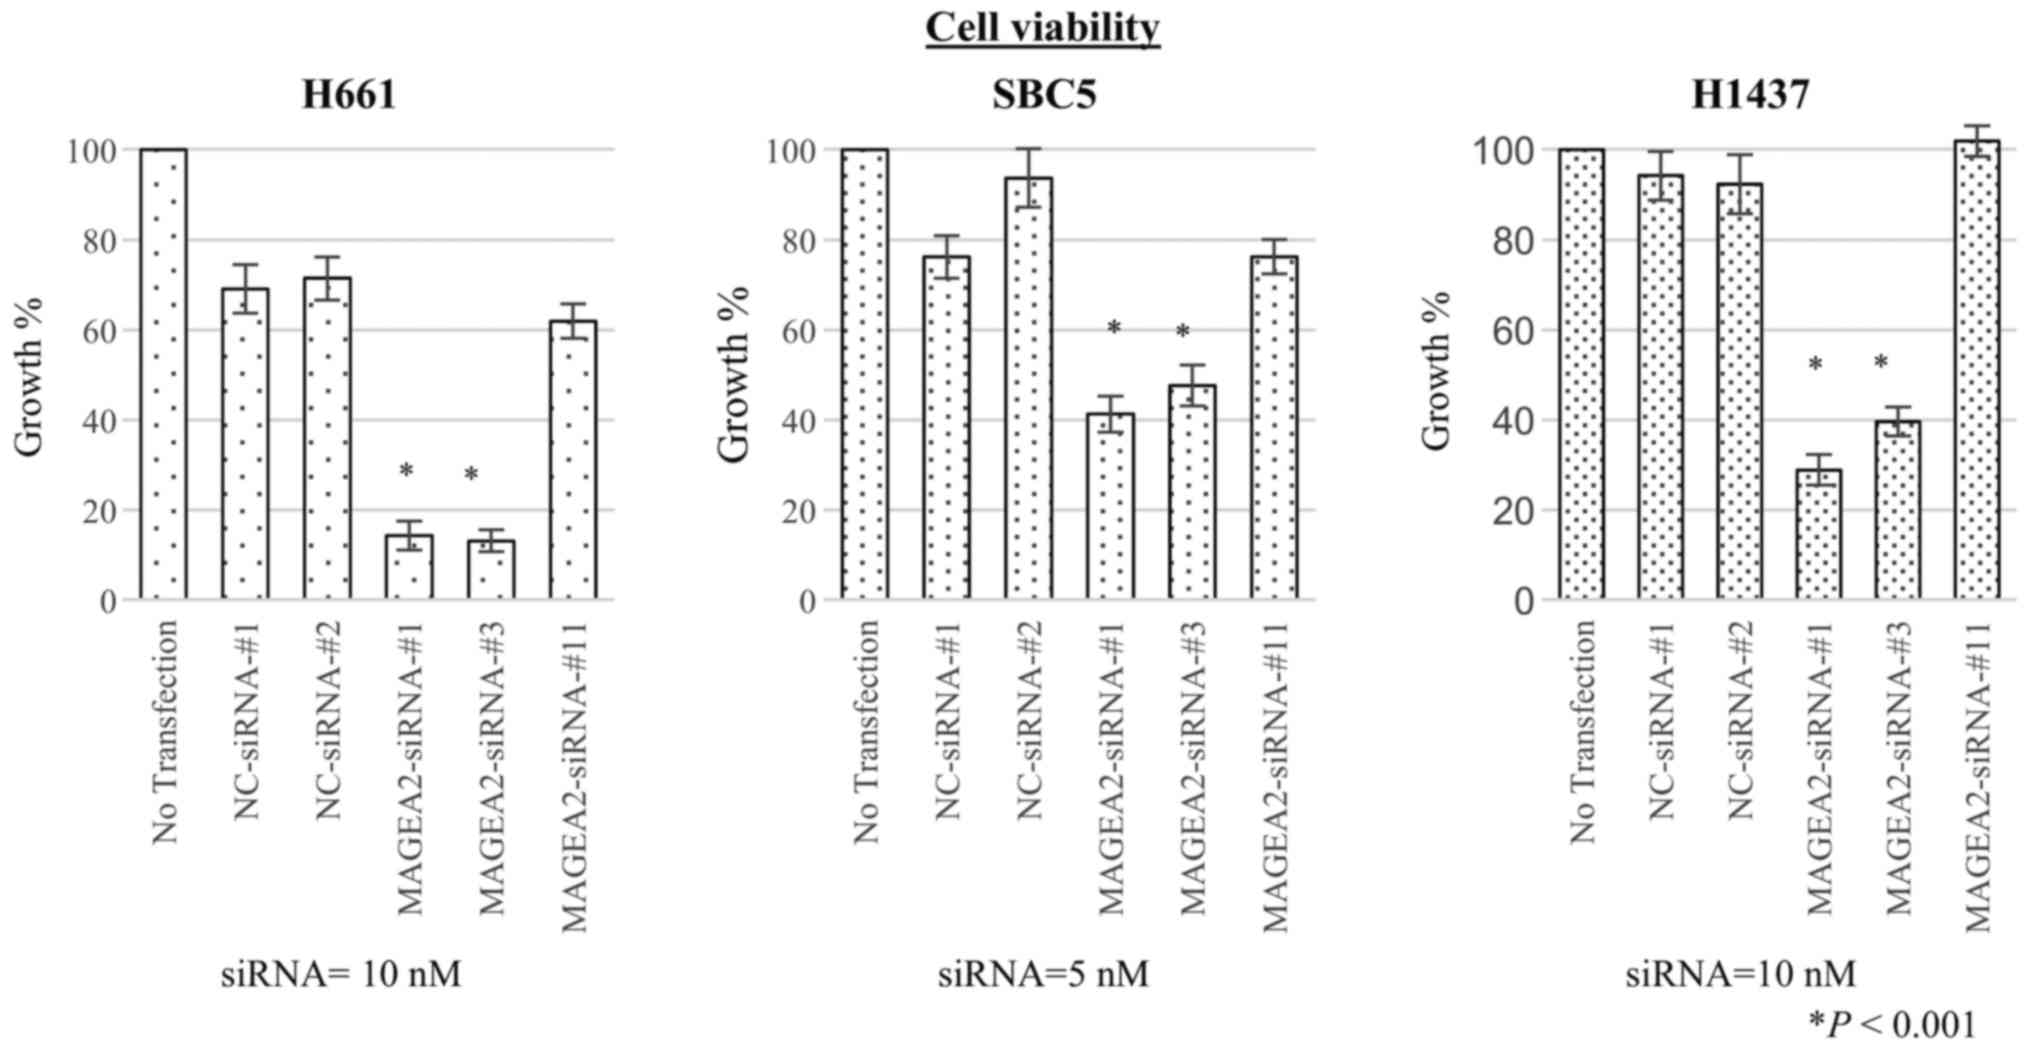
Growth inhibition of lung cancer cells by
specific siRNA against candidate genes
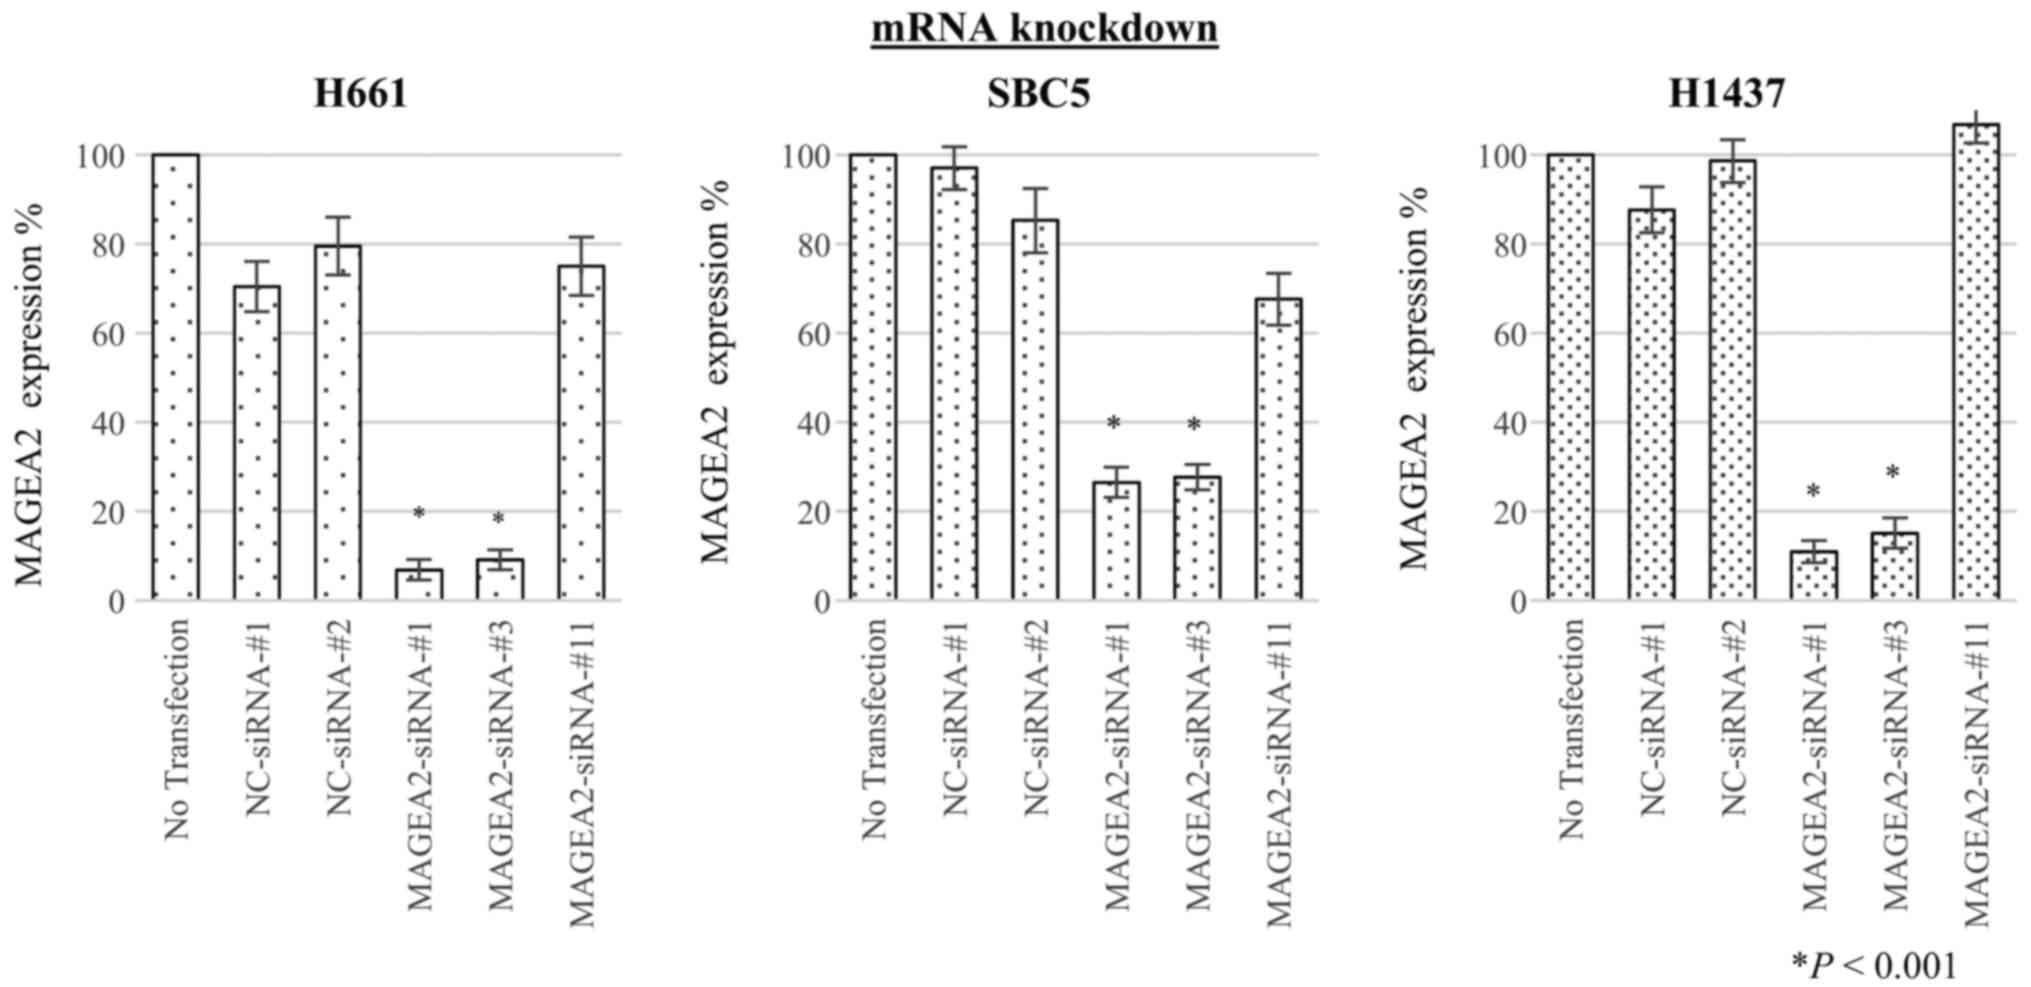
To assess whether MAGEA2 is essential for growth of
lung-cancer cells, we transfected 3 different types of
target-specific siRNAs against MAGEA2 (MAGEA2-siRNAs-#1, #3, #11)
as well as two different negative control siRNAs (NC-siRNAs-#1,
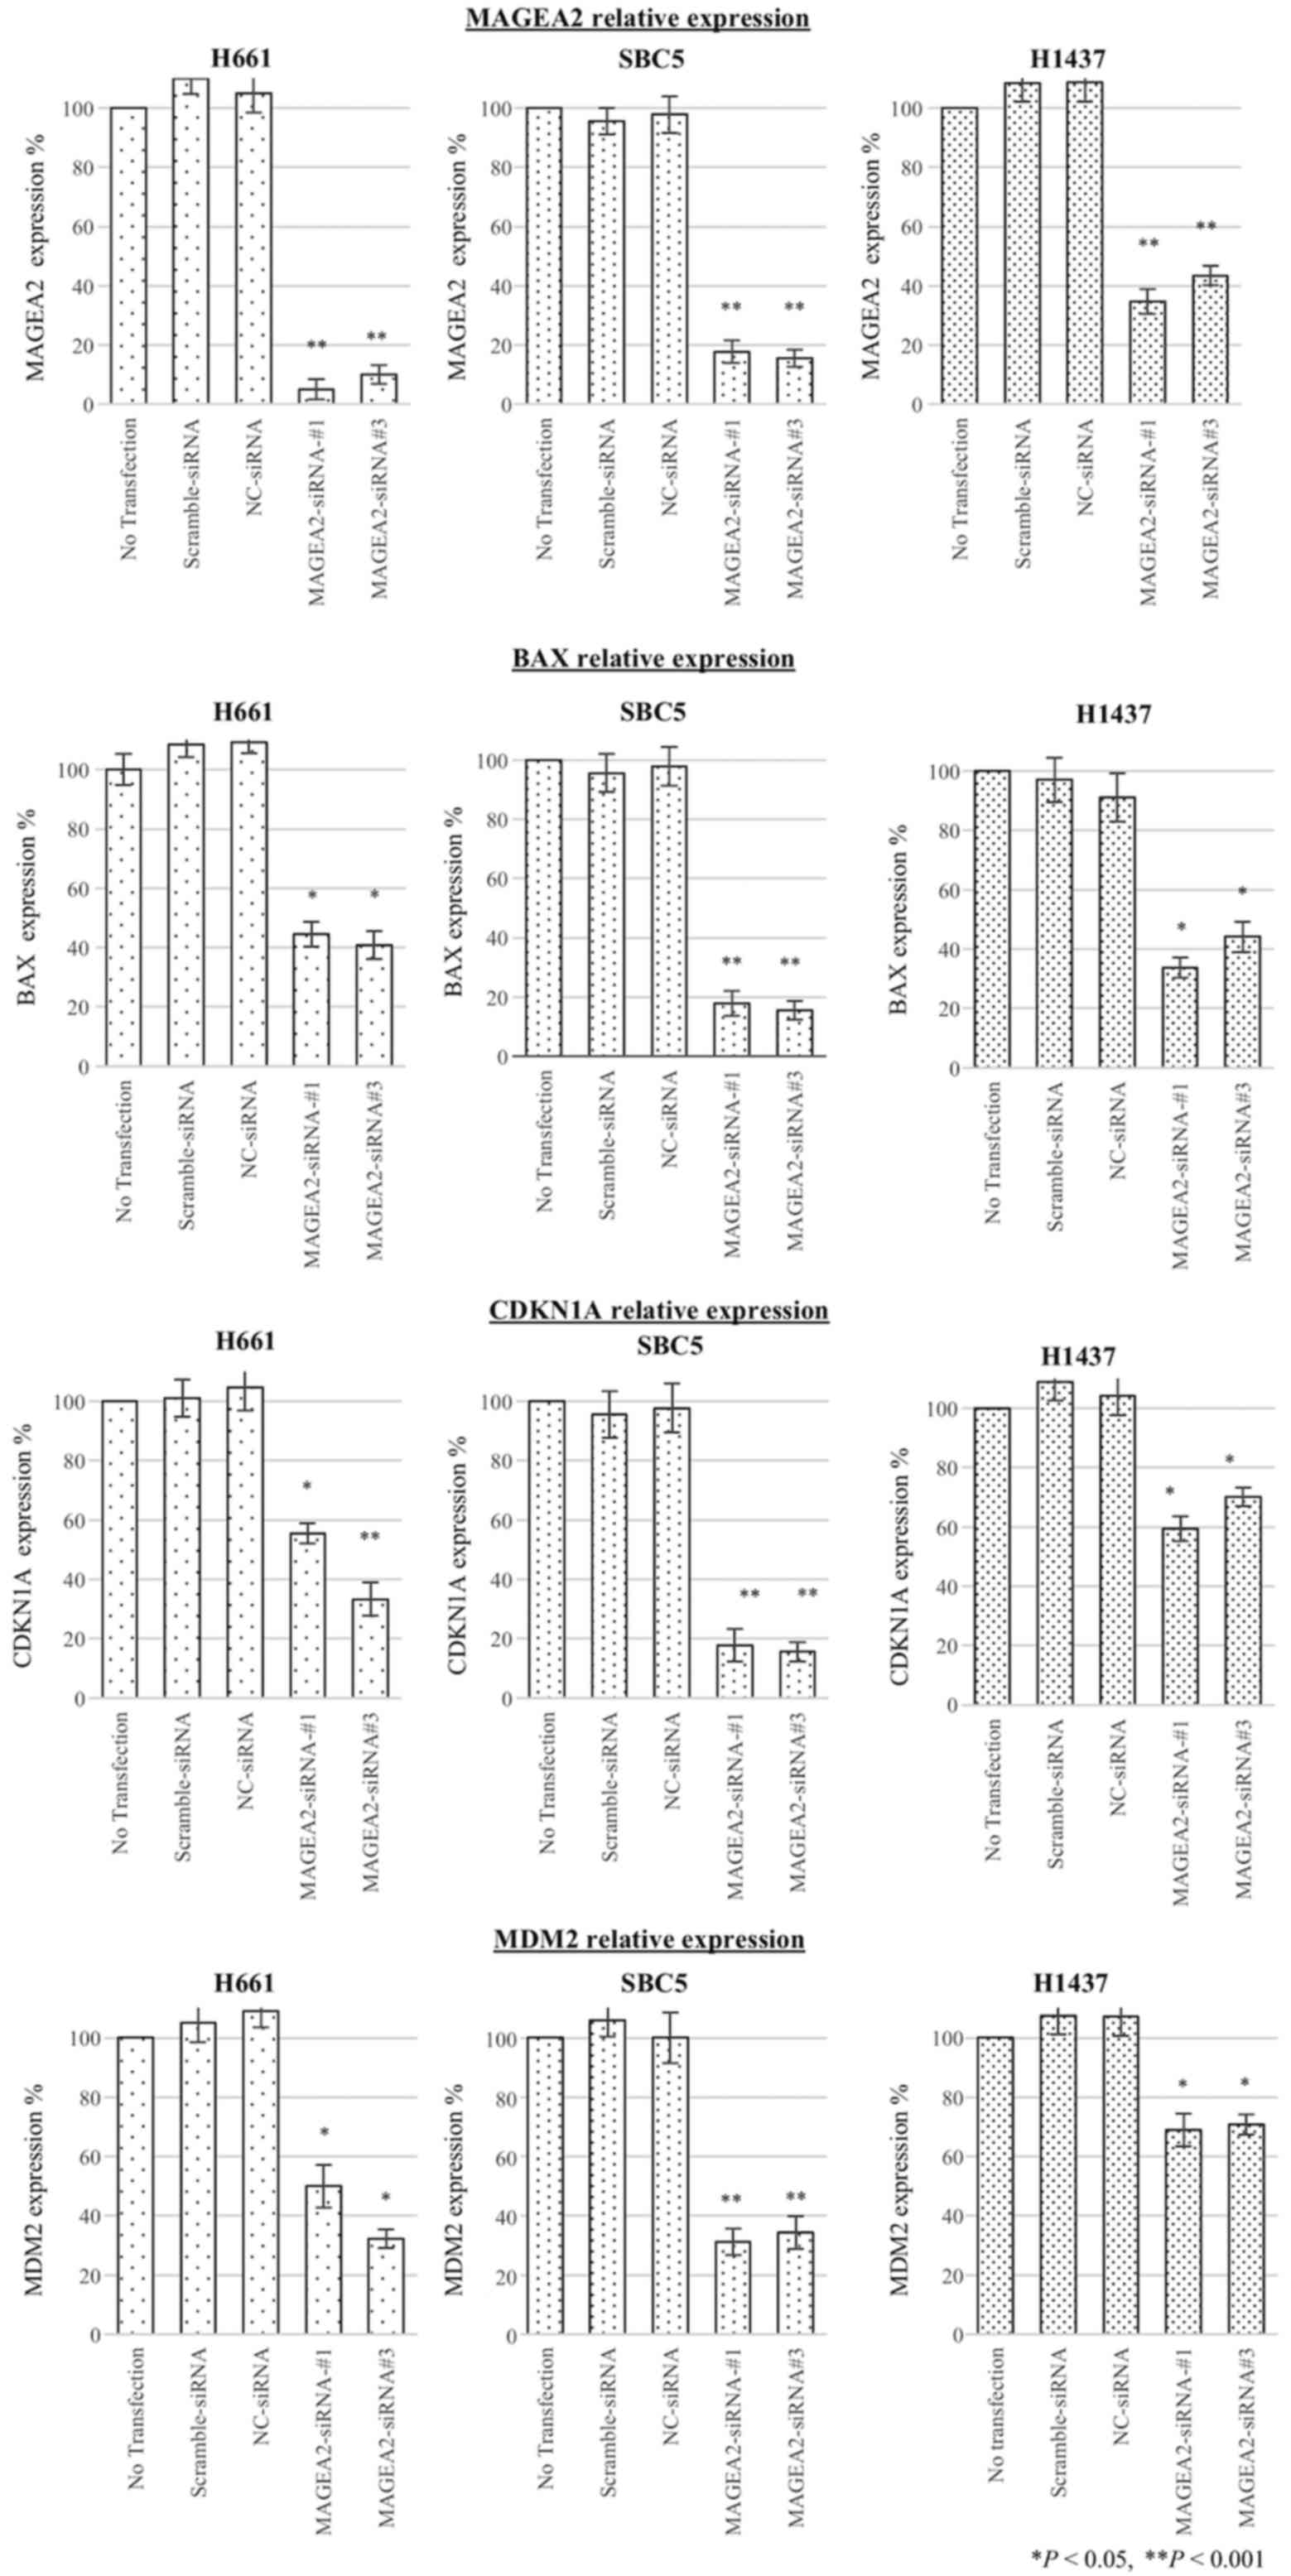
-#2) into H661, SBC5, and H1437 lung cancer cell lines. qRT-PCR
showed that the mRNA levels of each cancer cell transfected with
two of the three siRNAs targeting MAGEA2 gene (MAGEA2-siRNAs-#1 and
-#3) were significantly decreased in comparison with cells
transfected with control siRNAs 48 h after transfection (Fig. 4). Next, to evaluate the effect of
MAGEA2 gene knockdown on cell proliferation, we conducted a cell
viability assay. Proliferation of lung cancer cells transfected
with these two siRNAs was significantly suppressed compared to
control groups at 4 days after transfection, suggesting that
upregulation of MAGEA2 is associated with survival of lung cancer
cells (Fig. 5).
MAGEA2 regulates p53 targets (BAX,
CDKN1A, and MDM2) in lung cancer cell lines
To determine the effects of regulating MAGEA2 on the
expression level of 3 main p53 downstream target genes, BAX,
CDKN1A, and MDM2, we performed qRT-PCR after transient transfection
of siRNA against MAGEA2 in lung cancer cell lines with p53 mutation
(H661, SBC5, H1437). Subsequently, inhibition of MAGEA2 induced a
decrease in messenger RNA expression of these p53 downstream target
genes, suggesting MAGEA2 was able to stimulate p53 transactivation
function (Fig. 6).
Pattern of MAGEA2 and p53 expression and
its clinicopathological correlation
To determine the clinical relevance of the MAGEA2,
we assessed MAGEA2 protein and aberrant p53 expression using TMA
analysis, MAGEA2 and p53 expression were categorized as previously
described (34–36). The representative staining and its
IHC score of lung ADC cases are shown in Fig. 7. Positive staining of MAGEA2 in
tumor cells generally showed a cytoplasmic pattern in cancer
tissue. Of the 353 lung cancer cases examined, High-MAGEA2 was
observed in 221 cases (63%). Of those, 146 ADCs (61%), 59 SqCCs
(66%), 14 LCCs (74%), and 2 SCCs (50%) showed High-MAGEA2. We then
proceeded to correlate MAGEA2 expression and aberrant p53
combinations with various clinicopathological parameters in all
patients (Table I). High-MAGEA2
levels were strongly correlated with aberrant p53 expression
(P=0.001). Aberrant expression of p53 was also correlated with pT
factor (P=0.029) and pathological stage (P=0.041). We then examined
any correlations between MAGEA2 and p53 expression using subset
analyses according to histology. In ADC patients (Table II), High-MAGEA2 was strongly
associated with aberrant p53 expression (P<0.001) and this
change in p53 levels was correlated with pT factor in patients with
ADC (P=0.027). In SqCC patients (Table III), High-MAGEA2 was strongly
associated with pT factor (P=0.046). Association between MAGEA2
expression and p53 expression was not observed in SqCC patients
(P=0.656).
 | Table IPatient characteristics according to
MAGEA2 and p53 expression levels for all patients. |
Table I
Patient characteristics according to
MAGEA2 and p53 expression levels for all patients.
| Patient
characteristics | MAGEA2 expression
| p53 expression
|
|---|
Low
| High
| P-value | Wild-type
| Aberrant
| P-value |
|---|
| N | % | N | % | N | % | N | % |
|---|
| All patients | 132 | 37 | 221 | 63 | | 176 | 50 | 177 | 50 | |
| Age (years) | | | | | 0.908 | | | | | 1.000 |
| <60 | 46 | 38 | 76 | 62 | | 61 | 50 | 61 | 50 | |
| ≥60 | 86 | 37 | 145 | 63 | | 115 | 50 | 116 | 50 | |
| Gender | | | | | 0.818 | | | | | 0.436 |
| Female | 47 | 38 | 76 | 62 | | 65 | 53 | 58 | 47 | |
| Male | 85 | 37 | 145 | 63 | | 111 | 48 | 119 | 52 | |
| Smoking
history | | | | | 0.642 | | | | | 0.056 |
| Never-smoker | 42 | 35 | 77 | 65 | | 68 | 57 | 51 | 43 | |
| Smoker | 90 | 38 | 144 | 62 | | 108 | 46 | 126 | 54 | |
| Histological
classification | | | | | 0.556 | | | | | 0.341 |
| ADC | 95 | 39 | 146 | 61 | | 127 | 53 | 114 | 47 | |
| SqCC | 30 | 34 | 59 | 66 | | 41 | 46 | 48 | 54 | |
| LCC | 5 | 26 | 14 | 74 | | 7 | 37 | 12 | 63 | |
| SCC | 2 | 50 | 2 | 50 | | 1 | 25 | 3 | 75 | |
| pT factor | | | | | 0.309 | | | | | 0.029 |
| pT1 | 46 | 34 | 90 | 66 | | 78 | 57 | 58 | 43 | |
| pT2-4 | 86 | 40 | 131 | 60 | | 98 | 45 | 119 | 55 | |
| pN factor | | | | | 0.374 | | | | | 0.176 |
| pN0 | 103 | 39 | 162 | 61 | | 138 | 52 | 127 | 48 | |
| pN1-2 | 29 | 33 | 59 | 67 | | 38 | 43 | 50 | 57 | |
| Pathologic
stage | | | | | 0.054 | | | | | 0.041 |
| Stage I | 85 | 37 | 143 | 63 | | 120 | 53 | 108 | 47 | |
| Stage II | 31 | 48 | 34 | 52 | | 35 | 54 | 30 | 46 | |
| Stage III | 16 | 27 | 44 | 73 | | 21 | 35 | 39 | 65 | |
| Pleural
invasion | | | | | 0.109 | | | | | 0.100 |
| Absent | 75 | 34 | 144 | 66 | | 117 | 53 | 102 | 47 | |
| Present | 57 | 43 | 77 | 57 | | 59 | 44 | 75 | 56 | |
| p53 expression | | | | | 0.001 | | | | | |
| Wild-type | 96 | 55 | 80 | 45 | | – | | – | | |
| Aberrant | 36 | 20 | 141 | 80 | | – | | – | | |
| Table IIPatient characteristics according to
MAGEA2 and p53 expression levels for adenocarcinoma. |
Table II
Patient characteristics according to
MAGEA2 and p53 expression levels for adenocarcinoma.
| Patient
characteristics | MAGEA2 expression
| p53 expression
|
|---|
Low
| High
| P-value | Wild-type
| Aberrant
| P-value |
|---|
| N | % | N | % | N | % | N | % |
|---|
| All patients | 95 | 39 | 146 | 61 | | 127 | 53 | 114 | 47 | |
| Age (years) | | | | | 0.687 | | | | | 0.513 |
| <60 | 36 | 38 | 60 | 63 | | 48 | 50 | 48 | 50 | |
| ≥60 | 59 | 41 | 86 | 59 | | 79 | 54 | 66 | 46 | |
| Gender | | | | | 1.000 | | | | | 0.158 |
| Female | 44 | 40 | 67 | 60 | | 64 | 58 | 47 | 42 | |
| Male | 51 | 39 | 79 | 61 | | 63 | 49 | 67 | 52 | |
| Smoking
history | | | | | 0.425 | | | | | 0.056 |
| Never-smoker | 38 | 36 | 67 | 64 | | 63 | 60 | 42 | 40 | |
| Smoker | 57 | 42 | 79 | 58 | | 64 | 47 | 72 | 53 | |
| pT factor | | | | | 1.000 | | | | | 0.027 |
| pT1 | 41 | 40 | 62 | 60 | | 63 | 61 | 40 | 39 | |
| pT2-4 | 54 | 39 | 84 | 61 | | 64 | 46 | 74 | 54 | |
| pN factor | | | | | 0.874 | | | | | 0.161 |
| pN0 | 75 | 40 | 113 | 60 | | 104 | 55 | 84 | 45 | |
| pN1-2 | 20 | 38 | 33 | 62 | | 23 | 43 | 30 | 57 | |
| Pathologic
stage | | | | | 0.315 | | | | | 0.065 |
| Stage I | 68 | 40 | 102 | 60 | | 94 | 55 | 76 | 45 | |
| Stage II | 16 | 47 | 18 | 53 | | 20 | 59 | 14 | 41 | |
| Stage III | 11 | 30 | 26 | 70 | | 13 | 35 | 24 | 65 | |
| Pleural
invasion | | | | | 0.412 | | | | | 0.284 |
| Absent | 57 | 37 | 96 | 63 | | 85 | 56 | 68 | 44 | |
| Present | 38 | 43 | 50 | 57 | | 42 | 48 | 46 | 52 | |
| p53 expression | | | | |
<0.001 | | | | | |
| Wild-type | 78 | 61 | 49 | 39 | | – | | – | | |
| Aberrant | 17 | 15 | 97 | 85 | | – | | – | | |
| Table IIIPatient characteristics according to
MAGEA2 and p53 expression levels for squamous cell carcinoma. |
Table III
Patient characteristics according to
MAGEA2 and p53 expression levels for squamous cell carcinoma.
| Patient
characteristics | MAGEA2 expression
| p53 expression
|
|---|
Low
| High
| P-value | Wild-type
| Aberrant
| P-value |
|---|
| N | % | N | % | N | % | N | % |
|---|
| All patients | 30 | 34 | 59 | 66 | | 176 | 50 | 177 | 50 | |
| Age (years) | | | | | 0.255 | | | | | 0.595 |
| <60 | 8 | 47 | 9 | 53 | | 9 | 53 | 8 | 47 | |
| ≥60 | 22 | 31 | 50 | 69 | | 32 | 44 | 40 | 56 | |
| Gender | | | | | 1.000 | | | | | 0.118 |
| Female | 2 | 29 | 5 | 71 | | 1 | 14 | 6 | 86 | |
| Male | 28 | 34 | 54 | 66 | | 40 | 49 | 42 | 51 | |
| Smoking
history | | | | | 0.479 | | | | | 0.498 |
| Never-smoker | 4 | 44 | 5 | 56 | | 3 | 33 | 6 | 67 | |
| Smoker | 26 | 32 | 54 | 68 | | 38 | 48 | 42 | 52 | |
| pT factor | | | | | 0.046 | | | | | 0.479 |
| pT1 | 4 | 17 | 20 | 83 | | 13 | 54 | 11 | 46 | |
| pT2-4 | 26 | 40 | 39 | 60 | | 28 | 43 | 37 | 57 | |
| pN factor | | | | | 0.630 | | | | | 0.819 |
| pN0 | 22 | 36 | 39 | 64 | | 29 | 48 | 32 | 52 | |
| pN1-2 | 8 | 29 | 20 | 71 | | 12 | 43 | 16 | 57 | |
| Pathologic
stage | | | | | 0.070 | | | | | 0.590 |
| Stage I | 13 | 29 | 32 | 71 | | 23 | 51 | 22 | 49 | |
| Stage II | 13 | 52 | 12 | 48 | | 11 | 44 | 14 | 56 | |
| Stage III | 4 | 21 | 15 | 79 | | 7 | 37 | 12 | 63 | |
| Pleural
invasion | | | | | 0.649 | | | | | 0.197 |
| Absent | 17 | 32 | 37 | 68 | | 28 | 52 | 26 | 48 | |
| Present | 13 | 37 | 22 | 63 | | 13 | 37 | 22 | 63 | |
| p53 expression | | | | | 0.656 | | | | | |
| Wild-type | 15 | 37 | 26 | 63 | | – | | – | | |
| Aberrant | 15 | 31 | 33 | 69 | | – | | – | | |
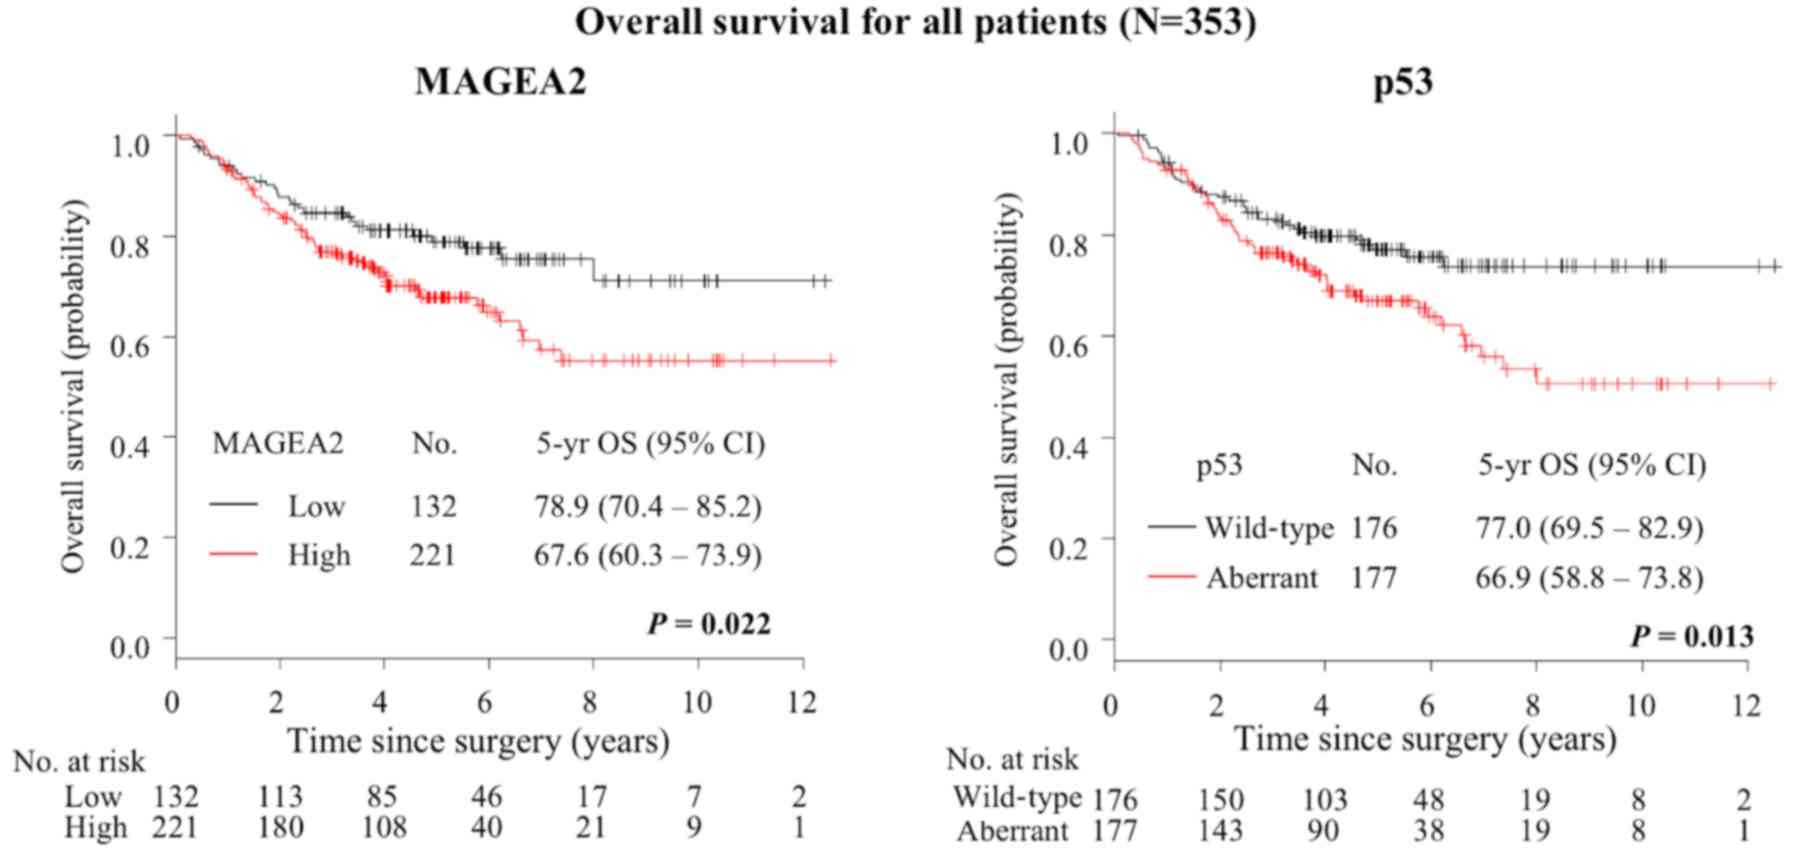
Prognostic significance of MAGEA2 and p53
expression
At the end of the study period, 100 patients had
died. The 5-year OS for all patients was 72.0% (95% CI, 66.0–76.7%)
(Table IV). Kaplan-Meier method
indicated that High-MAGEA2 was associated with increased risk of
death (5-year OS, 78.9% for low level vs. 67.6% for high level;
P=0.022, Fig. 8). Aberrant p53 was
associated with increased risk of death (5-year OS, 77.0% for
wild-type expression vs. 66.9% for aberrant expression; P=0.013,
Fig. 8). On univariate analysis
for other clinicopathological factors, male gender (P=0.001),
smoking history (P=0.023), patient with SqCC (P<0.001), pT
factor (P<0.001), pN factor (P<0.001), pathological stage
(P<0.001), pleural invasion (P=0.014) were correlated with worse
OS. Multivariate analyses were performed on the MAGEA2 expression
and p53 status and these models were adjusted for the prognostic
clinicopathologic factors, including gender, smoking status, pT
stage (T2-4 vs. T1) and pN stage (N1, 2 vs. N0) and pleural
invasion (Present vs. Absent). The final multivariate model
confirmed pT stage (hazard ratio [HR] 1.79, 95% CI 1.01–3.17;
P=0.047) and pN stage (HR 2.78, 95% CI 1.83–4.21; P<0.001)
remained independently associated with survival, but this was not
observed with MAGEA2 expression and p53 status (Table V).
| Table IVPatient characteristics and
univariate analyses of survival for all patients. |
Table IV
Patient characteristics and
univariate analyses of survival for all patients.
| Factors | Patients
| 5-yr OS (%) | 95% CI | P-value |
|---|
| No. | % |
|---|
| All patients | 353 | 100 | 72.0 | 66.0–76.7 | |
| Age (years) | | | | | 0.296 |
| <60 | 122 | 35 | 74.7 | 65.3–81.9 | |
| ≥60 | 231 | 65 | 70.8 | 64.0–76.5 | |
| Gender | | | | | 0.001 |
| Female | 123 | 35 | 81.0 | 72.2–87.3 | |
| Male | 230 | 65 | 67.0 | 60.0–73.1 | |
| Smoking
history | | | | | 0.023 |
| Never-smoker | 119 | 34 | 80.0 | 71.1–86.4 | |
| Smoker | 234 | 66 | 67.8 | 60.8–73.8 | |
| Histological
classification | | | | |
<0.001 |
| ADC | 241 | 68 | 79.4 | 73.2–84.3 | |
| SqCC | 89 | 25 | 54.2 | 42.4–64.6 | |
| LCC | 19 | 5 | 73.7 | 47.9–88.1 | |
| SCC | 4 | 1 | NA | NA | |
| pT factor | | | | |
<0.001 |
| pT1 | 136 | 39 | 84.4 | 76.5–89.8 | |
| pT2-4 | 217 | 61 | 64.3 | 57.0–70.7 | |
| pN factor | | | | |
<0.001 |
| pN0 | 265 | 75 | 81.2 | 75.4–85.7 | |
| pN1-2 | 88 | 25 | 43.9 | 32.4–54.8 | |
| Pathologic
stage | | | | | |
| Stage I | 228 | 65 | 85.5 | 79.6–89.7 |
<0.001 |
| Stage II | 65 | 18 | 61.2 | 47.6–72.2 | |
| Stage III | 60 | 17 | 31.3 | 18.7–44.7 | |
| Pleural
invasion | | | | | 0.014 |
| Absent | 219 | 62 | 76.1 | 69.3–81.6 | |
| Present | 134 | 38 | 65.2 | 55.9–73.1 | |
| MAGEA2
expression | | | | | 0.022 |
| Low | 132 | 37 | 78.9 | 70.4–85.2 | |
| High | 221 | 63 | 67.6 | 60.3–73.9 | |
| p53 expression | | | | | 0.013 |
| Wild-type | 176 | 50 | 77.0 | 69.5–82.9 | |
| Aberrant | 177 | 50 | 66.9 | 58.8–73.8 | |
| MAGEA2/p53
combination | | | | | 0.008 |
| Low/Wild-type | 96 | 27 | 85.5 | 76.2–91.4 | |
| Low/Aberrant | 36 | 10 | 61.4 | 42.5–75.7 | |
|
High/Wild-type | 80 | 23 | 66.2 | 53.4–76.3 | |
| High/Aberrant | 141 | 40 | 68.4 | 59.2–75.9 | |
| MAGEA2 expression
in wild-type p53 | | | | | 0.012 |
| Low | 96 | 27 | 85.5 | 76.2–91.4 | |
| High | 80 | 23 | 66.2 | 53.4–76.3 | |
| MAGEA2 expression
in aberrant type p53 | | | | | 0.662 |
| Low | 36 | 10 | 61.4 | 42.5–75.7 | |
| High | 141 | 40 | 68.4 | 59.2–75.9 | |
| Table VMultivariate analysis of survival for
all patients. |
Table V
Multivariate analysis of survival for
all patients.
| Variable | HR | 95% CI | P-value |
|---|
| Gender | | | |
| Male vs.
Female | 1.68 | 0.96–2.94 | 0.068 |
| Smoking | | | |
| Smoker vs.
Never-smoker | 1.04 | 0.61–1.79 | 0.881 |
| T stage | | | |
| T2-4 vs. T1 | 1.79 | 1.01–3.17 | 0.047 |
| N stage | | | |
| N1,2 vs. N0 | 2.78 | 1.83–4.21 |
<0.001 |
| Pleural
invasion | | | |
| Present vs.
Absent | 1.04 | 0.65–1.65 | 0.883 |
| MAGEA2
expression | | | |
| High vs. Low | 1.55 | 0.97–2.49 | 0.070 |
| p53 expression | | | |
| Aberrant vs.
Wild-type | 1.15 | 0.74–1.80 | 0.531 |
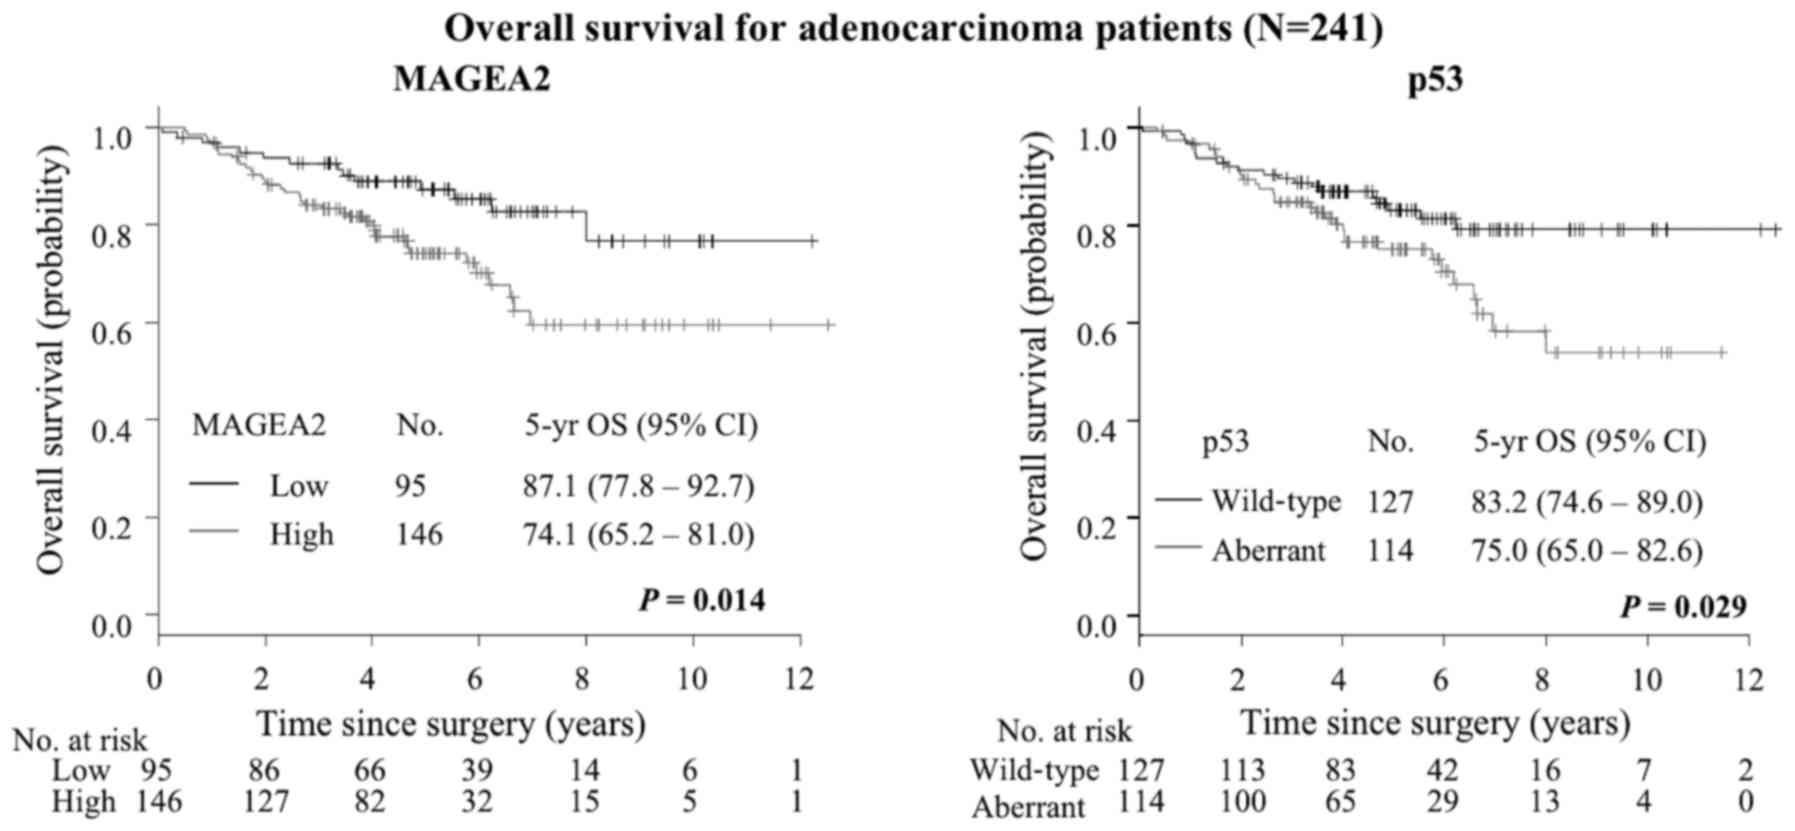
In patients with ADC, the 5-year OS was 79.4% (95%
CI, 73.2–84.3%) (Table VI).
Noteworthy, ADC patients with High-MAGEA2 revealed significantly
shorter overall survival than those with Low-MAGEA2 (5-year OS,
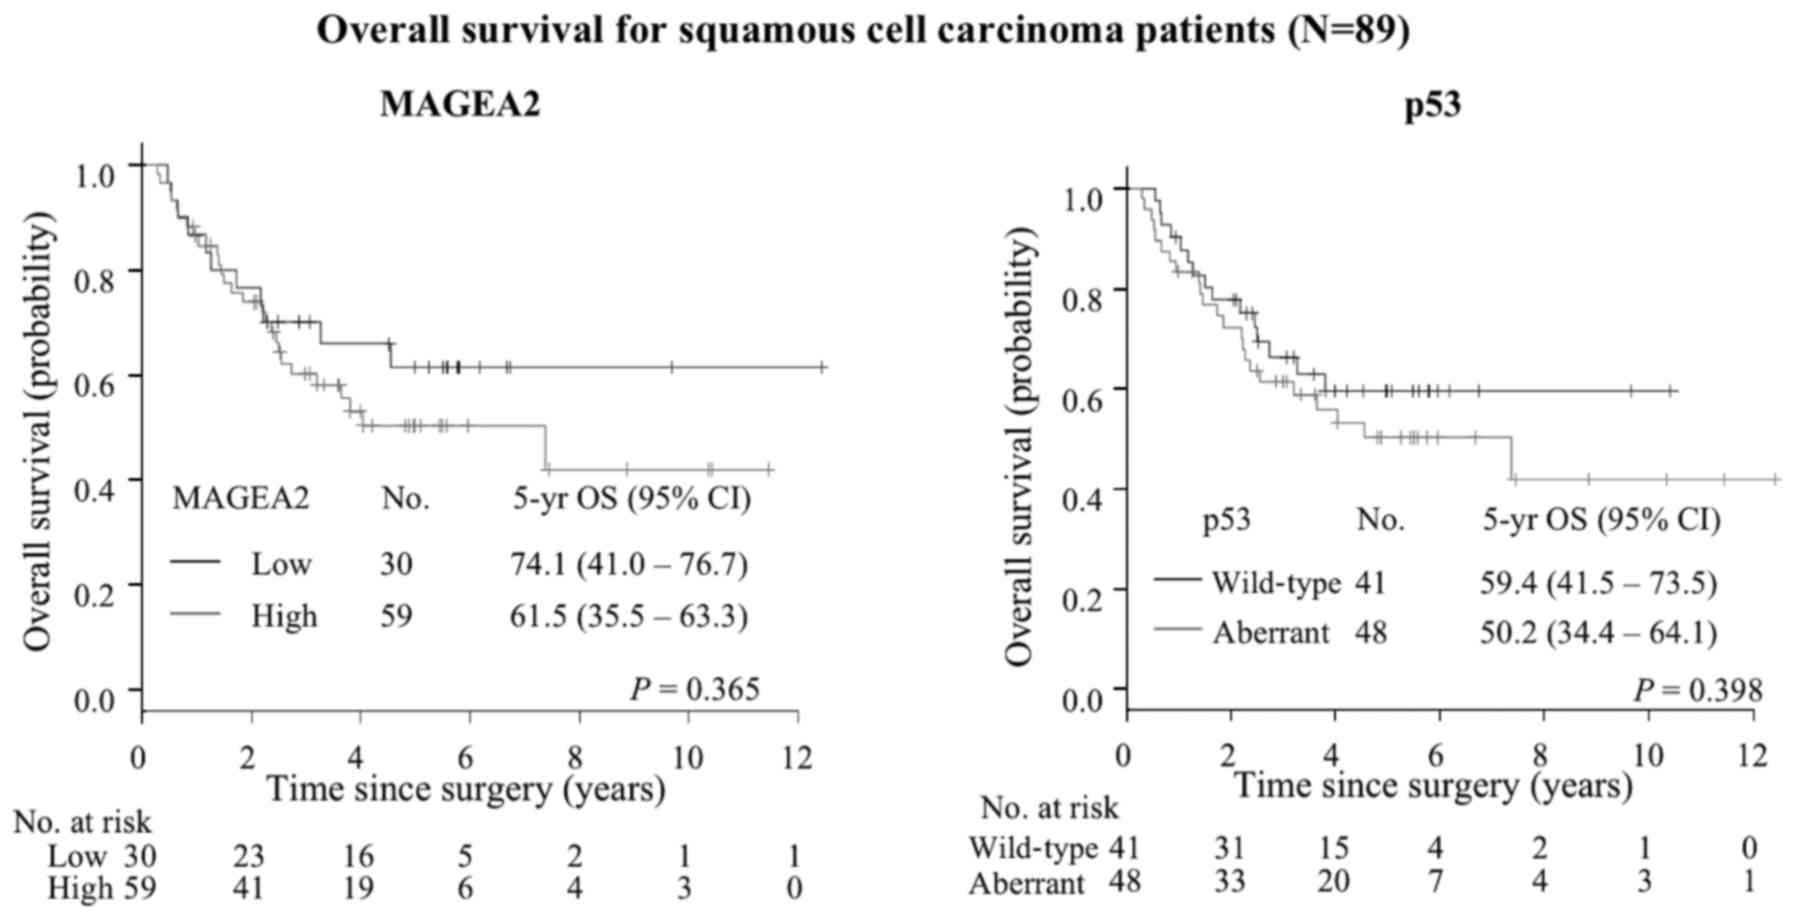
87.1% for low level vs. 74.1% for high level; P=0.014) (Fig. 9), while SqCC patients did not show
any difference although there was a tendency towards poorer
prognosis with High-MAGEA2 (P=0.365) (Table VII, Fig. 10). We also performed univariate
analysis to evaluate associations between prognosis and other
factors in patients with ADC (Table
VI). Among those parameters, advanced pT status (P=0.002),
advanced pN status (P<0.001) and advanced pathological stage
(P<0.001) were significantly associated with poor prognosis in
ADC patients. Aberrant p53 expression was also significantly worse
prognostic factor (5-year OS, 83.2% for wild-type expression vs.
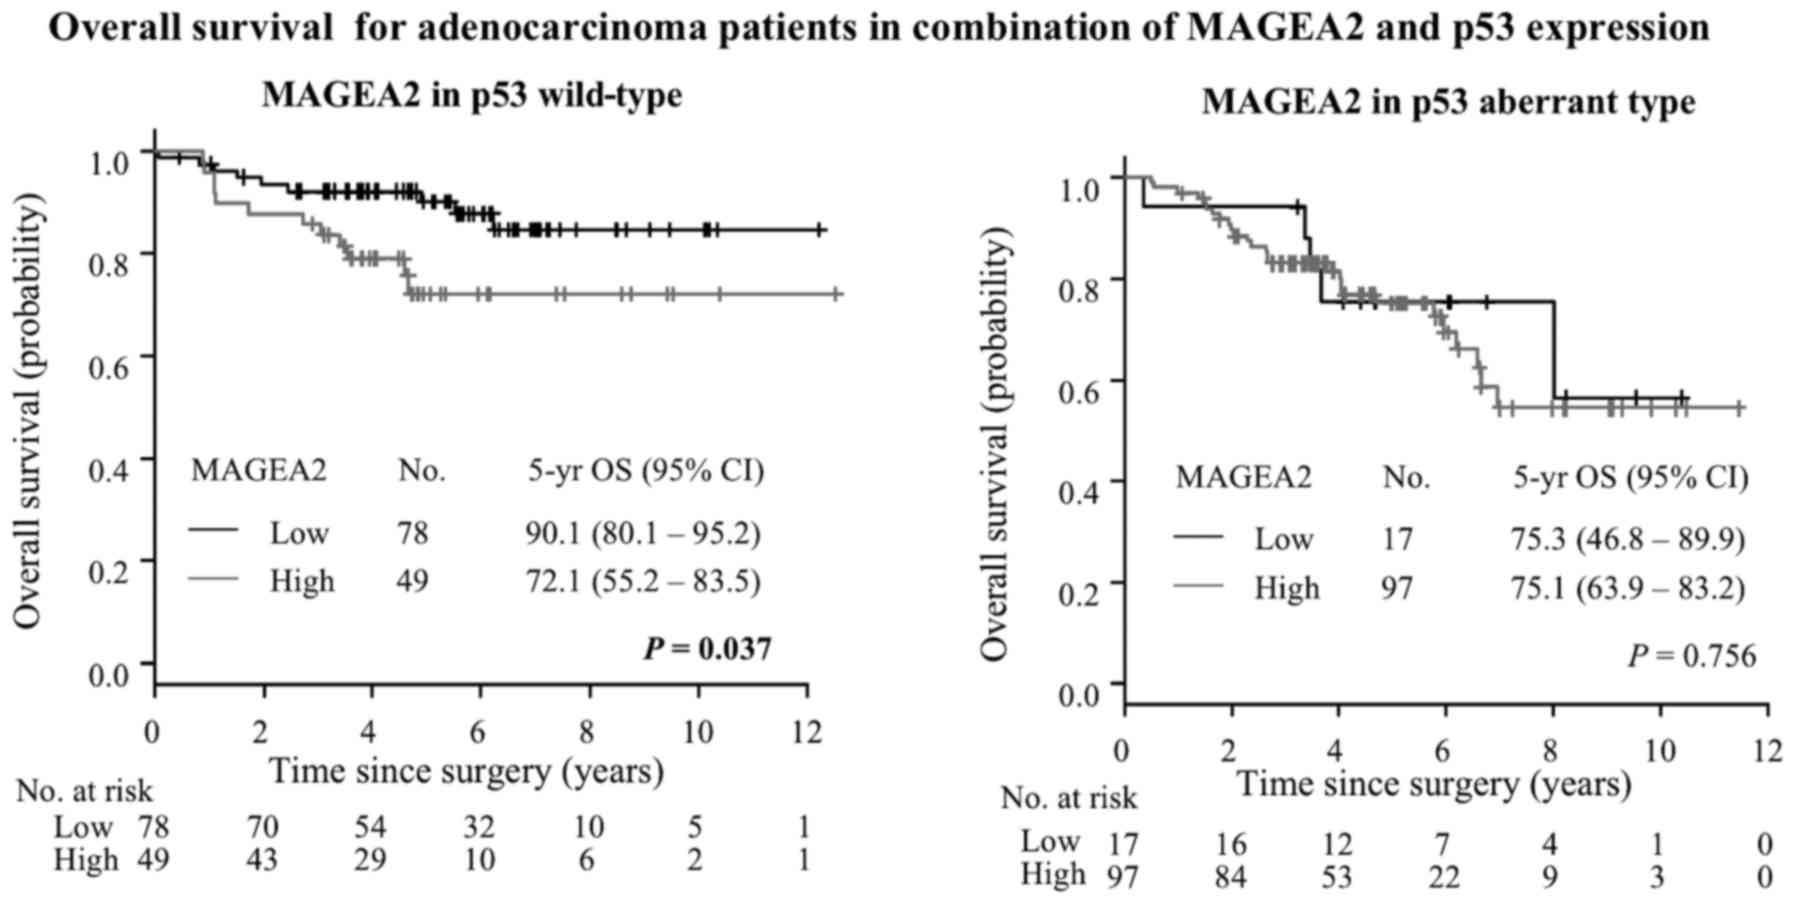
75.0% for aberrant expression; P=0.029) (Fig. 9). Next, we investigated MAGEA2 and
aberrant p53 combinations. Among patients with wild-type p53
expression, High-MAGEA2 had worse prognosis than low MAGEA2 groups
(5 year OS, 90.1% vs. 72.1%, P=0.037, Fig. 11). On the other hand, among
patients with aberrant type p53 expression, there were no
significant differences in the High- and Low-MAGEA2 expression
(5-year OS, 75.3% for low level vs. 75.1% for high level; P=0.756)
(Fig. 11). Multivariate analyses
were performed for the MAGEA2 expression and p53 status and these
models were adjusted for the prognostic clinicopathologic factors
from univariate analysis, including gender, pT stage (T2-4 vs. T1)
and pN stage (N1, 2 vs. N0). MAGEA2 expression was identified as an
independent prognostic factor of lung ADC (HR 2.12, 95% CI
1.08–4.18; P=0.030) by multivariate analysis, as was pN status (HR
3.68, 95% CI 2.06–6.57; P<0.001, Table VIII).
| Table VIPatient characteristics and
univariate analyses of survival for adenocarcinoma. |
Table VI
Patient characteristics and
univariate analyses of survival for adenocarcinoma.
| Factors | Patients
| 5-yr OS (%) | 95% CI | P-value |
|---|
| No. | % |
|---|
| All patients
(ADC) | 241 | 100 | 79.4 | 73.2–84.3 | |
| Age (years) | | | | | 0.749 |
| <60 | 96 | 40 | 80.0 | 69.6–87.2 | |
| ≥60 | 145 | 60 | 79.1 | 70.7–85.4 | |
| Gender | | | | | 0.050 |
| Female | 111 | 46 | 82.9 | 73.7–89.1 | |
| Male | 130 | 54 | 76.3 | 67.1–83.3 | |
| Smoking
history | | | | | 0.115 |
| Never-smoker | 105 | 44 | 84.1 | 74.8–90.1 | |
| Smoker | 136 | 56 | 75.7 | 66.6–82.6 | |
| pT factor | | | | | 0.002 |
| pT1 | 103 | 43 | 87.9 | 79.1–93.2 | |
| pT2-4 | 138 | 57 | 73.0 | 63.9–80.2 | |
| pN factor | | | | |
<0.001 |
| pN0 | 188 | 78 | 86.4 | 80.1–91.0 | |
| pN1-2 | 53 | 22 | 53.8 | 40.5–69.6 | |
| Pathologic
stage | | | | |
<0.001 |
| Stage I | 170 | 71 | 89.2 | 82.6–93.4 | |
| Stage II | 34 | 14 | 70.5 | 52.0–82.9 | |
| Stage III | 37 | 15 | 42.4 | 24.6–59.2 | |
| Pleural
invasion | | | | | 0.291 |
| Absent | 153 | 63 | 80.7 | 72.7–86.6 | |
| Present | 88 | 37 | 77.0 | 65.6–85.0 | |
| MAGEA2
expression | | | | | 0.014 |
| Low | 95 | 39 | 87.1 | 77.8–92.7 | |
| High | 146 | 61 | 74.1 | 65.2–81.0 | |
| p53 expression | | | | | 0.029 |
| Wild-type | 127 | 53 | 83.2 | 74.6–89.0 | |
| Aberrant | 114 | 47 | 75.0 | 65.0–82.6 | |
| MAGEA2/p53
combination | | | | | 0.043 |
| Low/Wild-type | 78 | 33 | 90.1 | 80.1–95.2 | |
| Low/Aberrant | 17 | 7 | 75.3 | 46.8–89.9 | |
|
High/Wild-type | 49 | 20 | 72.1 | 55.2–83.5 | |
| High/Aberrant | 97 | 40 | 75.1 | 63.9–83.2 | |
| MAGEA2 expression
in wild-type p53 | | | | | 0.037 |
| Low | 78 | 33 | 90.1 | 80.1–95.2 | |
| High | 49 | 20 | 72.1 | 55.2–83.5 | |
| MAGEA2 expression
in aberrant type p53 | | | | | 0.756 |
| Low | 17 | 7 | 75.3 | 46.8–89.9 | |
| High | 97 | 40 | 75.1 | 63.9–83.2 | |
| Table VIIPatient characteristics and
univariate analyses of survival for squamous cell carcinoma. |
Table VII
Patient characteristics and
univariate analyses of survival for squamous cell carcinoma.
| Factors | Patients
| 5-yr OS (%) | 95% CI | P-value |
|---|
| No. | % |
|---|
| All patients
(SqCC) | 89 | 100 | 54.2 | 42.4–64.6 | |
| Age (years) | | | | | 0.891 |
| <60 | 17 | 20 | 49.3 | 23.0–71.2 | |
| ≥60 | 72 | 80 | 55.6 | 42.3–66.9 | |
| Gender | | | | | 0.545 |
| Female | 7 | 8 | 66.7 | 19.5–90.4 | |
| Male | 82 | 92 | 53.3 | 41.0–64.1 | |
| Smoking
history | | | | | 0.559 |
| Never-smoker | 9 | 10 | 44.4 | 13.6–71.9 | |
| Smoker | 80 | 90 | 55.4 | 42.7–66.4 | |
| pT factor | | | | | 0.034 |
| pT1 | 24 | 27 | 75.9 | 51.2–89.2 | |
| pT2-4 | 65 | 73 | 47.2 | 33.9–59.4 | |
| pN factor | | | | |
<0.001 |
| pN0 | 61 | 69 | 69.9 | 55.8–80.3 | |
| pN1-2 | 28 | 31 | 22.0 | 8.3–39.9 | |
| Pathologic
stage | | | | |
<0.001 |
| Stage I | 45 | 51 | 78.8 | 63.2–88.4 | |
| Stage II | 25 | 28 | 48.5 | 27.0–67.1 | |
| Stage III | 19 | 21 | 6.9 | 0.5–26.4 | |
| Pleural
invasion | | | | | 0.008 |
| Absent | 54 | 61 | 64.3 | 48.5–76.3 | |
| Present | 35 | 39 | 39.4 | 22.4–55.9 | |
| MAGEA2
expression | | | | | 0.365 |
| Low | 30 | 34 | 74.1 | 41.0–76.7 | |
| High | 59 | 66 | 61.5 | 35.5–63.3 | |
| p53 expression | | | | | 0.398 |
| Wild-type | 41 | 46 | 59.4 | 41.5–73.5 | |
| Aberrant | 48 | 54 | 50.2 | 34.4–64.1 | |
| MAGEA2/p53
combination | | | | | 0.455 |
| Low/Wild-type | 15 | 17 | 59.3 | 30.7–79.3 | |
| Low/Aberrant | 15 | 17 | 64.2 | 33.3–83.6 | |
|
High/Wild-type | 26 | 29 | 59.2 | 35.1–76.9 | |
| High/Aberrant | 33 | 37 | 44.1 | 25.9–60.9 | |
| MAGEA2 expression
in wild-type p53 | | | | | 0.821 |
| Low | 15 | 17 | 59.3 | 30.7–79.3 | |
| High | 26 | 29 | 59.2 | 35.1–76.9 | |
| MAGEA2 expression
in aberrant type p53 | | | | | 0.206 |
| Low | 15 | 17 | 64.2 | 33.3–83.6 | |
| High | 33 | 37 | 44.1 | 25.9–60.9 | |
| Table VIIIMultivariate analysis of survival for
adenocarcinoma. |
Table VIII
Multivariate analysis of survival for
adenocarcinoma.
| Variable | HR | 95% CI | P-value |
|---|
| Gender | | | |
| (Male vs.
Female) | 1.50 | 0.85–2.65 | 0.160 |
| T stage | | | |
| (T2-4 vs.
T1) | 1.73 | 0.88–3.38 | 0.110 |
| N stage | | | |
| (T1,2 vs.
N0) | 3.68 | 2.06–6.57 |
<0.001 |
| MAGEA2
expression | | | |
| (High vs.
Low) | 2.12 | 1.08–4.18 | 0.030 |
| p53 expression | | | |
| (Aberrant vs.
Wild-type) | 1.02 | 0.55–1.91 | 0.945 |
Discussion
MAGEA comprises of an 11-member subfamily of the
broader family of MAGE proteins which are characterized by the
presence of a MAGE-homology domain (11). The search for these genes as
tumor-specific antigen has been active for many decades, however,
the normal physiologic role of MAGEA proteins remains poorly
understood and their contribution to cancer development is yet to
be fully demonstrated (11). Only
in recent years members of the MAGEA family have been shown to be
implicated in various tumorigenic or tumor suppressive pathways. On
one hand, MAGEA4, for example, promotes apoptosis and sensitization
to chemotherapeutic agents, therefore functions as a tumor
suppressor protein (40). MAGEA4
is also processed by a proteasome to generate a C-terminal fragment
with pro-apoptotic activities, which increases the p53 protein
level, and subsequent apoptosis (41). MAGEA genes have been shown to
inhibit p53-dependent apoptosis in cancer cells, and contribute to
tumor aggressiveness (19,42). MAGEA protein blocked the
association of p53 with its DNA binding surface of the p53 core
domain, suppressing apoptosis in p53-dependent manner (19).
Herein, we showed for the first time that a high
MAGEA2 expression level (High-MAGEA2) in patients with lung cancer,
especially in ADC, is strongly associated with poor survival. In
particular, patients with High-MAGEA2 have significantly poorer
overall survival rate than those with Low-MAGEA2 in wild-type p53
tumors. In addition, High-MAGEA2 is an independent poor prognostic
factor among lung ADC. In lung SqCC, however, there is no relation
to p53 status and no prognostic difference between tumors with
High- and Low-MAGEA2, although MAGEA2 expression is increased with
tumor progression (pT factor). This prognostic significance
indicates that p53/MAGEA2 interaction in cancer progression depends
on histology and p53 status and suggests that therapies targeting
MAGEA2 may improve patient survival for patients with ADC with p53
wild-type.
The p53 tumor-suppressor is a key transcription
factor that controls cell proliferation, inducing growth arrest or
apoptosis in response to different cellular stresses (43). p53 mutation is associated with
invasiveness in ADC, suggesting this is a relatively late event
during tumor development and plays an important role in the
progression of the peripheral pulmonary ADC (24). However, little is known about the
functional role of MAGE-A genes in tumorigenesis for p53
aberrant-type tumors. We found MAGEA2 expression to be
significantly increased with aberrant p53 expression in ADC. In
addition, downregulation of MAGEA2 in lung cancer cell with p53
mutation showed significant growth suppressive effect in
vitro, although, unexpectedly, there is no difference in terms
of prognosis between tumor with High-MAGEA2 and Low-MAGEA2 in
patients with aberrant-type p53. We also examined the effect of
MAGEA2 expression on the p53 downstream targets using lung cancer
cell lines with p53 mutation. In p53 wild-type cancer cells,
elimination of Mage-A expression in tumor-derived cells that retain
functional p53 leads to increased recruitment of p53 to
p53-responsive promoters and increases in p53-dependent
transcription, cell cycle arrest, and cell death (19). To our surprise, we found that there
was a significant decrease in expression of p53 downstream genes
after suppression of MAGEA2. Taken together, these results indicate
that MAGEA2 may contribute to the stability of p53 transcriptional
activity in p53-mutated lung cancer cells, and the expression of
MAGEA2 itself does not affect prognostic impact in p53
aberrant-type tumor, even though MAGEA2 is associated with tumor
growth/survival. There is room for discussion about different
functional roles of MAGEA2 in integrations between MAGEA2 and
mutated-p53. Given our results in addition to the expression
pattern of MAGEA2 reported in other studies, MAGEA2 is a promising
molecular and immunogenic target even in lung cancer with p53
mutation and our finding helps understanding of the mechanisms that
explains how MAGEA2 interacts with p53 activity according to p53
status, which also can be used to help develop new therapeutic
strategy against lung cancer.
A limitation of this study is the efficacy of TMAs
in reflecting gene expression in heterogeneity of lung cancer. TMA
analysis is a promising technique in the evaluation of
immunohistochemical markers in tumors and may be used as an
alternative for whole sections. However, TMAs represent only a
small portion of tissue collected and could be subject to sampling
error. This should be considered a potential limitation of this
finding and warrants further investigation with larger validate
cohorts and using multiple TMA cores.
There have been no previous studies addressing the
functional and prognostic role of MAGEA2 in lung cancer with
regards to patients with resectable lung cancer. In the present
study, we demonstrated that suppression of MAGEA2 in lung cancer
cells significantly reduced the growth/survival of cells.
Furthermore, MAGEA2 overexpression could be a useful index for
patients with a high risk of poor prognosis in ADC patients.
Although it still remains unclear as to how MAGEA2 is associated in
tumorigenesis and p53 status, our study has shed some light on the
biological function role of MAGEA2 in promoting lung cancer cell
progression. Based on these results, specific inhibition of MAGEA2
can be a promising therapeutic agent for patients with lung
cancer.
Acknowledgments
We are especially thankful to Dr Ming-Sound Tsao
(Departments of Laboratory Medicine and Pathobiology, University of
Toronto, Toronto, Ontario, Canada), for providing us with the lung
cancer cell lines that we used in this study. We would like to
thank Ms. Alexandria Grindlay and Ms. Judy McConnell (Toronto
General Hospital) for supporting the research work. H.U. received a
research scholarship from the Joseph M. West Family Memorial
Fund.
Abbreviations:
|
ADC
|
adenocarcinoma
|
|
EBUS-TBNA
|
endo-bronchial ultrasound-guided
transbronchial needle aspiration
|
|
H&E
|
hematoxylin and eosin
|
|
HR
|
hazard ratio
|
|
IHC
|
immunohistochemical
|
|
LCC
|
large cell carcinomas
|
|
LN
|
lymph node
|
|
MAGE
|
melanoma-associated antigens
|
|
NSCLC
|
non-small cell lung cancer
|
|
OS
|
overall survival
|
|
qRT-PCR
|
quantitative reverse
transcription-polymerase chain reaction
|
|
SCC
|
small cell lung cancers
|
|
siRNA
|
small interfering RNA
|
|
SqCC
|
squamous cell carcinomas
|
|
TMA
|
tissue microarrays
|
References
|
1
|
Siegel RL, Miller KD and Jemal A: Cancer
statistics, 2016. CA Cancer J Clin. 66:7–30. 2016. View Article : Google Scholar : PubMed/NCBI
|
|
2
|
Aberle DR, Adams AM, Berg CD, Black WC,
Clapp JD, Fagerstrom RM, Gareen IF, Gatsonis C, Marcus PM and Sicks
JD; National Lung Screening Trial Research Team: Reduced
lung-cancer mortality with low-dose computed tomographic screening.
N Engl J Med. 365:395–409. 2011. View Article : Google Scholar : PubMed/NCBI
|
|
3
|
Ujiie H, Kadota K, Chaft JE, Buitrago D,
Sima CS, Lee MC, Huang J, Travis WD, Rizk NP, Rudin CM, et al:
Solid predominant histologic subtype in resected stage I lung
adenocarcinoma is an independent predictor of early, extrathoracic,
multisite recurrence and of poor postrecurrence survival. J Clin
Oncol. 33:2877–2884. 2015. View Article : Google Scholar : PubMed/NCBI
|
|
4
|
National Cancer Institute: Surveillance,
Epidemiology, and End Results Program. Cancer Stat Facts, Lung and
Bronchus Cancer. http://seer.cancer.gov/statfacts/html/lungb.html.
|
|
5
|
Ujiie H, Tomida M, Akiyama H, Nakajima Y,
Okada D, Yoshino N, Takiguchi Y and Tanzawa H: Serum hepatocyte
growth factor and interleukin-6 are effective prognostic markers
for non-small cell lung cancer. Anticancer Res. 32:3251–3258.
2012.PubMed/NCBI
|
|
6
|
Ujiie H, Lee D, Kato T and Yasufuku K:
Gene Signature. Molecular Targeted Therapy of Lung Cancer.
Takiguchi Y: Springer; Singapore, Singapore: pp. 279–292. 2017,
View Article : Google Scholar
|
|
7
|
Nakajima T, Zamel R, Anayama T, Kimura H,
Yoshino I, Keshavjee S and Yasufuku K: Ribonucleic acid microarray
analysis from lymph node samples obtained by endobronchial
ultrasonography-guided transbronchial needle aspiration. Ann Thorac
Surg. 94:2097–2101. 2012. View Article : Google Scholar : PubMed/NCBI
|
|
8
|
Kato T, Wada H, Patel P, Hu HP, Lee D,
Ujiie H, Hirohashi K, Nakajima T, Sato M, Kaji M, et al:
Overexpression of KIF23 predicts clinical outcome in primary lung
cancer patients. Lung Cancer. 92:53–61. 2016. View Article : Google Scholar : PubMed/NCBI
|
|
9
|
van der Bruggen P, Traversari C, Chomez P,
Lurquin C, De Plaen E, Van den Eynde B, Knuth A and Boon T: A gene
encoding an antigen recognized by cytolytic T lymphocytes on a
human melanoma. Science. 254:1643–1647. 1991. View Article : Google Scholar : PubMed/NCBI
|
|
10
|
Chomez P, De Backer O, Bertrand M, De
Plaen E, Boon T and Lucas S: An overview of the MAGE gene family
with the identification of all human members of the family. Cancer
Res. 61:5544–5551. 2001.PubMed/NCBI
|
|
11
|
Simpson AJ, Caballero OL, Jungbluth A,
Chen YT and Old LJ: Cancer/testis antigens, gametogenesis and
cancer. Nat Rev Cancer. 5:615–625. 2005. View Article : Google Scholar : PubMed/NCBI
|
|
12
|
Weynants P, Lethé B, Brasseur F, Marchand
M and Boon T: Expression of mage genes by non-small-cell lung
carcinomas. Int J Cancer. 56:826–829. 1994. View Article : Google Scholar : PubMed/NCBI
|
|
13
|
Mecklenburg I, Stratakis DF, Huber RM,
Häussinger K, Morresi-Hauf A, Riethmüller G and Kufer P: Detection
of melanoma antigen-A expression in sputum and bronchial lavage
fluid of patients with lung cancer. Chest. 125(Suppl): S164–S166.
2004. View Article : Google Scholar
|
|
14
|
Jheon S, Hyun DS, Lee SC, Yoon GS, Jeon
CH, Park JW, Park CK, Jung MH, Lee KD and Chang HK: Lung cancer
detection by a RT-nested PCR using MAGE A1 - 6 common primers. Lung
Cancer. 43:29–37. 2004. View Article : Google Scholar
|
|
15
|
Hutchinson TP: Patterns of melanoma
antigen-A expression in lung cancer patients. Chest. 128:1069–1070.
2005. View Article : Google Scholar : PubMed/NCBI
|
|
16
|
Mecklenburg I, Sienel W, Schmid S,
Passlick B and Kufer P: A threshold of systemic MAGE-A gene
expression predicting survival in resected non-small cell lung
cancer. Clin Cancer Res. 23:1213–1219. 2017. View Article : Google Scholar
|
|
17
|
Vansteenkiste JF, Cho BC, Vanakesa T, De
Pas T, Zielinski M, Kim MS, Jassem J, Yoshimura M, Dahabreh J,
Nakayama H, et al: Efficacy of the MAGE-A3 cancer immunotherapeutic
as adjuvant therapy in patients with resected MAGE-A3-positive
non-small-cell lung cancer (MAGRIT): A randomised, double-blind,
placebo-controlled, phase 3 trial. Lancet Oncol. 17:822–835. 2016.
View Article : Google Scholar : PubMed/NCBI
|
|
18
|
Pujol JL, Vansteenkiste JF, De Pas TM,
Atanackovic D, Reck M, Thomeer M, Douillard JY, Fasola G, Potter V,
Taylor P, et al: Safety and immunogenicity of MAGE-A3 cancer
immunotherapeutic with or without adjuvant chemotherapy in patients
with resected stage IB to III MAGE-A3-positive non-small-cell lung
cancer. J Thorac Oncol. 10:1458–1467. 2015. View Article : Google Scholar : PubMed/NCBI
|
|
19
|
Marcar L, Maclaine NJ, Hupp TR and Meek
DW: Mage-A cancer/testis antigens inhibit p53 function by blocking
its interaction with chromatin. Cancer Res. 70:10362–10370. 2010.
View Article : Google Scholar : PubMed/NCBI
|
|
20
|
Monte M, Simonatto M, Peche LY, Bublik DR,
Gobessi S, Pierotti MA, Rodolfo M and Schneider C: MAGE-A tumor
antigens target p53 transactivation function through histone
deacetylase recruitment and confer resistance to chemotherapeutic
agents. Proc Natl Acad Sci USA. 103:11160–11165. 2006. View Article : Google Scholar : PubMed/NCBI
|
|
21
|
Peche LY, Scolz M, Ladelfa MF, Monte M and
Schneider C: MageA2 restrains cellular senescence by targeting the
function of PMLIV/p53 axis at the PML-NBs. Cell Death Differ.
19:926–936. 2012. View Article : Google Scholar :
|
|
22
|
Gazzeri S, Brambilla E, Caron de Fromentel
C, Gouyer V, Moro D, Perron P, Berger F and Brambilla C: p53
genetic abnormalities and myc activation in human lung carcinoma.
Int J Cancer. 58:24–32. 1994. View Article : Google Scholar : PubMed/NCBI
|
|
23
|
Ding L, Getz G, Wheeler DA, Mardis ER,
McLellan MD, Cibulskis K, Sougnez C, Greulich H, Muzny DM, Morgan
MB, et al: Somatic mutations affect key pathways in lung
adenocarcinoma. Nature. 455:1069–1075. 2008. View Article : Google Scholar : PubMed/NCBI
|
|
24
|
Yoo SB, Chung JH, Lee HJ, Lee CT, Jheon S
and Sung SW: Epidermal growth factor receptor mutation and p53
overexpression during the multistage progression of small
adenocarcinoma of the lung. J Thorac Oncol. 5:964–969. 2010.
View Article : Google Scholar : PubMed/NCBI
|
|
25
|
Wu H, Gao L, Li F, Song F, Yang X and
Kasabov N: Identifying overlapping mutated driver pathways by
constructing gene networks in cancer. BMC Bioinformatics. 16(Suppl
5): S32015. View Article : Google Scholar : PubMed/NCBI
|
|
26
|
Kato T, Daigo Y, Aragaki M, Ishikawa K,
Sato M and Kaji M: Overexpression of CDC20 predicts poor prognosis
in primary non-small cell lung cancer patients. J Surg Oncol.
106:423–430. 2012. View Article : Google Scholar : PubMed/NCBI
|
|
27
|
Kato T, Daigo Y, Aragaki M, Ishikawa K,
Sato M and Kaji M: Overexpression of KIAA0101 predicts poor
prognosis in primary lung cancer patients. Lung Cancer. 75:110–118.
2012. View Article : Google Scholar
|
|
28
|
Kato T, Daigo Y, Aragaki M, Ishikawa K,
Sato M, Kondo S and Kaji M: Overexpression of MAD2 predicts
clinical outcome in primary lung cancer patients. Lung Cancer.
74:124–131. 2011. View Article : Google Scholar : PubMed/NCBI
|
|
29
|
Travis WD, Brambilla E, Burke AP, Marx A
and Nicholson AG: WHO Classification of Tumours of the Lung,
Pleura, Thymus and Heart. Fourth edition. WHO Classification of
Tumours. 7. WHO Publications Center; Albany, NY: 2015
|
|
30
|
Edge SB and Compton CC: The American Joint
Committee on Cancer: the 7th edition of the AJCC cancer staging
manual and the future of TNM. Ann Surg Oncol. 17:1471–1474. 2010.
View Article : Google Scholar : PubMed/NCBI
|
|
31
|
Nakajima T, Anayama T, Koike T, Waddell T,
Keshavjee S, Kimura H, Yoshino I and Yasufuku K: Simultaneous
isolation of total RNA, DNA, and protein using samples obtained by
EBUS-TBNA. J Bronchology Interv Pulmonol. 18:301–305. 2011.
View Article : Google Scholar : PubMed/NCBI
|
|
32
|
ImageScope viewing software: Leica
Biosystem Imaging, INC. http://www.leicabiosystems.com/pathology-imaging/aperio-epathology/integrate/imagescope/.
|
|
33
|
Rizzardi AE, Johnson AT, Vogel RI,
Pambuccian SE, Henriksen J, Skubitz AP, Metzger GJ and Schmechel
SC: Quantitative comparison of immunohistochemical staining
measured by digital image analysis versus pathologist visual
scoring. Diagn Pathol. 7:422012. View Article : Google Scholar : PubMed/NCBI
|
|
34
|
Nagashio R, Sato Y, Jiang SX, Ryuge S,
Kodera Y, Maeda T and Nakajima T: Detection of tumor-specific
autoantibodies in sera of patients with lung cancer. Lung Cancer.
62:364–373. 2008. View Article : Google Scholar : PubMed/NCBI
|
|
35
|
Nagashio R, Sato Y, Matsumoto T, Kageyama
T, Satoh Y, Shinichiro R, Masuda N, Goshima N, Jiang SX and Okayasu
I: Expression of RACK1 is a novel biomarker in pulmonary
adenocarcinomas. Lung Cancer. 69:54–59. 2010. View Article : Google Scholar
|
|
36
|
Ujiie H, Kadota K, Nitadori JI, Aerts JG,
Woo KM, Sima CS, Travis WD, Jones DR, Krug LM and Adusumilli PS:
The tumoral and stromal immune microenvironment in malignant
pleural mesothelioma: A comprehensive analysis reveals prognostic
immune markers. Oncoimmunology. 4:e10092852015. View Article : Google Scholar : PubMed/NCBI
|
|
37
|
Cha YJ, Kim HR, Lee CY, Cho BC and Shim
HS: Clinicopathological and prognostic significance of programmed
cell death ligand-1 expression in lung adenocarcinoma and its
relationship with p53 status. Lung Cancer. 97:73–80. 2016.
View Article : Google Scholar : PubMed/NCBI
|
|
38
|
Shim HS, Kenudson M, Zheng Z, Liebers M,
Cha YJ, Hoang Ho Q, Onozato M, Phi Le L, Heist RS and Iafrate AJ:
Unique genetic and survival characteristics of invasive mucinous
adenocarcinoma of the lung. J Thorac Oncol. 10:1156–1162. 2015.
View Article : Google Scholar : PubMed/NCBI
|
|
39
|
Brattström D, Bergqvist M, Lamberg K,
Kraaz W, Scheibenflug L, Gustafsson G, Inganäs M, Wagenius G and
Brodin O: Complete sequence of p53 gene in 20 patients with lung
cancer: Comparison with chemosensitivity and immunohistochemistry.
Med Oncol. 15:255–261. 1998. View Article : Google Scholar
|
|
40
|
Peikert T, Specks U, Farver C, Erzurum SC
and Comhair SA: Melanoma antigen A4 is expressed in non-small cell
lung cancers and promotes apoptosis. Cancer Res. 66:4693–4700.
2006. View Article : Google Scholar : PubMed/NCBI
|
|
41
|
Sakurai T, Itoh K, Higashitsuji H, Nagao
T, Nonoguchi K, Chiba T and Fujita J: A cleaved form of MAGE-A4
binds to Miz-1 and induces apoptosis in human cells. J Biol Chem.
279:15505–15514. 2004. View Article : Google Scholar : PubMed/NCBI
|
|
42
|
Yang B, O'Herrin SM, Wu J, Reagan-Shaw S,
Ma Y, Bhat KM, Gravekamp C, Setaluri V, Peters N, Hoffmann FM, et
al: MAGE-A, mMage-b, and MAGE-C proteins form complexes with KAP1
and suppress p53-dependent apoptosis in MAGE-positive cell lines.
Cancer Res. 67:9954–9962. 2007. View Article : Google Scholar : PubMed/NCBI
|
|
43
|
Harris SL and Levine AJ: The p53 pathway:
Positive and negative feedback loops. Oncogene. 24:2899–2908. 2005.
View Article : Google Scholar : PubMed/NCBI
|