Introduction
Hepatocellular carcinoma (HCC) is the most frequent
primary malignancy of the liver. Globally, it is the fifth most
common cancer in men and seventh among women. There are over half a
million new HCC cases diagnosed annually worldwide, with
Mediterranean countries such as Italy, Spain, and Greece that have
intermediate incidence rates of 10-20 per 100,000 individuals
(1). The standard treatment for
HCC patients with good prognosis is surgical resection, with the
rate of five-year survival of 89-93% (2). However, for the majority of patients
with an advanced and/or unresectable HCC the only therapeutic
option is the oral multikinase inhibitor sorafenib (3). Sorafenib was developed in 1995. This
molecule is a small drug developed by Bayer and Onyx that is able
to inhibit strongly the activity of CRAF that was later named
sorafenib. Besides affecting CRAF, sorafenib also inhibits BRAF,
VEGFR-1, -2 and -3, PDGFR-β, FGFR1, c-Kit, Flt-3 and RET (4). Sorafenib reduces proliferation by
inhibiting the activity of RAF in the MAPK pathway, induces
apoptosis by blocking elF4E phosphorylation and the initiation of
Mcl-1 translation, and reduces the tumor microvasculature targeting
PDGFR-β and VEGFR-2/3 (5). In
2008, the SHARP clinical trial showed that the median overall
survival increased from 7.9 months to 10.7 months in the group
treated with sorafenib compared to placebo (6). Although HCC patients treated with
sorafenib have an increase in survival time, sorafenib still
presented very low rate of tumor response, suggesting the existence
of some acquired mechanism of primary resistance. Some studies have
suggested several mechanisms underlying the onset of sorafenib
resistance in HCC such as the up regulation of Akt, the increased
expression of EGFR and HER-3, the activation of
epithelial-mesenchymal transition (EMT) process and cell autophagy
(7).
It is well known that hepatocarcinogenesis is a
complex process, not only favoured by the accumulation of genetic
alterations, but also by epigenetic alterations. In fact, there are
many studies indicating the importance of epigenetic processes that
have largely changed the view of HCC. These studies indicated that
HCC presents many alterations of its epigenome such as global
genomic DNA hypomethylation, gene-specific DNA hyper- or
hypomethylation, abnormal expression of DNA methyltransferases and
histone modifying enzymes, altered histone modification patterns,
and aberrant expression of microRNAs and long non-coding RNA
(8).
To our knowledge there are few studies in the
literature regarding the epigenetic effects of sorafenib in cancer
cells. In one study, A549 adenocarcinoma alveolar cancer epithelial
cells were treated simultaneously with TGF-β1 and sorafenib and
global changes to histone modification were determined. The authors
demonstrated that sorafenib largely reversed the changes in histone
modifications that occurred during EMT in A549 cells (9). In another study, it was demonstrated
that the antiproliferative effect of sorafenib on HCC cells could
be due to the degradation of the histone methyltransferase EZH2
promoted by sorafenib through the way of proteasome. Overexpression
of EZH2 reduced the effects of sorafenib, while the siRNA against
EZH2 increased the effect of the drug. It is assumed, therefore,
that the epigenetic modifications mediated by EZH2 may be another
molecular mechanism crucial for the acquisition of resistance to
sorafenib (10). Furthermore, the
interaction of sorafenib with microRNAs has been demonstrated
elsewhere (11). In our previous
study, we found that the combined treatment of HA22T/VGH HCC cells
with miR-193a and sorafenib led to further inhibition of
proliferation compared to sorafenib treatment alone (11,12).
However, DNA methylation has not been studied on global level in
HCC cells treated with sorafenib. Herein, we evaluated the changes
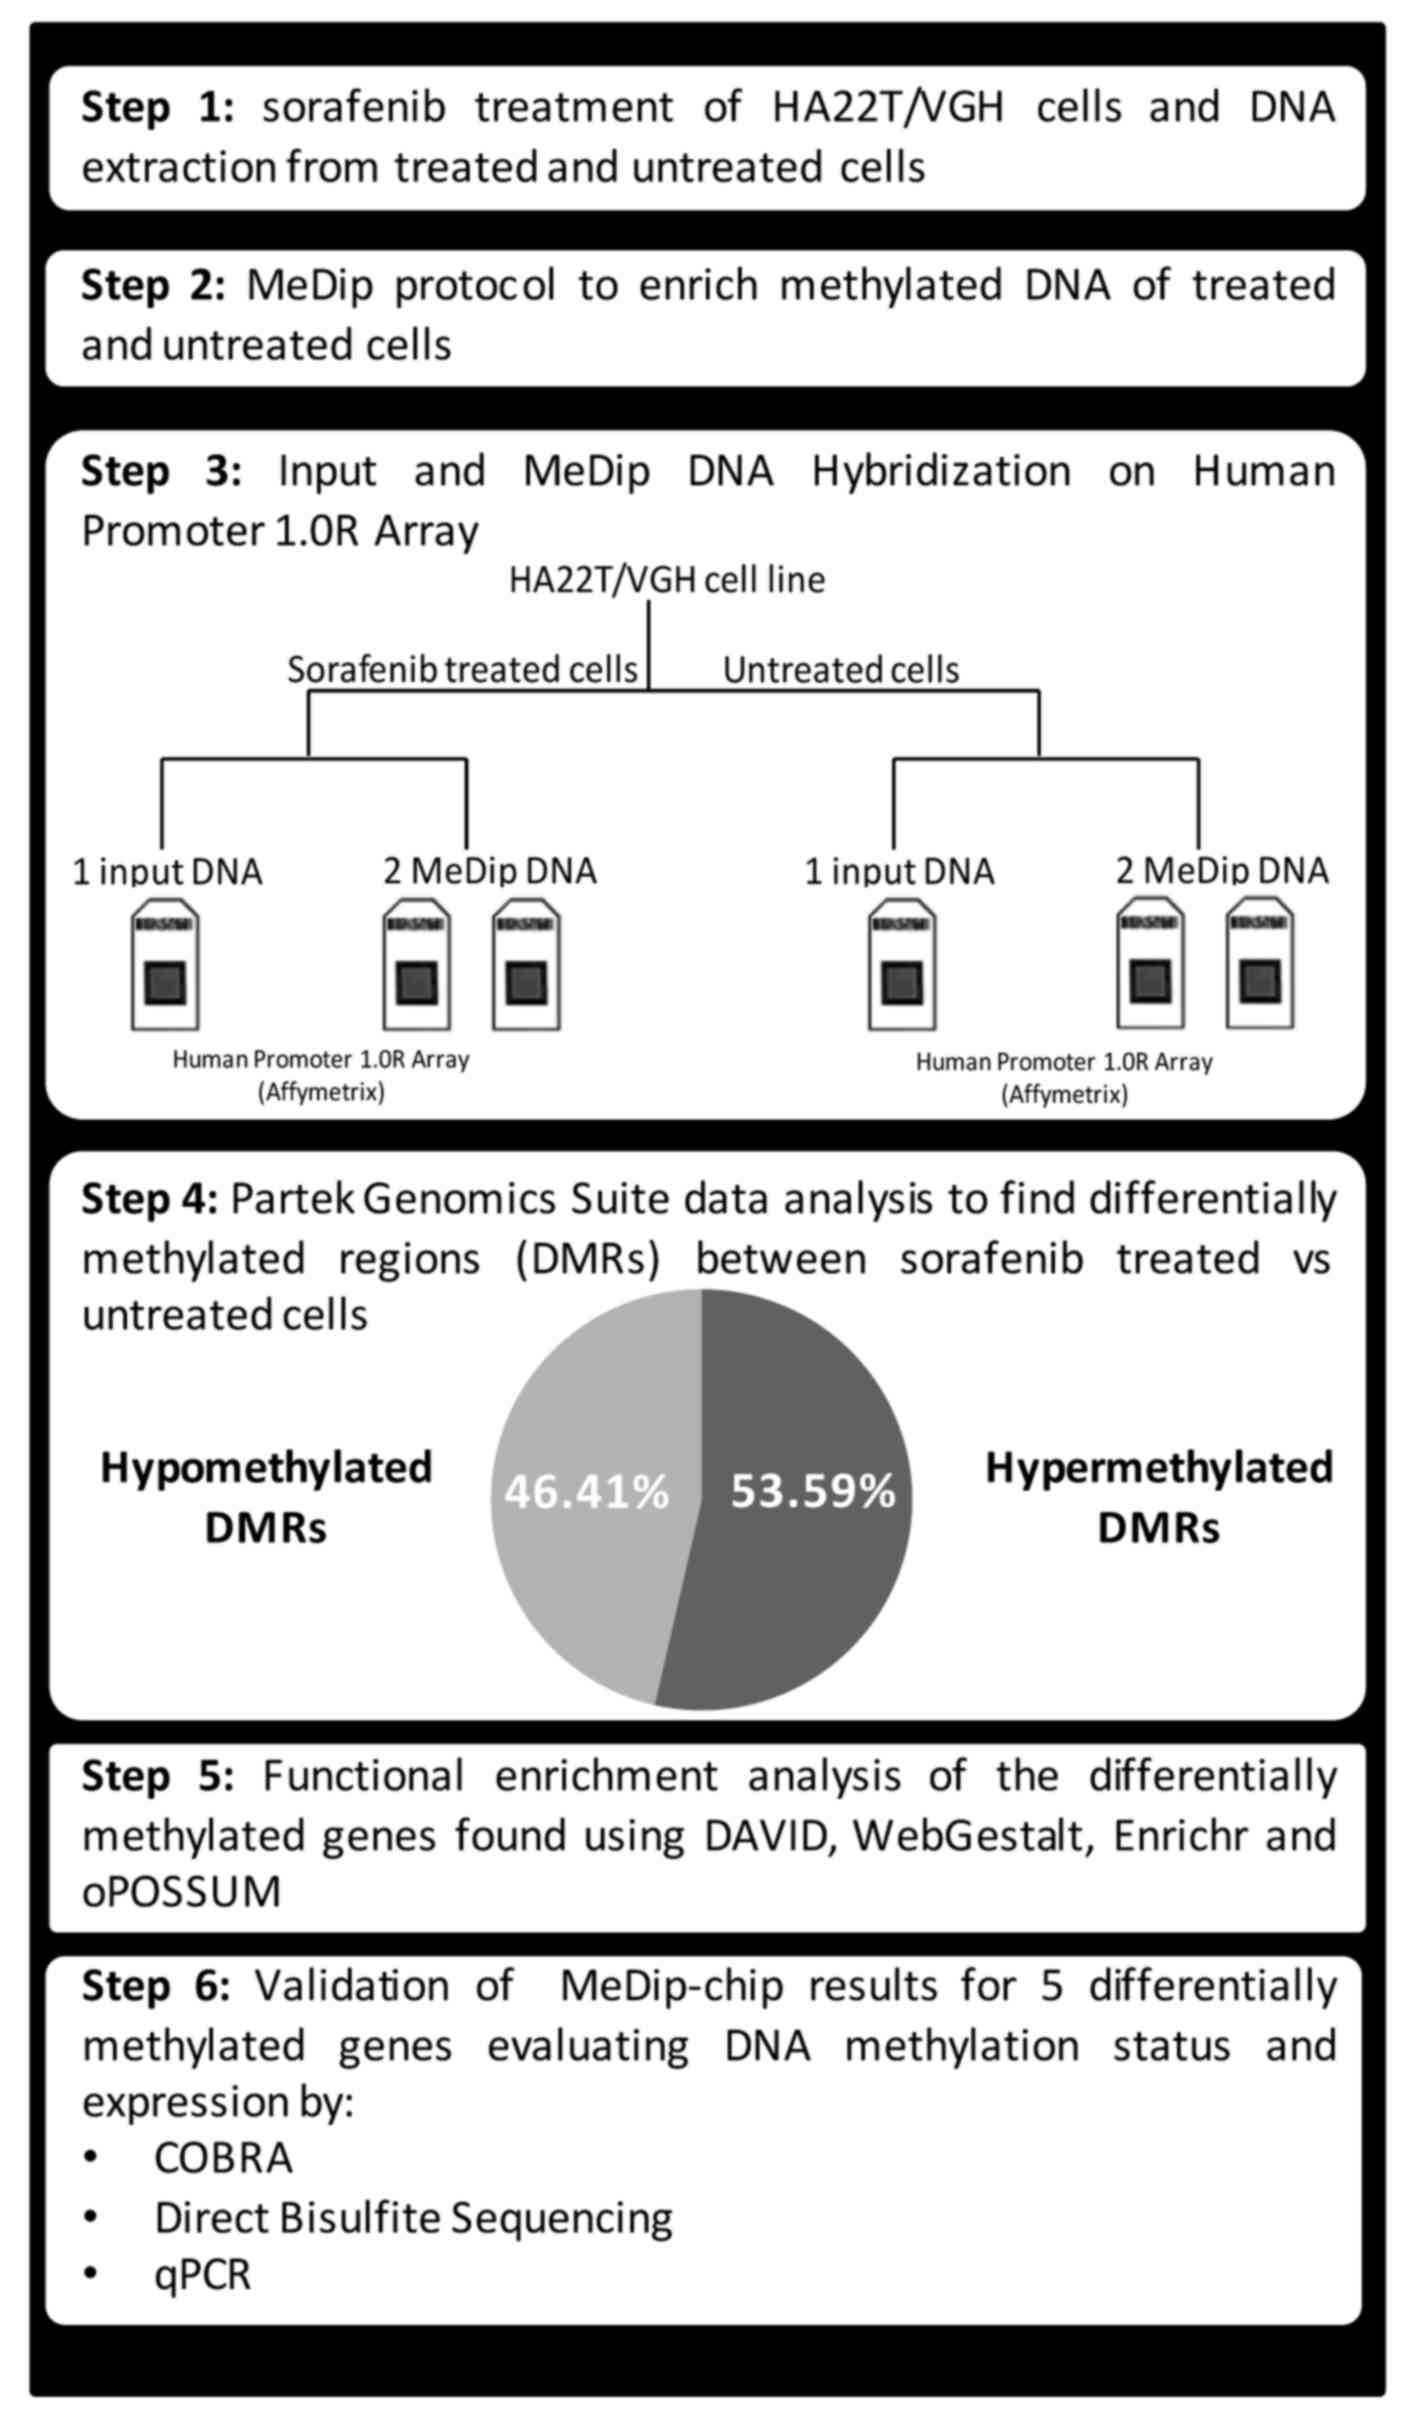
on DNA methylation profile in HCC cells treated with sorafenib. In
particular, we used MeDip-chip technology to profile the DNA
methylation variation in HA22T/VGH cells treated with sorafenib
compared to untreated cells. The genes found differentially
methylated by bioinformatics tools were then subjected to
functional enrichment analysis and we found an enrichment of many
gene ontology terms and molecular signalling pathways likely
promoted by sorafenib treatment. Finally, we validated MeDip-chip
results for several genes using both COBRA assay and direct
bisulfite sequencing and then we evaluated their mRNA expression
(Fig. 1).
Materials and methods
Cell culture, sorafenib treatment and DNA
and RNA extraction
HA22T⁄VGH undifferentiated cells, kindly provided by
N. D'Alessandro (University of Palermo, Palermo, Italy), were
maintained in RPMI-1640 (Life Technologies) supplemented with 10%
fetal bovine serum at 37°C in a 5% CO2 incubator.
SKHep1Clone3 (SKHep1C3), selected from human HCC-derived cells
(SKHep1: ATCC HTB-52), was maintained in Earle's MEM (Life
Technologies) supplemented with 10% fetal bovine serum (Life
Technologies) at 37°C in a 5% CO2 incubator. Sorafenib
(Nexavar®, BAY43-9006) was synthesized at Bayer
Corporation and was dissolved in 100% DMSO (Sigma-Aldrich) and
diluted in RPMI-1640 (Life Technologies) to the required
concentration with a final DMSO concentration of 0.1%. Cells were
cultured in 10 cm Ø plates up to almost confluence and were treated
with sorafenib (5 µM) or solvent (0.1% DMSO) for 24 h.
Genomic DNA and total RNA were extracted from treated and untreated
cells using Wizard Genomic DNA purification kit (Promega) and
TRIzol reagent (Life Technologies), respectively, according to the
manufacturer's instructions, and the nucleic acid quantifications
were performed using NanoDrop (Thermo Fisher Scientific).
MeDip-chip
The global DNA methylation profiles of cells treated
with sorafenib or left untreated were obtained by methylated DNA
immunoprecipitation coupled with Affymetrix Human Promoter 1.0R
Tiling Arrays (MeDip-chip) using a modification of the Affymetrix
chromatin immunoprecipitation assay protocol. Genomic DNA from
sorafenib treated and untreated cells was fragmented using
micrococcal nuclease (New England Biolabs) to obtain DNA fragments
ranging from 200 to 500 nucleotides and used them as input (IN)
DNA. Agilent Bioanalyzer with the RNA 6000 Nano LabChip kit was
used to check the size of fragmented DNA. Part of IN DNA (4
µg) was immunoprecipitated (IP) with 10 µl of
anti-5-methylcytosine Antibody (Eurogentec, BI-MECY-0100) using the
MeDip protocol (13), with minor
modifications. The antibody-DNA complexes were immunoprecipitated
using Dynabeads® Protein G immunoprecipitation kit (Life
Technologies) and the methylated enriched DNA was purified by
standard phenol/chloroform procedure and precipitated with
isopropanol. The MeDip was performed in duplicate for each DNA
sample starting with initial fragmentation step. A total of 200 ng
of IN and IP DNA was amplified with the Affymetrix Chromatin
Immunoprecipitation Assay Protocol. Hybridization on Human Promoter
1.0R array was performed using the reagents contained in
GeneChip® Hybridization, Wash, and Stain kit
(Affymetrix) using GeneChip hybridization oven 640 (Affymetrix).
Array washing and staining was performed with the use of the
Fluidics Station 450 (Affymetrix). Arrays were scanned with the
GeneChip Scanner 3000 7G (Affymetrix) and raw data were extracted
with GeneChip Operating System (GCOS) software from Affymetrix. In
total 3 arrays per each cellular condition (2 IP DNA and 1 IN DNA)
were performed. IP and IN DNA data have been deposited in the
National Center for Biotechnology Information (NCBI) Gene 97
Expression Omnibus (GEO) data repository, and are accessible
(GSE72257).
Data analysis
The raw data were imported into Partek Genomics
Suite (PGS) software version 6.6, normalized with the RMA algorithm
and converted to log2 values. Hierarchical clustering and principal
component analysis were performed on the raw data to assess the
quality and reproducibility of the sample. For each cellular
condition, the two IP CEL files were normalized through subtraction
of log2 IN signal intensity of each of 4.6 million array probes to
log2 IP signal. The differences between sorafenib-treated and
untreated cells were analyzed using ANOVA. Significant
differentially methylated regions (DMR) were obtained using the MAT
algorithm (model-based analysis of tiling arrays algorithm)
(14) with the following
parameters: P-value threshold <0.001, sliding window = 2,000 bp,
minimum number of probes in a region = 10. DMR with a positive or
negative MAT score were considered hypermethylated or
hypomethylated, respectively, in sorafenib-treated cells compared
to untreated cells. Using PGS function, each DMR was associated to
its nearest gene of the human genome. The genomic coordinates of
each DMR were calculated based on UCSC human genomic assembly
version 18. The ratio between CpG observed and CpG expected for
each DMR was calculated using the following formula:
Observed/expected CpG = number of CpG x (DMR length) / (number of C
x number of G). In order to study the effect of DNA methylation
changes on promoters and gene bodies only DMR between −5,000 bp
from TSS and +5,000 bp from the end of the annotated gene were
included for the next analyses. For functional enrichment analysis
of gene ontology terms and molecular signaling pathway the
following tools were used: DAVID (https://david.ncifcrf.gov/), WebGestalt (http://bioinfo.vanderbilt.edu/webgestalt/), Enrichr
(http://amp.pharm.mssm.edu/Enrichr/)
and oPOSSUM 3.0 (http://opossum.cisreg.ca/oPOSSUM3/). A more stringent
cut-off (P-value <0.0008) associated to DMR was applied to
remove non-relevant genes and reduced the list of DMR and
corresponding genes used for performing the following functional
enrichment analyses.
COBRA and direct bisulfite sequencing
quantification of CpG methylation
In order to validate the DNA methylation status in a
set of genomic regions detected as hypermethylated (positive MAT
score) or hypomethylated (negative MAT score) by the MeDip-chip
profiling we performed combined bisulfite restriction analysis
(COBRA) and direct bisulfite sequencing for quantitative DNA
methylation analysis, and using the original DNA samples for
sorafenib treated and untreated cells that were used in the
MeDip-chip experiment. The gene specific bisulfite primers were
designed to overlap five MAT detected DMR using the MethPrimer
Software (BIRC3: forward, 5′-TTAGTTTGTTTGGTTGTGAAGAGAA-3′, reverse,
5′-ACTCCCTAACCCATACCCTATACAC-3′; FOXO3 forward,
5′-GGGTTGTTTTTTGAGGATT-3′, reverse, 5′-ACCAACCCCTTACCCTAAA-3′;
MAPK3 forward, 5′-TTAGTTTTTTAG GAGGTTAAGGTGG-3′, reverse,
5′-CCACAAACTATAAACAAAAAATCTCC-3′; SMAD2 forward,
5′-GGGGTTTGTAGGGGTTTGT-3′, reverse, 5′-TCCCAACCATTAAAAAACATC-3′;
TSC2 forward, 5′-GTTTTTGTGTTATGATTTTGGGAA-3′, reverse,
5′-ACATCCATCCACTACAAAACAAAAT-3′). Bisulfite treatment of genomic
DNA was performed using EZ DNA Methylation kit (Zymo Research). For
COBRA analysis the restriction enzymes TaqI and
HpyCH4IV (New England Biolabs) were used to examine the
methylation status of the amplified regions. In brief, 100–150 ng
of the amplified products were digested with the restriction
enzymes, which digest methylated DNA but not unmethylated DNA. The
digested DNA was electrophoresed on 3% agarose gels in 1X TBE, and
visualized by ethidium bromide staining. We used a UV image
analyzer to quantify the integrated optical density (IOD) of the
bands. Methylation level (%) for a specific cytosine was defined as
the sum of the IOD of the shifted bands divided by the IOD of all
bands in each lane. All experiments were repeated twice to assess
the reproducibility of results.
For direct bisulfite sequencing analysis the
amplified products obtained previously were purified and sequenced
on an Applied Biosystems 3130xl Genetic Analyzer. The sequencing
reactions were performed using Bigdye Terminator v1.1 Cycle
Sequencing kit (Life Technologies) and purified with Performa Ultra
96-Well Plate (EdgeBio, Gaithersburg, MD, USA). The abi files were
analyzed with Accelrys DS Gene 1.5 (Accelrys). Since bisulfite
treatment does not convert methylated cytosine to uracil, the
cytosine chromatogram peaks at each CpG location will correspond to
the degree of methylation at that site within a given sample.
Likewise, the thymine chromatogram peaks will correspond to the
degree of cytosines that were not methylated. Furthermore, the
relative size of these peaks will be proportionally related to the
total percentage of cytosine bases that were methylated. Therefore,
according to Parrish et al (15), methylation levels for each CpG site
within the DNA amplicon can be quantified by measuring the ratio
between peak height values of cytosine (C) and thymine (T),
yielding the basic equation for the methylation percentage to be
[C/(C+T) ×100]. If the reverse primer was used, the guanine (G) and
adenine (A) peak heights should be used instead, yielding the
equation [G/(G+A) ×100]. Each amplicon was sequenced in triplicate
to assess the reproducibility of results.
RT-qPCR expression analysis
In order to investigate the relationship between DNA
methylation changes and gene expression in sorafenib-treated and
untreated cells (HA22T/VGH and SKHep1C3), RT-qPCR was performed to
determine the gene expression of several genes whose DNA
methylation status was validated previously with COBRA and direct
bisulfite sequencing. An amount of 1 µg of total RNA was
retrotranscribed using M-MLV-RT enzyme (Life Technologies) and
pre-designed primers used for qPCR validation were purchased from
Bio-Rad (Hercules, CA, USA). GoTaq qPCR Master Mix was supplied by
Promega.
The mRNA expression of BIRC3, FOXO3, MAPK3, SMAD2
and TSC2 genes was evaluated by qPCR using PrimePCR™
SYBR® Green Assay (Bio-Rad, BIRC3: qHsaCID0013381;
FOXO3: qHsaCID0023235; MAPK3: qHsaCID0010939; SMAD2:
qHsaCID0022031; TSC2: qHsaCID0018594; YWHAZ: qHsaCID0013897). The
relative quantification of the expression in sorafenib-treated HCC
cells compared to untreated cells was based on ΔΔCt method. YWHAZ
was used as housekeeping gene and untreated cells were used as a
reference sample. We chose YWHAZ because it has been shown to have
a constant expression during the process of apoptosis in tumor cell
lines (16). qPCR experiment was
performed twice. For each qPCR reaction, we used 20 ng of cDNA.
Each gene in the two cellular conditions was assayed in triplicate.
After qPCR reaction, denaturation curve was performed to ensure the
specificity of the primers.
Results
Detection of global DNA methylation
changes in HCC sorafenib-treated cells by using Human Promoter
array technology
We previously demonstrated that HA22T/VGH cells were
sensitive to sorafenib (11). To
assess whether these undifferentiated HCC cells treated with
sorafenib displayed genome wide changes in DNA methylation, we
performed methylated DNA immunoprecipitation (MeDip) followed by
hybridization on tiling array. We used MeDip in combination with
Human Promoter 1.0 Tiling array platform to identify changes of
hypo- and hypermethylation with greater sensitivity in HA22T/VGH
cells treated with sorafenib in comparison to cells treated with
vehicle (DMSO) only.
We detected the differentially methylated regions
(DMR) in HA22T/VGH treated with sorafenib using untreated cells as
baseline. Significant DMR were obtained by PGS using ANOVA and MAT
algorithm with specific parameters (see Materials and methods). We
considered only DMR between −5,000 bp from the TSS and +5,000 bp
from the end of the coding DNA sequence (CDS) of the genes. From
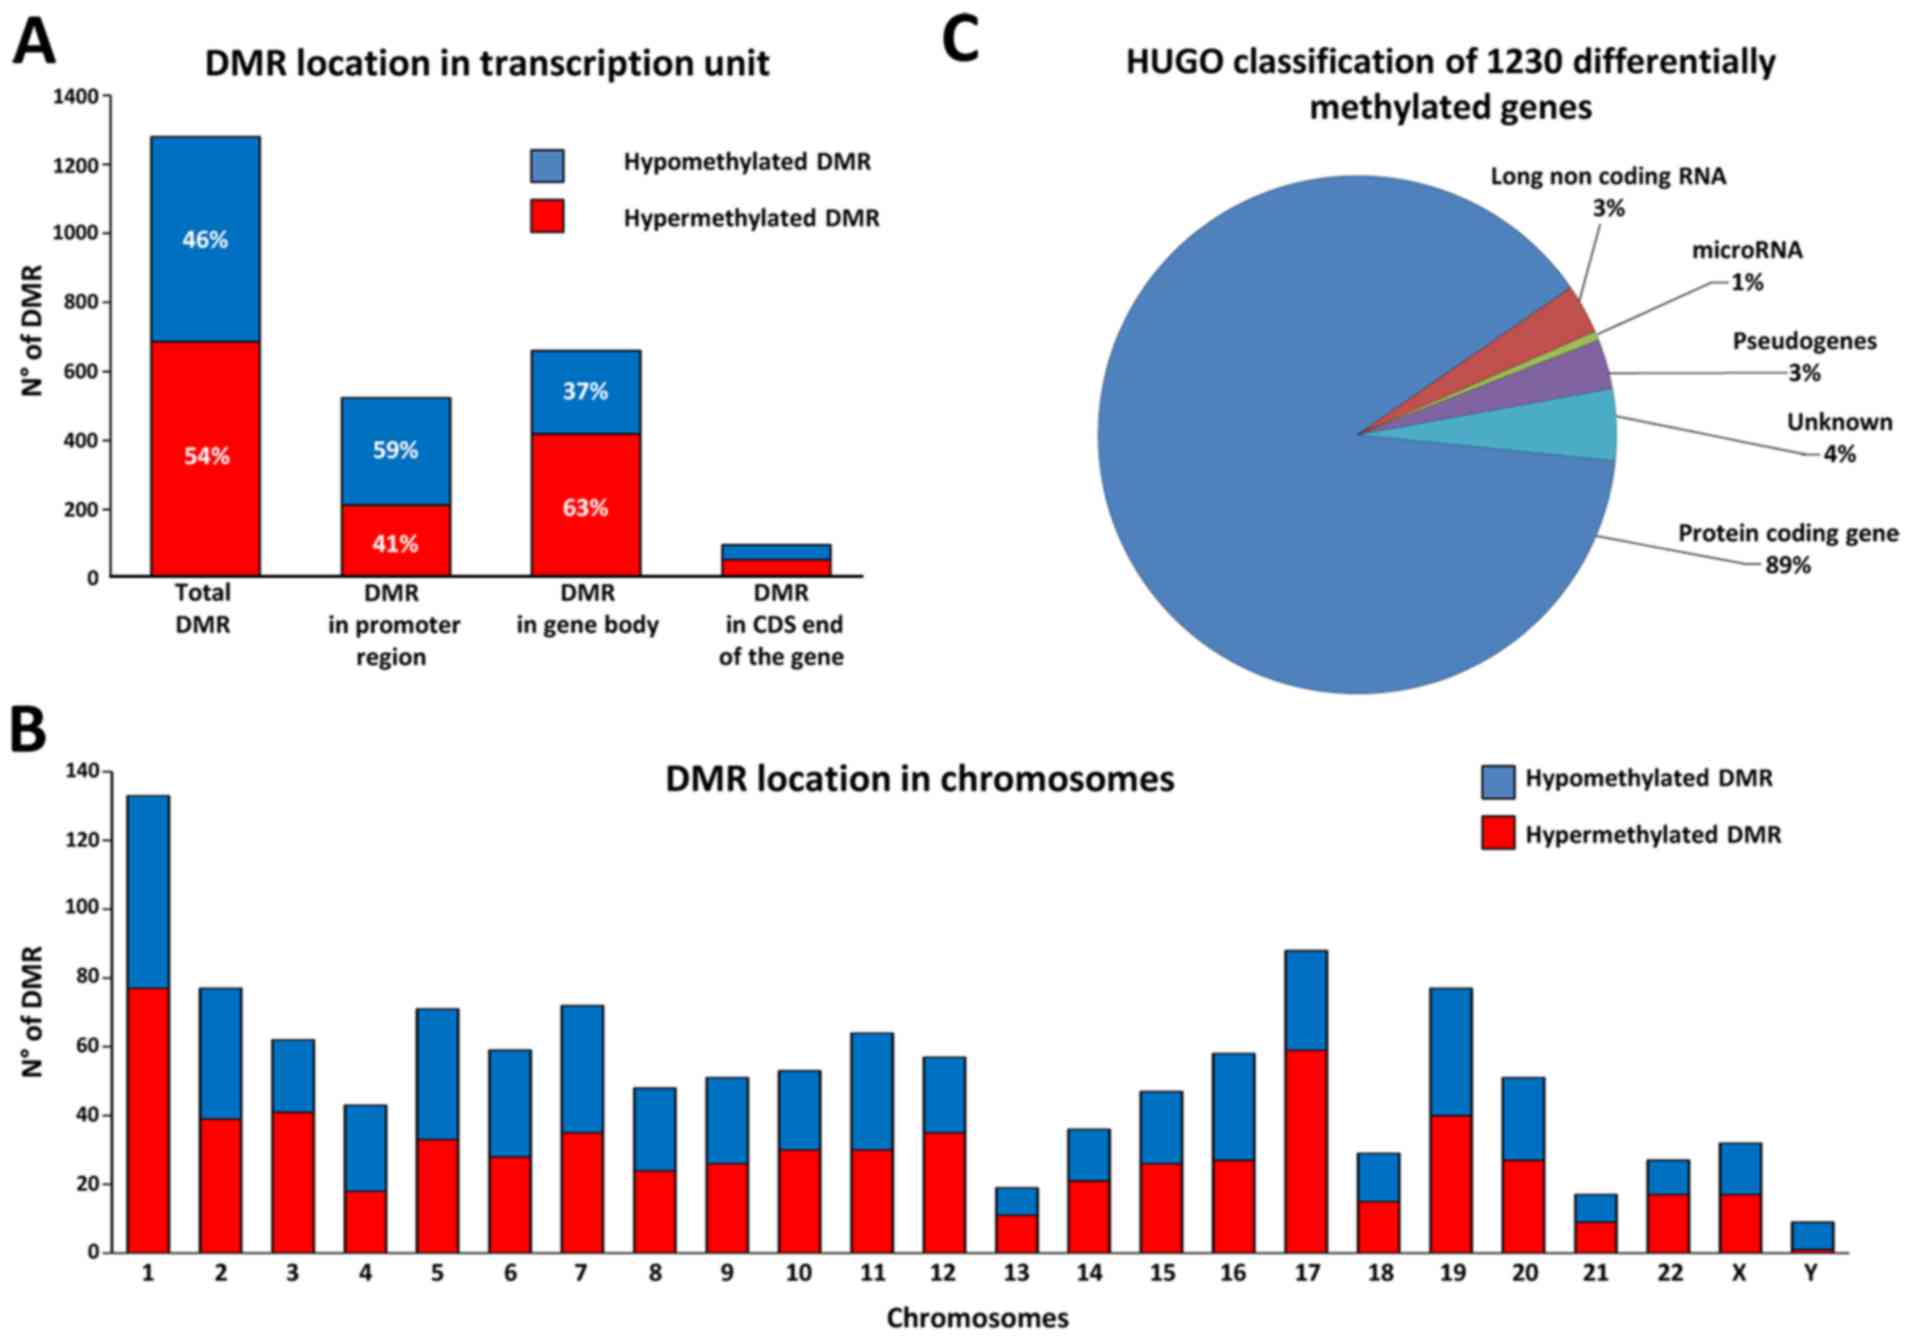
the comparison, we obtained 1,280 DMR corresponding to 1,230
distinct annotated genes, with 46.4% of hypomethylated DMR and
53.6% of hypermethylated DMR (Fig.
2A). To have a general view of the post-sorafenib genomic
landscape we considered the distribution of DMR respect to TSS and
CpG density, and the frequency of DMR in the different
chromosomes.
Considering the position of DMR regarding TSS we
found 40.9% of DMR localized in promoter region, 51.6% in gene body
and 7.6% in CDS end of the gene. In particular, DMR in promoter
regions presented more hypomethylated DMR, whereas DMR in gene
bodies presented the opposite trend with more hypermethylated DMR
(Fig. 2A). Calculating the CpG
density for each DMR with the observed to expected CpG ratio
(obs/exp CpG) formula we found that 22.8% of DMR have an obs/exp
CpG >60%, 28.4% of DMR an obs/exp CpG between 60–30%, and 48.8%
of DMR with an obs/exp CpG <30% (Table I). In particular, we found that the
DMR with an obs/exp CpG >60% were almost exclusively subjected
to a hypomethylation phenomenon, whereas the DMR with an obs/exp
CpG <30% were preferentially subjected to a hypermethylation
phenomenon. This trend was repeated regardless whether the DMR was
in the promoter region, in the gene body or in the CDS end of the
gene (Table I). Then, observing
the frequency of distribution in the different chromosomes, we
found that the 1,280 DMR were distributed quite uniformly along the
24 chromosomes according with their gene density (Fig. 2B). However, some chromosomes showed
more hypermethylated DMR (chr 1, chr 12, chr 17 and chr 22) whereas
others showed more hypomethylated DMR (chr 4 and chr Y). Finally,
to have a general view of the gene classes involved we catalogued
the 1,230 differentially methylated genes by using the online
repository of HGNC (HUGO gene nomenclature committee), and we found
that the majority of DMR were close to a protein coding gene
(Fig. 2C).
 | Table IDistribution of the 1,280 DMR based
on CpG density. |
Table I
Distribution of the 1,280 DMR based
on CpG density.
| DMR | Observed to
expected CpG ratio (Obs/Exp CpG)a | No. of DMR | Hypermethylated DMR
(%) | Hypomethylated DMR
(%) |
|---|
| Total DMR | Obs/Exp CpG
≥60% | 292 | 2.7 | 97.3 |
| 60% < Obs/Exp
CpG <30% | 364 | 55.5 | 44.5 |
| Obs/Exp CpG
≤30% | 624 | 76.3 | 23.7 |
| DMR in promoter
region | Obs/Exp CpG
≥60% | 215 | 1.9 | 98.1 |
| 60% < Obs/Exp
CpG <30% | 114 | 50.9 | 49.1 |
| Obs/Exp CpG
≤30% | 194 | 77.8 | 22.2 |
| DMR in gene
body | Obs/Exp CpG
≥60% | 60 | 6.7 | 93.3 |
| 60% < Obs/Exp
CpG <30% | 223 | 58.7 | 41.3 |
| Obs/Exp CpG
≤30% | 377 | 75.3 | 24.7 |
| DMR in CDS end of
the gene | Obs/Exp CpG
≥60% | 17 | 0 | 100 |
| 60% < Obs/Exp
CpG <30% | 27 | 48.1 | 51.9 |
| Obs/Exp CpG
≤30% | 53 | 77.4 | 22.6 |
Functional enrichment analysis of the
1,230 genes found differentially methylated in the
sorafenib-treated cells
In order to assign a biological meaning to the 1,230
genes found differentially methylated in sorafenib-treated cells
compared to untreated cells in MeDip-chip analysis, we conducted a
functional enrichment analysis using different online tools.
DAVID identified 18 enriched annotation terms
associated to our gene list. In particular, five BIOCARTA signaling
pathways were related to receptor tyrosine kinase (RTK) signal
transduction (Table II). Of note
were the changes in DNA methylation in the genes of these pathways.
For example, among the 10 genes found differentially methylated in
the EGF pathway, 7 oncogenes (OG) were hypermethylated and 2 tumor
suppressor genes (TSG) were hypomethylated (Table III). This occurred in a similar
way also in the other 4 pathways. The results of this analysis may
indicate that sorafenib modified the level of DNA methylation of
HA22T/VGH cells in key genes of RTK signal transduction pathways on
which sorafenib acts directly.
| Table IIMolecular signaling pathways found
enriched by DAVID. |
Table II
Molecular signaling pathways found
enriched by DAVID.
| Category | Term | Count | P-value | Adjusted P-value
Benjamini | Genes |
|---|
| BIOCARTA | EGF signaling
pathway | 10 | 1.02E-05 | 2.06E-03 | CSNK2A3, FOS,
HRAS, JAK1, MAPK3, MAPK8, PIK3CA, SHC1, STAT3,
STAT5A |
| BIOCARTA | PDGF signaling
pathway | 9 | 4.57E-05 | 4.58E-03 | CSNK2A3, FOS,
HRAS, JAK1, MAPK3, MAPK8, SHC1, STAT3,
STAT5A |
| BIOCARTA | IL 2 signaling
pathway | 8 | 1.42E-04 | 9.49E-03 | CSNK2A3, FOS,
HRAS, JAK1, MAPK3, MAPK8, SHC1, STAT5A |
| BIOCARTA | EPO signaling
pathway | 7 | 4.44E-04 | 2.21E-02 | CSNK2A3, FOS,
HRAS, MAPK3, MAPK8, SHC1, STAT5A |
| BIOCARTA | TPO signaling
pathway | 7 | 8.39E-04 | 3.32E-02 | CSNK2A3, FOS,
HRAS, MAPK3, MAPK8, SHC1, STAT5A |
| Table IIIGenes of EGF signaling pathway found
differently methylated. |
Table III
Genes of EGF signaling pathway found
differently methylated.
| Gene | MAT score | OG/TSG |
|---|
| HRAS | −9.91 | OG |
| MAPK8 (JNK1) | −9.62 | TSG |
| SHC1 | −9.34 | TSG/OG |
| STAT3 | 9.84 | OG |
| STAT5A | 9.94 | OG |
| FOS | 10.04 | OG |
| JAK1 | 10.18 | OG |
| PIK3CA | 10.32 | OG |
| CSNK2A3 | 11.02 | – |
| MAPK3 (ERK) | 12.42 | OG |
Gene ontology analysis performed by WebGestalt found
16 terms significantly enriched. In particular, the following 3
terms had a lower level of abstraction and were more specific:
'Sequence-specific DNA binding RNA polymerase II transcription
factor activity', 'Structure-specific DNA binding' and
'Double-stranded DNA binding'. The first term was related to
transcription factors that bind the RNA polymerase II (29 genes).
The second and third term (son of the second term) are related to
transcription factors that bind directly to DNA (24 and 20 genes,
respectively). Among these genes, we found several transcription
factors relevant in tumorigenesis and/or cancer progression such as
FOXO3, STAT3 and STAT5A that displayed a change in DNA methylation
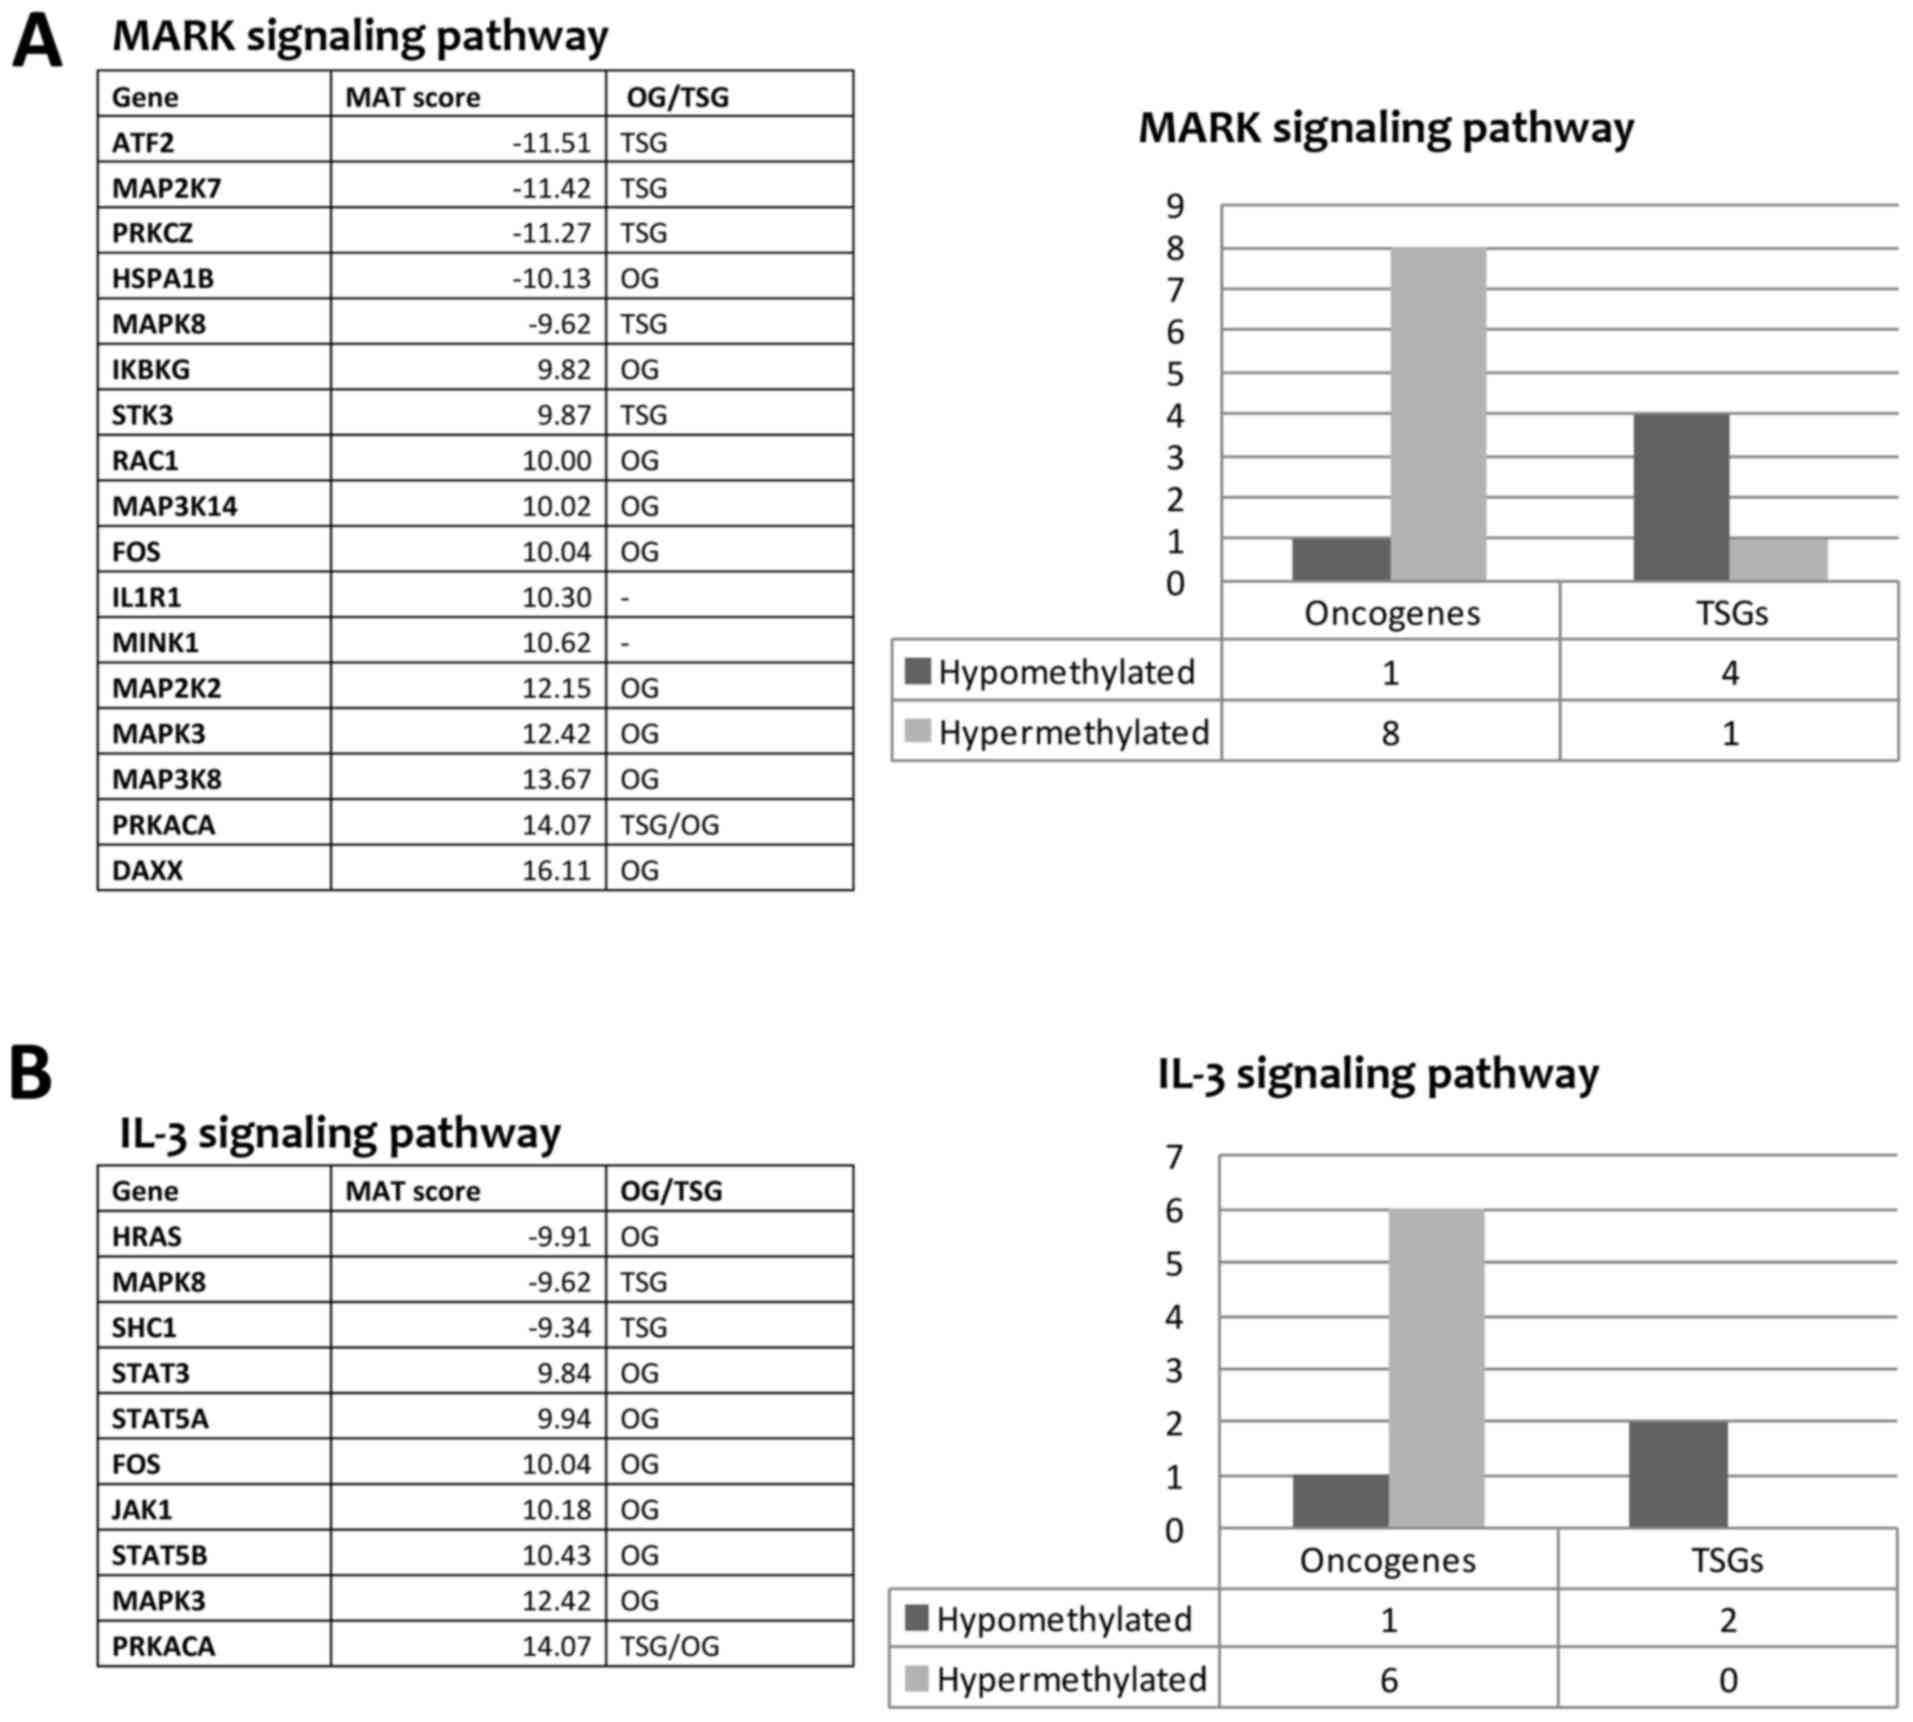
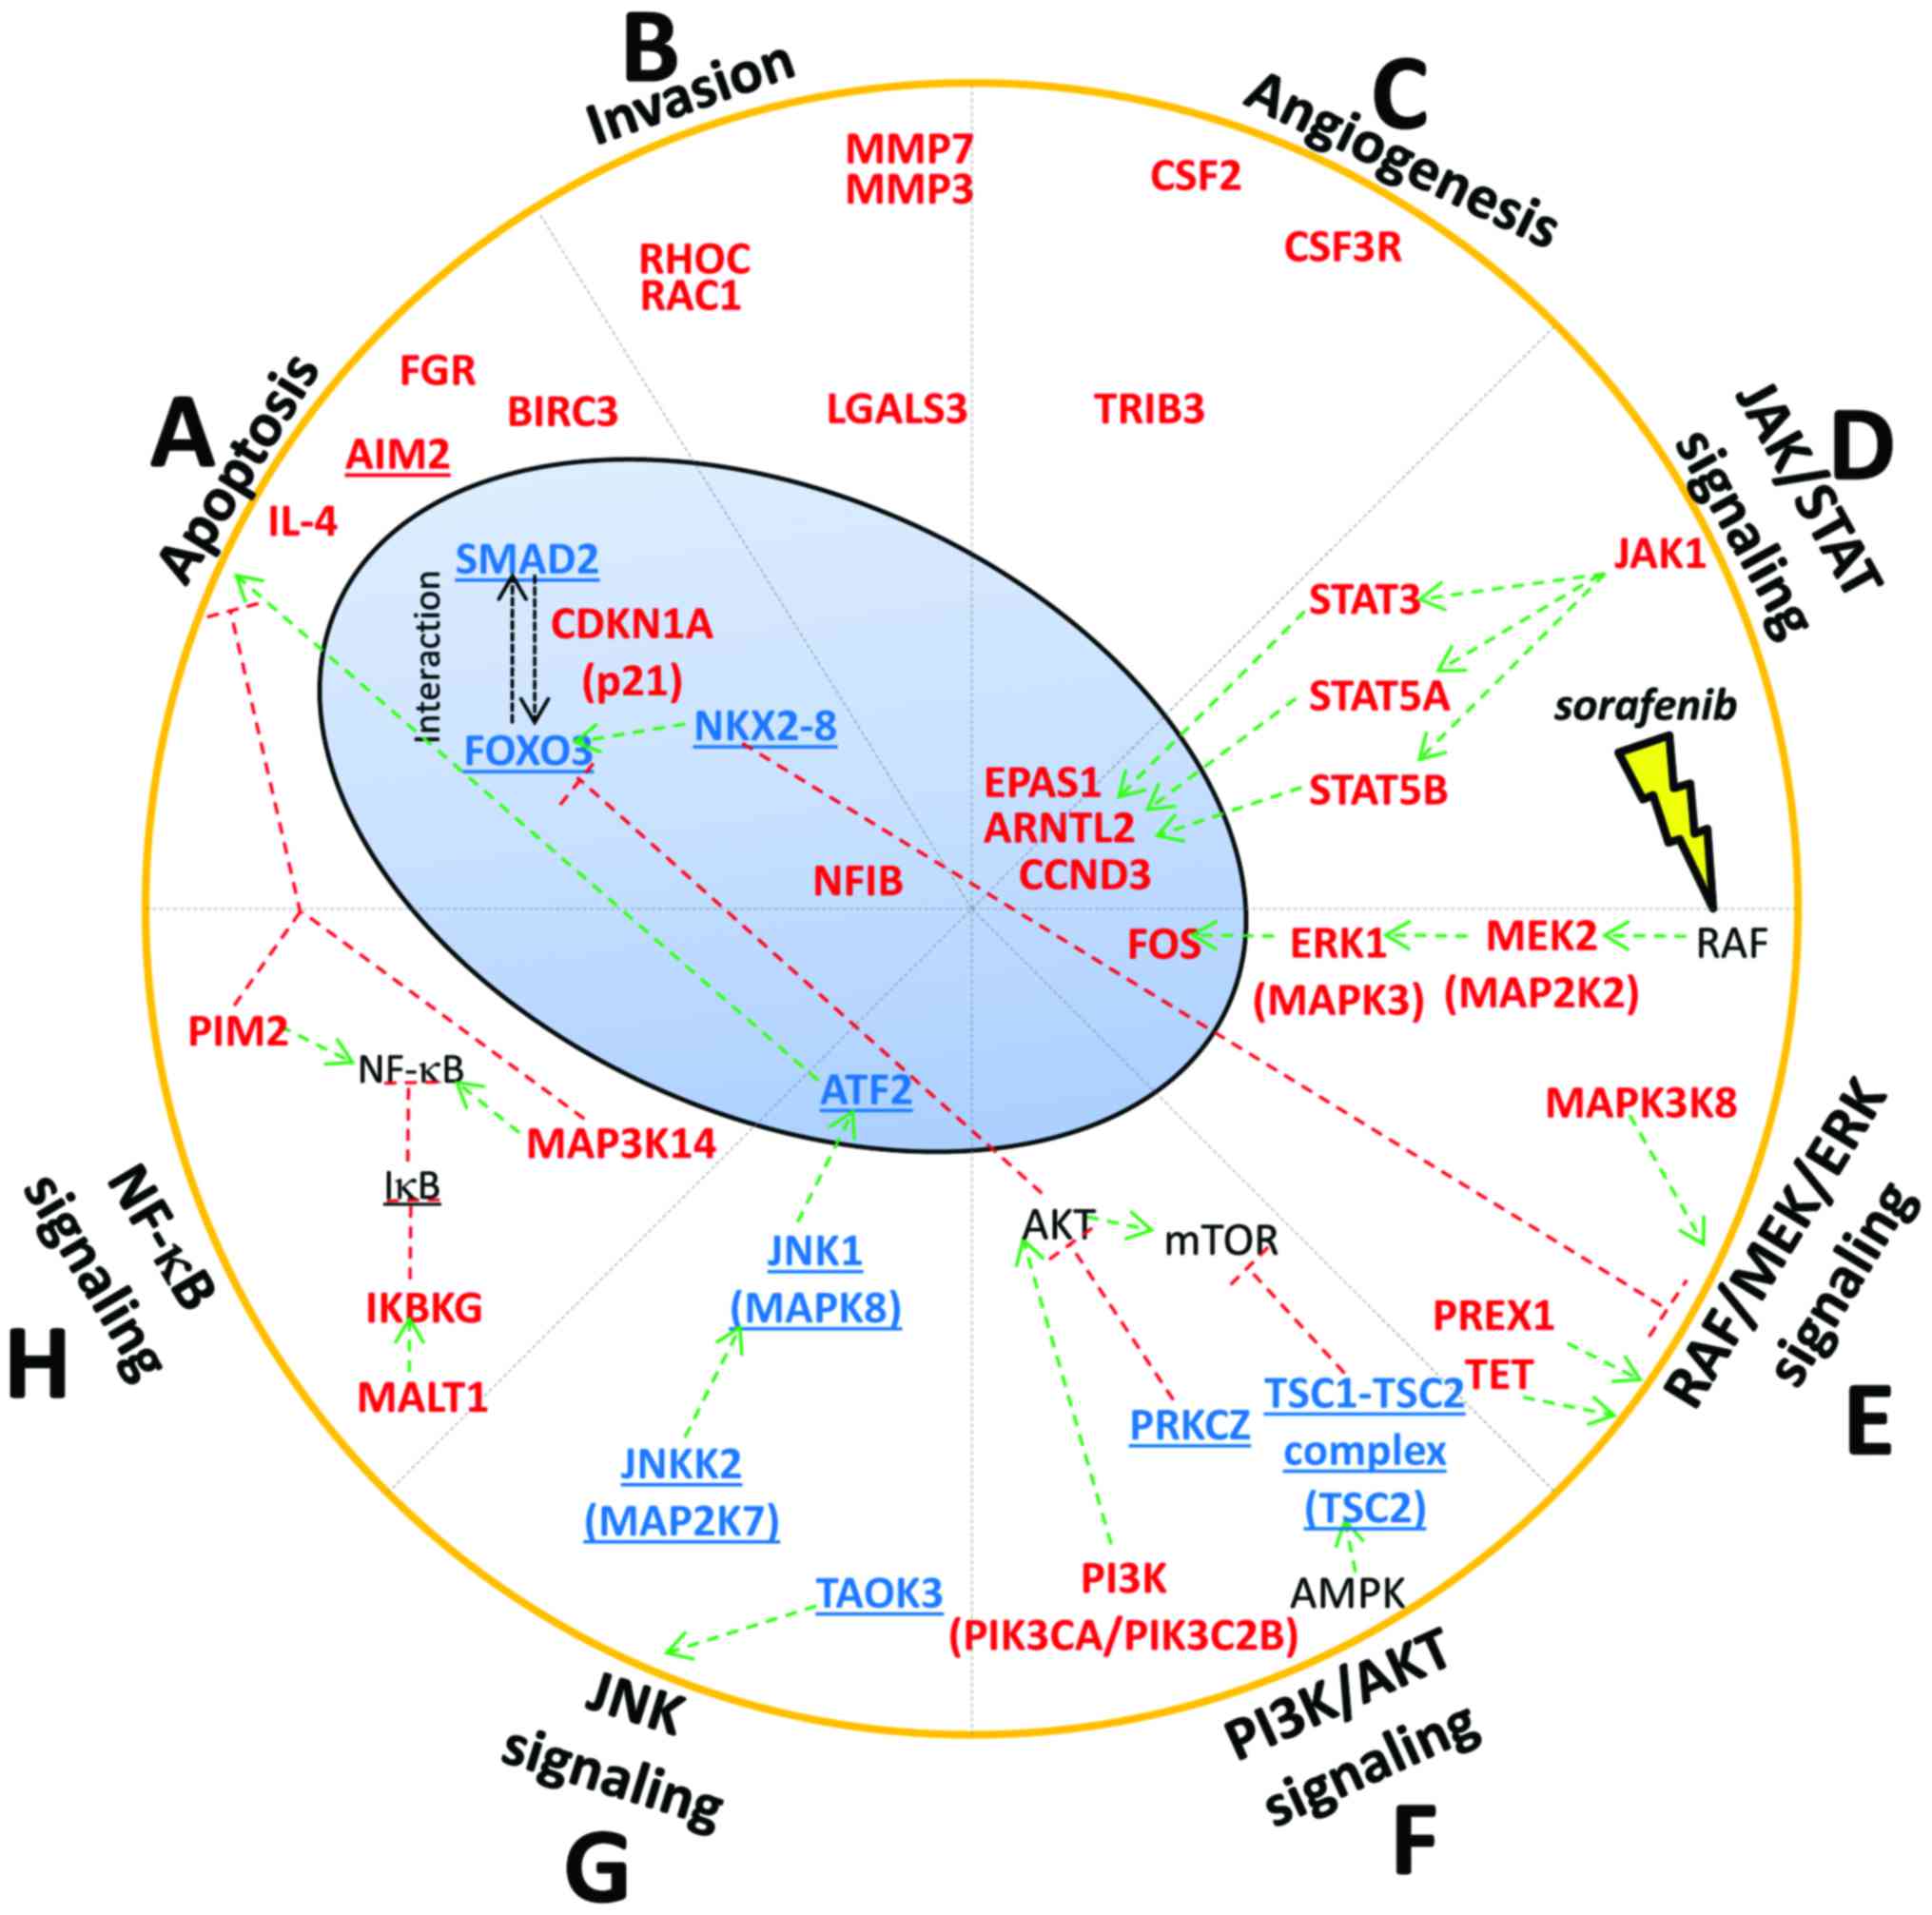
level following sorafenib treatment. Pathway analysis performed by
WebGestalt found 10 Wikipathways in our list of genes (Table IV). The genes that occur most
often in these pathways were ATF2, CDKN1A, FOS, FOXO3, HRAS, IKBKG,
JAK1, MAP2K2, MAP2K7, MAP3K14, MAP3K8, MAPK3, MAPK8, PIK3CA, PRKCZ,
RAC1, SHC1, SHC2, STAT3, STAT5A, and STAT5B. In the literature,
there is evidence that these genes have a role in tumorigenesis
and/or cancer progression. We found a strong tendency of OG to be
hypermethylated and TSG to be hypomethylated after sorafenib
treatment (Fig. 3). This may
indicate that sorafenib could trigger the hypermethylation of
several OG and the hypomethylation of other TSG as downstream
effect. In addition, the pathway analysis revealed that many genes
belonging to MAPK cascade and JAK-STAT signaling pathway (IL-2/3/5
signaling pathways), known to be involved in sorafenib mechanism of
action, had a change in the level of methylation after sorafenib
treatment (Fig. 3). The MAPK
signaling pathway showed a MEK gene (MAP2K2) and an ERK gene
(MAPK3) hypermethylated after sorafenib treatment. In contrast,
genes belonging to the JNK signaling pathway (MAP2K7, MAPK8) were
hypomethylated indicating a possible activation of this pathway
(Fig. 3A). Regarding the JAK-STAT
pathway, the genes JAK1, STAT3, STAT5A and STAT5B were
hypermethylated with probable inhibition of this pathway (Fig. 3B).
| Table IVMolecular signaling pathways found
enriched by WebGestalt tool. |
Table IV
Molecular signaling pathways found
enriched by WebGestalt tool.
| Category | Molecular signaling
pathway | Genes count | Raw P-value | Adjusted
P-value | Genes |
|---|
| Wikipathway | Insulin signaling
pathway | 20 | 4.65E-08 | 6.88E-06 | FOS, FOXO3,
GRB10, HRAS, MAP2K2, MAP2K7, MAP3K14, MAP3K8, MAPK3,
MAPK8, MINK1, PIK3CA, PRKAA2, PRKCZ, RAC1, RPS6KA4,
SHC1, SHC2, TRIB3, TSC2 |
| Wikipathway | Kit receptor
signaling pathway | 12 | 3.16E-07 | 1.65E-05 | FOS, FOXO3,
GRB10, HRAS, MAP2K2, MAPK3, MAPK8, SHC1,
STAT3, STAT5A, STAT5B |
| Wikipathway | Prolactin signaling
pathway | 14 | 3.35E-07 | 1.65E-05 | FOS, HRAS,
JAK1, MAP2K2, MAPK3, MAPK8, PIK3CA, RAC1, SHC1,
STAT3, STAT5A, STAT5B, TEC, ZAP70 |
| Wikipathway | AGE-RAGE
pathway | 12 | 1.53E-06 | 5.66E-05 | ATF2,
LGALS3, MAPK3, MAPK8, MMP7, PRKCZ, RAC1, SHC1,
SMAD2, STAT3, STAT5A, STAT5B |
| Wikipathway | IL-2 signaling
pathway | 10 | 2.13E-06 | 6.29E-05 | FOS, FOXO3,
HRAS, JAK1, MAP2K2, MAPK3, SHC1, STAT3, STAT5A,
STAT5B |
| Wikipathway | IL-3 signaling
pathway | 10 | 2.55E-06 | 6.29E-05 | FOS, HRAS,
JAK1, MAPK3, MAPK8, PRKACA, SHC1, STAT3, STAT5A,
STAT5B |
| Wikipathway | MAPK signaling
pathway | 17 | 5.33E-06 | 0.0001 | ATF2, DAXX,
FOS, HSPA1B, IKBKG, IL1R1, MAP2K2, MAP2K7, MAP3K14,
MAP3K8, MAPK3, MAPK8, MINK1, PRKACA, PRKCZ, RAC1,
STK3 |
| Wikipathway | IL-5 signaling
pathway | 9 | 6.07E-06 | 0.0001 | FOXO3, FOS,
JAK1, MAP2K2, MAPK3, SHC1, STAT3, STAT5A, STAT5B |
| Wikipathway | AMPK signaling
pathway | 10 | 1.65E-05 | 0.0002 | TSC2, CAB39,
CDKN1A, CPT1A, FASN, PFKFB3, PIK3CA, PLCB1, PRKAA2,
PRKACG |
| Wikipathway | TCR signaling
pathway | 13 | 1.03E-05 | 0.0002 | ATF2, FOS,
HRAS, IKBKG, IRF4, MALT1, MAP2K2, MAP3K14, MAP3K8,
MAPK3, MAPK8, SHC1, ZAP70 |
In summary, among the 1,230 differentially
methylated genes identified by functional enrichment analysis,
several genes had a role in tumorigenesis and/or cancer progression
described in literature. Some of these genes were associated with
functions linked to apoptosis, invasion and angiogenesis. Moreover,
we found that sorafenib affected the methylation level of genes
belonging to important signaling pathways such as RAF/MEK/ERK, JNK,
JAK-STAT, PI3K/AKT/mTOR and NF-κB.
Non-coding genes found differentially
methylated in sorafenib-treated cells
Among the 1,230 differentially methylated genes, 47
were non-coding genes (Table V)
with 16 antisense RNAs, 20 lncRNAs including 15 lincRNAs, 7
microRNAs, three small nucleolar RNAs, and one small nucleolar RNA.
In particular, MALAT1, HOTTIP, miR-149 and miR-675 are known to be
associated with the tumorigenesis and/or cancer progression.
| Table VNon-coding genes found differently
methylated and associated with the tumorigenesis and/or cancer
progression. |
Table V
Non-coding genes found differently
methylated and associated with the tumorigenesis and/or cancer
progression.
| Gene | DMR length | Num. CpG | CpG observed/CpG
expected | P-value | MAT score | DMR position | Note |
|---|
| ATXN8OS | 2110 | 11 | 0.18 | 3.69E-04 | −10.15 | Gene body | Antisense RNA.
Implicated in localization and activity of splicing factors |
| C1RL-AS1 | 3076 | 34 | 0.16 | 5.16E-04 | 10.24 | Gene body | Antisense RNA |
| CACNA1C-AS1 | 2453 | 117 | 0.58 | 1.66E-04 | −11.01 | Promoter
region | Antisense RNA |
| CECR5-AS1 | 2036 | 26 | 0.24 | 3.87E-04 | 10.50 | Gene body | Antisense RNA |
| EPHA1-AS1 | 985 | 9 | 0.25 | 5.16E-04 | 10.21 | Gene body | Antisense RNA.
Diseases associated with EPHA1-AS1 include Alzheimer's disease |
| FAM41C | 2699 | 53 | 0.36 | 1.47E-04 | −11.08 | Gene body | lncRNA class |
| FAM66D | 2279 | 42 | 0.41 | 2.58E-04 | 11.10 | Gene body | Antisense RNA |
| GATA6-AS1 | 2895 | 188 | 0.88 | 4.06E-04 | −10.07 | Promoter
region | Antisense RNA |
| HOTTIP | 1434 | 20 | 0.39 |
2.21E-04 | −10.65 | Promoter
region | Antisense RNA.
Role in cancer (48) |
| HOXB-AS3 | 4175 | 222 | 0.61 | 1.66E-04 | −10.87 | Gene body | Antisense RNA.
Diseases associated with HOXB-AS3 include obesity |
| LINC00029 | 2382 | 105 | 0.47 | 7.01E-04 | −9.49 | Gene body | Long intergenic
non-protein coding |
| LINC00174 | 1674 | 34 | 0.42 | 4.24E-04 | −10.00 | Gene body | Long intergenic
non-protein coding |
| LINC00261 | 1054 | 9 | 0.19 | 3.69E-05 | −13.06 | Gene body | Long intergenic
non-protein coding |
| LINC00261 | 2135 | 104 | 0.66 | 7.01E-04 | −9.41 | Gene body | Long intergenic
non-protein coding |
| LINC00277 | 3609 | 52 | 0.28 | 2.58E-04 | 11.03 | Promoter
region | Long intergenic
non-protein coding |
| LINC00319 | 3036 | 124 | 0.42 | 9.22E-05 | −12.22 | Promoter
region | Long intergenic
non-protein coding |
| LINC00539 | 2157 | 77 | 0.59 | 3.32E-04 | −10.20 | Gene body | Long intergenic
non-protein coding |
| LINC00539 | 964 | 14 | 0.22 | 3.87E-04 | 10.53 | Gene body | Long intergenic
non-protein coding |
| LINC00628 | 2253 | 33 | 0.24 | 5.53E-05 | 13.09 | CDS end of the
gene | Long intergenic
non-protein coding |
| LINC00637 | 2399 | 213 | 0.94 | 7.56E-04 | −9.35 | Gene body | Long intergenic
non-protein coding |
| LINC00643 | 679 | 5 | 0.24 | 5.53E-05 | 13.24 | Gene body | Long intergenic
non-protein coding |
| LINC00663 | 379 | 7 | 0.45 | 1.84E-05 | −13.75 | CDS end of the
gene | Long intergenic
non-protein coding |
| LINC00857 | 3166 | 179 | 0.67 | 7.01E-04 | −9.42 | Gene body | Long intergenic
non-protein coding |
| LINC00957 | 2385 | 142 | 0.55 | 1.47E-04 | −11.09 | Gene body | Long intergenic
non-protein coding |
| LINC00999 | 2549 | 109 | 0.41 | 1.84E-05 | −14.02 | Gene body | Long intergenic
non-protein coding |
| LINC01002 | 2343 | 114 | 0.46 | 9.22E-05 | −12.24 | Gene body | Long intergenic
non-protein coding |
| LINC01056 | 663 | 45 | 0.68 | 4.06E-04 | −10.10 | Gene body | Long intergenic
non-protein coding |
| MALAT1 | 2205 | 73 | 0.51 |
1.84E-05 | 16.14 | CDS end of the
gene | IncRNA. Role in
cancer (47) |
| MIR149 | 3820 | 308 | 0.64 |
1.29E-04 | −11.22 | Gene
body | miRNA. Role in
cancer (49) |
| MIR3939 | 1740 | 10 | 0.15 | 4.98E-04 | 10.26 | CDS end of the
gene | miRNA |
| MIR4635 | 2310 | 128 | 0.55 | 1.29E-04 | −11.27 | Gene body | miRNA |
| MIR4683 | 2321 | 281 | 0.96 | 4.06E-04 | −10.05 | Promoter
region | miRNA |
| MIR5091 | 1362 | 106 | 0.86 | 1.11E-04 | −11.65 | Gene body | miRNA |
| MIR5187 | 2601 | 31 | 0.17 | 4.42E-04 | 10.39 | Gene body | miRNA |
| MIR675 | 3245 | 150 | 0.51 |
7.37E-05 | −12.38 | Promoter
region | miRNA. Role in
cancer (50) |
| MRPL23-AS1 | 2003 | 85 | 0.42 | 7.74E-04 | −9.28 | Promoter
region | Antisense RNA |
| MYLK-AS1 | 2516 | 138 | 0.70 | 1.84E-05 | −14.32 | Gene body | Antisense RNA |
| RNF219-AS1 | 2572 | 108 | 0.64 | 3.69E-04 | −10.14 | Gene body | Antisense RNA. SNP
associated with the regulation of blood pressure and alcohol
consuming |
| SNHG18 | 2171 | 182 | 0.75 | 7.74E-04 | −9.26 | Gene body | Small nucleolar
RNA |
| SNORA51 | 2385 | 52 | 0.33 | 6.82E-04 | 9.97 | Gene body | Small nucleolar
RNA |
| SNORD52 | 2303 | 69 | 0.50 | 2.77E-04 | −10.33 | Gene body | Small nucleolar
RNA |
| SPANXA2-OT1 | 2060 | 15 | 0.20 | 5.16E-04 | 10.21 | Gene body | Antisense RNA |
| SPATA41 | 2102 | 13 | 0.19 | 1.66E-04 | −11.01 | Promoter
region | lncRNA class |
| TOB1-AS1 | 2251 | 209 | 0.83 | 7.74E-04 | −9.31 | Gene body | Antisense RNA |
| TTC28-AS1 | 2534 | 47 | 0.45 | 2.40E-04 | 11.15 | Gene body | Antisense RNA.
Associated with obesity |
| ZNRD1-AS1 | 1415 | 8 | 0.11 | 7.74E-04 | 9.83 | Gene body | Antisense RNA.
Associated with Graves' disease and systemic lupus
erythematosus |
Validation of MeDip-chip results by COBRA
assay and direct bisulfite sequencing of the genes BIRC3, FOXO3,
MAPK3, SMAD2 and TSC2
In order to validate the methylation status of the
genes found hypomethylated or hypermethylated in MeDip-chip
experiment, we performed quantitative analysis of CpGs by COBRA
assay and direct bisulfite sequencing. Among the OGs and TSGs found
differentially methylated, we chose to validate the following
genes: BIRC3, FOXO3, MAPK3, SMAD2 and TSC2 (Table VI). These 5 genes were chosen for
their biological significance, for the location of the DMR in the
associated gene and for the number of CpGs contained in the DMR.
Our aim was to better understand the relationship between DNA
methylation in regions with high or low density of CpGs located in
different portions of the gene (promoter or intragenic) and gene
expression. In HA22T/VGH cells the DMR relative to BIRC3 and MAPK3
were found hypermethylated in sorafenib-treated cells by MeDip-chip
experiment. COBRA assay results are in line with these findings and
confirmed that the level of DNA methylation in this DMR was higher
in sorafenib treated cells compared to the untreated cells
(Fig. 4A and B).
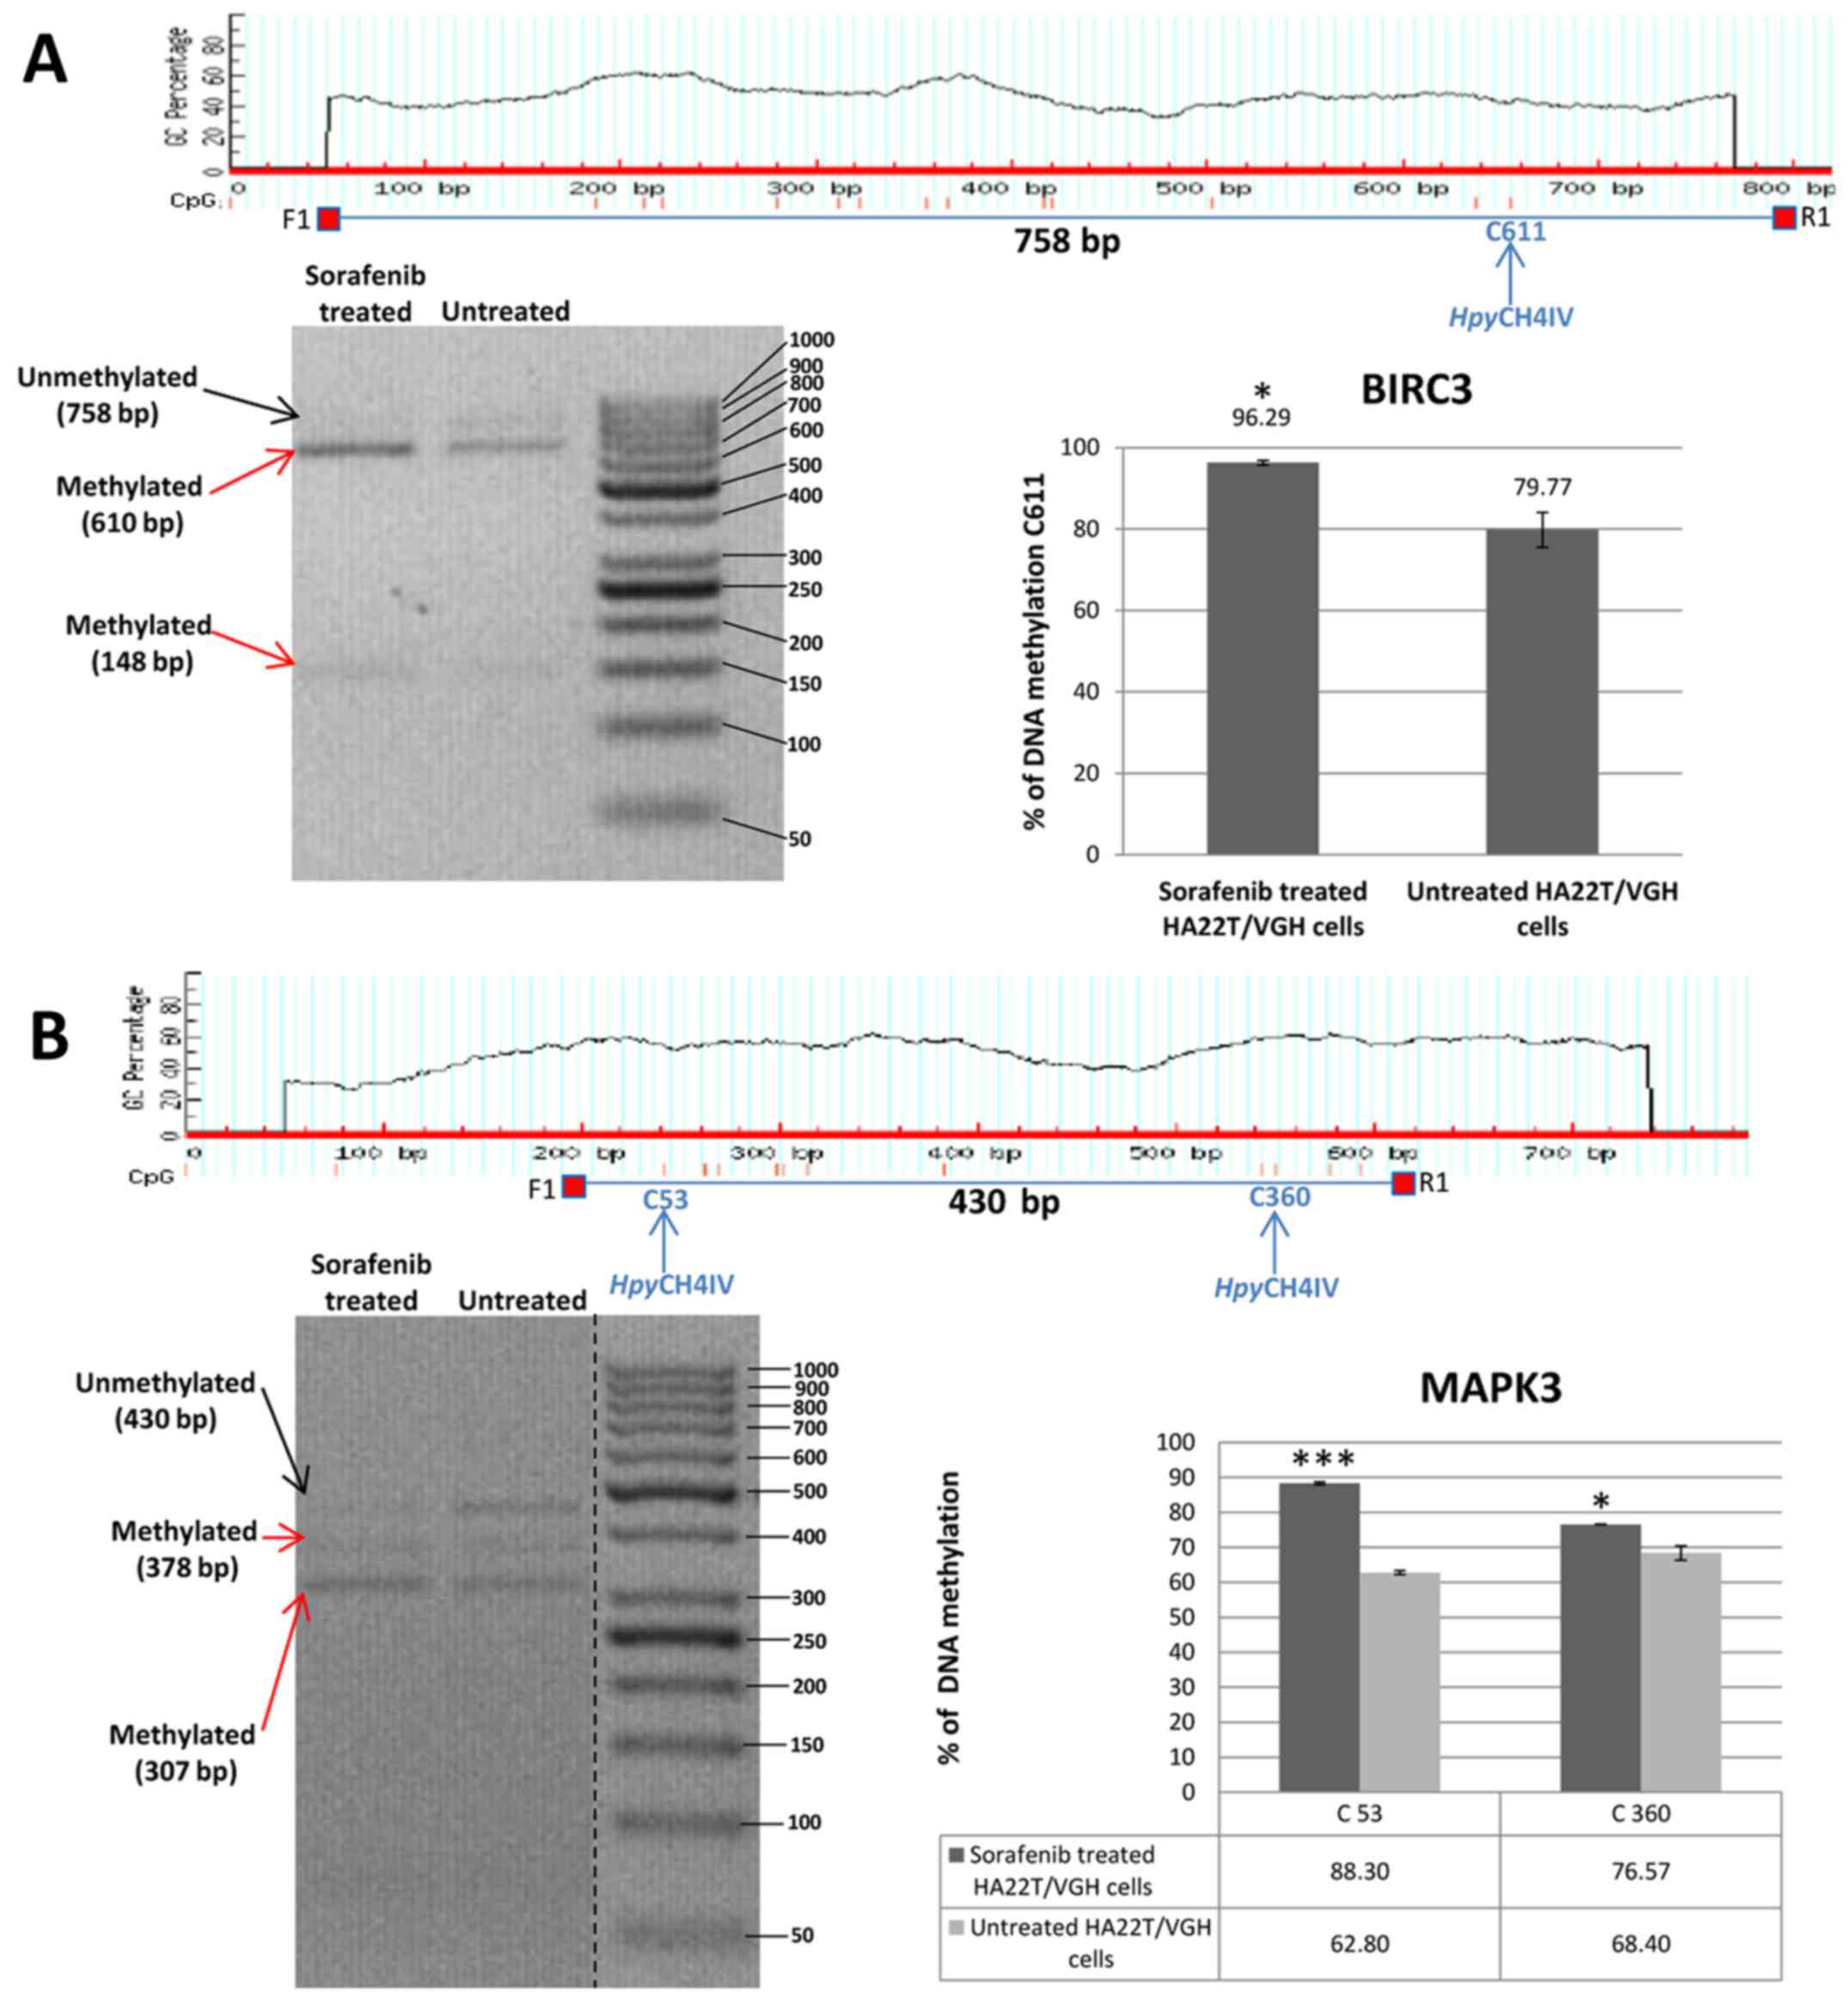 | Figure 4Validation of MeDip-chip results by
COBRA assay in sorafenib treated and untreated HCC cells. (A) The
DMR associated to BIRC3 gene was 1,944 bp long and the primers were
designed to amplify a 758 bp fragment from nucleotides 1,032 to
1,790 relative to the DMR start. The digested bands (610 and 148
bp) indicate the presence of methylation (red arrows). The band at
the top (758 bp) corresponds to undigested DNA (black arrow). The
histograms indicate the level of methylation in cytosine 611 in
sorafenib treated cells and untreated cells by COBRA analysis. The
results indicated a hypermethylation of cytosine 611 in sorafenib
treated cells. (B) The DMR associated to MAPK3 gene was 2,255 bp
long and the primers were designed to amplify a 430 bp fragment
from nucleotides 1,660 to 2,090 relative to the DMR start. The
digested bands (378 and 307 bp) indicate the presence of
methylation (red arrows). The band at the top (430 bp) corresponds
to undigested DNA (black arrow). The bands of 52 and 71 bp were not
visible on the gel. The histograms indicate the level of
methylation in cytosine 53 and cytosine 360 in sorafenib treated
cells and untreated cells by COBRA analysis. The results indicated
a hypermethylation of cytosine 53 and cytosine 360 in sorafenib
treated cells. All the assays were performed using 3.0% gel in 1X
TBE. Error bars of the histograms are referred to standard
deviation of the means of two experiment performed.
*P<0.05, **P<0.01 and
***P<0.001 indicate that expression difference
between the two cellular conditions was statistically significant.
Results of one representative experiment of two independent
experiments are shown. Validation of MeDip-chip results by COBRA
assay in sorafenib treated and untreated HCC cells. (C) The DMR
associated to TSC2 gene was 3,403 bp long and the primers were
designed to amplify a 577 bp fragment from nucleotides 1,107 to
1,684 relative to the DMR start. The digested bands (382 and 195
bp) indicate the presence of methylation (red arrows). The band at
the top (577 bp) corresponds to undigested DNA (black arrow). The
histograms indicate the level of methylation in cytosine 196 in
sorafenib-treated cells and untreated cells by COBRA analysis. The
results indicated a slight hypomethylation of cytosine 196 in
sorafenib treated cells. All the assays were performed using 3.0%
gel in 1X TBE. The COBRA analysis was also conducted in sorafenib
treated and untreated SKHep1C3 cells. In SKHep1C3 (D) cells the DMR
associated to MAPK3 gene was found hypermethylated in sorafenib
treated cells compared to untreated cells. In particular, the
results indicated a hypermethylation of cytosine 53 in sorafenib
treated cells. All the assays were performed using 3.0% gel in 1X
TBE. Error bars of the histograms are referred to standard
deviation of the means of two experiment performed.
*P<0.05, **P<0.01 and
***P<0.001 indicate that expression difference
between the two cellular conditions was statistically significant.
N.S means that the results was not statistically significant.
Results of one representative experiment of two independent
experiments are shown. |
| Table VIGenes validated by quantitative COBRA
assay and direct bisulfite sequencing. |
Table VI
Genes validated by quantitative COBRA
assay and direct bisulfite sequencing.
| Gene | Chr | DMR start | DMR end | DMR length | No. of CpG in
DMR | CpG observed/CpG
expected | P-value | MAT score | DMR position |
|---|
| BIRC3 | chr11 | 101693878 | 101695822 | 1944 | 25 | 0.27 | 1.29E-04 | +12.10 | Gene body:
Intronic |
| FOXO3 | chr 6 | 108987593 | 108990713 | 3120 | 312 | 0.87 | 2.77E-04 | −10.33 | Promoter
region |
| MAPK3 | chr16 | 30037080 | 30039335 | 2255 | 29 | 0.21 | 1.11E-04 | +12.42 | Gene body: Intronic
and exonic |
| SMAD2 | chr18 | 43709687 | 43712269 | 2582 | 228 | 0.94 | 1.66E-04 | −10.86 | Promoter
region |
| TSC2 | chr16 | 2043747 | 2047150 | 3403 | 121 | 0.40 | 3.69E-05 | −13.04 | Gene body: Intronic
and exonic |
Direct bisulfite sequencing on BIRC3 DMR found that
57.14% of CpGs analysed showed a hypermethylation trend in
sorafenib-treated compared to -untreated cells and 14.29% of CpGs
showed a hypomethylation trend (Fig.
5A). Direct bisulfite sequencing of MAPK3 DMR displayed that
90.91% of CpGs analysed showed a hypermethylation trend in
sorafenib-treated compared to untreated cells, and 0% of CpGs
showed a hypomethylation trend (Fig.
5B). The DMR relative to TSC2, FOXO3 and SMAD2 were found
hypomethylated in MeDip-chip experiment. COBRA assay carried out on
TSC2 DMR confirmed that the level of DNA methylation in this DMR
was lower in sorafenib-treated cells than -untreated cells
(Fig. 4C). Moreover, direct
bisulfite sequencing found that 84% of CpGs analysed showed a
hypomethylation trend in sorafenib-treated cells, and 8% of CpGs
analysed showed a hypermethylation trend (Fig. 5C and F) confirming the
hypomethylation trend of TSC2 gene found by MeDip-chip experiment.
For DMR relative to FOXO3 and SMAD2, direct bisulfite sequencing
displayed 65.12% of CpGs analysed with a hypomethylation trend in
sorafenib-treated cells and 25.58% of CpGs analysed with a
hypermethylation trend for FOXO3 DMR (Fig. 5D and F), and for SMAD2 DMR, 74.19%
of CpGs analysed showed a hypomethylation trend in
sorafenib-treated cells, and 9.68% of CpGs analysed showed a
hypermethylation trend (Fig. 5E).
Therefore, the assay confirmed the hypomethylation trend of FOXO3,
SMAD2 and TSC2 DMRs found by MeDip-chip experiment.
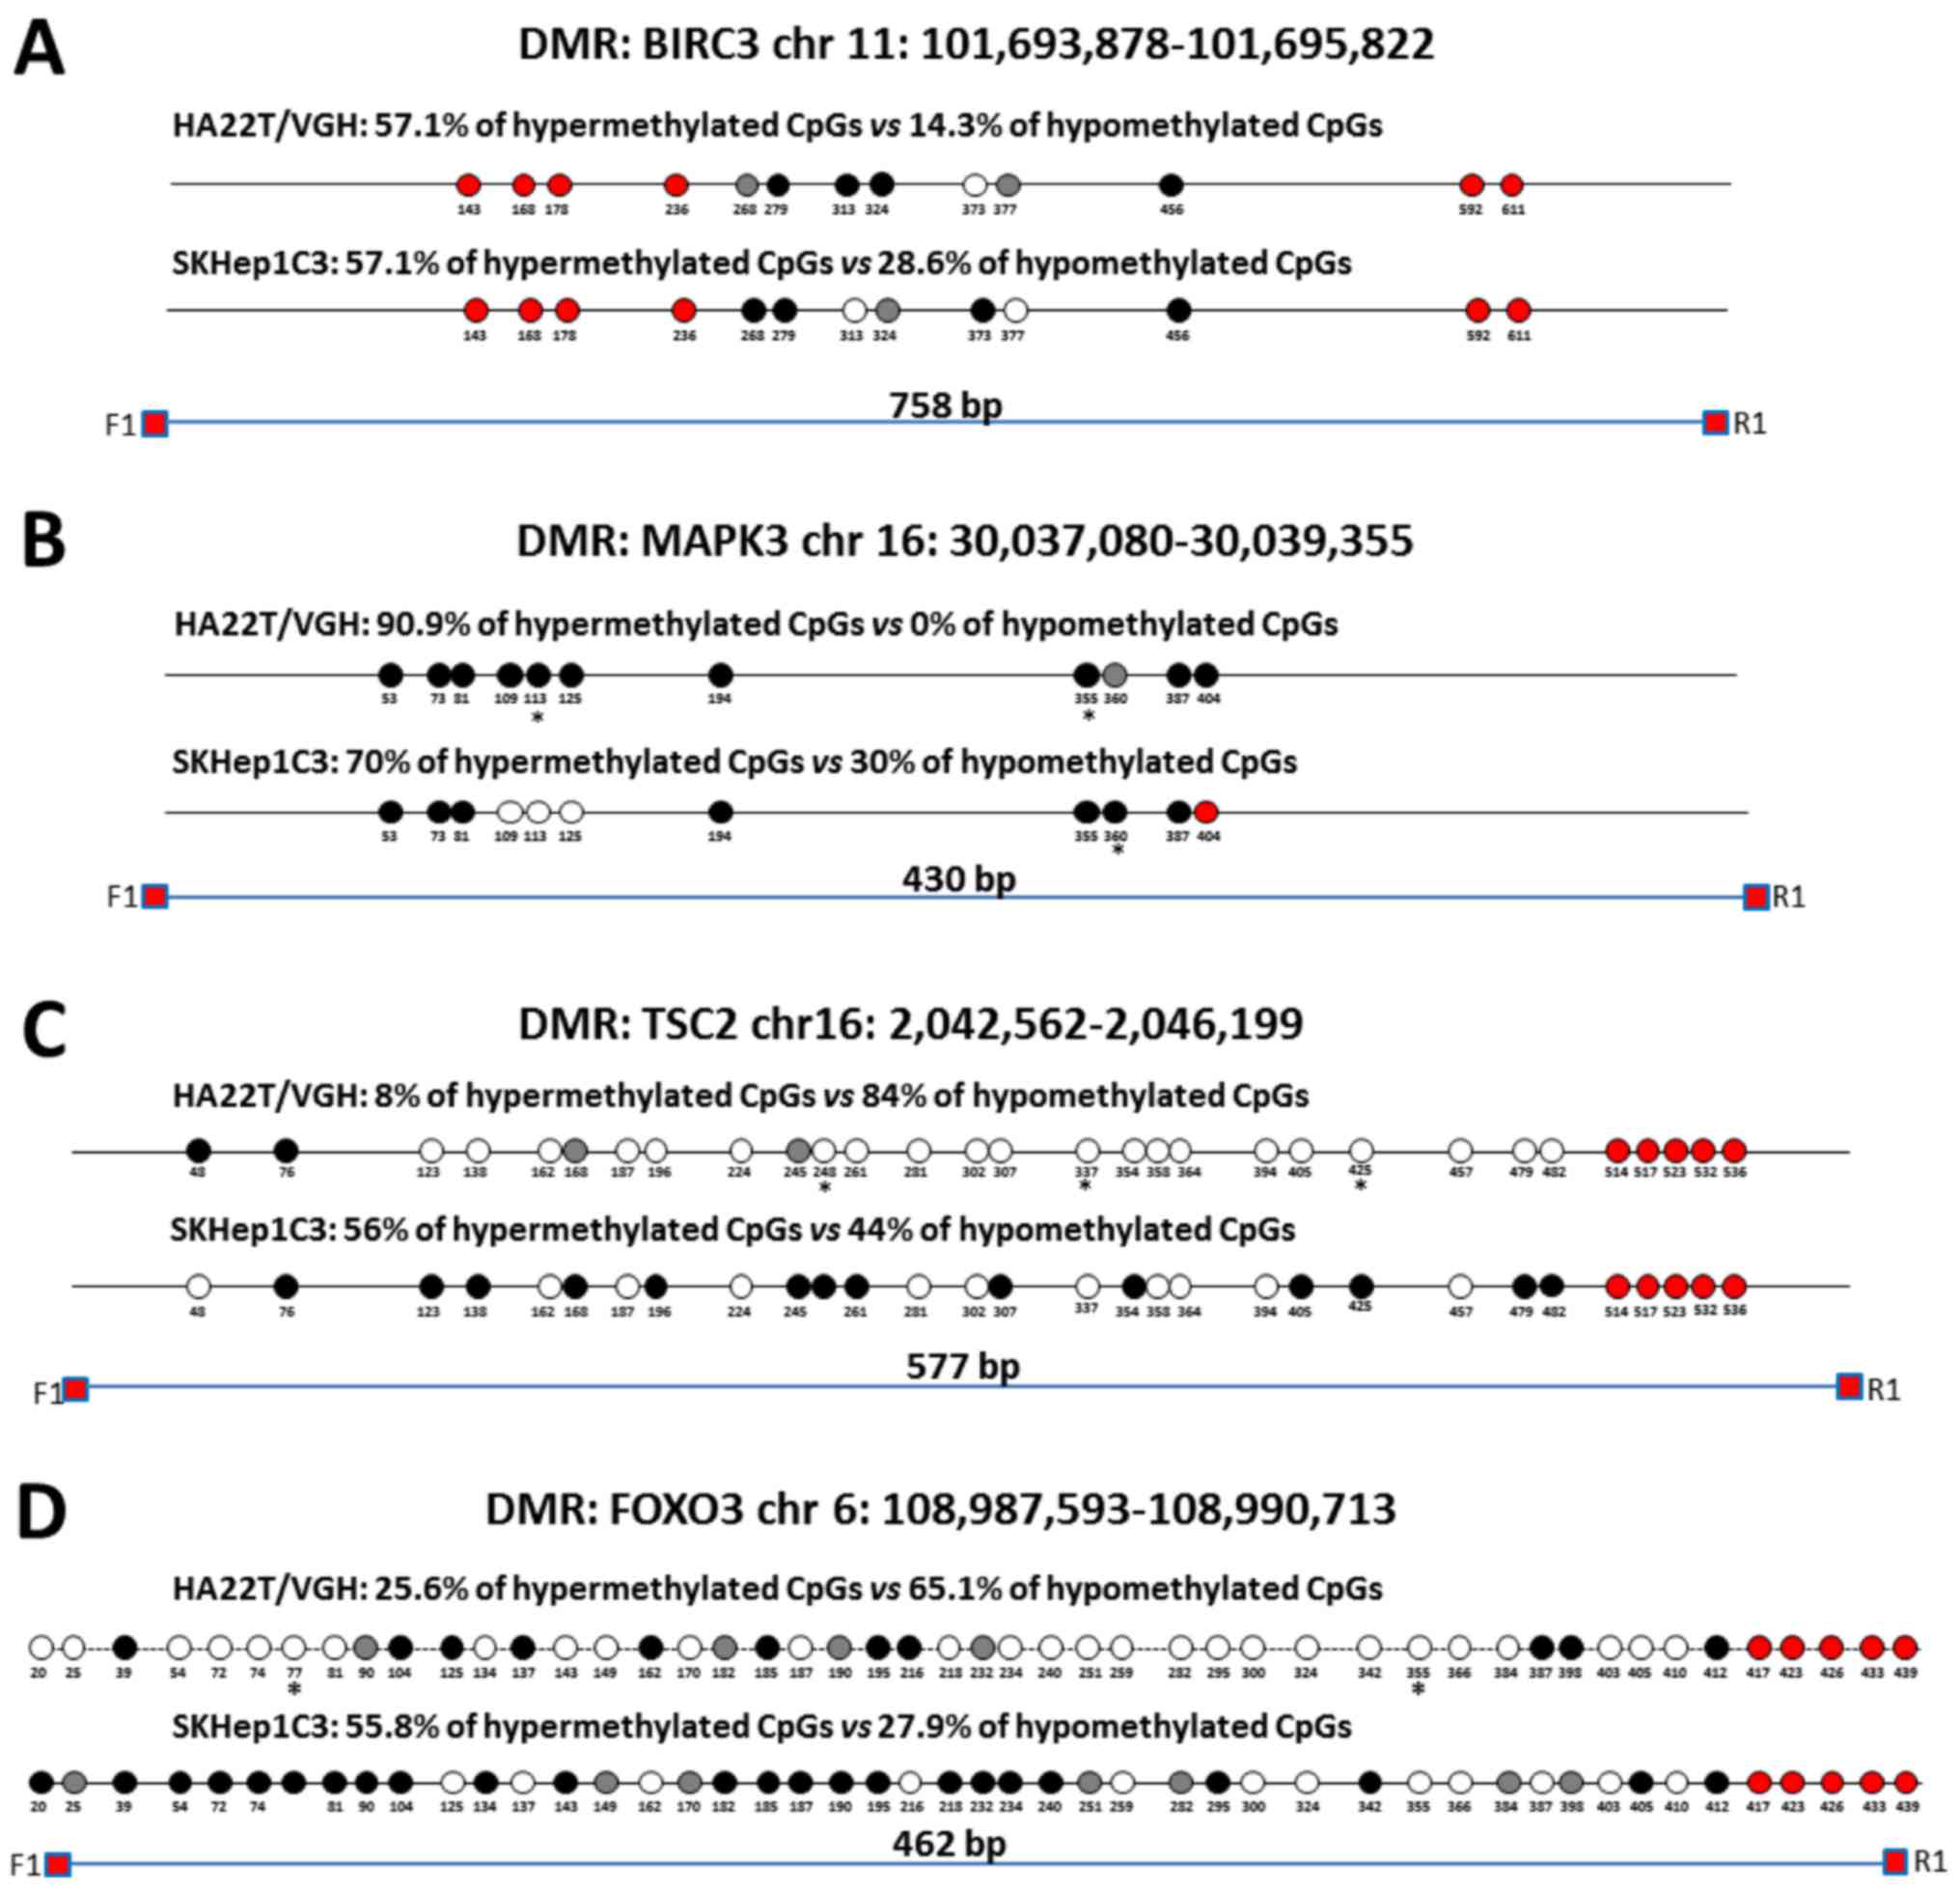 | Figure 5Validation of MeDip-chip results by
direct bisulfite sequencing in sorafenib-treated and -untreated HCC
cells. Forward sequencing chromatogram peaks for thymine
(unmethylated) and cytosine (methylated) or reverse sequencing
chromatogram peaks for adenine (unmethylated) and guanine
(methylated) were compared in bisulfite treated DNA to determine
the average level of methylation for each CpG within a given
sample. The white and black circles indicate that the mean level of
CpG methylation in sorafenib-treated cells was lower
(hypomethylation) or higher (hypermethylation) respect to untreated
cells. Grey circles indicate that the mean level of CpG methylation
was the same in the two cellular conditions (difference <0.1%
was not considered relevant). Red circles indicate undetected CpGs.
*P<0.05 and **P<0.01 indicate that
methylation difference between the two cellular conditions was
statistically significant. (A) For BIRC3 in HA22T/VGH, 4 out 7 CpGs
showed a hypermethylation trend in sorafenib treated cells, while 1
of 7 CpGs showed a hypomethylation trend. For BIRC3 in SKHep1C3, 4
out 7 CpGs showed a hypermethylation trend in sorafenib-treated
cells, while 2 of 7 CpGs showed a hypomethylation trend. The primer
set was designed to amplify a 758 bp fragment from nucleotides
1,032 to 1,790 relative to the DMR start. (B) For MAPK3 in
HA22T/VGH, 10 out 11 CpGs showed a hypermethylation trend in
sorafenib-treated cells, while 0 out 11 CpGs showed a
hypomethylation trend. For MAPK3 in SKHep1C3, 7 out 10 CpGs showed
a hypermethylation trend in sorafenib-treated cells, while 3 out 10
CpGs showed a hypomethylation trend. The primer set was designed to
amplify a 430 bp fragment from nucleotides 1,660 to 2,090 relative
to the DMR start. (C) For TSC2 in HA22T/VGH, 21 out 25 CpGs showed
a hypomethylation trend in sorafenib-treated cells, while 2 out 25
CpGs showed a hypermethylation trend. For TSC2 in SKHep1C3, 11 out
25 CpGs showed a hypomethylation trend in sorafenib-treated cells,
while 14 out 25 CpGs showed a hypermethylation trend. The primer
set was designed to amplify a 577 bp fragment from nucleotides
1,107 to 1,684 relative to the DMR start. (D) For FOXO3 in
HA22T/VGH, 28 out 43 CpGs showed a hypomethylation trend in
sorafenib-treated cells, while 11 of 43 CpGs showed a
hypermethylation trend. For FOXO3 in SKHep1C3, 12 out 43 CpGs
showed a hypomethylation trend in sorafenib-treated cells, while 24
of 43 CpGs showed a hypermethylation trend. The primer set was
designed to amplify a 430 bp fragment from nucleotides 1,780 to
2,242 relative to the DMR start. Validation of MeDip-chip results
by direct bisulfite sequencing in sorafenib treated and untreated
HCC cells. (E) For SMAD2 in HA22T/VGH, 23 out 31 CpGs showed a
hypomethylation trend in sorafenib-treated cells, while 3 out 31
CpGs showed a hypermethylation trend. For SMAD2 in SKHep1C3, 6 out
31 CpGs showed a hypomethylation trend in sorafenib-treated cells,
while 16 out 31 CpGs showed a hypermethylation trend. The primer
set was designed to amplify a 404 bp fragment from nucleotides
2,118 to 2,581 relative to the DMR start. (F) Examples of
chromatogram peaks for thymine (unmethylated) and cytosine
(methylated; forward sequencing) and for adenine (unmethylated) and
guanine (methylated; reverse sequencing) relative to CpGs whose
mean differences in DNA methylation were statistically significant
between the two cellular conditions. |
To compare the results obtained in other
sorafenib-sensitive HCC cell lines, we extended some validation
analysis by COBRA assay and direct bisulfite sequencing to SKHep1C3
cells BIRC3 and MAPK3 resulted hypermethylated in line with
HA22T/VGH cells (Figs. 4D and
5A and B). TSC2 displayed
substantially unchanged DNA methylation level (Fig. 5C); finally, FOXO3 and SMAD2 showed
an opposite DNA methylation trend respect to HA22T/VGH cells
(Fig. 5D–E).
RT-qPCR expression analysis of the genes
BIRC3, FOXO3, MAPK3, SMAD2 and TSC2 in sorafenib-treated and
untreated HCC cells
To evaluate the relationship between DNA methylation
changes and gene expression in sorafenib-treated and untreated
cells, we evaluated the mRNA expression of the genes whose DNA
methylation status was previously validated by COBRA and direct
bisulfite sequencing (BIRC3, FOXO3, MAPK3, SMAD2 and TSC2) by
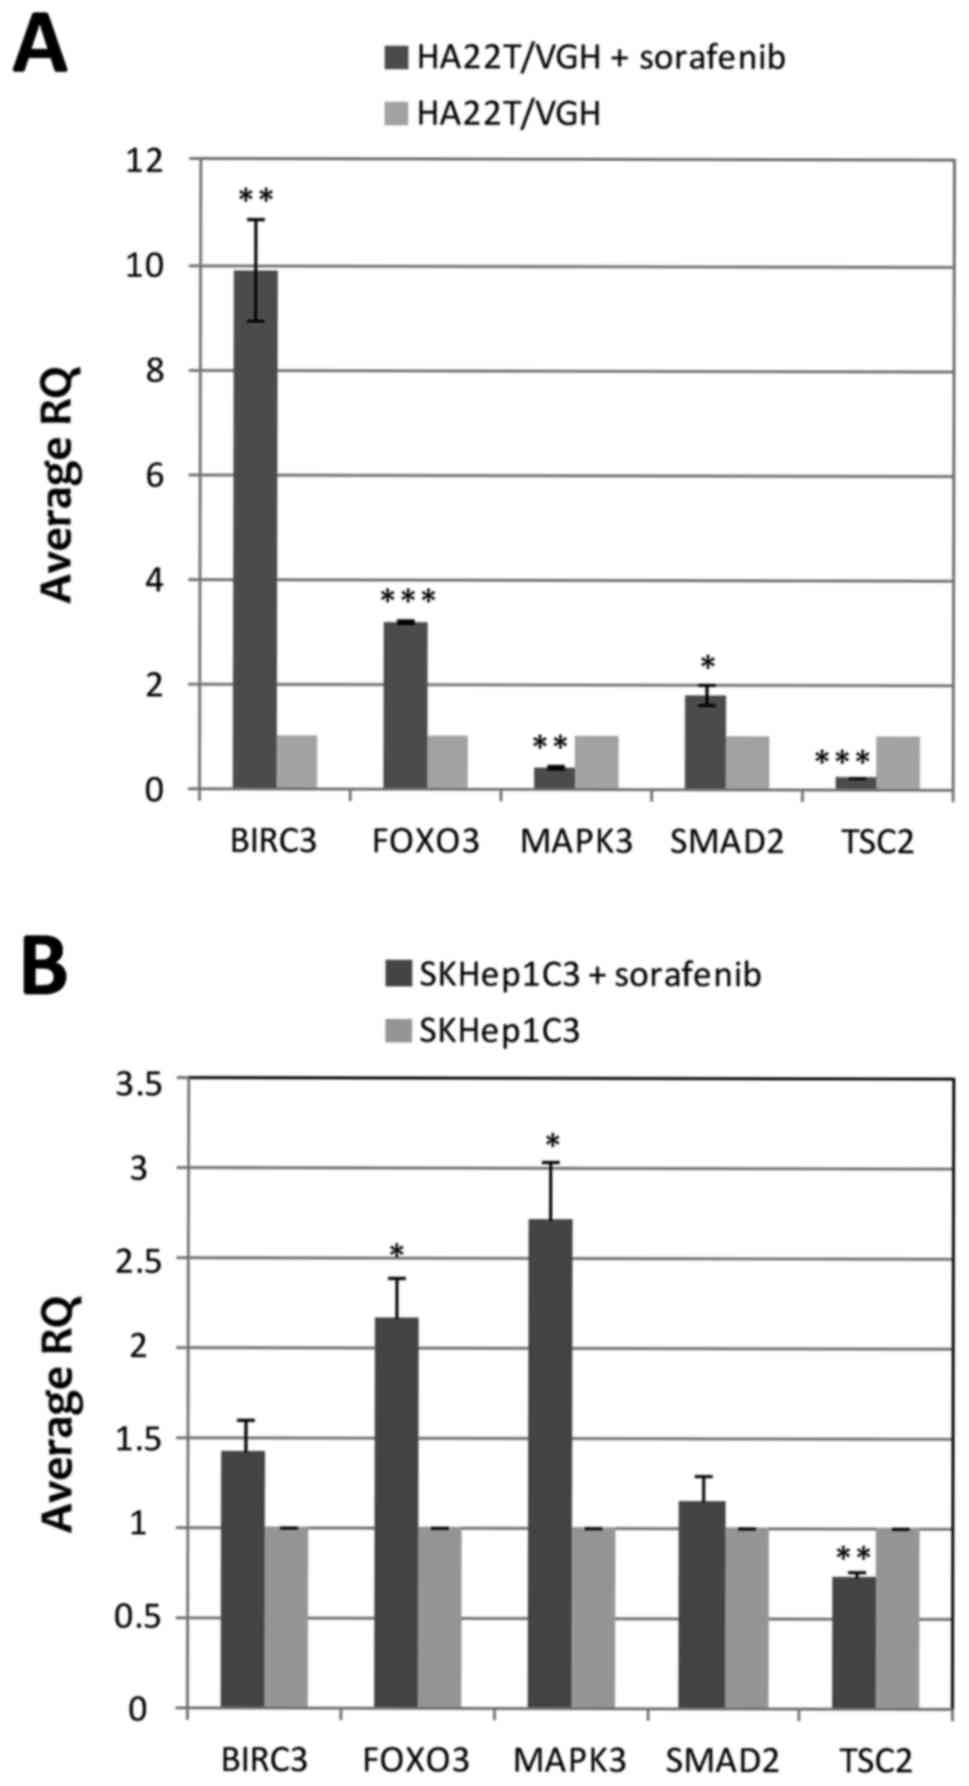
RT-qPCR. The results showed that the 5 genes studied were
differentially expressed in cells treated with sorafenib compared
to untreated cells (Fig. 6A). In
particular, BIRC3, FOXO3 and SMAD2 were upregulated while MAPK3 and
TSC2 were downregulated. FOXO3, MAPK3 and SMAD2 showed an inverse
relationship between gene expression and DNA methylation level with
FOXO3 and SMAD2 being hypomethylated and upregulated and MAPK3 was
hypermethylated and downregulated in sorafenib-treated compared to
untreated cells. The DMR of FOXO3 (MAT score = −10.33; RQ=3.24) and
SMAD2 (MAT score = −10.86; RQ=1.95) were located in the promoter
region of their associated genes, and their hypomethylation in
sorafenib-treated cells were associated with an upregulation of
their mRNA. These results were expected because of the well-known
effect on gene expression of inhibition of DNA methylation in
promoter regions. BIRC3 and TSC2 showed a direct relationship
between DNA methylation level and gene expression. BIRC3 was
hypermethylated and upregulated and TSC2 was hypomethylated and
downregulated. We performed the RT-qPCR analysis in SKHep1C3 cells
to compare the results obtained in HA22T/VGH cell line. SKHep1C3
cells displayed the same expression trend found in HA22T/VGH cells
for BIRC3, FOXO3, SMAD2 and TSC2 and the inverse expression trend
for MAPK3 (Fig. 6B).
Discussion
Sorafenib is the first multi-kinase inhibitor
designed to inhibit the activity of RAF kinase, and is currently
the only treatment option for advanced and/or unresectable
hepatocellular carcinoma. Although SHARP (3) and other clinical trials confirmed the
effectiveness of sorafenib compared to placebo, the median survival
was nearly 3 months longer for patients treated with sorafenib than
for those given placebo. Moreover, sorafenib had severe side
effects and patients developed resistance quickly (7). It is well known that epigenetic
alterations in addition to genetic mutations play an additive role
in the development and progression of cancer.
To our knowledge, there are no studies about
sorafenib effects on global DNA methylation changes in cancer
cells. In this novel study, conducted on HCC derived cells (the
undifferentiated HA22T/VGH cells) the data obtained showed that
sorafenib mediated DNA methylation variations in 1280 regions
corresponding to 1230 unique genes. We consider this the main
novelty of our work. Data obtained with functional enrichment
analysis suggested for the first time that sorafenib in HA22T/VGH
cells affected the methylation level of different genes known to be
associated with tumorigenesis and/or cancer progression (i.e. in
apoptosis, invasion and angiogenesis and important signaling
pathways deregulated in HCC).
Apoptosis
Several studies showed that sorafenib induced
apoptosis in different types of cancer cell lines, including HCC
cells (6). Our results showed that
different genes involved in apoptosis were differentially
methylated after the treatment with sorafenib. We found
hypomethylation of FOXO3, SMAD2 and hypermethylation of CDKN1A
(p21) (Fig. 7A). FOXO3 is a
transcription factor with pro-apoptotic function. Lu et al
found that FOXO3 was downregulated in HCC tissue (17). Moreover, Wehler et al found
that sorafenib-sensitive colorectal cancer cells were defined by
medium-strong FOXO3 protein expression (18). We examined FOXO3 gene expression in
2 sorafenib HCC treated cell lines. We have found hypomethylation
of FOXO3 and a correspondent upregulation of its mRNA in HA22T/VGH
cells likely leading to increased protein expression levels. In
SKHep1C3, we found hypermethylation of FOXO3 by bisulfite
sequencing and upregulation of mRNA. In this regard, we sequenced a
small region (462 bp) of the DMR (differential methylated region)
that was 3120 bp long. For this reason, we do not exclude to find
hypomethylation within the DMR in other portions; however, other
molecular mechanisms may be responsible of FOXO3 mRNA increasing in
SKHep1C3.
We observed the hypomethylation of FOXO3 and the
upregulation of FOXO3 mRNA in 2 sorafenib-treated cell lines and
these events may determine FOXO3 protein up regulation. The role of
SMAD2 as TSG or OG is still controversial and depends on the
cellular context (19). When Smad
proteins are activated by TGF-β, they form a complex with FOXO
proteins and turn on the growth inhibitory genes
p15INK4B and p21Cip1 (19). We found that SMAD2 was
hypomethylated in sorafenib-treated cells and its mRNA was
upregulated in both cell lines analyzed. Conversely, we found p21
(CDKN1A) hypermethylated. This result is intriguing because p21 is
a pleiotropic protein and can also have anti-apoptotic activity
(20). Weiss et al found
that sorafenib decreased p21 expression both in renal cell
carcinoma and in HCC cell lines, suggesting that the decrease of
p21 protein is at least in part responsible for the high
cytotoxicity of sorafenib (20).
Invasion
Sorafenib is known to inhibit invasion in HCC cells.
Ha et al reported that sorafenib inhibits migration and
invasion of HCC cells through suppression of different MMP
expression (21). Moreover, Chiang
et al demonstrated that the invasion promoted by TPA
(12-O-tetradecanoylphorbol-13-acetate) that induced MMP-9 and VEGF
expression was inhibited by sorafenib via the suppression of
ERK/NF-κB pathway in HCC cells (22). We found that sorafenib promoted the
hypermethylation of crucial genes implicated in invasion process
such as MMP3, MMP7, RAC1, RHOC and LGALS3 (Fig. 7B). MMP3 and MMP7 are well known
proteases implicated in the degradation of ECM and invasion
process. RAC1 is known to be involved in various cellular functions
such as cell growth, division, morphology, polarity and migration,
and its overexpression was correlated with poor prognosis in HCC
(23). RHOC was found
overexpressed in HCC and it had an important role in invasion and
metastasis (24). Finally,
downregulation of LGALS3 was demonstrated to cause a decrease of
uPAR levels and inhibits the proliferation, migration and invasion
of HCC (25).
Angiogenesis
Anti-angiogenic activity of sorafenib is well
documented in HCC (6). Our results
showed that the proangiogenic factor EPAS1 was hypermethylated in
our study. EPAS1 is an oncogene that works in response to hypoxic
conditions and is overexpressed in HCC (26). Cervello et al found that
EPAS1 mRNA resulted downregulated after treating HCC cells with
sorafenib (27).
JAK-STAT pathway
In mammals, the JAK/STAT pathway is the principal
signaling mechanism for a wide array of cytokines and growth
factors. JAK activation stimulates cell proliferation,
differentiation, cell migration and apoptosis (28). Yang et al found that
sorafenib caused dephosphorylation of STAT3 and downregulation of
cyclin D3 (CCND3) in glioblastomas (29). The downregulation of cyclin D3 mRNA
after sorafenib treatment was reported by Cervello et al in
HCC cells (27). We found the
hypermethylation of the following component of JAK-STAT signaling
after sorafenib treatment: JAK1, STAT3, STAT5A, STAT5B and CCND3
(Fig. 7D). Noteworthy, CCND3, a
key component for G1/S phase transition, is induced by the
transcription factor STAT3 and STAT5 here both were found
hypermethylated.
MAPK pathway: RAF/MEK/ERK cascade
Sorafenib was initially designed to inhibit the
kinase activity of RAF and consequently the RAF/MEK/ERK cascade
involved in different processes of survival and cellular growth.
Liu et al demonstrated that sorafenib blocked the
RAF/MEK/ERK pathway by inhibiting the phosphorylation of MEK and
ERK and it downregulated cyclin D1 levels in two HCC cell lines
(6). We observed MAPK3 (ERK1) and
MAP2K2 (MEK2) hypermethylated in sorafenib treated HA22T/VGH cells.
We also found FOS, one of the effectors of RAF/MEK/ERK cascade,
hypermethylated (Fig. 7E). Walter
et al found the downregulation of FOS in human osteosarcoma
cells after sorafenib treatment (30).
PI3K/AKT pathway
PI3K/AKT signaling is an important
survival/proliferative pathway involving various growth factors,
cytokines, and activation of receptors and it is one of the most
commonly activated signaling pathway in human cancer. However, the
role of this pathway in the mechanisms of action of sorafenib is
not fully elucidated. Gedaly et al showed that sorafenib
enhance the level of p-AKT in HCC HuH7 cells (31). However, Zhang et al found
opposite results using Human SMMC-7721 hepatic carcinoma cells.
They found that sorafenib inhibited hepatic tumor growth by
reducing PI3K/AKT signaling pathway (32). Furthermore, Cervello et al
found no variation of p-AKT in HCC HepG2 cell line treated with
sorafenib (27). In this context,
we found DNA methylation changes in different component of PI3K/AKT
pathway, but with no clear tendency to turn on or turn off this
pathway in HA22T/VGH treated with sorafenib. We found PIK3CA and
PIK3C2B, subunits of PI3K, hypermethylated (Fig. 7F). We found TSC2, inhibitor of
mTOR, hypomethylated (Fig. 7F),
although the mRNA validation showed a downregulation of the TSC2
mRNA in the 2 cell lines analyzed.
Concerning the correlation between DNA methylation
and mRNA expression, our results indicated that among the 5
selected genes BIRC3 and TSC2 displayed a direct trend between DNA
methylation and mRNA expression and FOXO3, MAPK3 and SMAD2 showed
an inverse trend in HA22T/VGH cells.
In our study the DMR of BIRC3, MAPK3 and TSC2 were
located in intragenic regions and the analysis of gene expression
of associated genes returned both positive and negative
relationship between transcription and intragenic DNA methylation.
Some authors have already described that DNA methylation in
intragenic regions can lead to both positive and negative
relationship between transcription and intragenic DNA methylation
(33). BIRC3 (MAT score = +12.10;
RQ=9.22) and TSC2 (MAT score = −13.04; RQ=0.27) showed the same
direct trend, while MAPK3 (MAT score = +12.42; RQ=0.41) showed an
inverse trend between gene expression and DNA methylation.
Moreover, the DMR of BIRC3 and MAPK3 contained fewer CpGs and were
located near CpG islands. In literature, the regions that flank CpG
islands with less CG density have been recently described as 'CpG
island shores'. Different studies have described the role of CpG
island shore methylation in cancer and how it can affect gene
expression. For example, Irizarry et al reported that most
of the methylation differences between normal and cancer samples
occur in CpG island shores (34).
To our knowledge this is the first time that the association
between CpG island shore methylation and changes of gene expression
in HCC cells treated with sorafenib has been reported although
further studies are needed to confirm these findings.
Since the methylome of SKHep1C3 was not analyzed, we
do not assume that sorafenib determines the same global DNA
methylation changes observed in HA22T/VGH cells even if this cell
line is sorafenib-sensitive. It would be of interest in the future
to identify the DMRs in different HCC cell lines in order to know
the common DMRs and those depending on their own malignant
characteristics and on their differentiation state. In this regard,
the DNA methylation variations of the 5 selected genes in SKHep1C3
cells displayed a partial overlap compared to those obtained in
HA22T/VGH cells, but importantly their expression levels were
affected. In SKHep1C3 the trend of the gene expression
dysregulation was concordant in 4 out 5 genes in respect to
HA22T/VGH cells although not statistically significant for BIRC3
and SMAD2. Further, in SKHep1C3, we found hypermethylation of FOXO3
by bisulfite sequencing and upregulation of mRNA. In this regard,
we outline that we sequenced a small region (462 bp) of the DMR
(differential methylated region) that was 3120 bp long. For this
reason, we do not exclude to find hypomethylation within the DMR in
other portions; however, some other mechanisms of gene expression
control, other than DNA methylation, such as histone modifications,
chromatin remodelling and post-transcriptional regulation (i.e.
ncRNAs) should not to be excluded in determining mRNA dysregulation
following sorafenib treatments.
In summary, this is the first study that analyzed
the global DNA methylation changes induced by sorafenib in cancer
cells in particular in the HCC sorafenib sensitive HA22T/VGH cells.
Our data show that sorafenib affected the DNA methylation status of
numerous genes involved in tumorigenesis and cancer progression,
with a general trend of oncogenes to be hypermethylated and tumor
suppressor genes to be hypomethylated. These genes are involved in
processes such as apoptosis, invasion and angiogenesis, and
different signaling pathways deregulated in HCC.
Acknowledgments
We thank Dr M. Crosatti (University of Leicester;
Leicester, UK) for the linguistic revision of the manuscript. We
are grateful to Professor Marina Colombi and Professor Massimo
Gennarelli, responsible for the Affymetrix platform at the Division
of Biology and Genetics, Department of Molecular and Translational
Medicine, Brescia. This study was supported by Lega Italiana per la
Lotta contro i Tumori (LILT), by Comitato Nazionale Universitario
(CNU) Brescia, by the Ministero dell'Istruzione, dell'Università e
della Ricerca (MIUR) local funds of the University of Brescia. E.A.
was supported by a Postdoctoral fellowship from Associazione Davide
Rodella Onlus, Brescia.
Glossary
Abbreviations
Abbreviations:
|
COBRA
|
combined bisulfite restriction
analysis
|
|
DMR
|
differentially methylated region
|
|
IN DNA
|
input DNA
|
|
IP DNA
|
immunoprecipitated DNA
|
|
MAT algorithm
|
model-based analysis of tiling arrays
algorithm
|
|
MeDip
|
methylated DNA immunoprecipitation
|
|
PGS
|
partek genomics suite
|
|
5 mC
|
5-methylcytosine
|
|
hmC
|
5-hydroxymethylcytosine
|
References
|
1
|
Mittal S and El-Serag HB: Epidemiology of
hepatocellular carcinoma: Consider the population. J Clin
Gastroenterol. 47(Suppl): S2–S6. 2013. View Article : Google Scholar : PubMed/NCBI
|
|
2
|
Llovet JM, Burroughs A and Bruix J:
Hepatocellular carcinoma. Lancet. 362:1907–1917. 2003. View Article : Google Scholar : PubMed/NCBI
|
|
3
|
Llovet JM, Ricci S, Mazzaferro V, Hilgard
P, Gane E, Blanc JF, de Oliveira AC, Santoro A, Raoul JL, Forner A,
et al SHARP Investigators Study Group: Sorafenib in advanced
hepatocellular carcinoma. N Engl J Med. 359:378–390. 2008.
View Article : Google Scholar : PubMed/NCBI
|
|
4
|
Wilhelm SM, Carter C, Tang L, Wilkie D,
McNabola A, Rong H, Chen C, Zhang X, Vincent P, McHugh M, et al:
BAY 43-9006 exhibits broad spectrum oral antitumor activity and
targets the RAF/MEK/ERK pathway and receptor tyrosine kinases
involved in tumor progression and angiogenesis. Cancer Res.
64:7099–7109. 2004. View Article : Google Scholar : PubMed/NCBI
|
|
5
|
Carlomagno F, Anaganti S, Guida T,
Salvatore G, Troncone G, Wilhelm SM and Santoro M: BAY 43-9006
inhibition of oncogenic RET mutants. J Natl Cancer Inst.
98:326–334. 2006. View Article : Google Scholar : PubMed/NCBI
|
|
6
|
Liu L, Cao Y, Chen C, Zhang X, McNabola A,
Wilkie D, Wilhelm S, Lynch M and Carter C: Sorafenib blocks the
RAF/MEK/ERK pathway, inhibits tumor angiogenesis, and induces tumor
cell apoptosis in hepatocellular carcinoma model PLC/PRF/5. Cancer
Res. 66:11851–11858. 2006. View Article : Google Scholar : PubMed/NCBI
|
|
7
|
Gauthier A and Ho M: Role of sorafenib in
the treatment of advanced hepatocellular carcinoma: An update.
Hepatol Res. 43:147–154. 2013. View Article : Google Scholar
|
|
8
|
Pogribny IP and Rusyn I: Role of
epigenetic aberrations in the development and progression of human
hepatocellular carcinoma. Cancer Lett. 342:223–230. 2014.
View Article : Google Scholar :
|
|
9
|
Zhang J, Chen YL, Ji G, Fang W, Gao Z, Liu
Y, Wang J, Ding X and Gao F: Sorafenib inhibits
epithelial-mesenchymal transition through an epigenetic-based
mechanism in human lung epithelial cells. PLoS One. 8:e649542013.
View Article : Google Scholar : PubMed/NCBI
|
|
10
|
Wang S, Zhu Y, He H, Liu J, Xu L, Zhang H,
Liu H, Liu W, Liu Y, Pan D, et al: Sorafenib suppresses growth and
survival of hepatoma cells by accelerating degradation of enhancer
of zeste homolog 2. Cancer Sci. 104:750–759. 2013. View Article : Google Scholar : PubMed/NCBI
|
|
11
|
Salvi A, Conde I, Abeni E, Arici B, Grossi
I, Specchia C, Portolani N, Barlati S and De Petro G: Effects of
miR-193a and sorafenib on hepatocellular carcinoma cells. Mol
Cancer. 12:1622013. View Article : Google Scholar : PubMed/NCBI
|
|
12
|
Grossi I, Arici B, Portolani N, De Petro G
and Salvi A: Clinical and biological significance of miR-23b and
miR-193a in human hepatocellular carcinoma. Oncotarget.
8:6955–6969. 2017.
|
|
13
|
Weber M, Hellmann I, Stadler MB, Ramos L,
Pääbo S, Rebhan M and Schübeler D: Distribution, silencing
potential and evolutionary impact of promoter DNA methylation in
the human genome. Nat Genet. 39:457–466. 2007. View Article : Google Scholar : PubMed/NCBI
|
|
14
|
Johnson WE, Li W, Meyer CA, Gottardo R,
Carroll JS, Brown M and Liu XS: Model-based analysis of
tiling-arrays for ChIP-chip. Proc Natl Acad Sci USA.
103:12457–12462. 2006. View Article : Google Scholar : PubMed/NCBI
|
|
15
|
Parrish RR, Day JJ and Lubin FD: Direct
bisulfite sequencing for examination of DNA methylation with gene
and nucleotide resolution from brain tissues. Curr Protoc Neurosci
Chapter 7. Unit 7.24. 2012. View Article : Google Scholar
|
|
16
|
Ferreira E and Cronjé MJ: Selection of
suitable reference genes for quantitative real-time PCR in
apoptosis-induced MCF-7 breast cancer cells. Mol Biotechnol.
50:121–128. 2012. View Article : Google Scholar
|
|
17
|
Lu M, Ma J, Xue W, Cheng C, Wang Y, Zhao
Y, Ke Q, Liu H, Liu Y, Li P, et al: The expression and prognosis of
FOXO3a and Skp2 in human hepatocellular carcinoma. Pathol Oncol
Res. 15:679–687. 2009. View Article : Google Scholar : PubMed/NCBI
|
|
18
|
Wehler TC, Hamdi S, Maderer A, Graf C,
Gockel I, Schmidtmann I, Hainz M, Berger MR, Theobald M, Galle PR,
et al: Single-agent therapy with sorafenib or 5-FU is equally
effective in human colorectal cancer xenograft - no benefit of
combination therapy. Int J Colorectal Dis. 28:385–398. 2013.
View Article : Google Scholar
|
|
19
|
Seoane J, Le HV, Shen L, Anderson SA and
Massagué J: Integration of Smad and forkhead pathways in the
control of neuroepithelial and glioblastoma cell proliferation.
Cell. 117:211–223. 2004. View Article : Google Scholar : PubMed/NCBI
|
|
20
|
Wettersten HI, Hee Hwang S, Li C, Shiu EY,
Wecksler AT, Hammock BD and Weiss RH: A novel p21 attenuator which
is structurally related to sorafenib. Cancer Biol Ther. 14:278–285.
2013. View Article : Google Scholar : PubMed/NCBI
|
|
21
|
Ha TY, Hwang S, Moon KM, Won YJ, Song GW,
Kim N, Tak E, Ryoo BY and Hong HN: Sorafenib inhibits migration and
invasion of hepatocellular carcinoma cells through suppression of
matrix metalloproteinase expression. Anticancer Res. 35:1967–1976.
2015.PubMed/NCBI
|
|
22
|
Chiang IT, Liu YC, Wang WH, Hsu FT, Chen
HW, Lin WJ, Chang WY and Hwang JJ: Sorafenib inhibits TPA-induced
MMP-9 and VEGF expression via suppression of ERK/NF-κB pathway in
hepatocellular carcinoma cells. In Vivo. 26:671–681.
2012.PubMed/NCBI
|
|
23
|
Yang W, Lv S, Liu X, Liu H, Yang W and Hu
F: Up-regulation of Tiam1 and Rac1 correlates with poor prognosis
in hepatocellular carcinoma. Jpn J Clin Oncol. 40:1053–1059. 2010.
View Article : Google Scholar : PubMed/NCBI
|
|
24
|
Wang W, Yang LY, Yang ZL, Huang GW and Lu
WQ: Expression and significance of RhoC gene in hepatocellular
carcinoma. World J Gastroenterol. 9:1950–1953. 2003. View Article : Google Scholar : PubMed/NCBI
|
|
25
|
Zheng D, Hu Z, He F, Gao C, Xu L, Zou H,
Wu Z, Jiang X and Wang J: Downregulation of galectin-3 causes a
decrease in uPAR levels and inhibits the proliferation, migration
and invasion of hepatocellular carcinoma cells. Oncol Rep.
32:411–418. 2014.PubMed/NCBI
|
|
26
|
Bangoura G, Liu ZS, Qian Q, Jiang CQ, Yang
GF and Jing S: Prognostic significance of HIF-2alpha/EPAS1
expression in hepatocellular carcinoma. World J Gastroenterol.
13:3176–3182. 2007. View Article : Google Scholar : PubMed/NCBI
|
|
27
|
Cervello M, Bachvarov D, Lampiasi N,
Cusimano A, Azzolina A, McCubrey JA and Montalto G: Molecular
mechanisms of sorafenib action in liver cancer cells. Cell Cycle.
11:2843–2855. 2012. View
Article : Google Scholar : PubMed/NCBI
|
|
28
|
Calvisi DF, Ladu S, Gorden A, Farina M,
Conner EA, Lee JS, Factor VM and Thorgeirsson SS: Ubiquitous
activation of Ras and Jak/Stat pathways in human HCC.
Gastroenterology. 130:1117–1128. 2006. View Article : Google Scholar : PubMed/NCBI
|
|
29
|
Yang F, Brown C, Buettner R, Hedvat M,
Starr R, Scuto A, Schroeder A, Jensen M and Jove R: Sorafenib
induces growth arrest and apoptosis of human glioblastoma cells
through the dephosphorylation of signal transducers and activators
of transcription 3. Mol Cancer Ther. 9:953–962. 2010. View Article : Google Scholar : PubMed/NCBI
|
|
30
|
Walter I, Wolfesberger B, Miller I, Mair
G, Burger S, Gallè B and Steinborn R: Human osteosarcoma cells
respond to sorafenib chemotherapy by downregulation of the tumor
progression factors S100A4, CXCR4 and the oncogene FOS. Oncol Rep.
31:1147–1156. 2014.PubMed/NCBI
|
|
31
|
Gedaly R, Angulo P, Chen C, Creasy KT,
Spear BT, Hundley J, Daily MF, Shah M and Evers BM: The role of
I3K/mTOR inhibition in combination with sorafenib in hepatocellular
carcinoma treatment. Anticancer Res. 32:2531–2536. 2012.PubMed/NCBI
|
|
32
|
Zhang CZ, Wang XD, Wang HW, Cai Y and Chao
LQ: Sorafenib inhibits liver cancer growth by decreasing mTOR, AKT,
and I3K expression. J BUON. 20:218–222. 2015.PubMed/NCBI
|
|
33
|
Kulis M, Queirós AC, Beekman R and
Martín-Subero JI: Intragenic DNA methylation in transcriptional
regulation, normal differentiation and cancer. Biochim Biophys
Acta. 1829:1161–1174. 2013. View Article : Google Scholar : PubMed/NCBI
|
|
34
|
Irizarry RA, Ladd-Acosta C, Wen B, Wu Z,
Montano C, Onyango P, Cui H, Gabo K, Rongione M, Webster M, et al:
The human colon cancer methylome shows similar hypo- and
hypermethylation at conserved tissue-specific CpG island shores.
Nat Genet. 41:178–186. 2009. View
Article : Google Scholar : PubMed/NCBI
|