Introduction
Phosphorylation of tyrosine is one of the most
common post-translational modifications of proteins. It plays a
special role in the modulation of the dynamics of protein function
and is essential for signal transduction in the cell (1). Receptor tyrosine kinases (RTKs) are a
large superfamily of proteins including many of those involved in
tumorigenesis, such as EGFR or SRC (2). These receptors are targets for extra
cellular ligand molecules that trigger receptor activation and
downstream signal transduction. This class of receptors is
negatively regulated by protein phosphatases (3). They are large functional class of
approximately 140 human proteins that evolved from distinct genes
and differ in enzymatic mechanisms (3). They are historically divided, based
on substrate specificity into two classes, protein Ser/Thr
phosphatases and protein tyrosine phosphatases (PTPs) (3). Receptor protein tyrosine phosphatases
(RPTPs) are the class of PTPs that besides the tyrosine phosphatase
domains possess CAM-like extracellular regions anchoring these
proteins at cell membrane. Twenty-one RPTPs encoded by human genome
play a role in variable cellular processes (4).
In cancer cells, stimulation of oncogenic RTKs is a
key element for activating the variable cancer-related processes
involving cell proliferation or angiogenesis (2) and therefore receptor PTPs have been
considered by default as potential tumor suppressors (5,6).
Studies that have focused on colorectal cancer (CRC) show the
suppressive role of some RPTPs including PTPRT (7) and PTPRJ (6,8). In
CRC, somatic frameshift DNA mutations have been found in different
genes encoding this class of proteins: PTPRT, PTPRF, PTPRG
(9) as well as in PTPRA,
PTPRE and PTPRS (10),
whereas deletions were observed in PTPRJ (11). Genes encoding receptor PTPs were
also observed to be affected by aberrant epigenetic regulation.
CRC-related promoter DNA hypermethylation was found in PTPRG
(12) PTPRD (13) as well as in PTPRM, PTPRT,
PTPRR and PTPRZ1 (14).
In contrast to most RPTPs, PTPRH, which is also
known as stomach cancer-associated protein tyrosine phosphatase-1
(SAP-1), is found to be overexpressed in CRC (15) and is suggested to act as an
oncogenic factor (5). This
observation is somewhat inconsistent with the fact that this PTP is
closely similar to the structure of PTPRJ, which is a
well-documented tumor suppressor that binds to EGFR, and plays a
role in MAPK regulation as well as PKB/AKT signaling (6,8).
Functional experiments on PTPRH activity also suggest that its role
is rather suppressive than oncogenic (16,17).
Our study was provoked because in previous mRNA
expression genome-wide profiling of colorectal normal mucosa
samples, adenomas and CRCs, PTPRH was found among genes
notably downregulated in tumor tissue, contrary to previously
reported overexpression (18). We
measured mRNA and protein expression levels in normal mucosa,
adenoma and cancer samples as well as in CRC cell lines by qRT-PCR
and immunohistochemistry (IHC) and sought for a role of aberrant
epigenetic regulation in PTPRH downregulation.
Materials and methods
Patients and tissue samples
Gene expression analysis by quantitative qRT-PCR was
performed on fresh frozen tissue samples obtained from 26 CRC
patients, 24 samples of corresponding normal mucosa sections and 42
colorectal adenoma samples. Cryostat sections were prepared from
each specimen using a Microm HM 505E (Zeiss) and upper and lower
sections from each cryosection set were evaluated by a pathologist
for relative cell type content.
Formalin-fixed and paraffin-embedded tissue from 24
CRC and 12 AD samples was used for DNA isolation and DNA
methylation assessment, whereas 14 of the CRC samples with matched
normal colonic mucosa sections, along with 10 AD samples, were used
for immunohistochemical evaluation.
Ten additional samples of non-neoplastic colonic
epithelia obtained from normal tissue areas on the margins of
resected colorectal tumors were collected from 10 anonymous
patients by scraping the colonic epithelial layers with plastic
swab sticks. The samples were used for DNA isolation and served as
controls in DNA methylation analysis.
Clinical tissue specimens were collected at the
Maria Sklodowska-Curie Memorial Cancer Center and Institute of
Oncology in Warsaw in accordance with local ethics committee
approval and individual patients' informed consent. Patient
characteristics are presented in Table
I.
 | Table IPatient characteristics. |
Table I
Patient characteristics.
|
Characteristics | Expression
qRT-PCR | Expression IHC | DNA methylation
pyrosequencing |
|---|
| Cancer
patients |
| Number of
patients | 26 | 14 | 24 |
| Sex (no. of
patients) | | | |
| Male | 11 | 6 | 10 |
| Female | 15 | 8 | 14 |
| Age (years) | | | |
| Range | 38–82 | 38–78 | 38–82 |
| Median | 64 | 67 | 63.5 |
| Astler-Coller's
stage (no. of patients) |
| B1 | 4 | 3 | 4 |
| B2 | 15 | 8 | 13 |
| B3 | 7 | 3 | 7 |
| Adenoma
patients |
| Number of
patients | 42 | 12 | 12 |
| Sex (no. of
patients) | | | |
| Male | 25 | 6 | 6 |
| Female | 17 | 6 | 6 |
| Age (years) | | | |
| Range | 41–83 | 42–80 | 42–80 |
| Median | 60 | 61.5 | 61.5 |
| Size (mm) | | | |
| Range | 9–50 | 10–50 | 10–50 |
| Median | 15 | 16 | 16 |
| Histopathology
(no. of patients) |
| Tubular AD | 29 | 5 | 5 |
| Tubulo-villous
AD | 13 | 7 | 7 |
| Normal mucosa |
| Number of
samples | 24 | 14 | 10 |
| Sex (no. of
patients) | | | |
| Male | 11 | 6 | 6 |
| Female | 13 | 8 | 4 |
| Age (years) | | | |
| Range | 38–82a | 38–78 | 43–80 |
| Median | 62a | 67 | 59 |
Cell lines culture and
5-aza-2′-deoxycytidine (5-aza-dC) treatment
HCT 116 and HT29 cell lines were cultured in McCoy's
5A medium (Sigma-Aldrich Inc., St. Louis, MO, USA) supplemented
with 10% fetal bovine serum. SW480 and COLO-205 cell lines were
cultured in RPMI-1640 medium (Sigma-Aldrich Inc.) supplemented with
5% and 10% fetal bovine serum, respectively. The Caco-2 cell line
was cultured in MEM medium (Sigma-Aldrich Inc.) supplemented with
20% fetal bovine serum (Gibco). All culture media contained 1%
antibiotics (PenStrep, Gibco). Cell culture was performed at 37°C
in a humidified 5% CO2 atmosphere. The cells were grown
in culture medium until 50% confluence and subsequently treated
with 0, 2.5, 5 and 10 µM 5-aza-2′-deoxycytidine (Abcam,
Cambridge, MA, USA) for 3 days. The medium containing 5-aza-dC was
refreshed daily.
Real-time PCR expression assessment
Relative PTPRH expression was assessed with qRT-PCR
with respect to MIQE guidelines (19). Total RNA from tissue samples and
cell lines was isolated using RNeasy Mini (Qiagen) and quantified
with NanoDrop 2000 Spectrophotometer (Thermo Fisher Scientific,
waltham, MA, USA). RNA samples were checked for quality on the
Agilent 2100 Bioanalyzer and samples with RIN >7 were included.
Each RNA sample (1 µg) was subjected to reverse
transcription with SuperScript II Reverse Transcriptase
(Invitrogen) using both random hexamer and oligo dT, according to
manufacturer's protocol. qRT-PCR was carried out using a 384-well
format and an Applied Biosystems 7900HT Fast Real-time PCR System
(Applied Biosystems) with Sensimix SYBR kit (Bioline), according to
manufacturers' instructions in a volume of 5 µl. RT-qPCR was
performed using the following cycling conditions: 95°C for 10 min
followed by 40 cycles of 95°C for 15 sec and 60°C for 45 with
subsequent dissociation curve protocol. ACTB (β-actin) was
selected as a reference gene after a previous evaluation of 4
potential reference genes: ACTB, UBC, RPLPO, GAPDH with
GeNorm software (20). The
standard curves based on amplifying known cDNA template
concentrations were used for assessment of PCR efficiency and
linear dynamic range. Normalized PTPRH expression was
calculated using Q-gene software (21). Primer sequences are listed in
Table II.
| Table IISequences of PCR primers. |
Table II
Sequences of PCR primers.
| Gene symbol | PCR primer sequence
5′→3′ | Amplicon
length | Chromosome region
coverage/transcription variant specificitya |
|---|
| qRT-PCR | | | |
| PTPRH | F:
ATGAAGGTCGTGTCTCACTC | 117 bp |
NM_002842.4
NM_001161440.2 |
| R:
CAGGAAGAAAATCAGCAGGC |
| ACTB | F:
AGAGCTACGAGCTGCCTGAC | 124 bp | NM_001101.3 |
| R:
AAGGTAGTTTCGTGGATGCC |
| Pyrosequencing | | | |
| PTPRH 1st
exon/5′ UTR | F:
TTGGTAAAGGGGAAATTTTTGAGTGTAA | 187 bp |
chr19:55720703-55720889 |
| R:
biot-CCTAAAAATCCCTACCTTAAAAAC |
| S:
TGGGATTTTTGGGTT |
| PTPRH 5′
promoter | F:
biot-AGTTTTAGGTTGTTTTTGATGTGTGATTAT | 215 bp |
chr19:55721009-55721223 |
| R:
CTAAAAATACCTCCCATCCTTTCT |
| S:
AACCCACTCCACTTT |
| Chip assay | | | |
| PTPRH
promoter | F:
CTTCCACCTGCTGGACTT TA | 99 bp |
chr19:55720845-55720943 |
| R:
GTTCCACTTCCTCCTCCT C |
| PTPRH exon
20 | F:
CCAGACCCAAATTCCTTC CT | 76 bp |
chr19:55692800-55692875 |
| R:
TCCCTAGGTCTTTCCAGG AT |
| ACTB
promoter | F:
ACGCCTCCGACCAGTGTT | 73 bp |
chr7:5569393-5569465 |
| R:
GCCCAGATTGGGGACAAA |
| HBB
promoter | F:
GCAATAGATGGCTCTGCCCT | 132 bp |
hr11:5248304-5248435 |
| R:
GACAGGTACGGCTGTCATCA |
Immunohistochemistry
Immunohistochemical staining was performed on
4-µm formalin-fixed, paraffin-embedded tissue sections of
CRCs and matched normal mucosa from 14 patients as well as 14
colorectal adenomas using the Envision Detection System (Dako).
Sections were deparaffinized with xylene and rehydrated in a series
ethanol solutions of decreasing concentration. Heat-induced epitope
retrieval was carried out in a Target Retrieval Solution pH 9.0
(Dako) in a 96°C water bath, for 20 min. After cooling the
retrieval solutions for 25 min at room temperature, the slides were
treated for 5 min with a Blocker of Endogenous Peroxidase (Dako).
Slides were incubated with polyclonal antibody (Ab) against PTPRH
(PA5-31340, dilution 1:200) (Thermo Fisher Scientific) for 30 min
at room temperature and subsequently labelled with the Envision
Detection System (Dako). The color reaction product was developed
with 3,3′-diaminobenzidine, tetrahydrochloride (Dako) as a
substrate, and nuclear contrast was achieved with hematoxylin
counterstaining. Staining intensity was assessed by a four-grade
scale: 0, lack of expression; 1, weak expression; 2, moderate
expression; and 3, strong expression. The stained tissue slides
were examined by the pathologist who was blinded to the qRT-PCR
results.
Western blotting
Cell pellets were resuspended in ice-cold RIPA
buffer, incubated for 30 min in 4°C and centrifuged at 12500 rpm
for 20 min at 4°C. Samples were resolved using SDS-PAge and
electrotransferred to polyvinylidene fluoride membranes (EMD
Millipore). PTPRH was detected with polyclonal anti-PTPRH Ab
(Pierce PA5-31340 PTPRH Rabbit polyclonal Ab, Pierce; Thermo Fisher
Scientific), and a secondary Ab conjugated to HRP (#31460, Pierce;
Thermo Fisher Scientific). Detection of β-actin with mouse HRP
conjugated mAb (8H10D10) (Cell Signalling, #12262) served as
control. Detection was performed by the enhanced chemiluminescence
method (Pierce; Thermo Fisher Scientific).
DNA methylation analysis
DNA methylation levels of two 5′ PTPRH
regions [−190 to −253 upstream and +57 to +147 downstream from
transcription start site (TSS)] were measured in CRC cell lines as
well as in 14 CRC, 14 AD and 10 normal mucosa samples (obtained
from swabs of normal colon epithelium) using the pyrosequencing
assay according to the published protocol (22). DNA was isolated with the QIAamp DNA
Mini kit (Qiagen) and bisulfite converted using the EpiTect kit
(Qiagen), according to manufacturer's instructions. The PCR
reaction was performed in a 30 µl mixture containing 1X PCR
buffer, 2 mM MgCl2, 0.25 mM dNTPs, 0.2 µM of each
primer, 0.5 units of FastStart DNA Polymerase (Roche Applied
Science) under the following conditions: 94°C for 3 min, with
subsequent 40 cycles of 30 sec at 94°C, 30 sec at the annealing
52°C temperature and 30 sec at 72°C and final elongation for 7 min
at 72°C. The primer sequences are listed in Table II.
The PCR products were purified and analyzed using
the PyroMark Q24 System (Biotage AB, Uppsala, Sweden), according to
manufacturer's instructions. For every particular sample the
average methylation level of all CpGs within each analyzed region
was calculated and used for comparing the sample groups.
Chromatin immunoprecipitation (ChIP)
assay
The cells were cross-linked for 10 min at room
temperature by adding formaldehyde directly to culture medium
(final concentration 1%), then formaldehyde was quenched at room
temperature for 5 min with glycine at 125 mM concentration. Fixed
cells were suspended in 100 µl of hypotonic buffer A with
NP-40 detergent (10 mM HEPES pH 7.9, 2 mM MgCl2, 2 mM
KCl, NP-40 0.5%) supplemented with protease and phosphatase
inhibitors (Thermo Fisher Scientific; 78441) and incubated on ice
for 5 min followed by centrifugation at 2000 rpm for 5 min in 4°C.
Next, nuclei pellets were resuspended in lysis buffer (12.5 mM
Tris-HCl, pH 8.0; 2.5 mM EDTA; 0.25% SDS) containing protease and
phosphatase inhibitors (Thermo Fisher Scientific; 78441). Chromatin
was sheared in a Bioruptor Plus (Diagenode) using the following
protocol: 30 sec on-off cycles for 10 min at high intensity. ChIP
assays were done using the Matrix-ChIP on polypropylene plates
(23). ChIP DNA data were
expressed as percent of input DNA, or as the ratio of modified
histone to total histone H3 (24).
The following antibodies were used in ChIP assay: non-specific
rabbit IgG (I-1000, Vector Laboratories), Pol2 (4H8) (Santa Cruz;
sc-47701), Histone H3 (Abcam, ab1791), H3K4me3 (Diagenode;
pAb-003-050), H3K27me3 (Millipore, 07-449). PCR primers for
PTPRH promoter and 3′ regions (exon 20) were used as well as
primers for two control promoter regions of transcriptionally
active (ACTB) and inactive (HBB) genes. Primer
sequences are listed in Table
II.
Statistical analysis
Gene expression values and DNA methylation levels
were compared using the two-sided Mann-whitney U test. A
significance threshold level of α=0.05 was adopted. Data were
analyzed and visualized by GraphPad Prism (GraphPad Software).
Microarray data stored in the Gene Expression Omnibus (GEO) were
analyzed using GEO2R, being an interactive web tool integrated into
the GEO service (25).
Results
PTPRH Expression in tissue samples
We searched for tumor specific expression changes of
all genes encoding different RPTPs in our previously reported
microarray transcriptome data for normal and neoplastic colorectal
tissues (18). We found that
PTPRH mRNA had the most reduced expression in CRC of all
genes encoding RPTPs with a fold change (FC) of expression at −5.32
(Table III).
| Table IIIThe comparison of expression levels
of genes encoding PTPRs in colorectal cancer, adenoma and normal
colonic mucosa based on previous microarray transcriptome profiling
(14). |
Table III
The comparison of expression levels
of genes encoding PTPRs in colorectal cancer, adenoma and normal
colonic mucosa based on previous microarray transcriptome profiling
(14).
| Gene | Probset
(Affymetrix U133) | NM vs.
CRC
(fold change) | NM vs. AD
(fold change) |
|---|
| PTPRH | 208300_at | −5.32 | −3.83 |
| PTPRF | 200635_s_at | −3.11 | −1,69 |
| PTPRR | 206084_at | −2.57 | −9.75 |
| PTPRO | 211600_at | −2.28 | No difference |
| PTPRCAP | 204960_at | −1.82 | −1.99 |
| PTPRJ | 227396_at | −1.8 | No difference |
| PTRF | 1557938_s_at | 1.92 | No difference |
| PTPRG | 204944_at | 2.98 | 3.07 |
| PTPRS | 229465_a_at | No difference | −1.67 |
| PTPRD | 205712_at | No difference | 2.07 |
Consistent with this are the comparisons of
PTPRH expression in normal colonic samples and CRC in 5
different datasets from the GEO database (26–29)
that uniformly showed a significant decrease of PTPRH
expression in cancer sections (GSE40967 logFC=−2.18; GSE25070:
logFC=−1.4; GSE44076 logFC=−2.79; GSE21510 logFC=−2.97; GSE32323
logFC=−2.4).
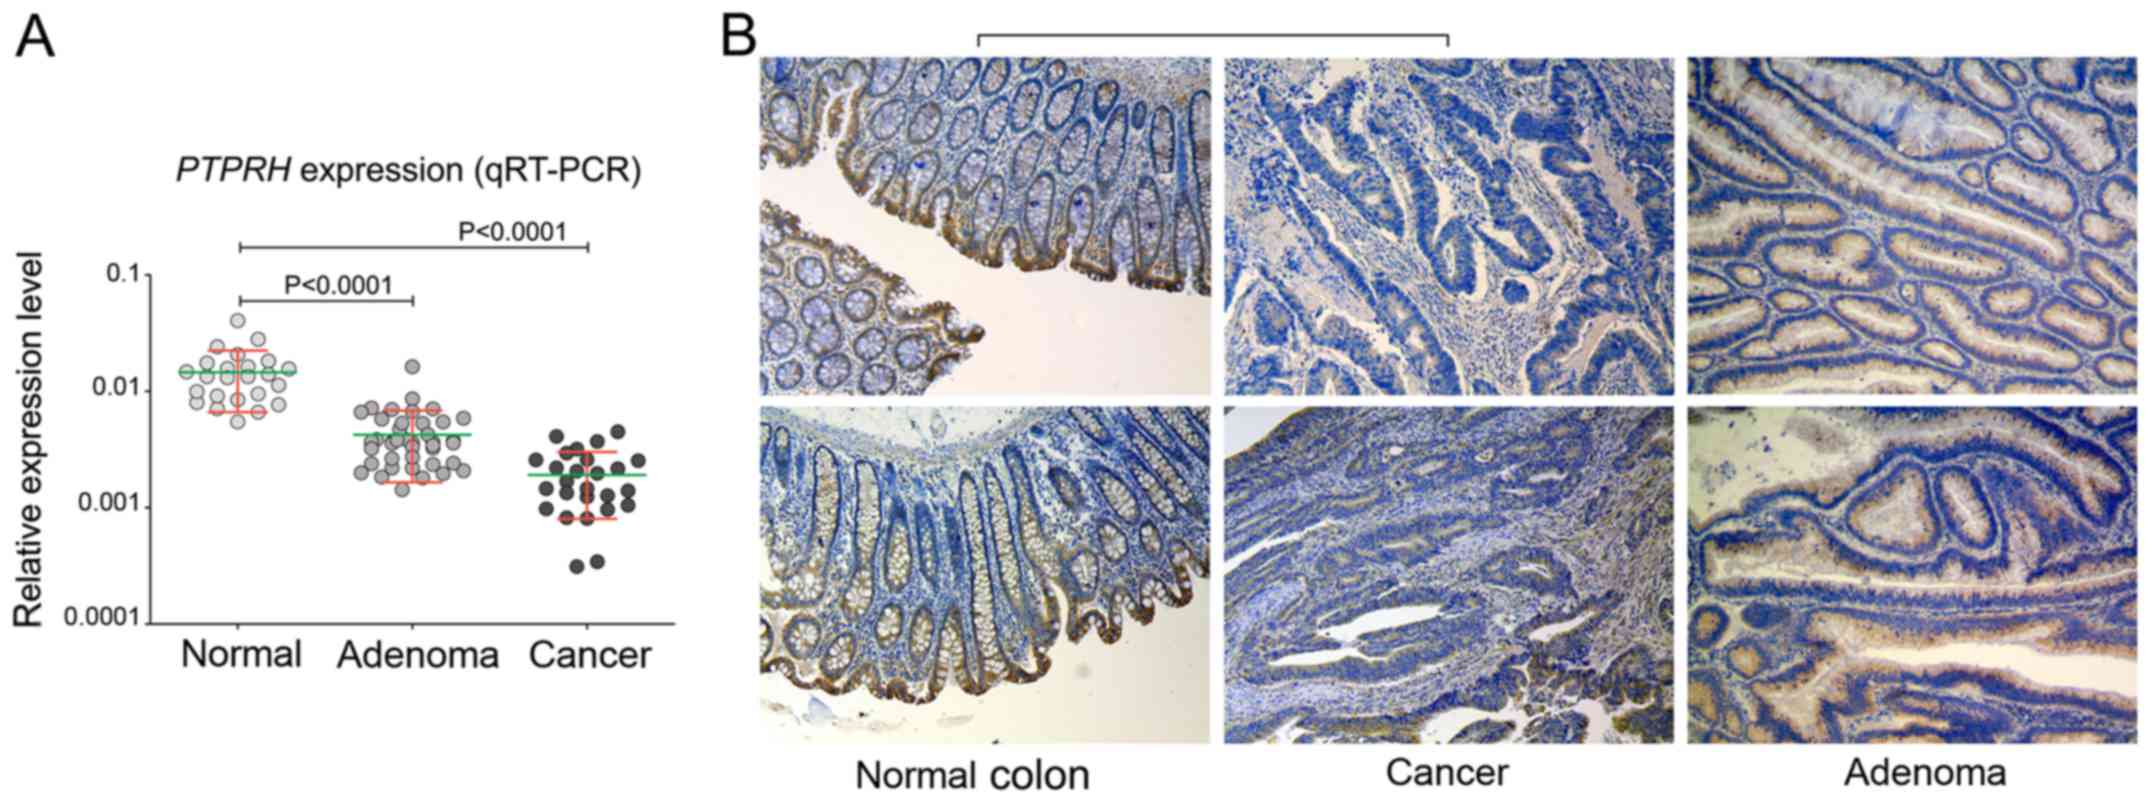
Validating PTPRH expression by qRT-PCR on 24
normal colonic mucosa samples, 46 AD and 26 sections of CRC
confirmed a stepwise decrease in mRNA expression through the
adenoma-carcinoma sequence (Fig.
1). A significant (P<0.0001) downregulation with a FC=−3.4
and FC=−7.6 was observed when normal samples were compared to
adenoma and cancer samples, respectively (Fig. 1A).
A subsequent analysis of PTPRH protein expression
was performed by immunohistochemical staining of 14 paired
CRC/normal mucosa samples and 10 adenomas. Generally, the highest
protein expression was observed in the normal mucosa of the colon.
The protein was observed in the cytoplasm and membrane of colonic
epithelial layer and was clearly polarized. Strong immunoreactivity
was observed in cells of the apical epithelium layer and those of
the crypt lumen, while in epithelial cells located at the site of
lamina muscularis the expression was visibly lower (Fig. 1B). PTPRH expression was lower in
each CRC section as compared to corresponding normal mucosa
(Fig. 1B). Immunoreactivity was to
some extent deceased in adenomas compared to normal tissue,
however, this was not so pronounced when CRCs were compared with
normal samples (Fig. 1B). In 7
sections of normal mucosa, PTPRH expression was assessed as strong
and in 7 sections as moderate, whereas it was scored as moderate,
low and undetected in 5, 8 and 1 of CRC samples, respectively. In
adenomas, PTPRH expression was high, moderate and low in 1, 7 and 4
samples, respectively.
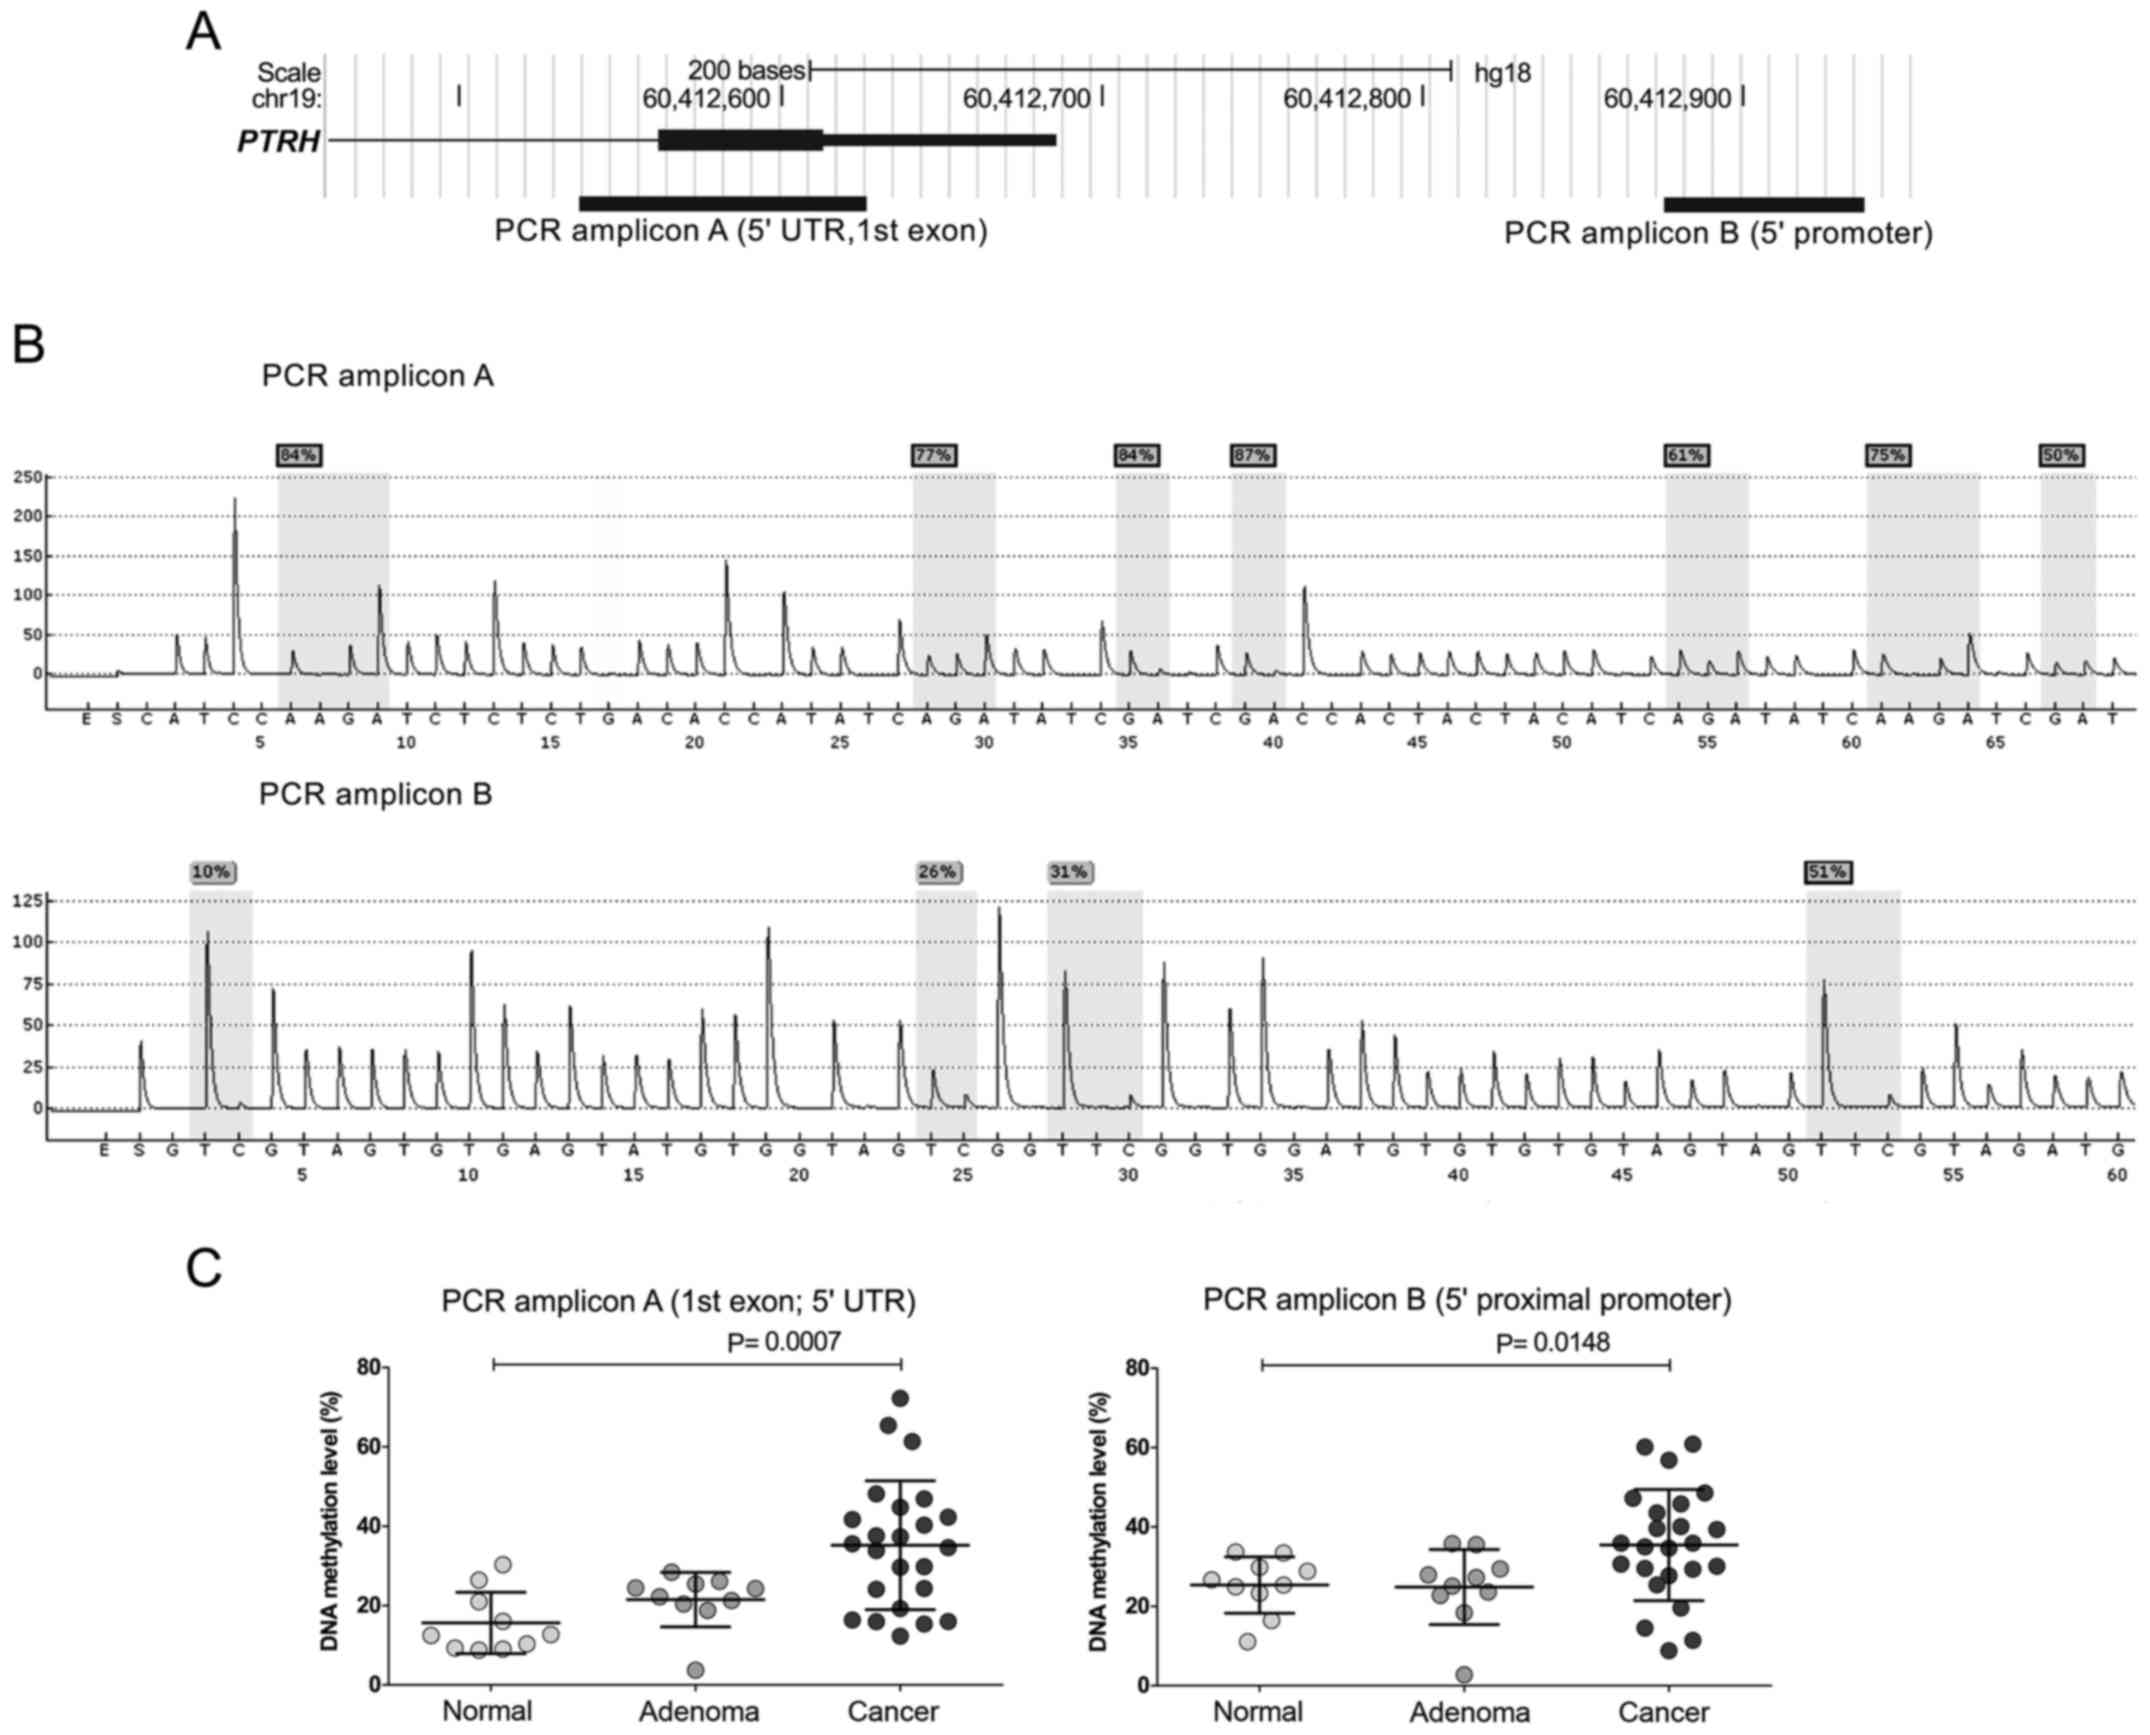
Promoter DNA methylation analysis
DNA methylation was assessed in two PTPRH 5′
regions, including the upstream promoter and 5′ UTR/1 exon sequence
with pyrosequencing in normal mucosa, AD and CRC samples. Cancer
samples demonstrated significantly higher DNA methylation levels
for both analyzed 5′ gene regions when compared to normal tissue
samples (mean 35.21% and 31% vs. 15.62% and25.35%; P=0.0007 and
P=0.00148, respectively). Adenomas and normal samples showed
comparable DNA methylation levels (Fig. 2).
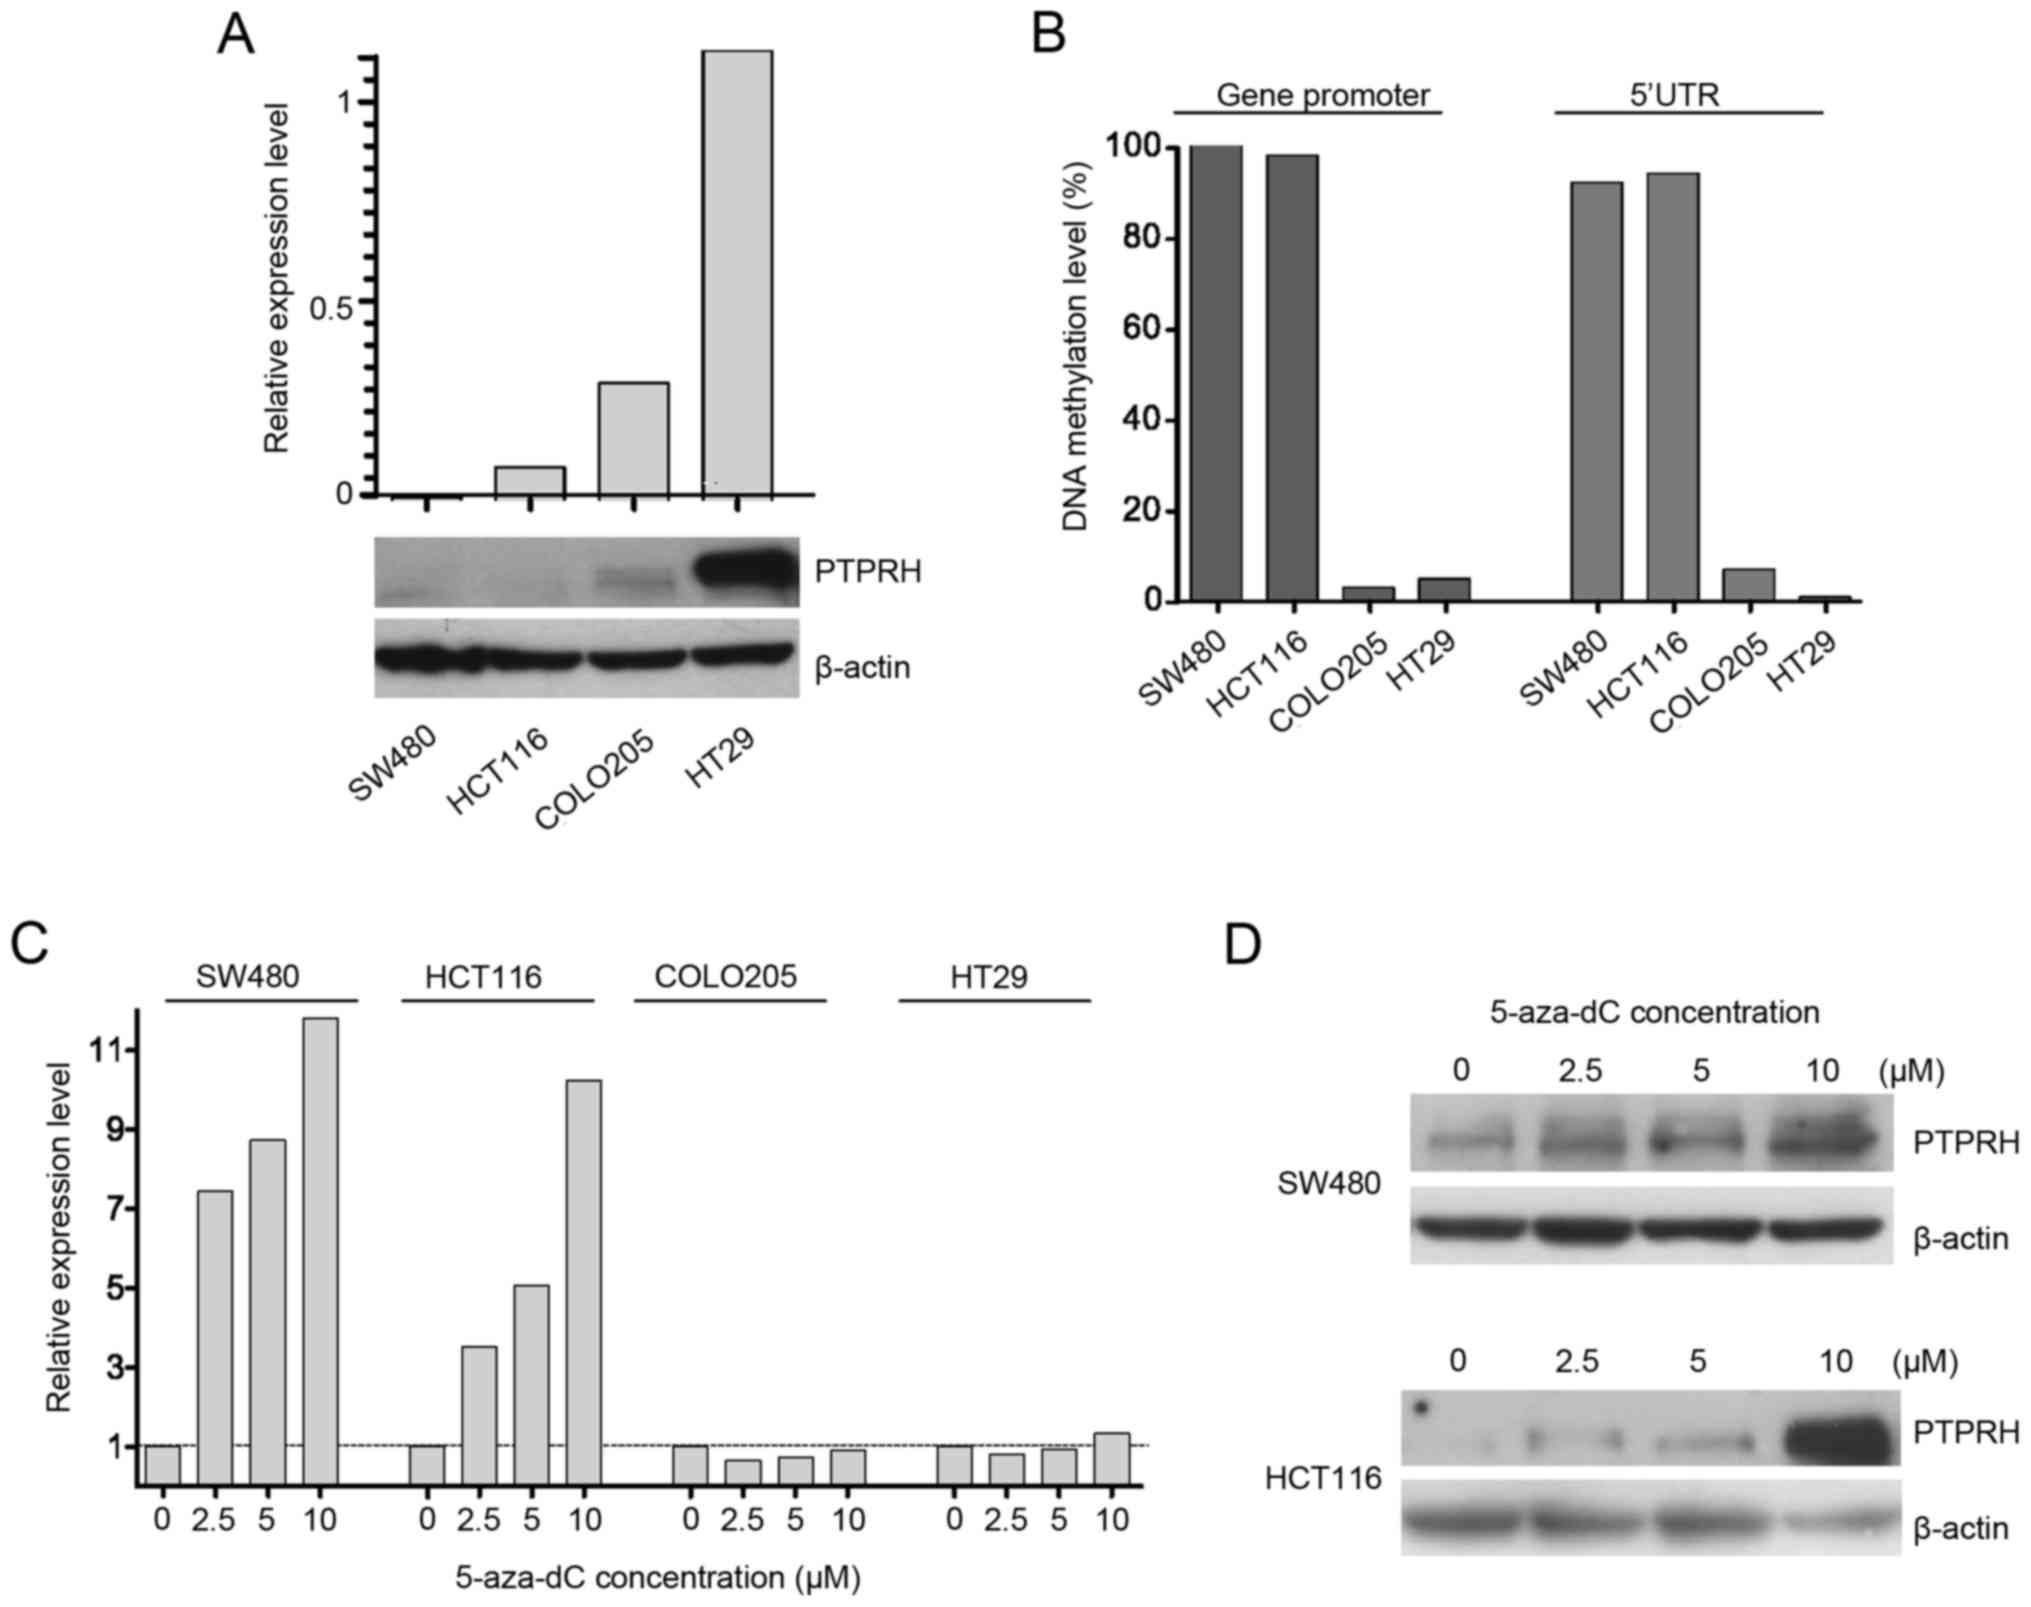
PTPRH DNA methylation as well as gene and
protein expression were assessed in four colorectal cancer cell
lines: SW480, HCT116, COLO205 and HT29. qRT-PCR analysis showed
variable expression level of PTPRH in these cell lines, with
the highest expression in HT29, moderate in COLO205, low in HCT116
and very low in SW480. The mRNA levels closely correspond to PTPRH
protein levels in four cell lines as detected by western blot
analysis (Fig. 3A).
Analyzing DNA methylation patterns with
pyrosequencing showed that gene/protein expression levels were
related to methylation levels. The highest and almost complete DNA
methylation was observed in both cell lines with low PTPRH
levels; SW480 and HCT116. In contrast, COLO205 and HT29 cells
demonstrating higher gene expression presented low DNA methylation
(Fig. 3B).
These four cell lines were cultured in the presence
of DNA methyltrasferases' inhibitor 5-aza-dC. A stepwise gradient
of four concentrations 0, 2.5, 5 or 10 µM of 5-aza-dC was
used in culture. The increased PTPRH expression was observed
in SW480 and HCT116, but not in the cell lines that lack DNA
methylation at the PTPRH (Fig.
3C). The increased expression after 5-aza-dC treatment was also
observed at protein level (Fig.
3D). However, the expression in treated SW480 was still low and
required long exposure time when detected with western
blotting.
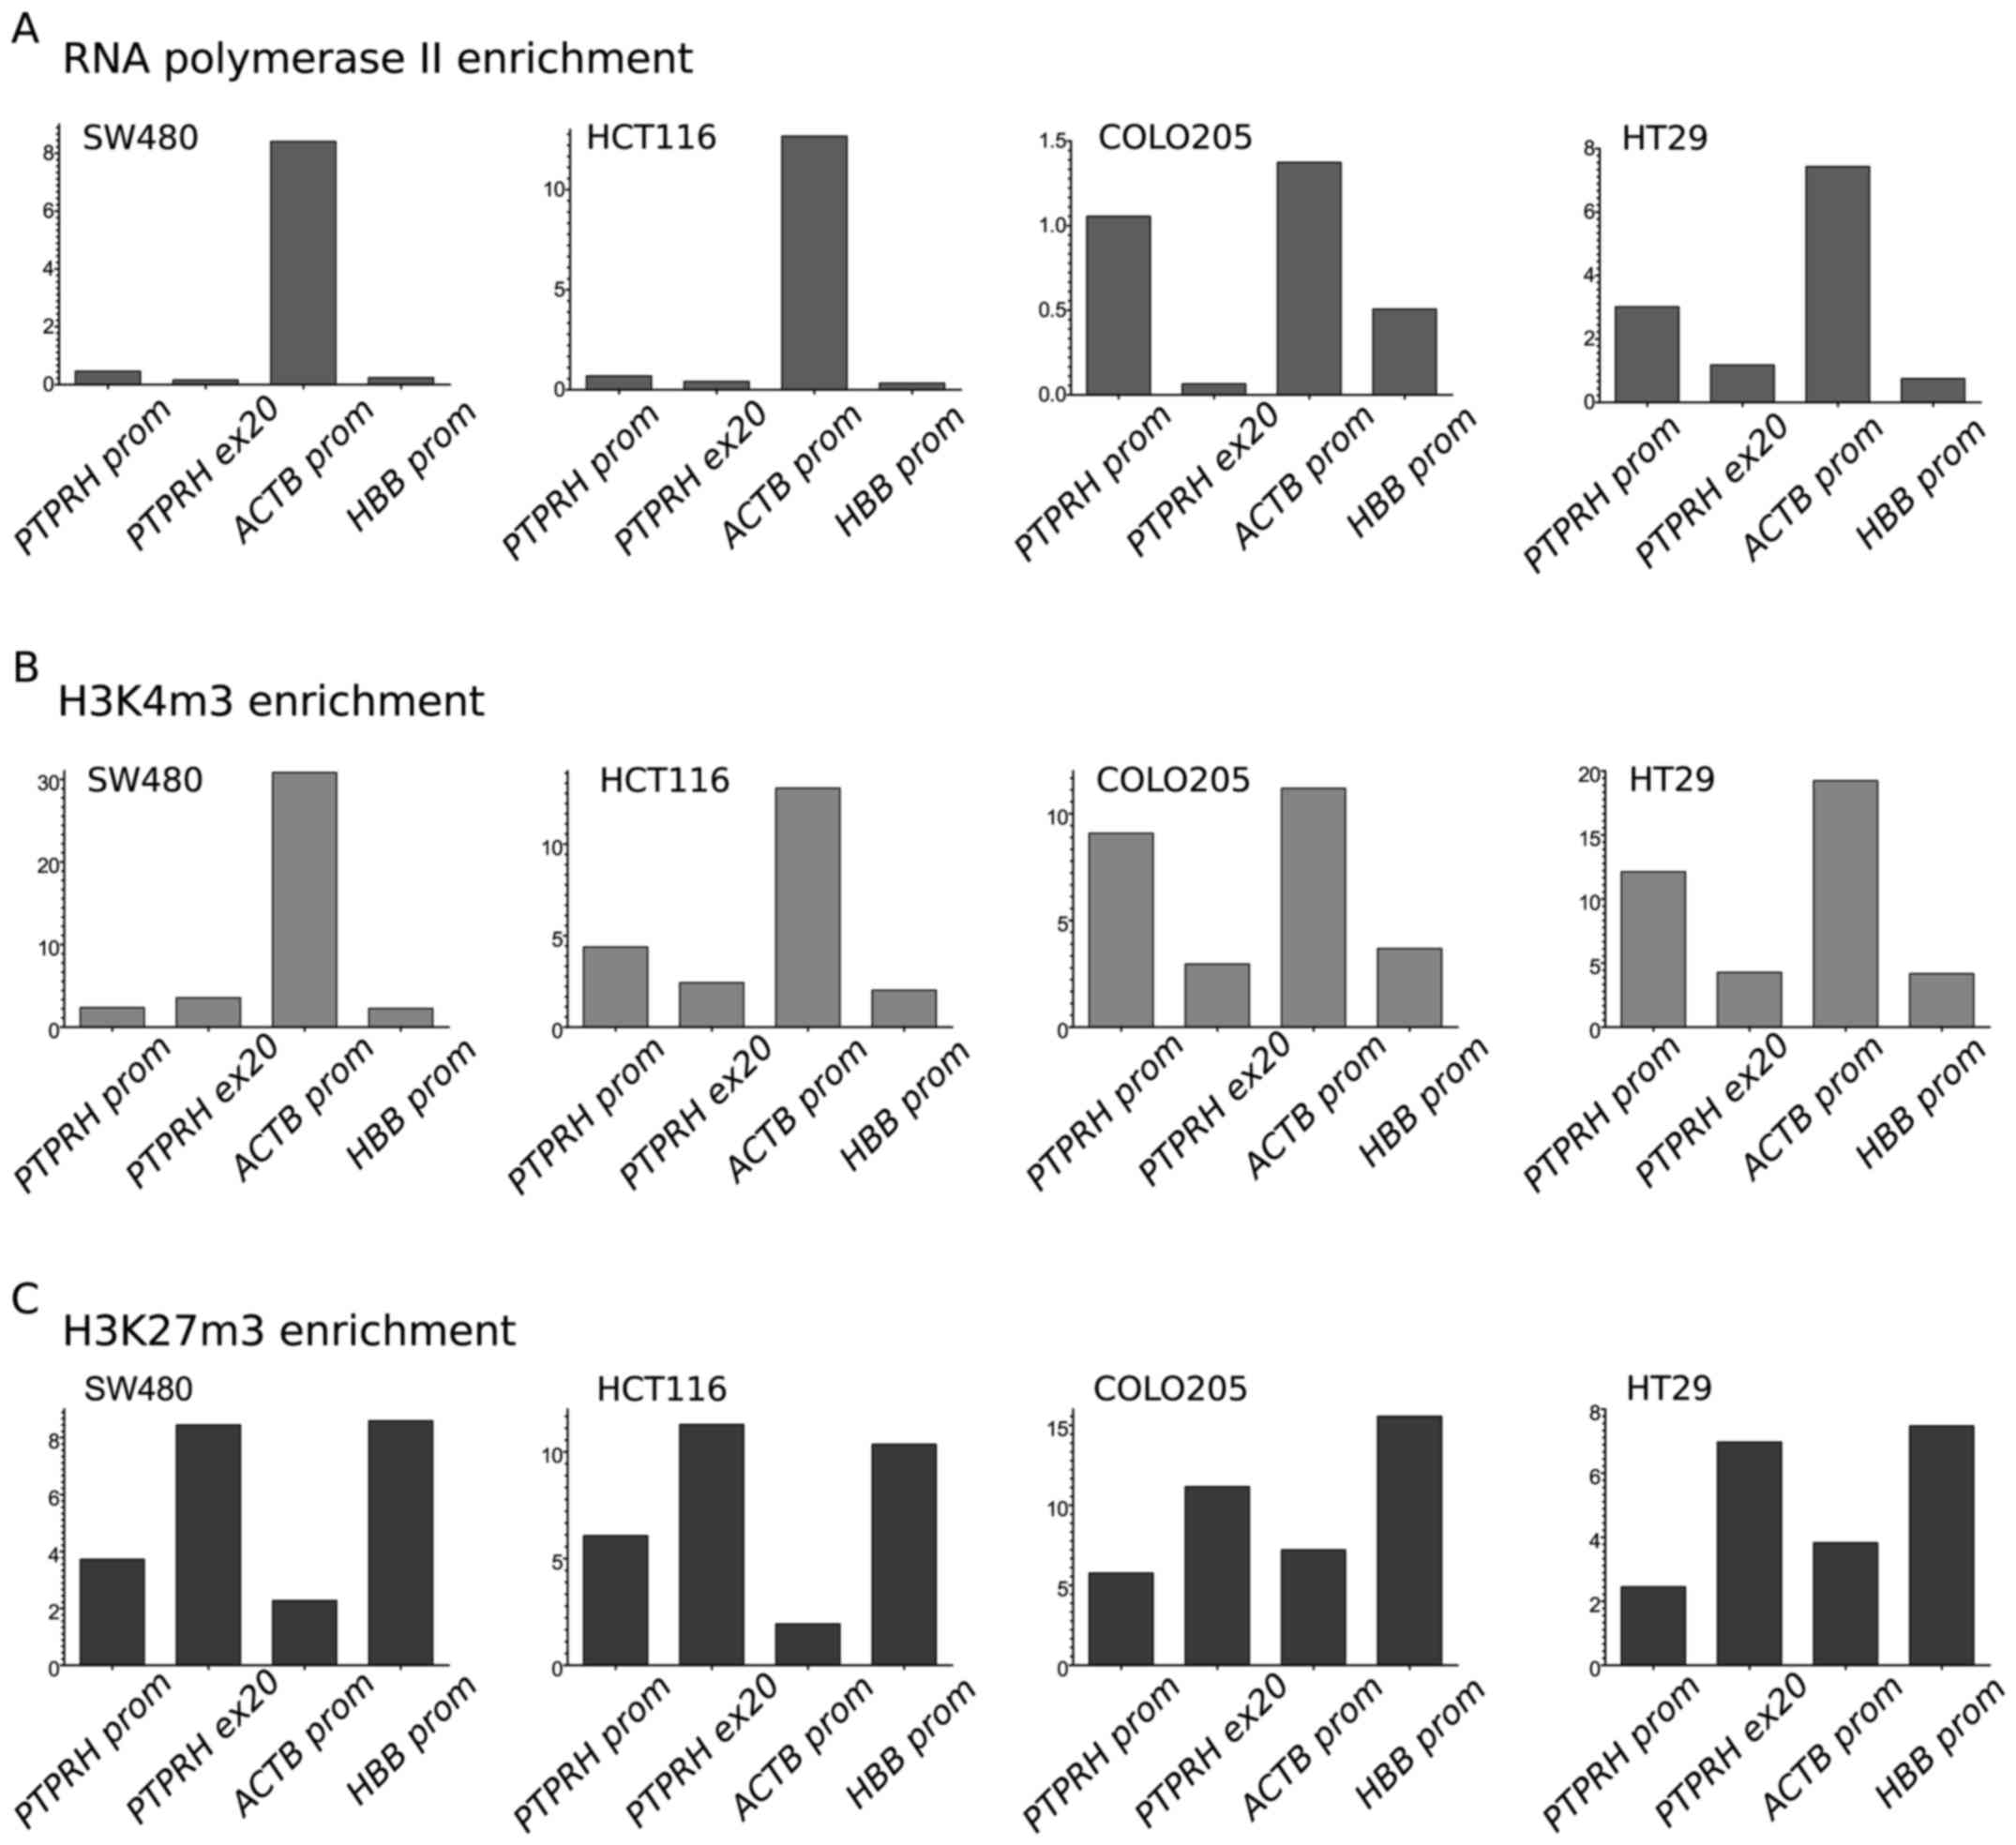
Chromatin modifications at PTPRH
promoter
Using chromatin immunoprecipitation, we measured the
concentration of RNA II polymerase (Pol2) as well as trimethylation
levels of both K4 of histone H3 (H3K4m3, the established marker of
transcriptionally active chromatin) and K27 of histone H3 (H3K27m3,
the marker of inactive chromatin) at the PTPRH promoter and
3′ region of this gene (exon 20) in 4 CRC cell lines. For
comparison, the level of immunoprecipitation was also assessed for
the ACTB promoter (transcriptionally active, β-actin gene)
and HBB promoter (transcriptionally inactive, hemoglobin
gene).
The pattern of Pol2 and selected histone
posttranslational modifications at the gene promoter corresponded
to expression and methylation status. A relatively high Pol2
concentration was observed in the PTPRH promoter region for
HT29 and COLO205, i.e. in both cell lines lacking DNA methylation
and characterized by high expression. A low Pol2 level was detected
at the PTPRH promoter in HCT116 and SW480 that corresponds
to the low gene expression (Fig.
4A).
The level of H3K4m3 at the PTPRH promoter,
but not 3′ region, also clearly corresponded to expression and
methylation status. High levels of this modification were observed
in HT29 and COLO205, whereas low levels and no enrichment were seen
in HCT116 and SW480 (both with the methylated gene promoter)
(Fig. 4B). In contrast, the level
of H3K27m3 at the PTPRH promoter showed no enrichment in
HT29 and COLO205 and somewhat higher levels in HCT116 and SW480.
H3K27m3 levels were high at 3′ gene regions in all the cell lines
(Fig. 4C).
Discussion
The balance between protein tyrosine kinase (PTK)
activities and that of protein tyrosine phosphatases (PTPs) is the
basis for regulation of intercellular signaling pathways. A lack of
this balance affects basic cellular functions: proliferation,
adhesion and migration and it plays a role in the pathogenesis of
cancer. As a general mechanism, receptor phosphorylation triggers
the signaling pathway and results in phosphorylation of the
downstream proteins. In turn, protein phosphatases remove phosphate
groups and mute signaling. Most proteins of this family are
downregulated in cancer by genetic/epigenetic mechanisms (5,10,14,30).
However, an oncogenic role of PTPs has also been documented
(5).
Of note, PTPRH was previously observed to be
expressed in certain CRC derived cell lines and upregulated in CRC
tissue from patients, as detected by immunohistochemical staining.
In contrast to previous results, we found this gene to be one of
the significantly downregulated ones in colorectal tumor compared
to normal colonic mucosa. PTPRH down regulation was
uniformly observed in five independent datasets of the acquired
microarray data. qRT-PCR results confirmed a stepwise decrease of
PTPRH expression in AD and CRC sections. Using IHC, we
observed that PTPRH is expressed in normal colonic epithelium and
the expression pattern has a certain asymmetry in the epithelium
cross-section, as previously described (31). Protein expression is low at the
lateral border but highest at the apical surface of the epithelial
layer in the enterocytes that form the brush border. Contrary to
that previously reported, our immunohistochemical staining
confirmed decreased PTPRH expression in cancer sections compared to
matched normal colonic samples.
Epigenetic mechanisms and DNA methylation may
contribute to tumor-specific gene downregulation and were
previously found to be involved in silencing different RPTPs
encoding genes in CRC (32). We
assessed DNA methylation levels at the 5′ region of PTPRH in
a series of CRC, AD and normal mucosa samples and found increased
DNA methylation levels in tumor samples that corresponded with a
decrease in gene expression. The effect of DNA methylation at the
PTPRH promoter on gene expression was further investigated
in CRC cell lines. When two CRC cell lines SW480 and HCT116,
characterized by low PTPRH expression and high methylation
of the gene 5′ region, were treated with DNA methylation inhibitor
(5-aza-dC), we observed increased gene expression levels. Such an
effect was not observed in two cell lines with higher PTPRH
expression and an unmethylated promoter. Such results confirm that,
similarly to other genes from the PTP family, aberrant epigenetic
regulation indeed plays a role in PTPRH downregulation.
However, we have to note that some tumor samples showed methylation
levels within the range of the normal samples. Probably another
mechanism may also be involved as in the case of PTPRJ
silencing, where gene downregulation is mediated by both aberrant
promoter methylation, genetic deletion and mRNA degradation by
upregulated oncogenic miRNA (33).
The finding of PTPRH downregulation in
colorectal tumors is consistent with the results from
hepatocellular carcinoma where also a decreased expression was
found (34). This suggests a
suppressive rather than an oncogenic role as was previously
proposed (35). The tumor
suppressor nature of this phosphatase is also supported by some
functional data. PTPRH was found to play a role in contact
inhibition of cell growth and motility by dephosphorylating
p130cas, focal adhesion kinase and p62dok (17). Activating FAK-src and p130Cas-JNK
signaling cascades promotes cancer progression and invasion
(36,37). Cell-cell adhesion induced
PTPRH expression and upregulated its activity (17). PTPRH was also found to be involved
in MAPK pathway regulation via inhibiting ERK activation in
response to LPA and also, to some extent, to EGF substrates
(17). Accordingly, PTPRH
negatively affected proliferation and inhibited colony formation in
culture (17). Recently,
large-scale analyses of the RTK-phosphatase interactome was
published. One of the important hits of screening was the
interaction between PTPRH and egFR that was clearly confirmed by
coimmuno-precipitation (16). In a
functional experiment, where PTPRH expression in HEK293
cells was induced by tetracycline, EGFR dephosphorylation levels
were closely related to antibiotic doses. Accordingly, a knockout
of this gene in OV-90 cells that express relatively low
PTPRH levels increased the basal ERK activation that was
also further enhanced upon EGF stimulation (16). The role of PTPRH in regulating
apoptosis was also reported. Induced apoptosis was observed in
fibroblast cells with PTPRH overexpression as a consequence
of modulating PI3K signaling by inactivation of ALK kinase and
integrin-linked kinase (ILK) (38). In turn, in activated T cells PTPRH
was identified as negative regulator that interact with Lck
receptor tyrosine kinase (39).
The previous suggestion that PTPRH may act as
an oncogene was based on the observation of protein expression in
CRC tissue slides (15) and also
on the results from an in vivo model. In mice small
intestine with APC mutation, Ptprh deficiency resulted in
lower rates of large adenomas (>2 mm) developing spontaneously
in comparison to mice with normal gene expression. However, no such
difference was found in the large intestine from mice. No
difference in the general number of adenomas and no difference in
the proliferation and apoptosis in size-matched tumors from the two
groups of animals were observed (31).
Because of the epigenetically-mediated decrease in
PTPRH expression in tumor tissue and its involvement in key
cancer-related pathways, this phosphatase could be considered as
important for tumorigenesis. However, highly tissue-specific
expression of this PTPR have also been observed. In mouse tissue,
Ptprh expression was detected in the gastrointestinal tract,
especially in the small intestine, but not in other tissues
(31). A search of Genotype-Tissue
Expression (GTEx) project data (40) that combines RNA-Seq Expression Data
from different human tissues, confirms the highest expression of
this gene in the small intestine, but shows that it is also
expressed at high levels in the spleen, stomach, colon and adrenal
gland. These data reveal a striking difference of PTPRH
expression in different parts of large intestine, being high in the
transverse colon and low in the sigmoid part. This may suggest a
somewhat different role of this phosphatase in the proximal and
distal colon. Irrespectively, PTPRH expression is clearly
downregulated in all CRCs, regardless of tumor location. In our
qRT-PCR analysis we did not observe a difference in PTPRH
levels in CRC from the proximal and distal colon (data not shown).
No such difference in PTPRH mRNA levels between
differentially located cancers was also found in the deposited
GSE18088 dataset (containing samples with clearly prescribed tumor
location data).
Contrary to previously reported results, our study
shows that PTPRH is downregulated in colorectal tumors. The
reduced gene expression in CRC is related to increased promoter
methylation and PTPRH expression seem to be epigenetically
regulated via DNA methylation and chromatin modifications.
Considering the previous studies regarding its role in cell
signaling it appears that, similarly to other genes from RPTPs
family, PTPRH is a tumor suppressor. The fact that PTPRH
directly inhibits EGFR activity upon ligand-mediated stimulation,
means that the silencing of this phosphatase represents the almost
unexplored mechanism of MAPK pathway activation in colorectal
tumors. The clinical relevance of the downregulation of PTPRH as
well as inactivation of other genes encoding PTPRs requires further
investigation. Loss of PTEN phosphatase, that interacts with EGFR
downstream proteins, was documented as prognostic factor for
anti-EGFR monoclonal antibody-based therapy in CRC patients
(41). In theory, the expression
status of EGFR-interacting phosphatases could provide some
prognostic value for the outcome of the patients treated with
targeted therapy, however this requires further well-designed
clinical analysis.
Abbreviations:
|
RTK
|
receptor tyrosine kinase
|
|
PTP
|
protein tyrosine phosphatase
|
|
RPTP
|
receptor protein tyrosine
phosphatase
|
|
CRC
|
colorectal cancer
|
|
AD
|
colorectal adenoma
|
|
qRT-PCR
|
quantitative real-time PCR
|
|
IHC
|
immunohistochemistry
|
|
ChIP
|
chromatin immunoprecipitation
|
|
Pol2
|
RNA II polymerase
|
|
H3K4m3
|
tri-methylation of histone H3 at
lysine 4
|
|
H3K27m3
|
tri-methylation of histone H3 at
lysine 27
|
|
Ab
|
antibody
|
|
TSS
|
transcription start site
|
|
5-aza-dC
|
5-aza-2′-deoxycytidine
|
|
SDS-PAGE
|
sodium dodecyl sulphate-polyacrylamide
gel electrophoresis
|
Acknowledgments
We thank Piotr Hołownia for proofreading the
manuscript. This study was supported by the research grant no.
IP2011 005471 from the Polish Ministry of Science and Higher
Education.
References
|
1
|
Duan G and Walther D: The roles of
post-translational modifications in the context of protein
interaction networks. PLoS Comput Biol. 11:e10040492015. View Article : Google Scholar : PubMed/NCBI
|
|
2
|
Fleuren EDG, Zhang L, Wu J and Daly RJ:
The kinome 'at large' in cancer. Nat Rev Cancer. 16:83–98. 2016.
View Article : Google Scholar : PubMed/NCBI
|
|
3
|
Li X, Wilmanns M, Thornton J and Köhn M:
Elucidating human phosphatase-substrate networks. Sci Signal.
6:rs10. 2013. View Article : Google Scholar : PubMed/NCBI
|
|
4
|
Nikolaienko RM, Agyekum B and Bouyain S:
Receptor protein tyrosine phosphatases and cancer: New insights
from structural biology. Cell Adhes Migr. 6:356–364. 2012.
View Article : Google Scholar
|
|
5
|
Hardy S, Julien SG and Tremblay ML: Impact
of oncogenic protein tyrosine phosphatases in cancer. Anticancer
Agents Med Chem. 12:4–18. 2012. View Article : Google Scholar
|
|
6
|
Omerovic J, Clague MJ and Prior IA:
Phosphatome profiling reveals PTPN2, PTPRJ and PTEN as potent
negative regulators of PKB/Akt activation in Ras-mutated cancer
cells. Biochem J. 426:65–72. 2010. View Article : Google Scholar
|
|
7
|
Zhao Y, Scott A, Zhang P, Hao Y, Feng X,
Somasundaram S, Khalil AM, Willis J and Wang Z: Regulation of
paxillin-p130-PI3K-AKT signaling axis by Src and PTPRT impacts
colon tumorigenesis. Oncotarget. Jul 18–2016.Epub ahead of
print.
|
|
8
|
Tarcic G, Boguslavsky SK, Wakim J, Kiuchi
T, Liu A, Reinitz F, Nathanson D, Takahashi T, Mischel PS, Ng T, et
al: An unbiased screen identifies DEP-1 tumor suppressor as a
phosphatase controlling EGFR endocytosis. Curr Biol. 19:1788–1798.
2009. View Article : Google Scholar : PubMed/NCBI
|
|
9
|
Bardelli A, Parsons DW, Silliman N, Ptak
J, Szabo S, Saha S, Markowitz S, Willson JK, Parmigiani G, Kinzler
KW, et al: Mutational analysis of the tyrosine kinome in colorectal
cancers. Science. 300:9492003. View Article : Google Scholar : PubMed/NCBI
|
|
10
|
Korff S, Woerner SM, Yuan YP, Bork P, von
Knebel Doeberitz M and Gebert J: Frameshift mutations in coding
repeats of protein tyrosine phosphatase genes in colorectal tumors
with micro-satellite instability. BMC Cancer. 8:3292008. View Article : Google Scholar
|
|
11
|
Laczmanska I, Skiba P, Karpinski P,
Bebenek M and Sasiadek MM: Customized array comparative genomic
hybridization analysis of 25 phosphatase-encoding genes in
colorectal cancer tissues. Cancer Genomics Proteomics. 14:69–74.
2017. View Article : Google Scholar :
|
|
12
|
van Roon EHJ, de Miranda NFCC, van
Nieuwenhuizen MP, de Meijer EJ, van Puijenbroek M, Yan PS, Huang
TH, van Wezel T, Morreau H and Boer JM: Tumour-specific methylation
of PTPRG intron 1 locus in sporadic and Lynch syndrome colorectal
cancer. Eur J Hum Genet. 19:307–312. 2011. View Article : Google Scholar :
|
|
13
|
Ashktorab H, Rahi H, Wansley D, Varma S,
Shokrani B, Lee E, Daremipouran M, Laiyemo A, Goel A, Carethers JM,
et al: Toward a comprehensive and systematic methylome signature in
colorectal cancers. Epigenetics. 8:807–815. 2013. View Article : Google Scholar : PubMed/NCBI
|
|
14
|
Laczmanska I, Karpinski P, Bebenek M,
Sedziak T, Ramsey D, Szmida E and Sasiadek MM: Protein tyrosine
phosphatase receptor-like genes are frequently hypermethylated in
sporadic colorectal cancer. J Hum Genet. 58:11–15. 2013. View Article : Google Scholar
|
|
15
|
Seo Y, Matozaki T, Tsuda M, Hayashi Y,
Itoh H and Kasuga M: Overexpression of SAP-1, a transmembrane-type
protein tyrosine phosphatase, in human colorectal cancers. Biochem
Biophys Res Commun. 231:705–711. 1997. View Article : Google Scholar : PubMed/NCBI
|
|
16
|
Yao Z, Darowski K, St-Denis N, Wong V,
Offensperger F, Villedieu A, Amin S, Malty R, Aoki H, Guo H, et al:
A global analysis of the receptor tyrosine kinase-protein
phosphatase interactome. Mol Cell. 65:347–360. 2017. View Article : Google Scholar : PubMed/NCBI
|
|
17
|
Noguchi T, Tsuda M, Takeda H, Takada T,
Inagaki K, Yamao T, Fukunaga K, Matozaki T and Kasuga M: Inhibition
of cell growth and spreading by stomach cancer-associated
protein-tyrosine phosphatase-1 (SAP-1) through dephosphorylation of
p130cas. J Biol Chem. 276:15216–15224. 2001. View Article : Google Scholar : PubMed/NCBI
|
|
18
|
Skrzypczak M, Goryca K, Rubel T, Paziewska
A, Mikula M, Jarosz D, Pachlewski J, Oledzki J and Ostrowski J:
Modeling oncogenic signaling in colon tumors by multidirectional
analyses of microarray data directed for maximization of analytical
reliability. PLoS One. 5:pii: e13091. 2010. View Article : Google Scholar : PubMed/NCBI
|
|
19
|
Bustin SA, Benes V, Garson JA, Hellemans
J, Huggett J, Kubista M, Mueller R, Nolan T, Pfaffl MW, Shipley GL,
et al: The MIQE guidelines: Minimum information for publication of
quantitative real-time PCR experiments. Clin Chem. 55:611–622.
2009. View Article : Google Scholar : PubMed/NCBI
|
|
20
|
Van de Sompele J, De Preter K, Pattyn F,
Poppe B, Van Roy N, De Paepe A and Speleman F: Accurate
normalization of real-time quantitative RT-PCR data by geometric
averaging of multiple internal control genes. Genome Biol.
3:Research0034. 2002.
|
|
21
|
Muller PY, Janovjak H, Miserez AR and
Dobbie Z: Processing of gene expression data generated by
quantitative real-time RT-PCR. Biotechnique. 32:1372–1374.
13761378–1379. 2002.
|
|
22
|
Tost J and Gut IG: DNA methylation
analysis by pyrosequencing. Nat Protoc. 2:2265–2275. 2007.
View Article : Google Scholar : PubMed/NCBI
|
|
23
|
Mikula M, Rubel T, Karczmarski J,
Statkiewicz M, Bomsztyk K and Ostrowski J: Beads-free protein
immunoprecipitation for a mass spectrometry-based interactome and
posttranslational modifications analysis. Proteome Sci. 13:232015.
View Article : Google Scholar : PubMed/NCBI
|
|
24
|
Flanagin S, Nelson JD, Castner DG,
Denisenko O and Bomsztyk K: Microplate-based chromatin
immunoprecipitation method, Matrix ChIP: A platform to study
signaling of complex genomic events. Nucleic Acids Res. 36:e172008.
View Article : Google Scholar : PubMed/NCBI
|
|
25
|
Barrett T, Wilhite SE, Ledoux P,
Evangelista C, Kim IF, Tomashevsky M, Marshall KA, Phillippy KH,
Sherman PM, Holko M, et al: NCBI GEO: Archive for functional
genomics data sets - update. Nucleic Acids Res. 41:D991–D995. 2013.
View Article : Google Scholar
|
|
26
|
Sanz-Pamplona R, Berenguer A, Cordero D,
Molleví DG, Crous-Bou M, Sole X, Paré-Brunet L, Guino E, Salazar R,
Santos C, et al: Aberrant gene expression in mucosa adjacent to
tumor reveals a molecular crosstalk in colon cancer. Mol Cancer.
13:462014. View Article : Google Scholar : PubMed/NCBI
|
|
27
|
Marisa L, de Reyniès A, Duval A, Selves J,
Gaub MP, Vescovo L, Etienne-Grimaldi MC, Schiappa R, Guenot D,
Ayadi M, et al: Gene expression classification of colon cancer into
molecular subtypes: Characterization, validation, and prognostic
value. PLoS Med. 10:e10014532013. View Article : Google Scholar : PubMed/NCBI
|
|
28
|
Hinoue T, Weisenberger DJ, Lange CPE,
Noushmehr H, Byun H-M, van Dijk CM, Pan F, Malik S, Van Den Berg
DJ, Shen H, et al: Abstract LB-173: Genome-scale analysis of
aberrant DNA methylation in colorectal cancer. Cancer Res. 71(Suppl
8): LB-1732011. View Article : Google Scholar
|
|
29
|
Tsukamoto S, Ishikawa T, Iida S, Ishiguro
M, Mogushi K, Mizushima H, Uetake H, Tanaka H and Sugihara K:
Clinical significance of osteoprotegerin expression in human
colorectal cancer. Clin Cancer Res. 17:2444–2450. 2011. View Article : Google Scholar : PubMed/NCBI
|
|
30
|
Wang Z, Shen D, Parsons DW, Bardelli A,
Sager J, Szabo S, Ptak J, Silliman N, Peters BA, van der Heijden
MS, et al: Mutational analysis of the tyrosine phosphatome in
colorectal cancers. Science. 304:1164–1166. 2004. View Article : Google Scholar : PubMed/NCBI
|
|
31
|
Sadakata H, Okazawa H, Sato T, Supriatna
Y, Ohnishi H, Kusakari S, Murata Y, Ito T, Nishiyama U, Minegishi
T, et al: SAP-1 is a microvillus-specific protein tyrosine
phosphatase that modulates intestinal tumorigenesis. Genes Cells.
14:295–308. 2009. View Article : Google Scholar : PubMed/NCBI
|
|
32
|
Laczmanska I and Sasiadek MM: Tyrosine
phosphatases as a superfamily of tumor suppressors in colorectal
cancer. Acta Biochim Pol. 58:467–470. 2011.PubMed/NCBI
|
|
33
|
Paduano F, Dattilo V, Narciso D, Bilotta
A, Gaudio E, Menniti M, Agosti V, Palmieri C, Perrotti N, Fusco A,
et al: Protein tyrosine phosphatase PTPRJ is negatively regulated
by microRNA-328. FEBS J. 280:401–412. 2013. View Article : Google Scholar
|
|
34
|
Nagano H, Noguchi T, Inagaki K, Yoon S,
Matozaki T, Itoh H, Kasuga M and Hayashi Y: Downregulation of
stomach cancer-associated protein tyrosine phosphatase-1 (SAP-1) in
advanced human hepatocellular carcinoma. Oncogene. 22:4656–4663.
2003. View Article : Google Scholar : PubMed/NCBI
|
|
35
|
Hoekstra E, Peppelenbosch MP and Fuhler
GM: The role of protein tyrosine phosphatases in colorectal cancer.
Biochim Biophys Acta. 1826:179–188. 2012.PubMed/NCBI
|
|
36
|
Zhao J and Guan J-L: Signal transduction
by focal adhesion kinase in cancer. Cancer Metastasis Rev.
28:35–49. 2009. View Article : Google Scholar : PubMed/NCBI
|
|
37
|
Van Slambrouck S, Grijelmo C, De Wever O,
Bruyneel E, Emami S, Gespach C and Steelant WF: Activation of the
FAK-src molecular scaffolds and p130Cas-JNK signaling cascades by
alpha1-integrins during colon cancer cell invasion. Int J Oncol.
31:1501–1508. 2007.PubMed/NCBI
|
|
38
|
Takada T, Noguchi T, Inagaki K, Hosooka T,
Fukunaga K, Yamao T, Ogawa W, Matozaki T and Kasuga M: Induction of
apoptosis by stomach cancer-associated protein-tyrosine
phosphatase-1. J Biol Chem. 277:34359–34366. 2002. View Article : Google Scholar : PubMed/NCBI
|
|
39
|
Ito T, Okazawa H, Maruyama K, Tomizawa K,
Motegi S, Ohnishi H, Kuwano H, Kosugi A and Matozaki T: Interaction
of SAP-1, a transmembrane-type protein-tyrosine phosphatase, with
the tyrosine kinase Lck. Roles in regulation of T cell function. J
Biol Chem. 278:34854–34863. 2003. View Article : Google Scholar : PubMed/NCBI
|
|
40
|
Lonsdale J, Thomas J, Salvatore M,
Phillips R, Lo E, Shad S, Hasz R, Walters G, Garcia F, Young N, et
al GTEx Consortium: The Genotype-Tissue Expression (GTEx) project.
Nat Genet. 45:580–585. 2013. View Article : Google Scholar
|
|
41
|
Wang ZH, Gao QY and Fang JY: Loss of PTEN
expression as a predictor of resistance to anti-EGFR monoclonal
therapy in metastatic colorectal cancer: Evidence from
retrospective studies. Cancer Chemother Pharmacol. 69:1647–1655.
2012. View Article : Google Scholar : PubMed/NCBI
|