Introduction
In total, 85% of renal tumors are malignant, with
the most common type of renal cell carcinoma (RCC), clear cell RCC
(ccRCC), diagnosed in >75% of patients (1,2). RCC
is characterized by a high mortality rate and is highly resistant
to standard chemotherapy or radiotherapy. RCC can also recur at any
time following a nephrectomy (>15 years) and metastasizes both
via the lymphatic and venous routes. RCC is highly metastatic, and
in 75% of cases, metachronous tumors develop in the lungs, liver,
bones, adrenal glands, pancreas, brain, thyroid gland, skin, or
ureter (3). In particular,
metastases develop in the lung parenchyma in up to 60% of the
patients, up to 40% in bone, 40% in the liver and 5% in the brain
(4). Moreover, in 25–30% of
patients with ccRCC, metastasis is already present at the time of
initial diagnosis; this is associated with a high mortality rate
(5). Only 10% of patients
diagnosed with metastatic disease survive for 5 years, in
comparison to 60% of patients who survive for that period of time
if the disease is localized (6,7). The
molecular events responsible for metastatic spread and secondary
tumor development are not yet understood and remain a challenge in
current research.
Currently, the great importance of the tumor
microenvironment (TME) is embodied in the concept that cancer cells
need to conscript and corrupt resident and recruited normal cell
types for local growth, invasion and migration (8). Non-malignant stromal cells create a
specific microenvironment altering the neoplastic properties of
tumor cells (9). Primary tumors
secrete factors that modify the microenvironment of distant organs
in order to create a fertile environment for subsequent metastatic
cancer cell colonization. In conclusion, the TME drives the process
of tumor progression, metastatic dissemination and drug resistance
(9).
The aim of this study was to explore RCC gene
expression patterns and signaling alterations in a
microenvironmental lung metastasis model. To evaluate paracrine
interactions between cancerous and normal cells, conditioned media
and a co-culture model were developed and high throughput cDNA
microarray analysis was subsequently employed to investigate the
expression patterns induced by the cancer cells and
reciprocated/propagated by the TME. RCC cells and normal cells of
the metastatic target organ were co-cultured, and their gene
expression patterns were compared to RCC and normal cells cultured
separately. In particular, to examine the effects of cell-cell
interactions between RCC and normal lung cells on renal carcinoma
gene expression profiles, normal human bronchial epithelial cells
(NL-20) were examined in interaction with ACHN cells derived from
the malignant pleural effusion of males with metastatic renal
carcinoma and Caki-2 cells derived from a primary kidney carcinoma.
Microarray analysis of the gene expression profiles was used to
identify pathways involved in cancer cell viability in the
metastatic tumor niche (10).
Materials and methods
Cell culture
Human RCC cell lines from primary (Caki-2, RCC6,
786-O, 769-P, SMKT-R2) and metastatic tumors (ACHN, Caki-1)
[according to our meta-analysis (11), both the ACHN and Caki-2 cell lines
were found to be non-clear renal cell carcinoma cells] and human
normal cell lines, including lung/bronchus epithelial cells
(NL-20/CRL-2503), fibroblasts (LeSa/LL 86/CCL-190), kidney
epithelial cells (ASE-5063), primary renal proximal tubule
epithelial cells (PRPTECs/PCS-400-010) and epithelial mesothelial
cells (MeT5A/CRL9444), were maintained at 37°C in the presence of
5% CO2 in an RPMI-1460 medium with GlutaMAX™ (Life
Technologies, Carlsbad, CA, USA), 10% fetal bovine serum (Biochrom
GmbH, Cambridge, UK), and antibiotics (pen/strep) (Amersco, Solon,
OH, USA). Human kidney epithelial cells derived from whole kidneys
from a single donor (ASE-5063 cells) were purchased from Applied
StemCell, Inc. (Menlo Park, CA, USA). The SMKT-R2 (RRID:CVCL_A750)
cell line was a kind gift from Professor Taiji Tsukamoto (School of
Medicine, Sapporo Medical University, Sapporo, Japan) (12). The RCC6 (CVCL_E056) cell line was a
kind gift from Professor Salem Chouaib (INSERM, Institut Gustave
Roussy, Villejuif, France) (13).
All other cell lines were purchased from the American Type Culture
Collection Global Bioresource Center (ATCC; Manassas, VA, USA).
Normoxia was defined as 21% O2 in culture, while hypoxia
as 2% O2.
Following 24 h of cell culture, the medium was
collected and then referred to as conditioned medium (CM) (14). CM was used raw and filtered through
syringe filters with 0.22-µm or 0.45-µm pore
diameters (EuroClone SpA, Pero, MI, Italy). CM was then diluted
(50%, 30%, 10%) with fresh RPMI medium with serum and used in
growth stimulation experiments. The cancer cells were treated with
CM from normal cells, and normal cells were stimulated by CM
derived from cancer cells.
Co-culture
For cell co-culture, 24-well plates were used with
transparent polyester inserts with a 0.4-µm pore size
(Greiner Bio-One GmbH, Frickenhausen, Germany). The seeding density
was optimized for the proliferation rate of each cell line. For the
final gene expression analysis described below, renal carcinoma
ACHN (0.7×10⁵ cells/well) or Caki-2 (0.8×10⁵
cells/well) cells were plated in 24-well plates, while bronchial
epithelial NL-20 cells (1.3×10⁵ cells/co-culture insert)
were plated in inserts (in empty plates). The cells were cultured
for 24 h to allow attachment. After 24 h, the inserts with NL-20
cells were placed in pre-seeded plates for ACHN or Caki-2
co-culture.
Wound healing assay
The CytoSelect™ 24-well wound healing assay (Cell
Biolabs, Inc., San Diego, CA, USA) gap closure migration assays
were used as per the manufacturer's instructions. Light microscopy
with a Nikon TMS-F inverted microscope and a Delta Optical HDCE-30C
3MP camera (Delta Optical, Nowe Osiny, Poland) were used for
imaging.
Cell proliferation estimation
The cells were seeded in 96-well plates and cultured
under standard conditions (37°C, 5% CO2) in regular
RPMI/FBS medium (control) or CM (proliferation induction analysis).
Subsequently, cell proliferation was quantified after 24, 48, 72,
96, 120 and 144 h (referred as to days 1–6). An
alamarBlue® (resazurin) (Life Technologies) assay was
performed as per the manufacturer's instructions to quantitatively
measure cell viability (15). The
absorbance of alamarBlue® was read using a Multiskan™ GO
Microplate spectrophotometer (Thermo Fisher Scientific, Waltham,
MA, USA) at 570 and 600 nm. The absorbance obtained from readings
at 570 and 600 nm was then calculated to the percentage reduction
of alamarBlue®, as follows:
%ofalamarBluereduction=(O2*A1)−(O1*A2)(R1*N2)−(R2*N1)×100%
where O1 = molar extinction coefficient of oxidized
alamarBlue® at 570 nm = 80586, O2 = E of oxidized
alamarBlue® at 600 nm = 117216, R1 = E of reduced
alamarBlue® at 570 nm = 155677, R2 = E of reduced
alamarBlue® at 600 nm = 14652, A1 = absorbance of test
wells at 570 nm, A2 = absorbance of test wells at 600 nm, N1 =
absorbance of negative control well (media plus
alamarBlue®) at 570 nm, and N2 = absorbance of negative
control well (media plus alamarBlue®) at 600 nm. It was
read by a Multiskan GO microplate reader and analyzed using the
SkanIt™ software package (Thermo Fisher Scientific).
In the co-culture model, the cells were incubated
for 24 h after insert placement before the first measurement was
taken. After that, measurements were taken every 24 h (days 2–6).
All experiments were run in 5 replicates.
The cells cultured with blocker of the interleukin
(IL)-6sR/IL6 complex (recombinant human gp130 protein) were used as
negative controls, in order to inhibit the IL-6-dependent
proliferation of cells in the presence of human IL-6 Rα (Research
and Diagnostic Systems, Inc., Minneapolis, MN, USA).
Gene expression analysis
Total RNA was extracted using the Syngen Blood/Cell
RNA Mini kit from co-cultured cell lines after day 5 as per the
manufacturer's instructions (Syngen, Wroclaw, Poland). Total RNA
was purified with the RNase-Free DNase Set (Qiagen, Hilden,
Germany) as per the manufacturer's instructions. The quantity and
quality of RNA samples were estimated with the Nanodrop
spectrophotometer ND-1000 (NanoDrop Products, Wilmington, DE, USA)
and the 2100 Bioanalyzer microcapillary electrophoresis system
(Agilent Technologies, Santa Clara, CA, USA). For analysis, high
quality (260/280 - 2.1 RIN >9) samples were selected.
In total, 50 ng of total RNA from each sample were
reverse transcribed into cDNA, amplified, and labeled with cyanine
3 or 5 with Two-Color Low Input Quick Amp Labeling Kits (Agilent
Technologies). The resulting cDNA was hybridized with a 44 K
Agilent whole genome oligo-microarray in Agilent's SureHyb
Hybridization Chambers in accordance with the manufacturer's
instrutions. The Agilent whole genome oligo-microarray covers
41,000+ unique human genes and transcripts, all with
public domain annotations, with content sourced from RefSeq, Golden
Path Ensembl Unigene Human Genome (Build 33), and GenBank
databases, and over 70% of the represented probes are validated by
Agilent's laboratory validation process, with 4×44 K slide formats
printed using Agilent's 60-mer SurePrint technology. Following
hybridization and washing, the processed slides were scanned with
the Agilent DNA microarray scanner (part number G2565CA) using
settings recommended by Agilent Technologies for microplate
readers.
Protein expression analysis
Total protein was extracted with RIPA buffer for
cell lysis and protein solubilization (Sigma-Aldrich, St. Louis,
MO, USA) with protease inhibitor cocktail (Sigma-Aldrich). The
Bio-Rad protein assay (Bio-Rad, Hercules, CA, USA) based on the
method of Bradford was used for protein quantification with an
absorbance measurement at 595 nm with Multiscan GO (Thermo Fisher
Scientific). The IL6 (human) ELISA kit (KA0123), IL6R (human) ELISA
kit (KA0124) and IL6R (human) ELISA kit (KA0523) (all from Abnova,
Walnut, CA, USA) were used for the measurement of IL-6 and IL-6R in
medium from healthy and RCC cells. In normal cells cultured in
control medium and in CM following incubation of RCC cells, the
levels of IL-6R, glycoprotein (gp)130, signal transducer and
activator of transcription 3 (STAT3) and activated p-STAT3 were
examined by western blot analysis with a Mini-PROTEAN®
TGX™ Precast Polyacrylamide Gels run with Bio-Rad Mini Protean
Tetra Cell (Bio-Rad) and Pierce Fast Semi-dry Blotter on
Low-fluorescence PVDF Transfer Membrane (Thermo Fisher Scientific).
IL-6 antibody (E-4; sc-28343), IL-6Rα antibody (D-8; sc-374259)
(both from Santa Cruz Biotechnology, Dallas, TX, USA), STAT3
antibody (9D8; MA1-13042), p-STAT3 pTyr705 antibody (G.374.10;
MA5-11189) and CD130/gp130 antibody (PA5-28932) (all from Thermo
Fisher Scientific) were used as per the manufacturer's dilutions
1:100–1:100, respectively and probed overnight at 4°C. Secondary
anti-mouse IgG (whole molecule)-alkaline phosphatase-labeled
antibody produced in goat [A3562] (1:7,000) was incubated for 2 h
and detected with SIGMA FAST™ BCIP/NBT
(5-Bromo-4-chloro-3-indolyl phosphate/Nitro blue tetrazolium)
(Sigma-Aldrich) and the signal was compared with a PageRuler
Prestained Protein Ladder, 10–170 kDa (Thermo Fisher
Scientific).
Data analysis and statistical
analysis
Agilent Feature Extraction Software version 10.5.1.1
(Agilent Technologies) was used to extract the signal intensity
values from each gene chip, and the resulting text files were
imported into the Agilent GeneSpring GX software version 13.0
(Agilent Technologies) for further analysis. The microarray data
sets normalization, quality control, principal component analysis,
and filtered-on flags (detected and not detected) were performed
before data analysis. In pair-wise correlation analysis,
differentially expressed genes (DEGs) were identified through
fold-change screening by comparing cells cultured in 2D and
co-cultured cell line (normal lung cell line vs lung cells induced
by cancer cell). Gene expression profiling of microarray data was
analyzed with moderate t-test and multiple testing corrected with
the Westfall and Young permutation. The P-value computation was
conducted with asymptotic method (16). The statistical significance was
assessed at P<0.05, and a fold change cut-off ≥2.0
(up-/downregulated) was selected to identify genes that were
differentially expressed, as previously described (17,18).
To select target genes of interest both
statistically and biologically, a pathway analysis was performed
using Ingenuity Pathway Analysis (IPA; Qiagen) (19). IPA was used to evaluate potential
gene networks activated in analysed cells. Lists of genes with
known gene symbols (HUGO) and their corresponding expression values
were uploaded into the IPA software. Gene symbols were mapped to
their corresponding gene object in the Ingenuity Pathways Knowledge
Base (IKB). Networks of these genes were generated based on their
connectivity and assigned an IPA score. Analysis was used to
compute a score for each network according to the fit of that
network to the user-defined set of focus genes. The score was
derived from a P-value and indicates the likelihood of the gene or
protein in a network being found to interact due to random chance.
The IPS score was defined as a numerical value used to rank
networks according to relevance to genes in the analyzed dataset
defined by number of genes in the network and the size of the
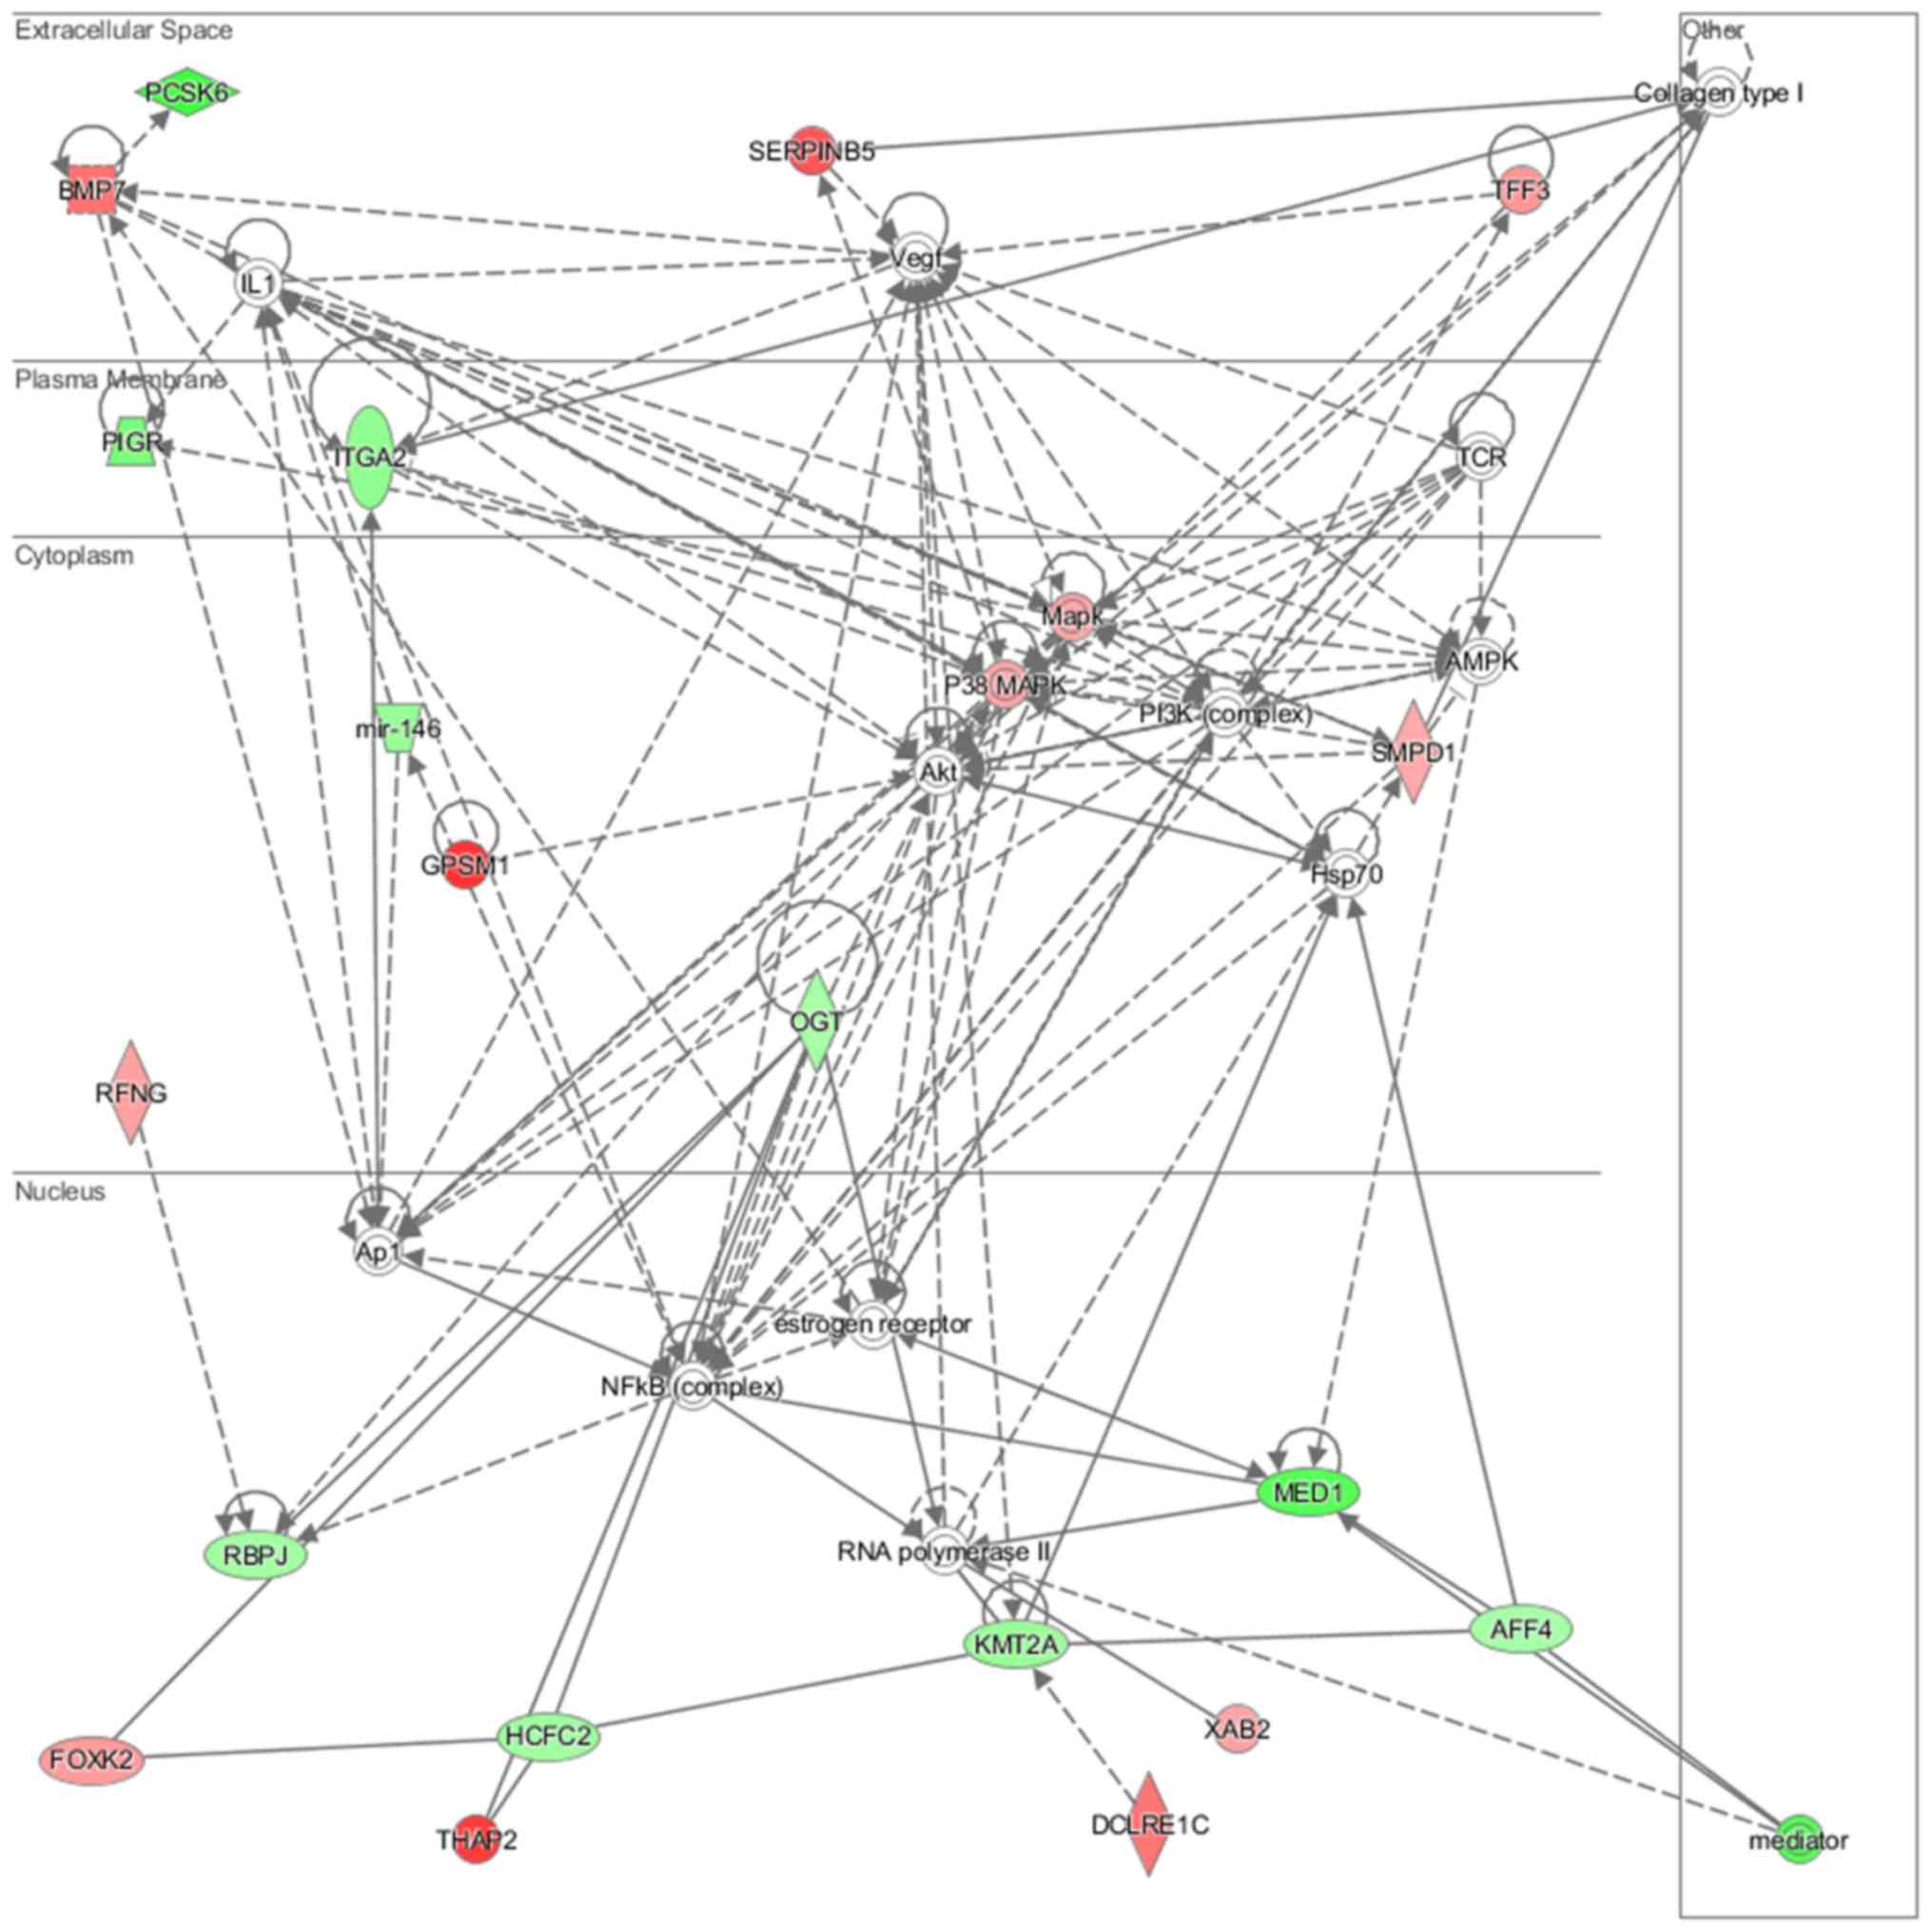
network. The networks identified are presented in figures showing
interactions between molecules (genes). Genes are represented as
nodes in the networks. The intensity of the node color indicates
the degree of up- or downregulation (upregulation in red,
downregulation in green). Canonical pathway analysis was used to
identify the signaling pathways which were most significant in the
analyzed data set. The significance of the association between the
data set and the canonical pathway was determined based on the
following 2 parameters: i) A ratio of the number of genes from the
data set that map to the pathway divided by the total number of
genes that map to the canonical pathway; and ii) Fisher's exact
test P-value for the random association between genes in the data
set and the canonical pathway, as previously described (20). In the next step the upstream
regulators in the IPA analysis were defined and listed as molecules
that potentially affect the expression of other molecules (genes).
Analysis was based on the expected causal effects between upstream
regulators and target genes, and the expected interaction effects
were derived from IKB. Causal networks analysis was used to
integrate previously observed cause-effect relationships reported
in IKB, describing the direction of effects with downstream
effectors impacting cell biology. Regulator effects networks
analysis was used to explain how predicted activated and inhibited
upstream regulators cause increases or decreases in functional and
phenotypic effects of the cells and identified the most
biologically significant genes referred to as analysis-ready
molecules (21). A score of ≥2 was
defined as having at least a 99% confidence of not being generated
by random chance alone.
Gene Ontology (GO) and WikiPathways data sources
were used to recognize up- and downregulated signaling pathways and
processes (22–24). Cell growth data were subjected to a
two-way analysis of variance (ANOVA) followed by Bonferroni's post
hoc test with the use of GraphPad Prism 5.0 software (GraphPad
Software Inc., La Jolla, CA, USA). All data are expressed as the
means ± standard deviation from at least 3 replicates. A P-value
<0.05 was considered to indicate a statistically significant
difference in any experiment.
Results
Renal carcinoma cell lines are induced by
metastatic target organ cells
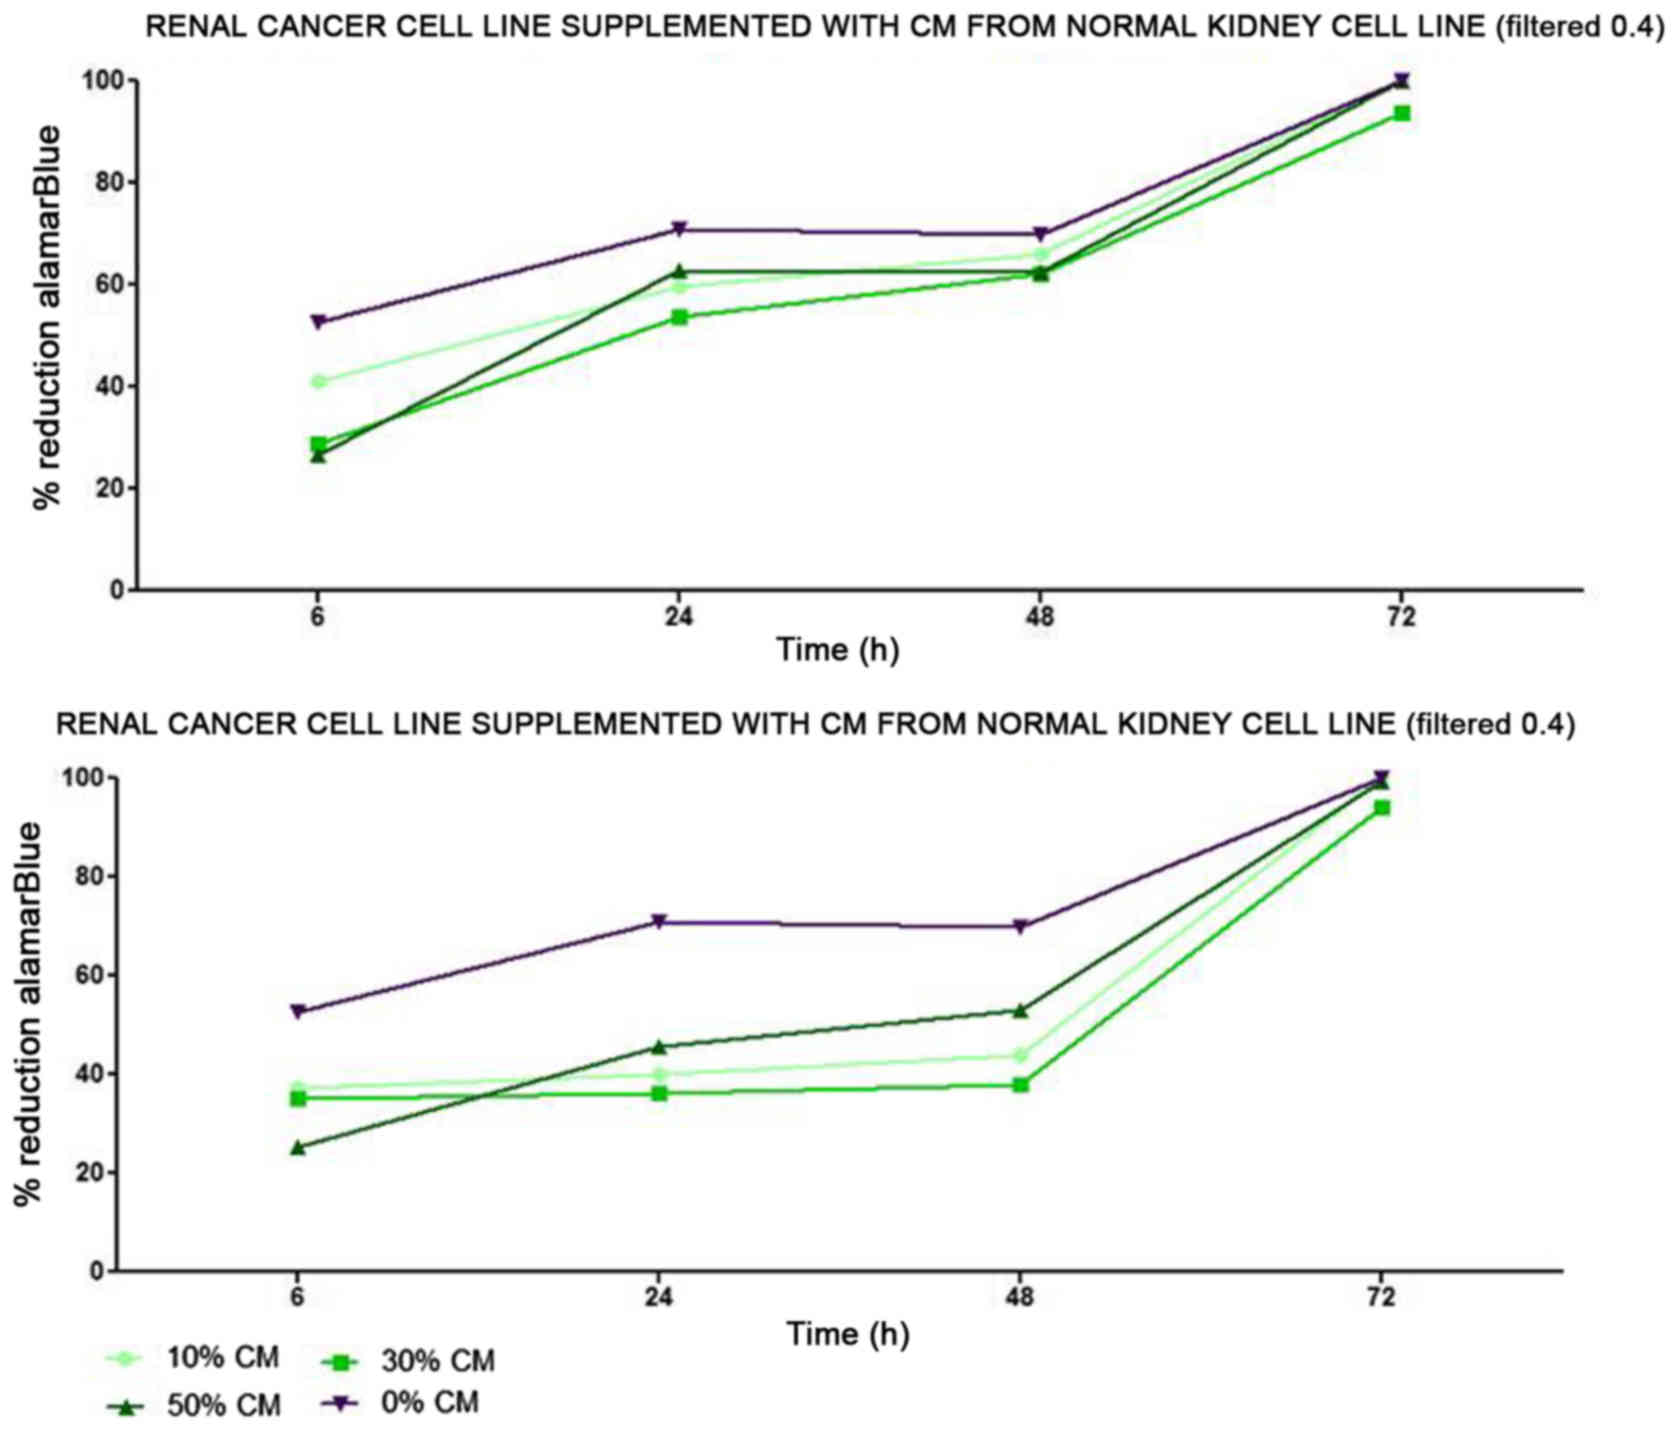
Renal cancer cell line cultures (786-0, Caki-1,
Caki-2, RCC6, SMKT-R2, ACHN) were supplemented with CM from lung
metastatic target organ cell lines, including a normal fibroblast
cell line (LeSa) and pleural epithelial cells (NL-20). At the same
time, the RCC cells were also cultured with CM from normal renal
cells (RPTEC/ASE-5063) as primary tumor site internal induction
control. Supplementation with CM from the normal kidney (proximal
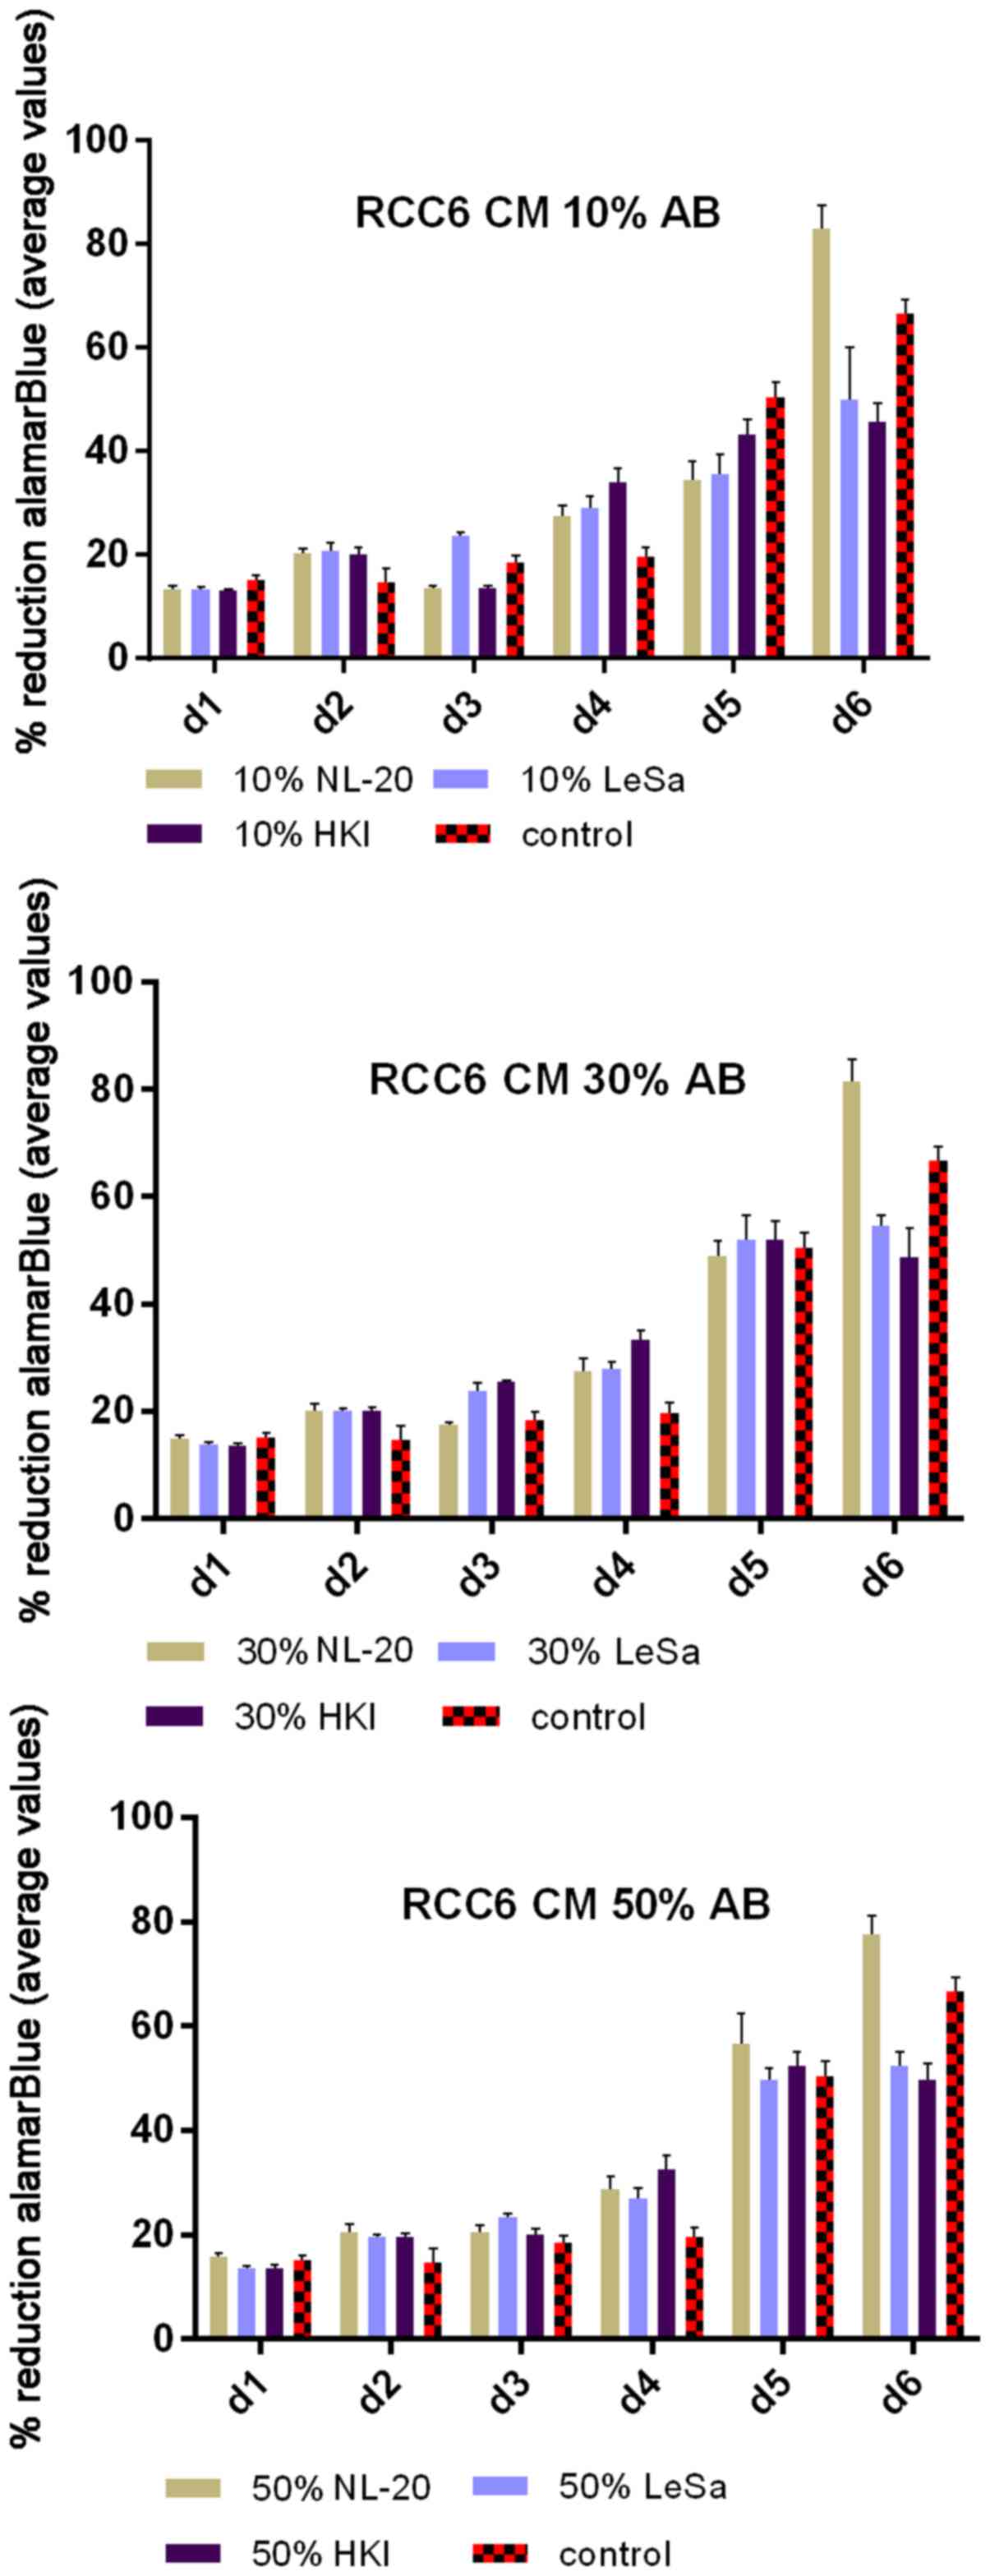
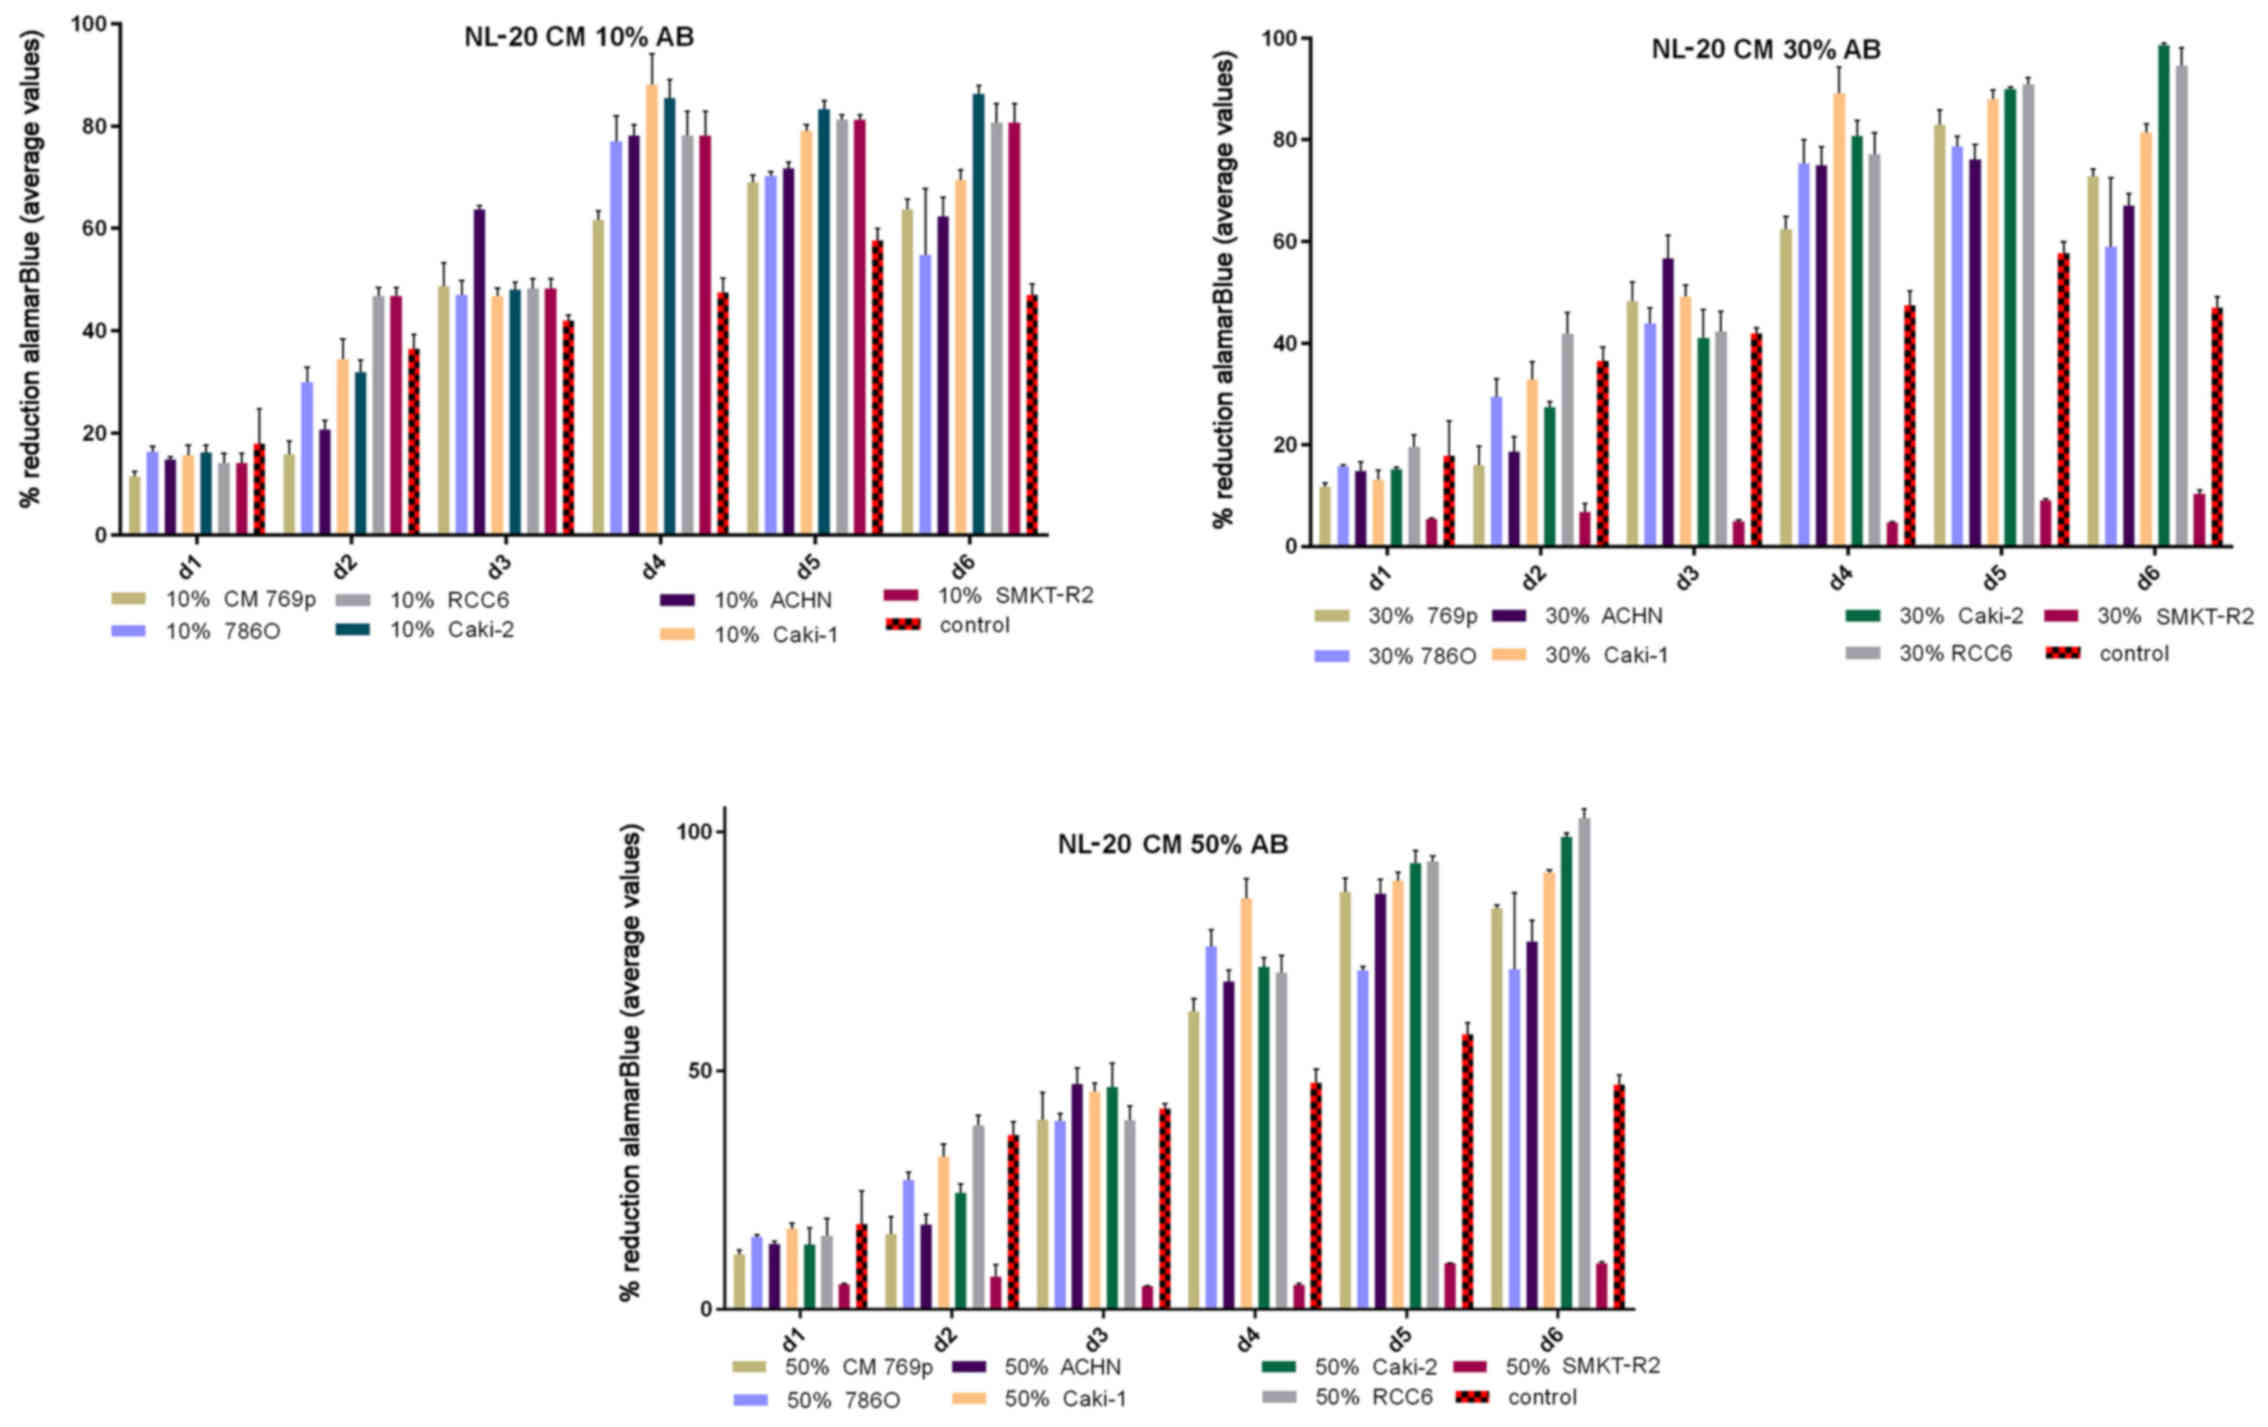
tubule) cells slightly decreased RCC cell proliferation (Fig. 1). On the other hand, RCC cell
proliferation was increased on day 3 (72 h) when the culture was
supplemented with 10% CM from metastatic target organ fibroblasts;
however, the effect was transient and was lost on day 6. At the
same time, 50% CM from pleural epithelial NL-20 cells significantly
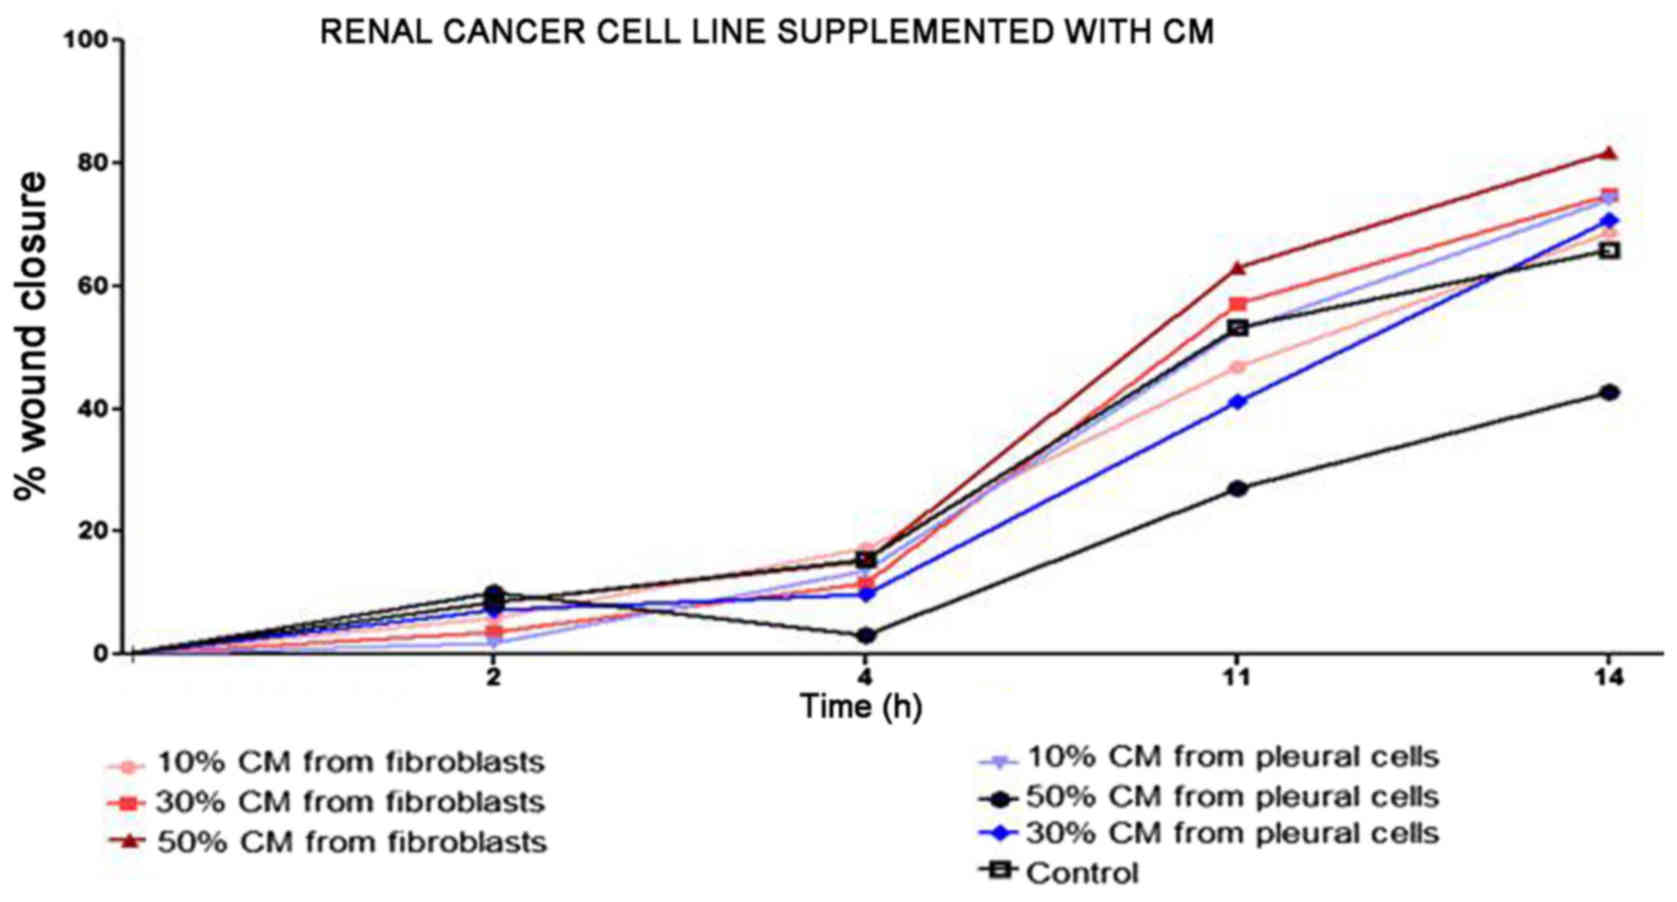
and stably increased the RCC cell proliferation rate (Fig. 2). Moreover, in the wound healing
assay, supplementation with CM from lung fibroblasts and pleural
cells was found to increase the RCC cell migratory potential
(Fig. 3) defined by the wound
closure velocity. The migration rate increased with the
concentration of the CM (Figs. 3
and 4). At the edge of the
scratch, the cancer cells formed a loosely connected population
without uniform velocity of the cell front. At regions with less
confluency, cell populations of heterogeneous morphology were
observed, including cells with a fibroblast-like morphology.
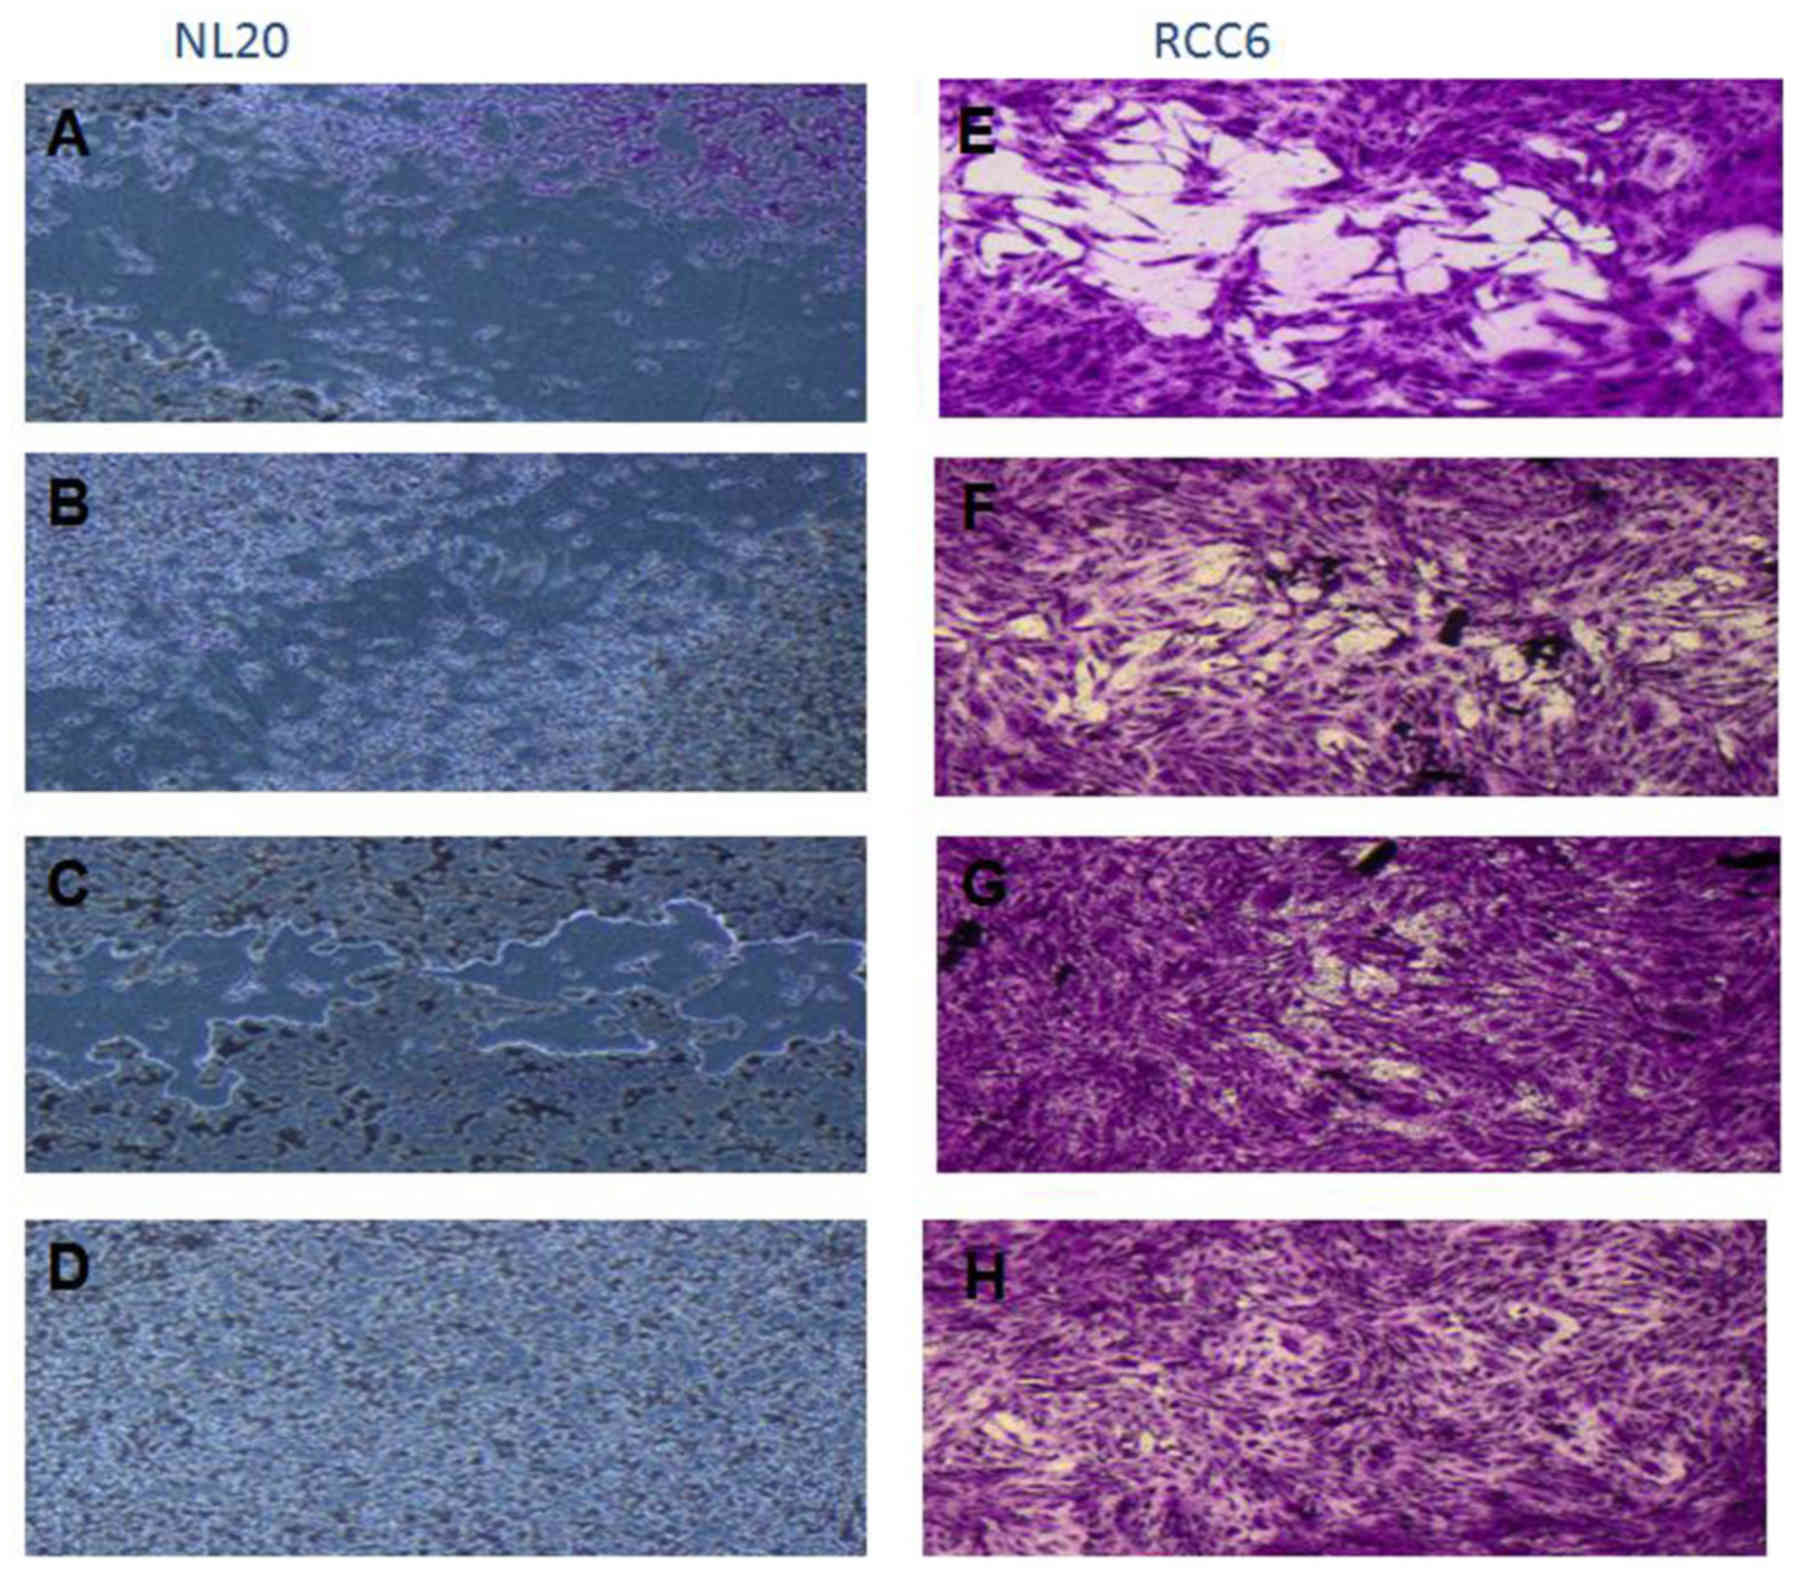
The effect of CM from cancer cells was tested on
normal cells (LeSa, Met-5A, NL-20, RPTEC/ASE-5063) and the NL-20
cells were found to be stimulated by CM from the RCC cell lines
(Fig. 5). Moreover, migration
assay indicated that NL-20 cell motility was induced by CM from
cancer cells and that the cell migratory distances increased upon
stimulation. The migration pattern of NL-20 as continuous sheet of
cells or a tight layer of cells mimics the behavior of epithelial
cells during migration in vivo (Fig. 4).
The Caki-2 and ACHN RCC cells that were most
significantly stimulated by the CM from NL-20 normal cell lines,
and that in turn most significantly induced NL-20 cells were
selected for further co-culture and gene expression analyses to
represent both the primary and metastatic RCC tumor model.
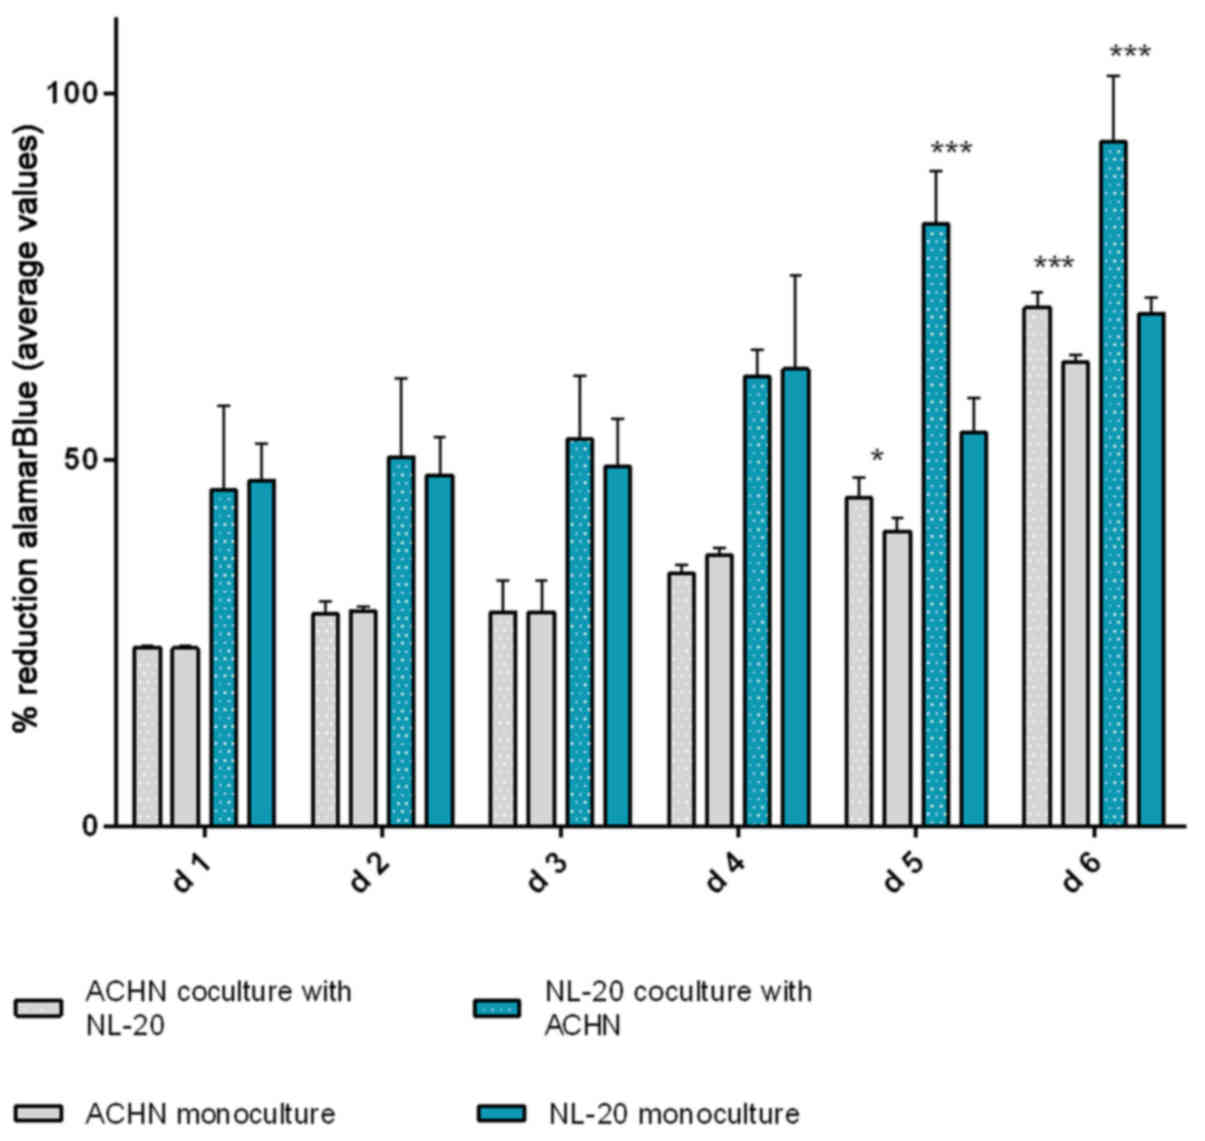
In the second step, the co-culture of cell line
pairs revealed a statistically significant effect of cell-cell
communication between RCC and lung cell lines. Significant
differences in the cell proliferation rate and cell number were
observed after at least 5 days of culture. The effect was shown in
the ACHN cells co-cultured with the NL-20 cells when compared with
the ACHN cells in a monoculture (P<0.05) and the NL-20 cells in
monoculture (P<0.001) (Fig. 6).
A stimulatory effect was obtained in both culture baso-lateral
orientations when NL-20 cells were co-cultured with the ACHN cells,
and when the ACHN cells were co-cultured with the NL-20 cells. The
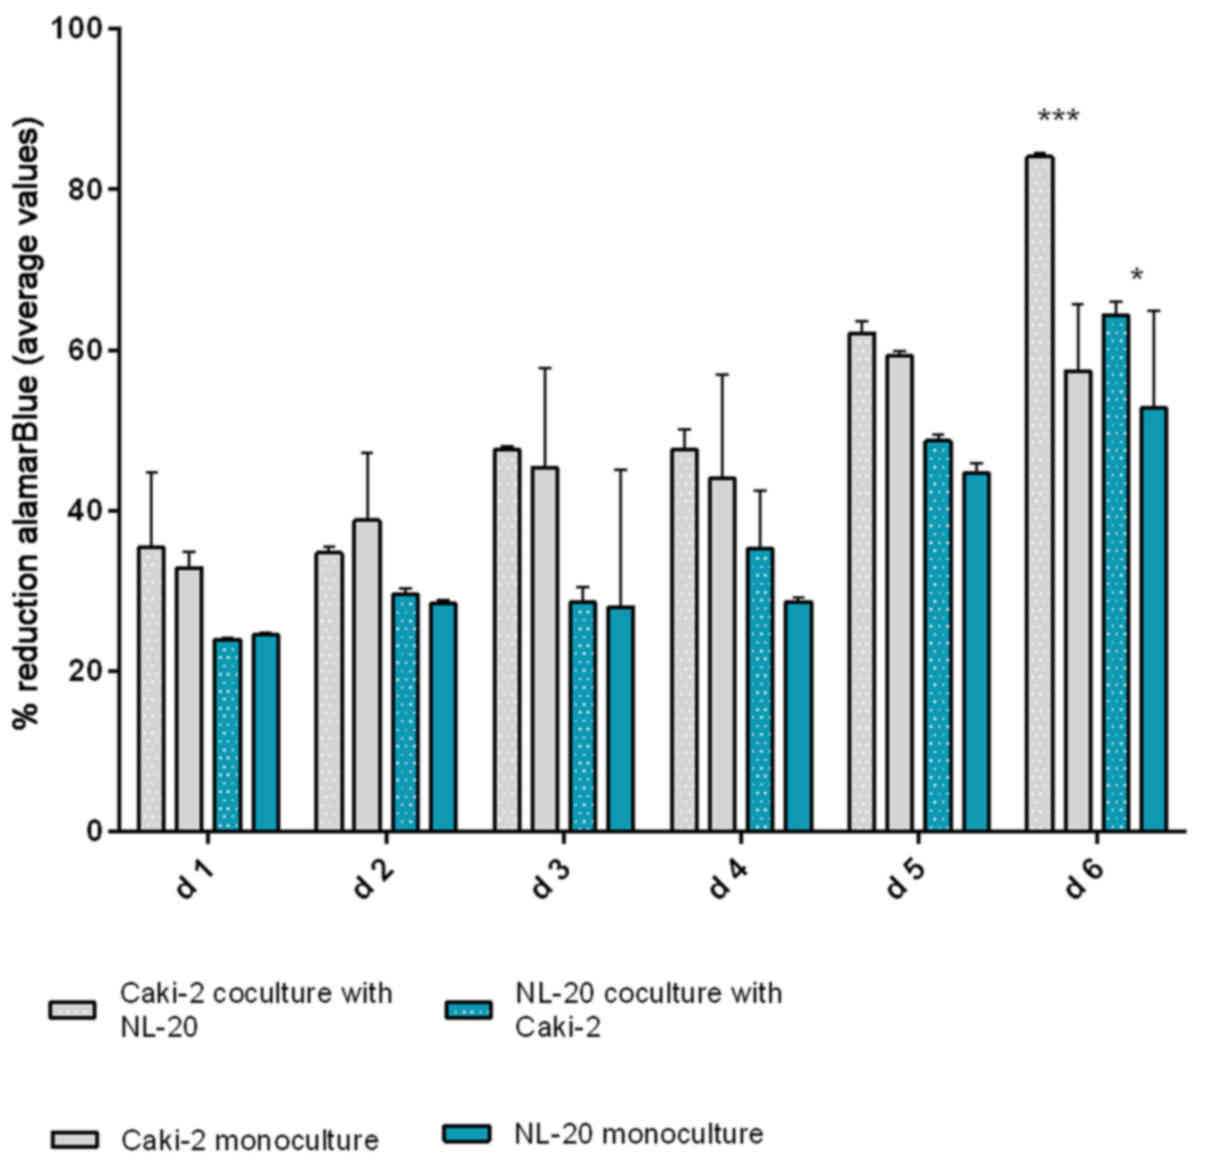
same effect was reported for the Caki-2 and NL-20 cell pairs on day
5. Caki-2 co-culture with the NL-20 cells induced proliferation
when compared to Caki-2 cell monoculture (P<0.001) and NL-20
monoculture (P<0.05) (Fig. 7).
Based on the obtained results from both pairs of cell lines (NL-20
and Caki-2, N + C; NL-20 and ACHN, N + A), day 5 was selected for
RNA and protein extraction for further gene expression
analysis.
Gene expression is deregulated upon the
interaction of primary RCC tumor cells with normal pleural
cells
A significant difference in expression was found
between normal cells induced by different cancer cells (N + C vs. N
+ A, Tables I–V), cancer cell lines induced by normal
cells (C + N vs. A + N, Tables
VI–IX), as well as between
co-cultures and Caki-2 monoculture or NL-20 monoculture (Fig. 8).
 | Table IAnalysis of the process of ontology
deregulation upon the interaction of normal epithelial NL-20
pleural cells with renal cell cancer cells (both Caki-2 and ACHN
cells). |
Table I
Analysis of the process of ontology
deregulation upon the interaction of normal epithelial NL-20
pleural cells with renal cell cancer cells (both Caki-2 and ACHN
cells).
| GO Term | P-value |
|---|
| Terpenoid
transport | 7.95E-05 |
| Isoprenoid
transport | 7.95E-05 |
| Retinol
transport | 7.95E-05 |
| Mediator complex
binding | 4.71E-04 |
| Vitamin transporter
activity | 7.15E-04 |
| Heart trabecula
morphogenesis | 0.001237 |
| Positive regulation
of Arp2/3 complex-mediated actin nucleation | 0.00162 |
| Negative regulation
of fatty acid oxidation | 0.00162 |
| Positive regulation
of actin nucleation | 0.002148 |
| Vitamin
transport | 0.002161 |
| Activation of
MAPKKK activity | 0.002745 |
| Histone H3-K4
trimethylation | 0.003411 |
| Regulation of heart
growth | 0.003426 |
| Cellular response
to calcium ion | 0.003723 |
| Trabecula
morphogenesis | 0.004035 |
| Ventricular
trabecula myocardium morphogenesis | 0.004145 |
| Folic acid
binding | 0.004145 |
| Regulation of
action potential | 0.004145 |
| Detection of
mechanical stimulus | 0.004706 |
| Gland
development | 0.004804 |
| Table VTop analysis-ready molecules in NL-20
cells upon interaction with ACHN cells. |
Table V
Top analysis-ready molecules in NL-20
cells upon interaction with ACHN cells.
Upregulated genes
| Downregulated genes
|
|---|
| Molecules | Expression
value | Molecules | Expression
value |
|---|
| ZC3H12D, zinc
finger CCCH-type containing 12D | 3.604 | KCNJ12, potassium
voltage-gated channel subfamily J | −4.242 |
| GPSM1, G protein
signaling modulator 1 | 2.932 | LOC101927814,
uncharacterized | −3.187 |
| PIEZO2, piezo type
mechanosensitive ion channel component 2 | 2.796 | GABBR1,
gamma-aminobutyric acid type B receptor subunit 1 | −2.995 |
| LINC01509, long
intergenic non-protein coding RNA 1509 | 2.789 | LOC285484,
uncharacterized | −2.979 |
| THAP2, THAP domain
containing 2 | 2.765 | TSC22D1-AS1,
TSC22D1 antisense RNA 1 | −2.857 |
| ZNF90, zinc finger
protein 90 | 2.674 | PCSK6, proprotein
convertase subtilisin/kexin type 6 | −2.703 |
| HIST1H1T, histone
cluster 1 H1 family member T | 2.663 | COL8A2, collagen
type VIII alpha 2 chain | −2.567 |
| CXCR5, C-X-C motif
chemokine receptor 5 | 2.601 | AP1S2, adaptor
related protein complex 1 sigma 2 subunit | −2.555 |
| CST6, cystatin
E/M | 2.564 | RNF213, ring finger
protein 213 | −2.402 |
| ZCCHC6, zinc finger
CCHC-type containing 6 | 2.561 | MED1, mediator
complex subunit 1 | −2.373 |
| Table VIAnalysis of the process of ontology
deregulated upon the interaction of renal cell carcinoma cells,
Caki-2, with normal epithelial NL-20 pleural cells. |
Table VI
Analysis of the process of ontology
deregulated upon the interaction of renal cell carcinoma cells,
Caki-2, with normal epithelial NL-20 pleural cells.
| GO Term | P-value |
|---|
| Regulation of
epithelial cell proliferation involved in lung morphogenesis | 2.19E-04 |
| Interneuron
migration | 3.27E-04 |
| Histone pre-mrna
3′end processing complex | 3.27E-04 |
| Cerebral cortex
GABAergic interneuron migration | 3.27E-04 |
| Cerebral cortex
GABAergic interneuron development | 3.27E-04 |
| Interneuron
migration from the subpallium to the cortex | 4.56E-04 |
| Cerebral cortex
GABAergic interneuron differentiation | 9.68E-04 |
|
Substrate-independent telencephalic
tangential interneuron migration | 0.00118 |
|
Substrate-independent telencephalic
tangential migration | 0.00118 |
| Clathrin-sculpted
vesicle | 0.001411 |
| GABAergic neuron
differentiation | 0.001411 |
| Telencephalon cell
migration | 0.00212 |
| Learning | 0.002363 |
| Forebrain cell
migration | 0.002476 |
| Telencephalon
development | 0.002633 |
| Neural nucleus
development | 0.003443 |
| Cerebral cortex
neuron differentiation | 0.003965 |
| Transcription,
DNA-templated | 0.004027 |
| Nucleic
acid-templated transcription | 0.004046 |
| RNA biosynthetic
process | 0.004227 |
| Table IXAnalysis of biological pathway
(WikiPathways) deregulation upon interaction of ACHN renal cell
carcinoma cells and normal epithelial NL-20 pleural cells. |
Table IX
Analysis of biological pathway
(WikiPathways) deregulation upon interaction of ACHN renal cell
carcinoma cells and normal epithelial NL-20 pleural cells.
| Pathway name | Pathway no. | P-value |
|---|
| Translocation of
GLUT4 to the plasma membrane | WP2777 77058 | 0.054280035 |
| Potassium
channels | WP2669 76853 | 0.006594973 |
| Assembly of
collagen fibrils and other multimeric structures | WP2798 77089 | 0.016301567 |
| Transcriptional
regulation of pluripotent stem cells | WP2821 76135 | 0.03988874 |
| Regulation of water
balance by renal aquaporins | WP2662 76842 | 0.009202255 |
For primary tumor cells the two interactions, Caki-2
cell induction by NL-20 cells (referred to as C + N) and NL-20 cell
induction by Caki-2 cells (referred to as N + C), resulted in the
deregulation of multiple signaling pathways in both analyzed cell
lines, in normal NL-20 cells (Tables
I and II), as well as in
Caki-2 cancer cells (Tables VI
and VII). This interaction of
primary tumor-derived RCC tumor cells (Caki-2) with normal pleural
cells (NL-20), modelling first interaction upon formation of
metastasis, resulted in the deregulation of specific genes
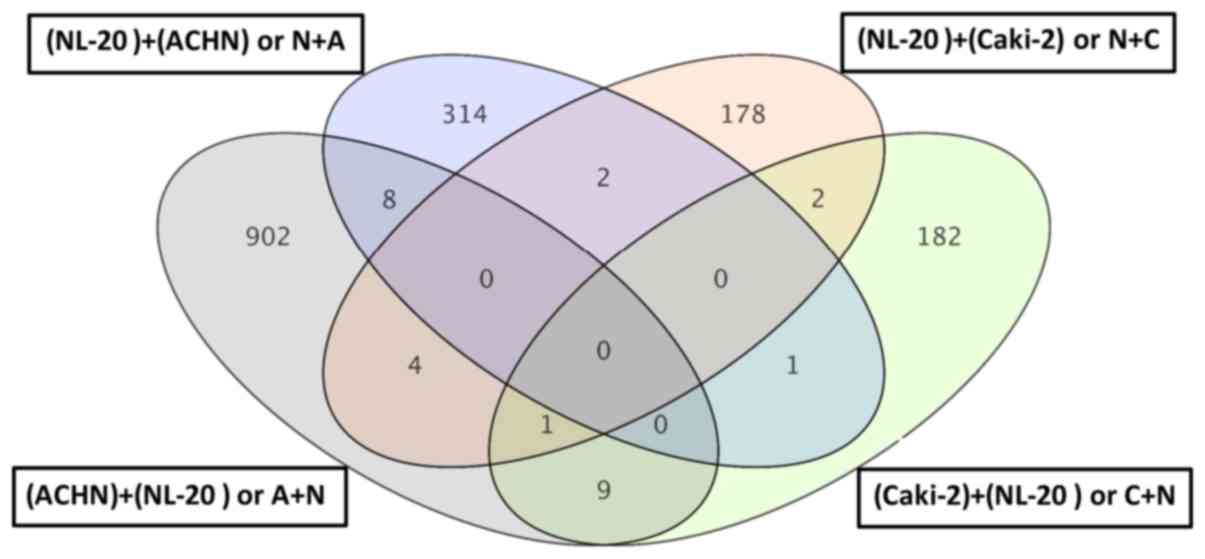
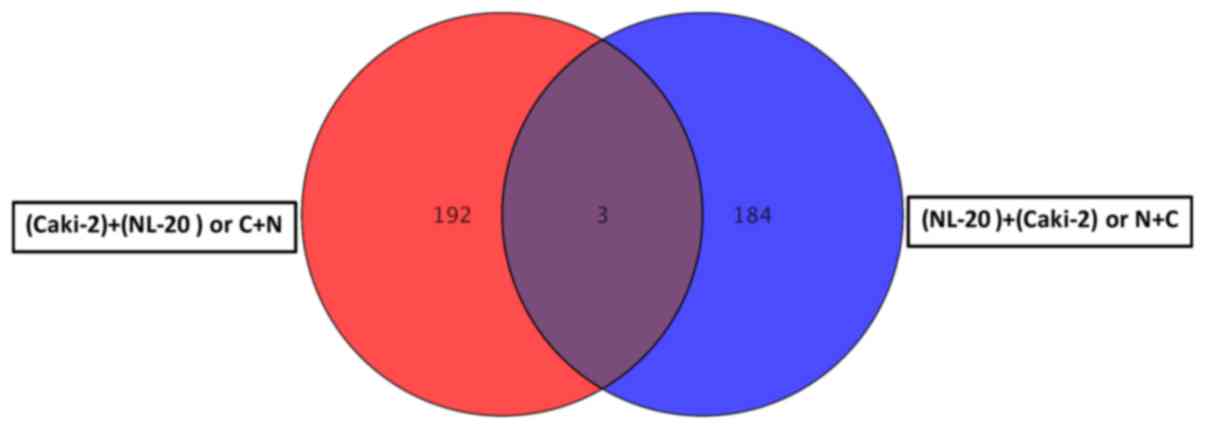
(Figs. 8 and 9). As the interaction was reciprocal,
both interactions, Caki-2 cells inducing NL-20 cells (N + C) and
NL-20 cells inducing Caki-2 cells (C + N), were significant
(Tables I–III). Co-culture of the Caki-2 and NL-20
cells resulted in the deregulation of a unique set of 178 genes in
the NL-20 cells (Tables I and
II, and Fig. 8), when compared to genes
deregulated in Caki-2 cells interacting with NL-20 cells (C + N),
as well as ACHN cells induced by NL-20 cells (A + N) and NL-20
cells induced by ACHN cells (N + A). At the same time, in the
Caki-2 cells, 182 genes were uniquely deregulated if compared to
all other interactions (N + C, N + A and A + N). If the interaction
between the NL-20 cells and Caki-2 was analyzed, only 3 genes were
deregulated both in the NL-20 cells and Caki-2 cells upon
interaction (Fig. 9), out of the
195 deregulated in NL-20 cells and 187 deregulated in Caki-2 cells.
The cells before and after interaction differed significantly
(co-culture vs. monoculture). If C + N was compared with Caki-2
monoculture, 326 genes were deregulated. At the same time, N + C
co-culture differed by 2,762 genes from NL-20 monoculture (Fig. 8).
| Table IIAnalysis of biological pathway
(WikiPathways) deregulation upon the interaction of normal
epithelial NL-20 pleural cells with renal cell carcinoma cells,
Caki-2. |
Table II
Analysis of biological pathway
(WikiPathways) deregulation upon the interaction of normal
epithelial NL-20 pleural cells with renal cell carcinoma cells,
Caki-2.
| Pathway name | Pathway no. | P-value |
|---|
| Metabolism of
angiotensinogen to angiotensins | WP2729 76948 | 0.035113286 |
| Extrinsic pathway
for apoptosis | WP1814 77023 | 0.04881313 |
| Translocation of
GLUT4 to the plasma membrane | WP2777 77058 | 0.014380898 |
| Transcriptional
regulation of white adipocyte differentiation | WP2751 76992 | 0.028172182 |
| Effects of PIP2
hydrolysis | WP1809 76979 | 0.045406394 |
| Signaling by the B
cell receptor (BCR) | WP2746 76984 | 0.055310383 |
| Prolactin receptor
signaling | WP2678 78711 | 0.001118844 |
| Syndecan
interactions | WP2787 77077 | 0.055590402 |
| Cytosolic sensors
of pathogen-associated DNA | WP2794 77085 | 0.020168457 |
| Advanced
glycosylation endproduct receptor signaling | WP1781 76860 | 0.04198754 |
| Table VIIAnalysis of the biological pathway
(WikiPathways) deregulation upon the interaction of Caki-2 renal
cell carcinoma cells and normal epithelial NL-20 pleural cells. |
Table VII
Analysis of the biological pathway
(WikiPathways) deregulation upon the interaction of Caki-2 renal
cell carcinoma cells and normal epithelial NL-20 pleural cells.
| Pathway name | Pathway no. | P-value |
|---|
| Extrinsic pathway
for apoptosis | WP1814 77023 | 0.049741678 |
| Transcriptional
regulation of white adipocyte differentiation | WP2751 76992 | 0.02918972 |
| RNA Polymerase I,
RNA Polymerase III, and mitochondrial transcription | WP1905 77034 | 0.03143341 |
| Signal
amplification | WP1908 76822 | 0.049741678 |
| GABA synthesis,
release, reuptake and degradation | WP2685 76885 | 0.053199083 |
| Table IIIAnalysis of biological pathway
(WikiPathways) deregulation upon the interaction of normal
epithelial NL-20 pleural cells with renal cell cancer cells
ACHN. |
Table III
Analysis of biological pathway
(WikiPathways) deregulation upon the interaction of normal
epithelial NL-20 pleural cells with renal cell cancer cells
ACHN.
| Pathway name | Pathway no. | P-value |
|---|
| Interleukin-6
signaling | WP2704 76915 | 0.04469201 |
| Activation of gene
expression by SREBP (SREBF) | WP2706 76917 | 0.006162484 |
| Opioid
signaling | WP1978 76919 | 0.051675532 |
| Fc-gamma receptor
(FCGR) dependent phagocytosis | WP2719 76936 | 0.006467762 |
| DAG and IP3
signaling | WP2688 76890 | 0.016291482 |
| GPCR ligand
binding | WP1825 76977 | 0.030907014 |
| GPCR downstream
signaling | WP1824 76910 | 0.0152681 |
| Transcriptional
activity of SMAD2-SMAD3-SMAD4 heterotrimer | WP2755 77005 | 0.030645737 |
| Fatty acid,
triacylglycerol, and ketone body metabolism | WP1817 77087 | 0.04063944 |
| Generic
transcription pathway | WP1822 77033 | 0.016291482 |
Genes deregulated in NL-20 cells from the N + C
co-culture, compared with NL-2 monoculture were clustered in 2,735
GO pathways and 40 WikiPathways (P≤0.05) (Tables I and II). Terpenoid, isoprenoid, retinol and
vitamin transport, as well as fatty acid oxidation, histone H3-K4
trimethylation, MAPKKK activity or cellular response to calcium ion
(Table I) and apoptotic signaling
(Table II) were induced in
metastatic target organ cells upon interaction with cancer cells.
In induced cells, glycosylation endproduct receptor signaling with
syndecan interactions (potentially with multiple ligands including
fibroblast growth factors (FGFs), vascular endothelial growth
factor (VEGF), transforming growth factor-β (TGF-β), fibronectin or
antithrombin-1) were deregulated, as well as downstream effects of
PIP2 hydrolysis (by G protein-coupled receptors listed above). The
transcription factors, peroxisome proliferator-activated receptor γ
(PPARγ), and CCAAT/enhancer binding protein (C/EBP), the
transcriptional cascades of white adipocyte differentiation were
also deregulated. Prolactin receptor signaling with the major
downstream signaling modules JAK/STAT, RAS/RAF/MAPK, PI3-Kinase/AKT
and RAC was also deregulated in the metastatic target organ normal
cells (pleural epithelial cells) (Table II).
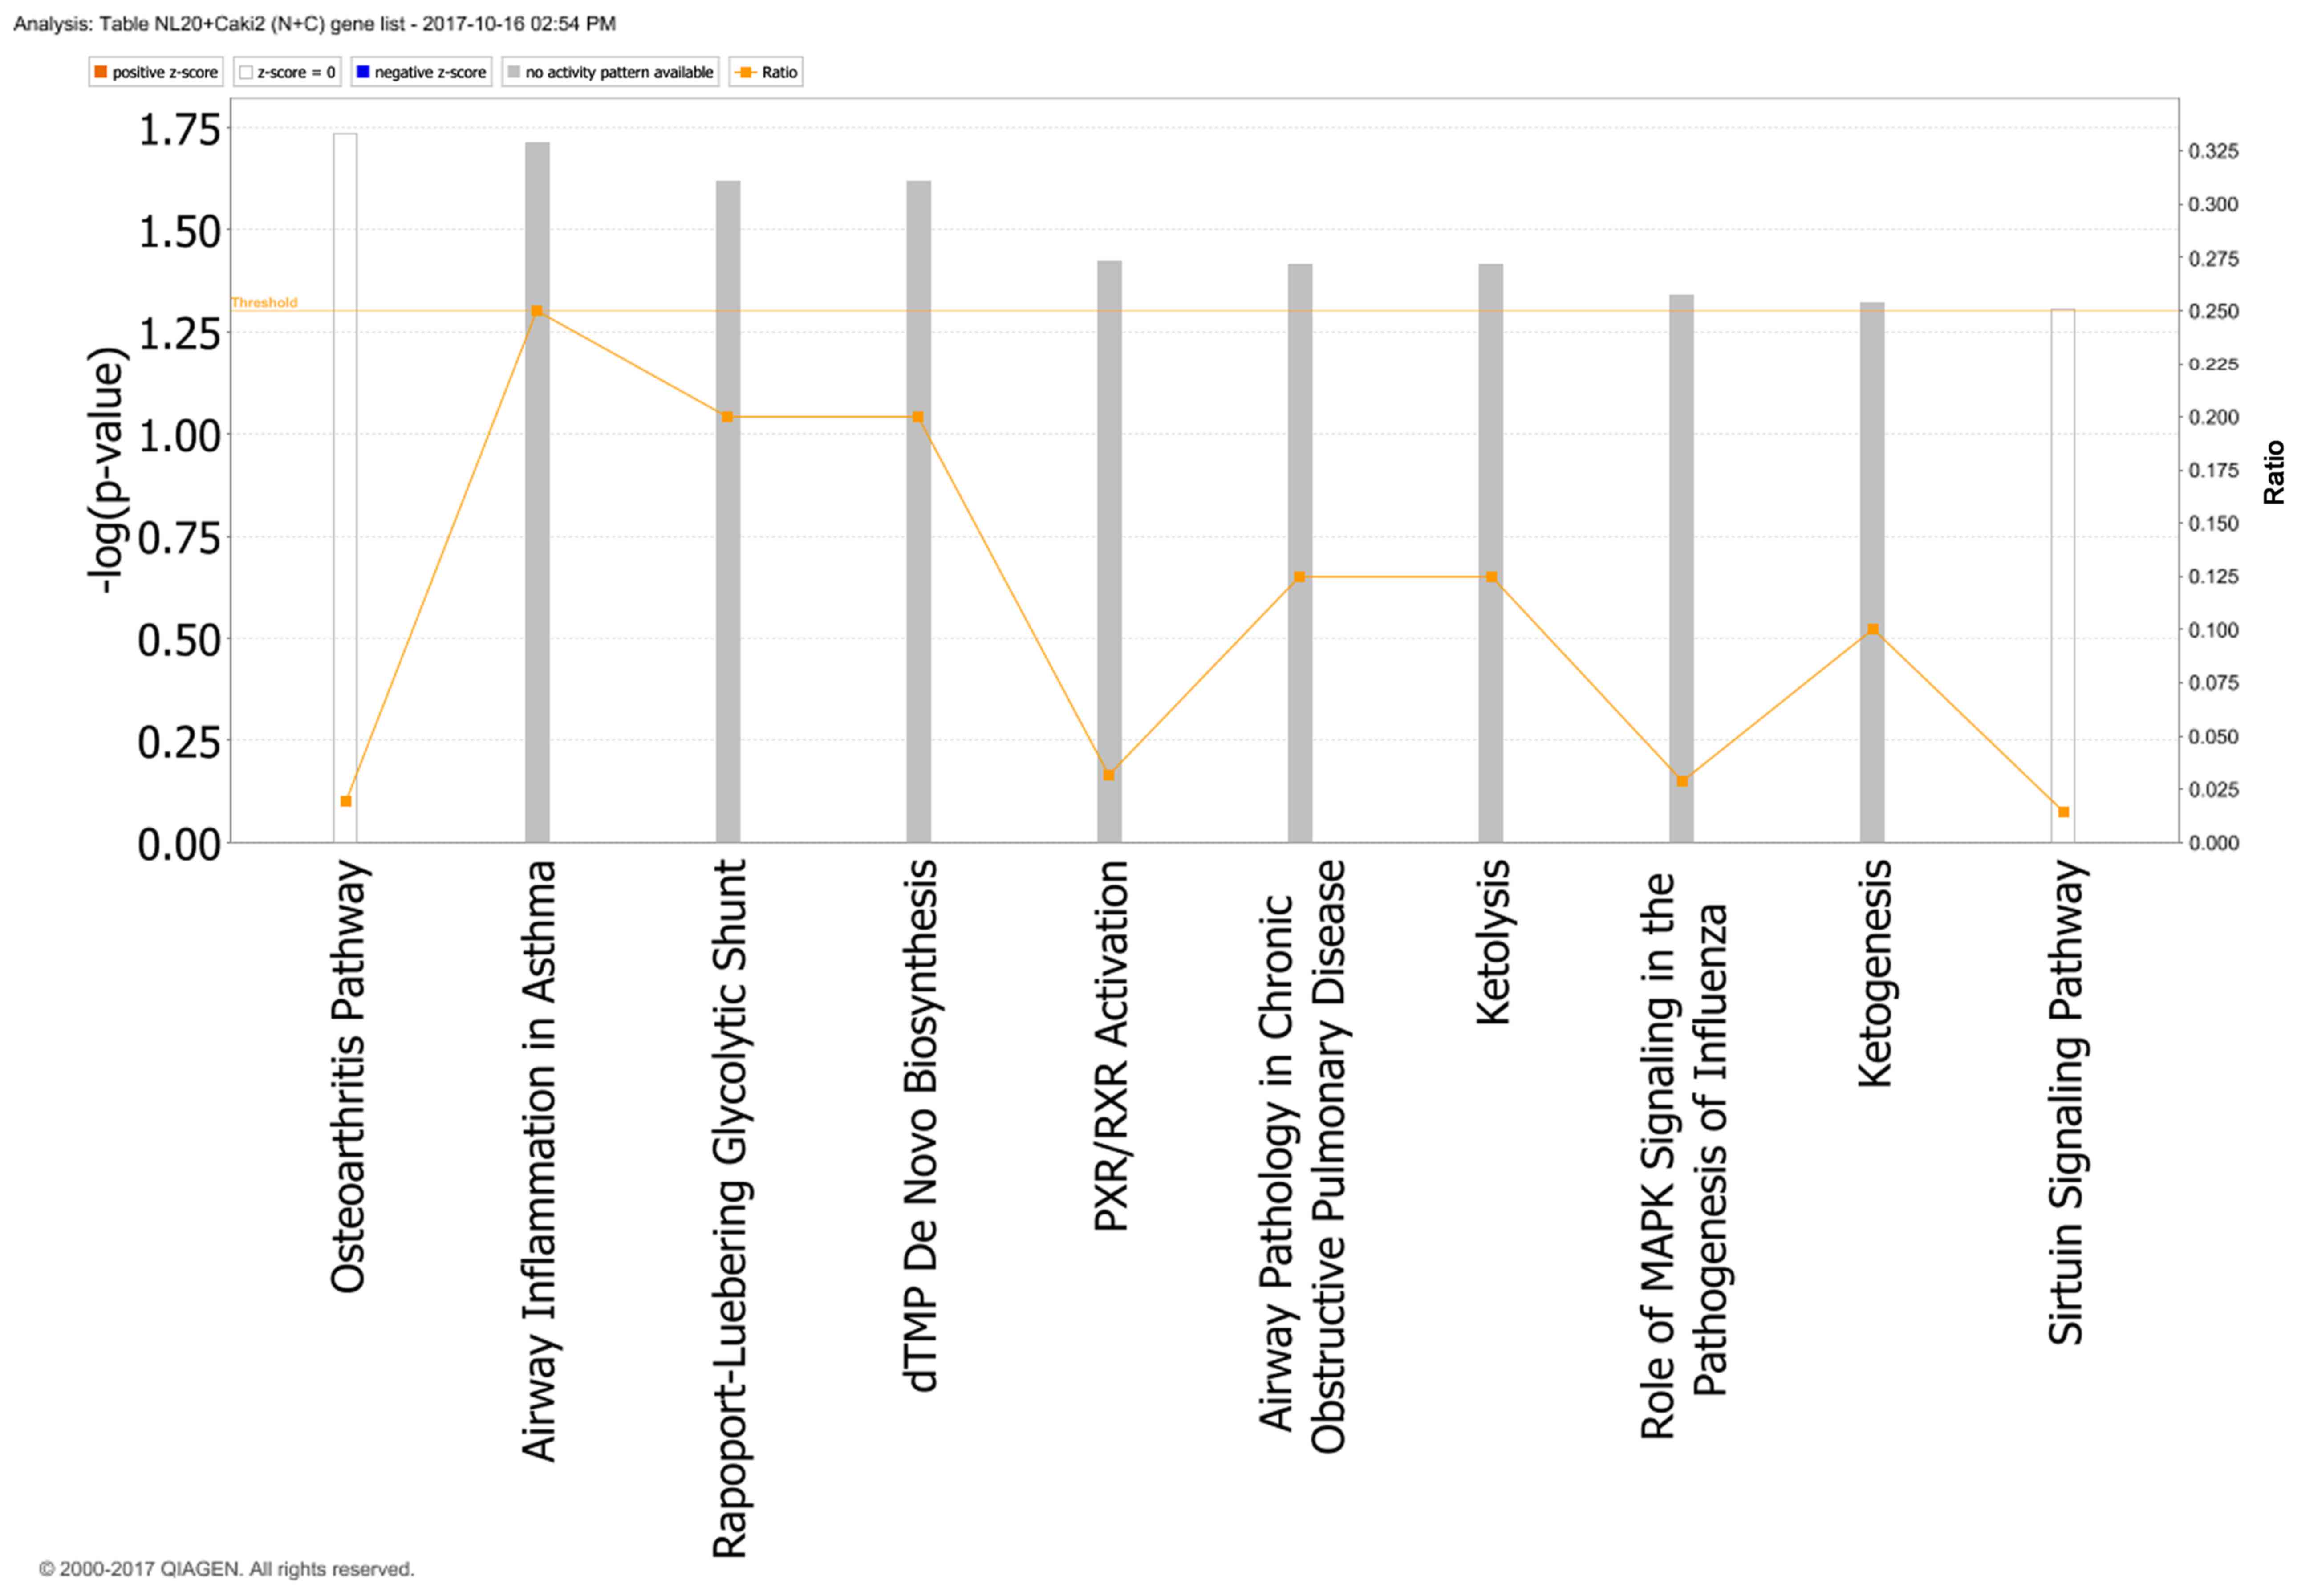
In particular, in the NL-20 cells, upon interaction
with Caki-2 cells, the top canonical pathways activated were those
of osteoarthritis (P=1.84E-02), airway inflammation (P=1.94E-02),
Rapoport-Luebering glycolytic shunt (P=2.42E-02), dTMP de
novo biosynthesis (P=2.42E-02) and PXR/RXR activation
(P=3.80E-02) pathways (Fig. 10)
with zinc finger proteins, long intergenic and non-protein coding
RNA and antisense RNA activation (Table IV). IPA analysis also revealed
that networks deregulated upon interaction were responsible for
hematological system development and function, immunological
diseases, lymphoid tissue structure and development (score = 35),
cell- to-cell signaling and interaction, connective tissue
disorders, developmental disorders (score = 32), as well as cancer,
organismal injury and abnormalities (score = 23), as well as
cellular growth and proliferation (score = 21). Cell morphology,
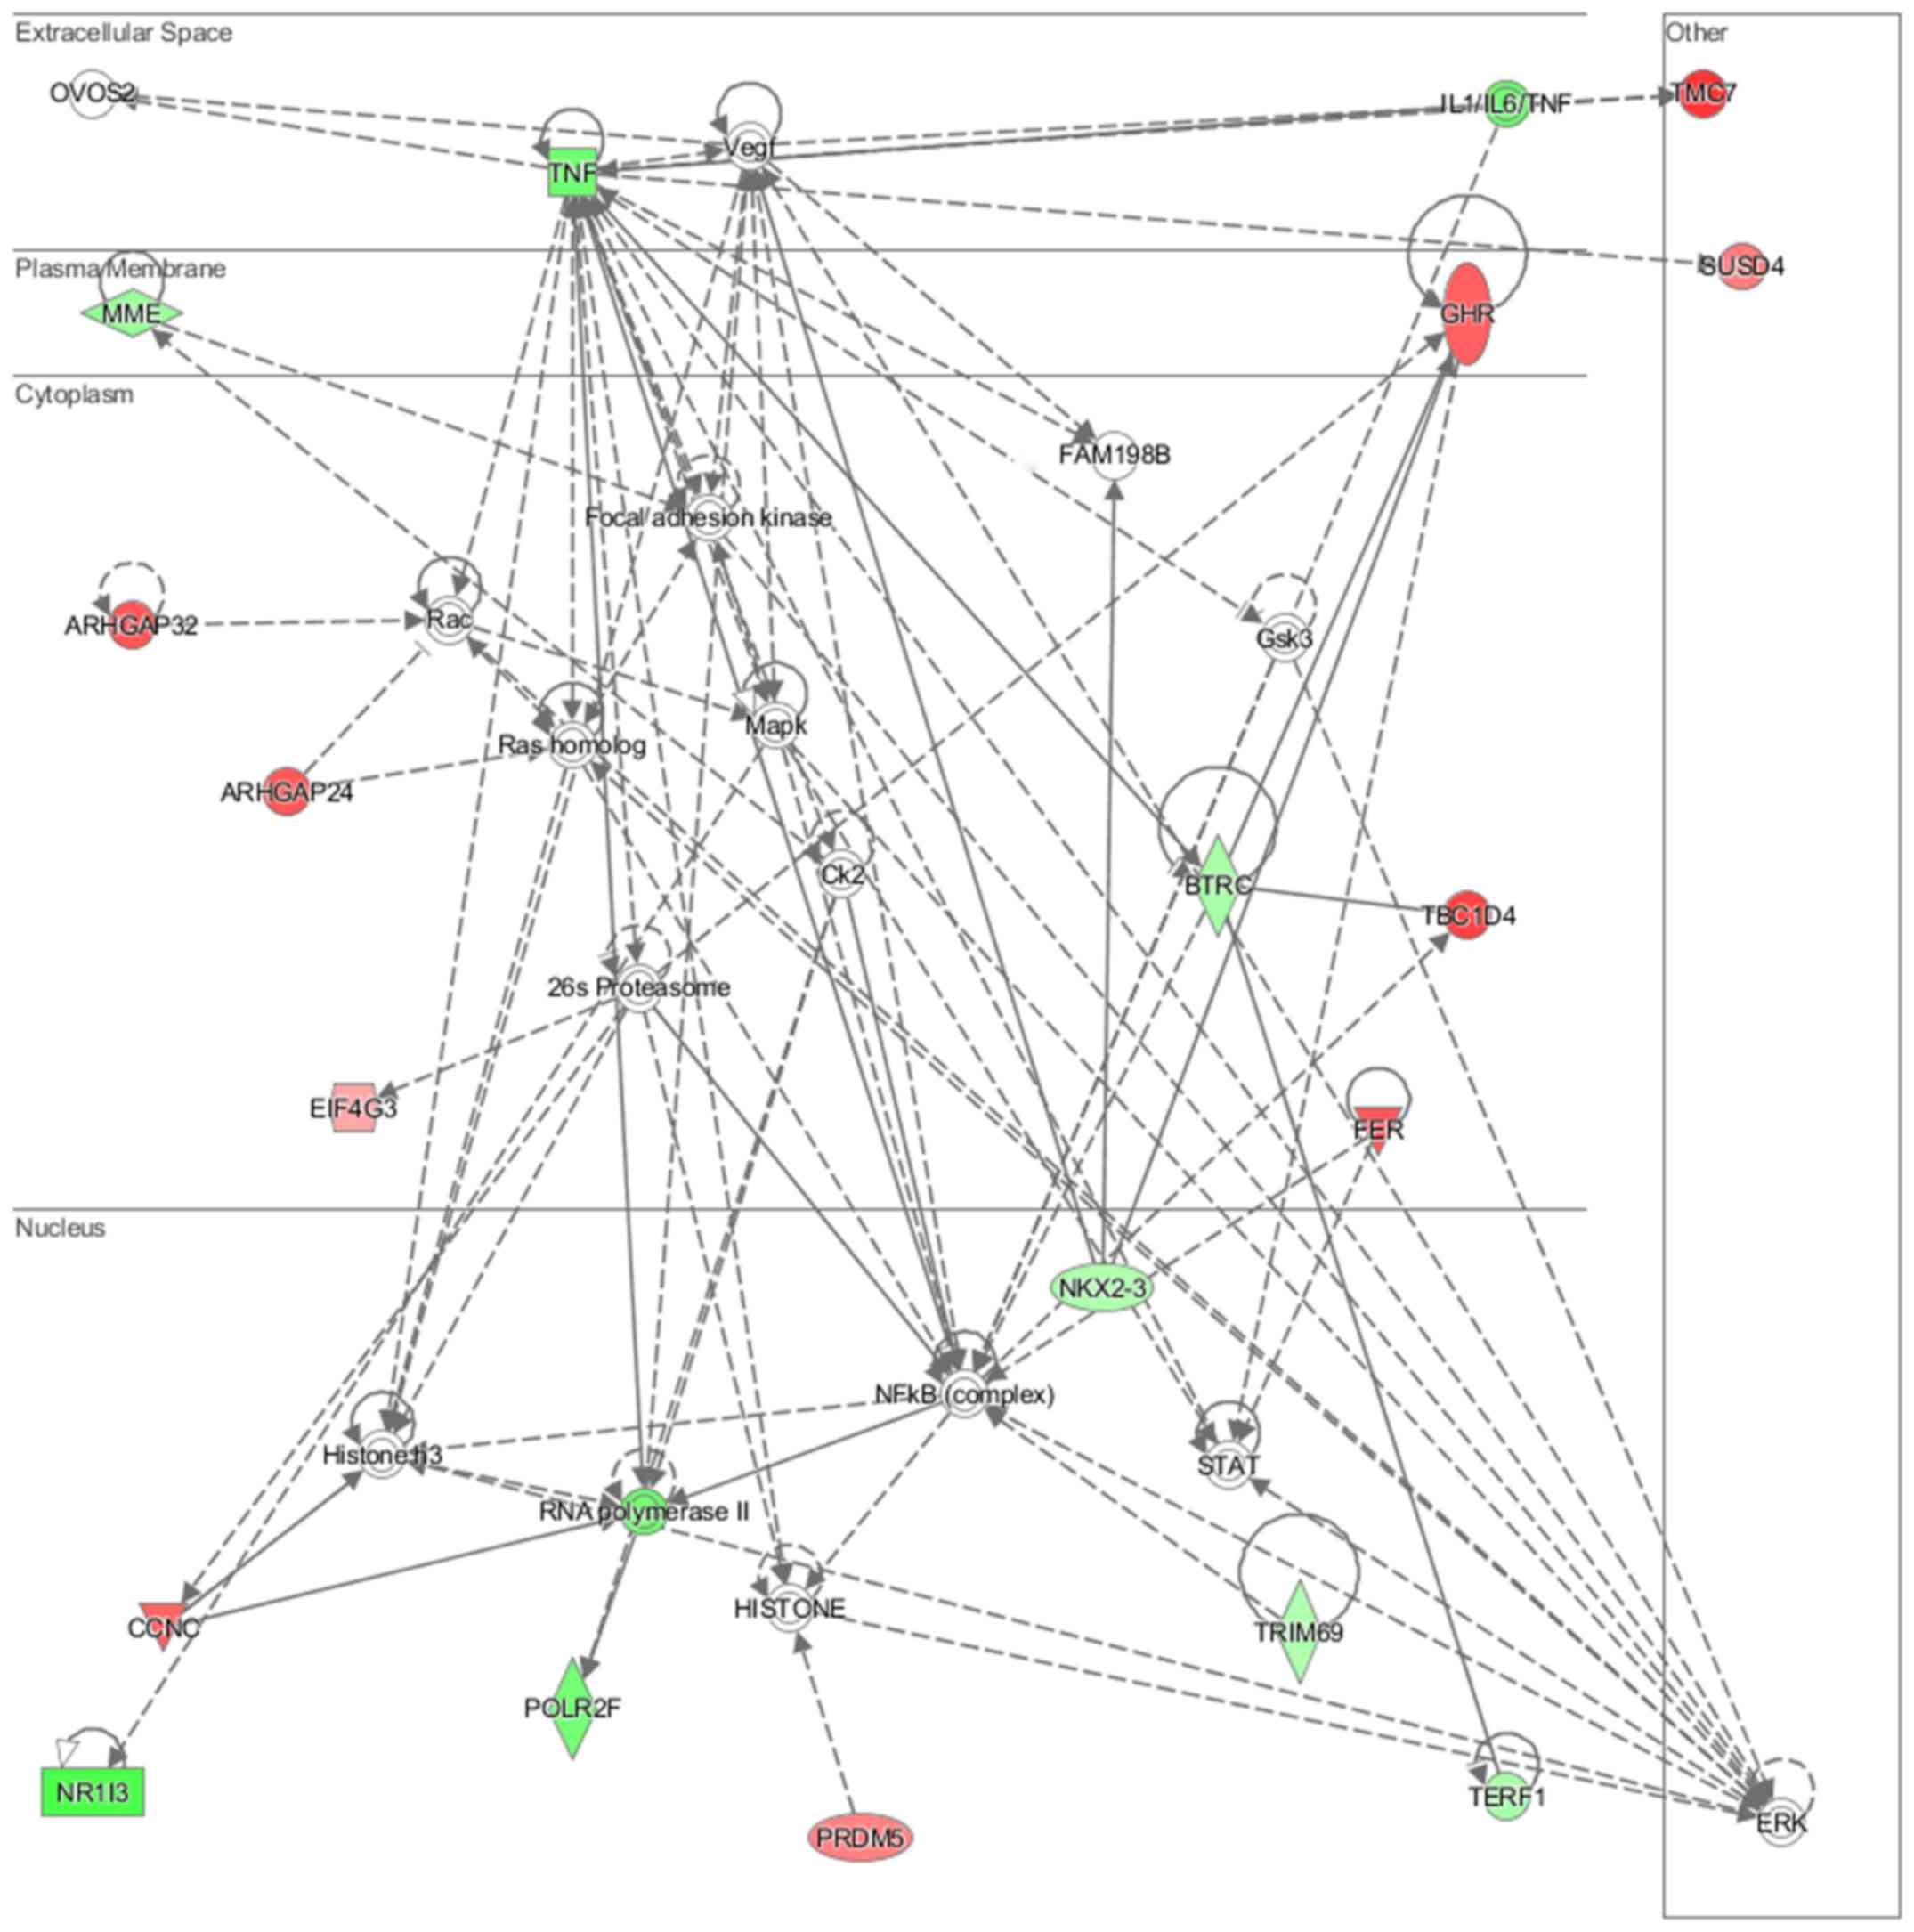
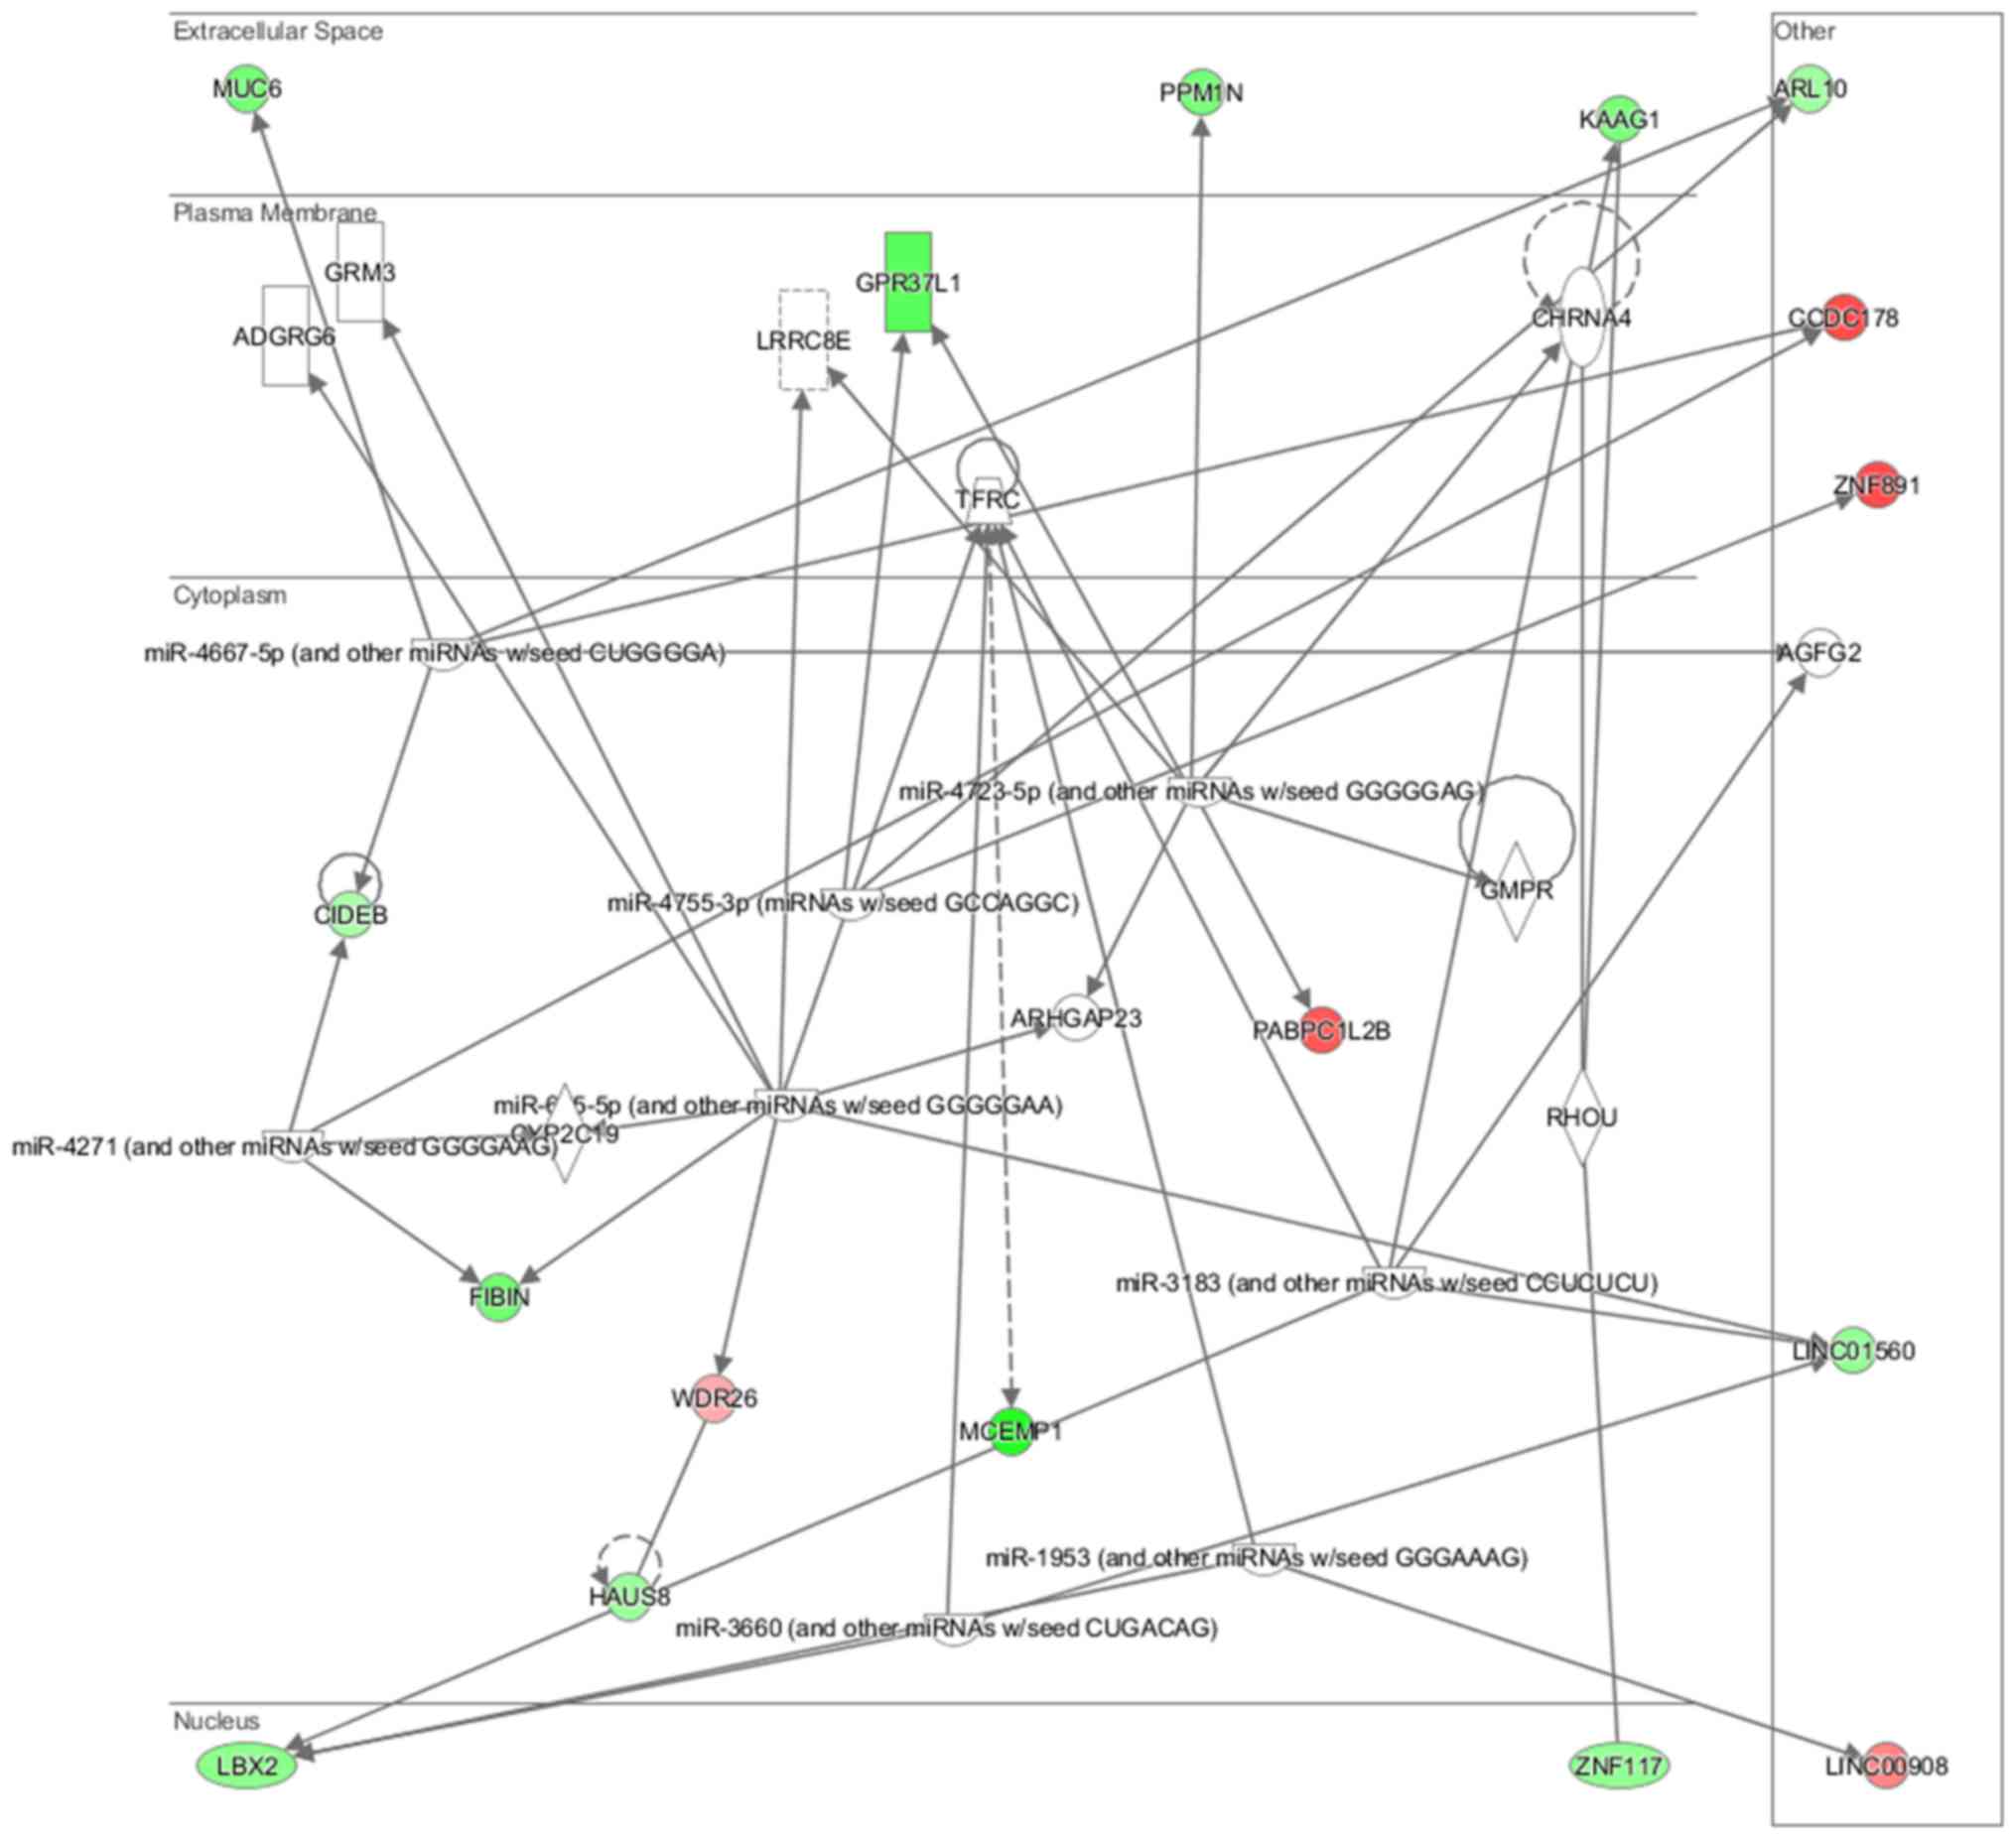
lipid metabolism and molecular transport (Fig. 11), cell-to-cell signaling and
interaction, connective tissue disorder and developmental disorder
(Fig. 12) as well a cell-to-cell
communication (Fig. 13) networks
analysis revealed that induced NL-20 cell-cell communication was
mediated by VEGF, protein phosphatase,
Mg2+/Mn2+ dependent 1N (PPM1N), IL-15, IL-26,
insulin like growth factor binding protein 1 (IGFB1), complement
factor B (CFB), phospholipase A1 member A (PLA1A), ovostatin 2
(OVOS2), serpin family D member 1 (SERPIND1), but tumor necrosis
factor (TNF), IL-1, IL-6, kidney-associated antigen 1 (KAAG1) and
mucin 6 (MUC6) signaling was down-regulated.
| Table IVTop analysis-ready molecules in NL-20
cells upon interaction with Caki-2 cells. |
Table IV
Top analysis-ready molecules in NL-20
cells upon interaction with Caki-2 cells.
Upregulated genes
| Downregulated genes
|
|---|
| Molecules | Expression
value | Molecules | Expression
value |
|---|
| ATP2B1-AS1, ATP2B1
antisense RNA 1 | 2.943 | H1FOO, H1 histone
family member O, oocyte specific | −3.322 |
| LINC00899, long
intergenic non-protein coding RNA 899 | 2.904 | MCEMP1, mast cell
expressed membrane protein 1 | −3.241 |
| TMC7, transmembrane
channel like 7 | 2.878 | DCDC1, doublecortin
domain containing 1 | −3.125 |
| ZNF638, zinc finger
protein 638 | 2.740 | LOC101927533,
uncharacterized | −3.016 |
| TBC1D4, TBC1 domain
family member 4 | 2.715 | SLC37A3, solute
carrier family 37 member 3 | −3.002 |
| ZNF765, zinc finger
protein 765 | 2.695 | CATSPERD, cation
channel sperm associated auxiliary subunit delta | −2.995 |
| ZNF891, zinc finger
protein 891 | 2.563 | MST1P2, macrophage
stimulating 1 pseudogene 2 | −2.918 |
| CCDC178,
coiled-coil domain containing 178 | 2.560 | VAT1L, vesicle
amine transport 1 like | −2.892 |
| DUSP19, dual
specificity phosphatase 19 | 2.551 | NR1I3, nuclear
receptor subfamily 1 group I member 3 | −2.676 |
| ZNF354B, zinc
finger protein 354B | 2.493 | LOC100131372,
uncharacterized | −2.576 |
At the same time genes deregulated in Caki-2 cells
from C + N co-culture, compared with Caki-2 monoculture were
clustered in and 276 GO pathways and 17 WikiPathways (P≤0.05)
(Tables V and VI). In the cancer cells, histone
pre-mRNA 3′ end processing complex, nucleic acid-templated
transcription, RNA biosynthetic processes along with morphogenesis
and migration were deregulated (Table
VI). At the same time, apoptotic signaling, RNA polymerase I,
RNA polymerase III, and mitochondrial transcription and GABA
synthesis, release, reuptake and degradation (Table VI) were significantly altered.
Therefore, it seems that normal cell function is more influenced
upon first cancer cell interaction, than is the physiology of the
cancer cell.
Gene expression is deregulated upon the
interaction of metastatic RCC tumor cells with normal pleural
cells
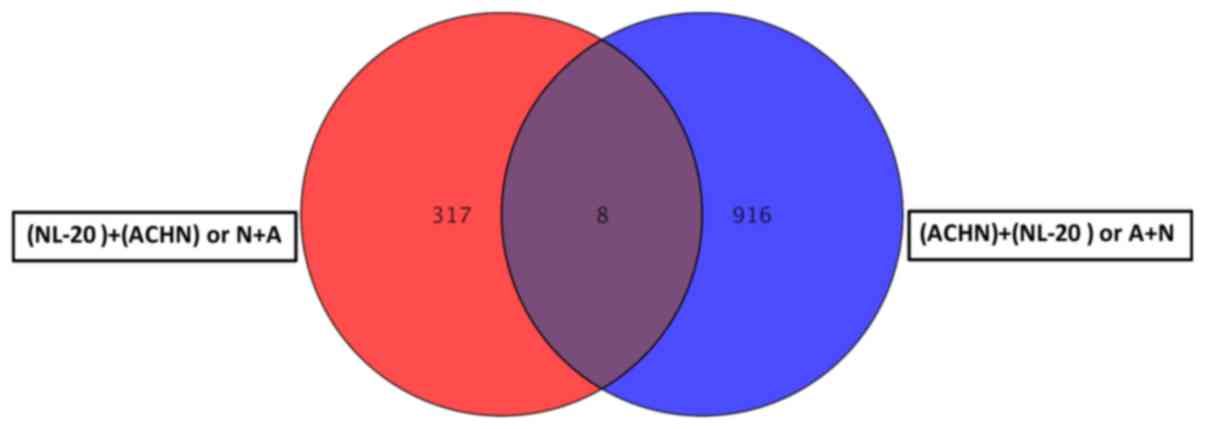
Co-culture of the ACHN and NL-20 cells resulted in
the deregulation of unique set of 314 genes in NL-20 cells
(Table I and Fig. 8), when compared to genes
deregulated in ACHN cells interacting with NL-20 cells (A + N), as
well as in Caki-2 cells induced by NL-20 cells (C + N) and NL-20
cells induced by Caki-2 cells (N + C). At the same time, in ACHN
cells, 902 genes were uniquely deregulated if compered to all other
interactions (N + A, N + C and C+N). If the interaction between the
NL-20 cells and ACHN cells was analyzed, only 8 genes were
deregulated both in the NL-20 cells and in ACHN cells upon
interaction (Fig. 14), out of the
325 genes deregulated in the NL-20 cells and 924 genes deregulated
in the ACHN cells. If A + N was compared with ACHN monoculture
25,735 genes were deregulated. At the same time, N + A co-culture
differed by 27,707 genes from the NL-20 monoculture (Table VIII).
| Table VIIIAnalysis of the process of ontology
deregulated upon the interaction of ACHN renal cell carcinoma cells
with normal epithelial NL-20 pleural cells. |
Table VIII
Analysis of the process of ontology
deregulated upon the interaction of ACHN renal cell carcinoma cells
with normal epithelial NL-20 pleural cells.
| GO Term | P-value |
|---|
| Voltage-gated
cation channel activity | 9.48E-05 |
| System process | 1.27E-04 |
| Detection of
chemical stimulus involved in sensory perception | 2.29E-04 |
| Oculomotor nerve
formation | 2.89E-04 |
| Oculomotor nerve
morphogenesis | 2.89E-04 |
| Detection of
stimulus involved in sensory perception | 2.93E-04 |
| Sensory perception
of chemical stimulus | 3.27E-04 |
| Voltage-gated
channel activity | 5.11E-04 |
| Voltage-gated ion
channel activity | 5.11E-04 |
| Cation channel
complex | 5.34E-04 |
| Substrate-specific
channel activity | 5.51E-04 |
| Bitter taste
receptor activity | 5.67E-04 |
| Cation channel
activity | 6.05E-04 |
| Detection of
chemical stimulus | 6.61E-04 |
| Digestive tract
development | 7.93E-04 |
| Extracellular
matrix component | 8.39E-04 |
| Stereocilium
membrane | 8.59E-04 |
| Basement
membrane | 9.29E-04 |
| Passive
transmembrane transporter activity | 9.45E-04 |
| Channel
activity | 9.45E-04 |
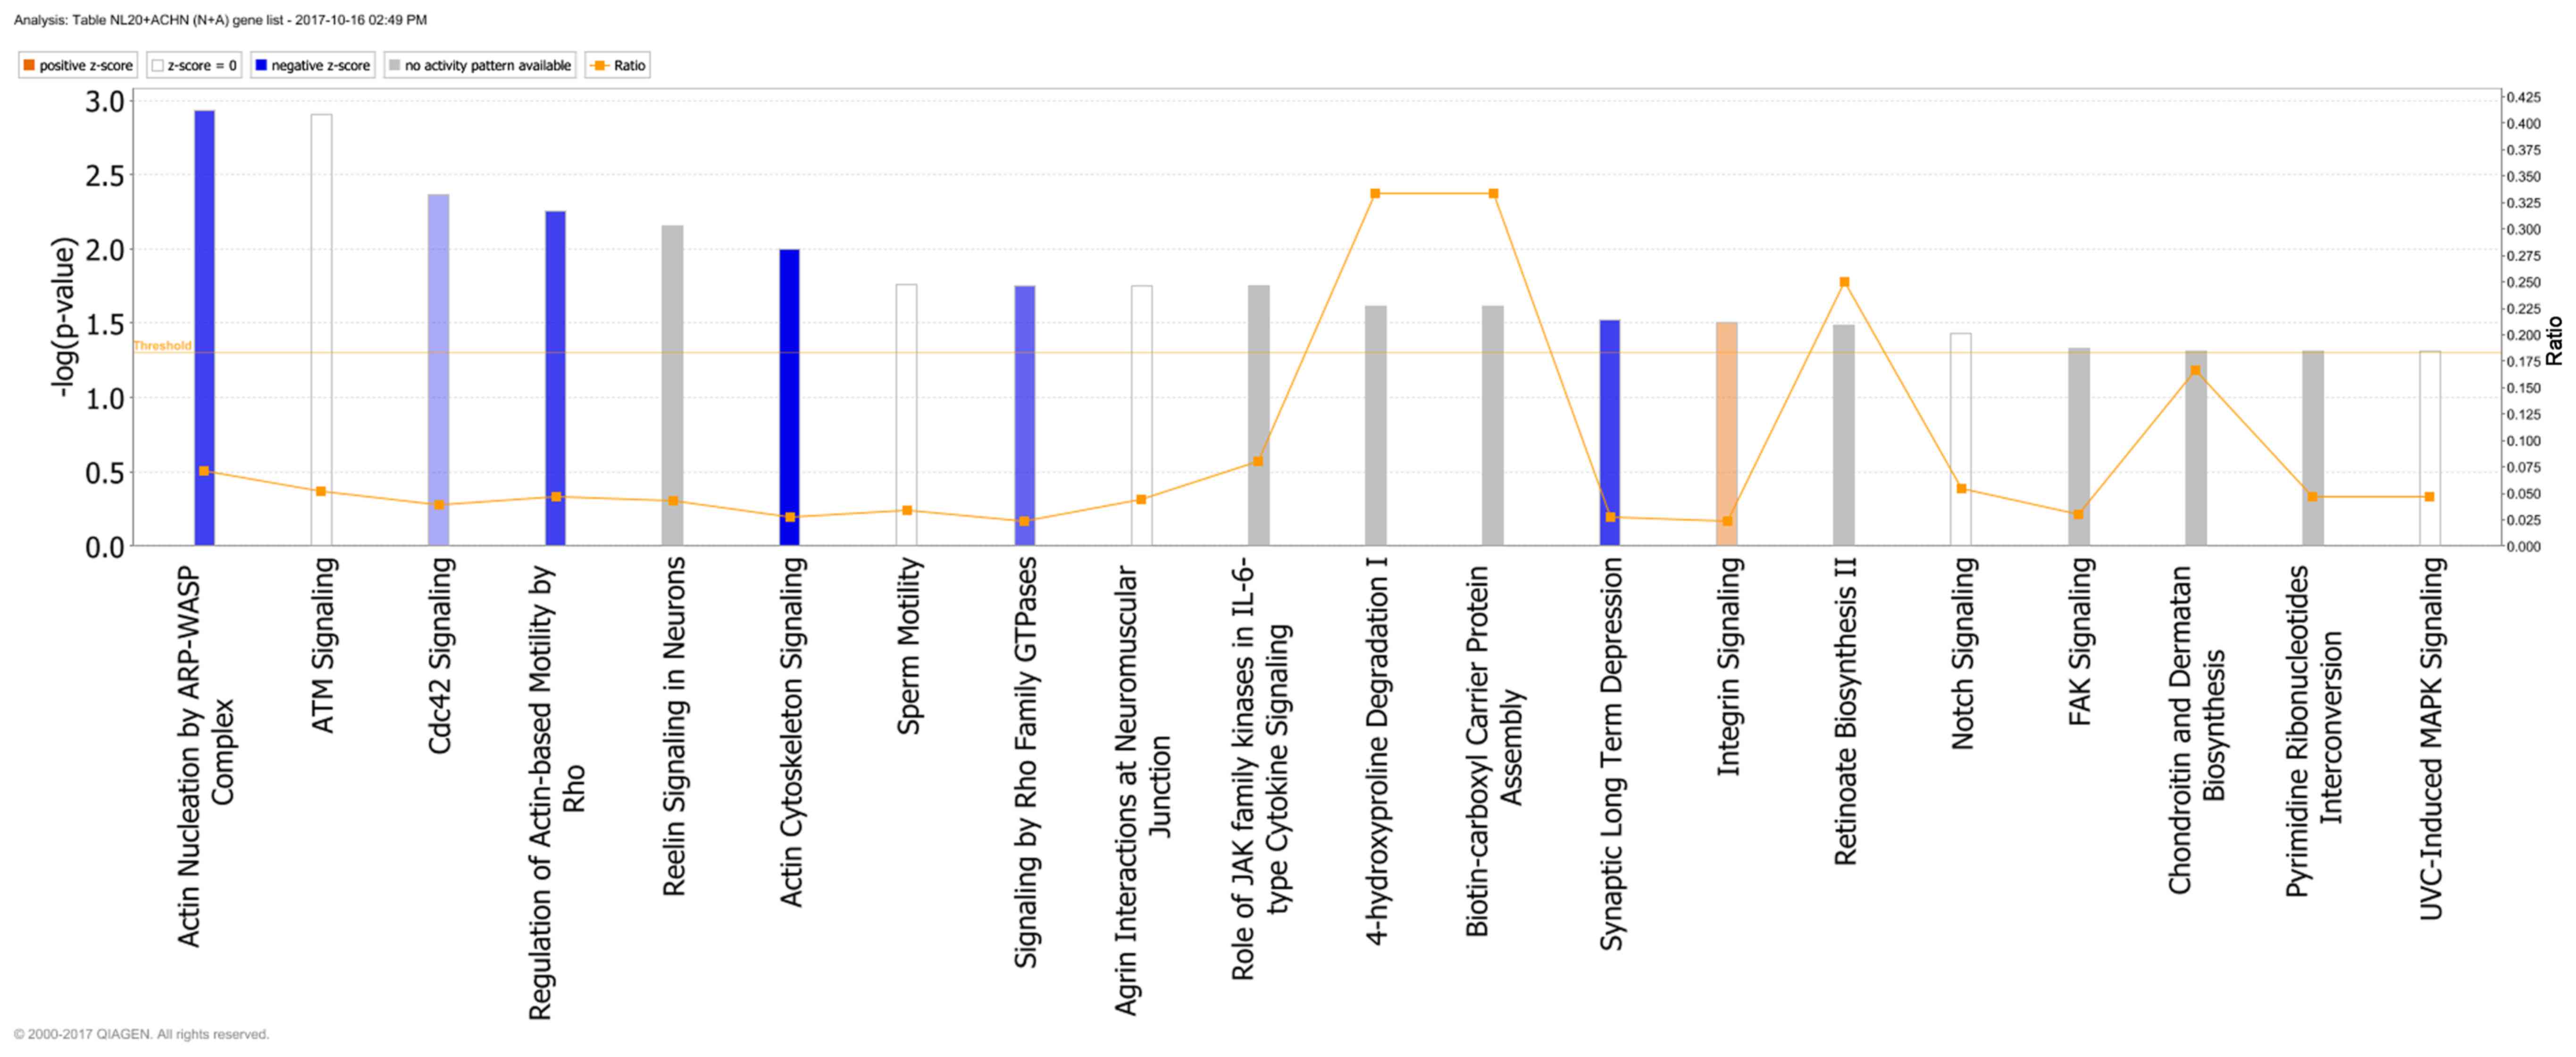
Genes deregulated in the NL-20 cells from N + A
co-culture, compared with NL-20 monoculture were clustered in 544
GO pathways and 69 WikiPathways (P≤0.05) (Tables I and III). In particular, in NL-20 cells upon
interaction with ACHN cells, the top canonical networks deregulated
were actin nucleation by ARP-WASP complex (P=1.16E-03), ATM
signaling (P=1.24E-03), Cdc42 signaling (P=4.29E-03), regulation of
actin-based motility by Rho (P=5.54E-03) and Reelin signaling in
neurons (P=7.03E-03) (Fig. 15).
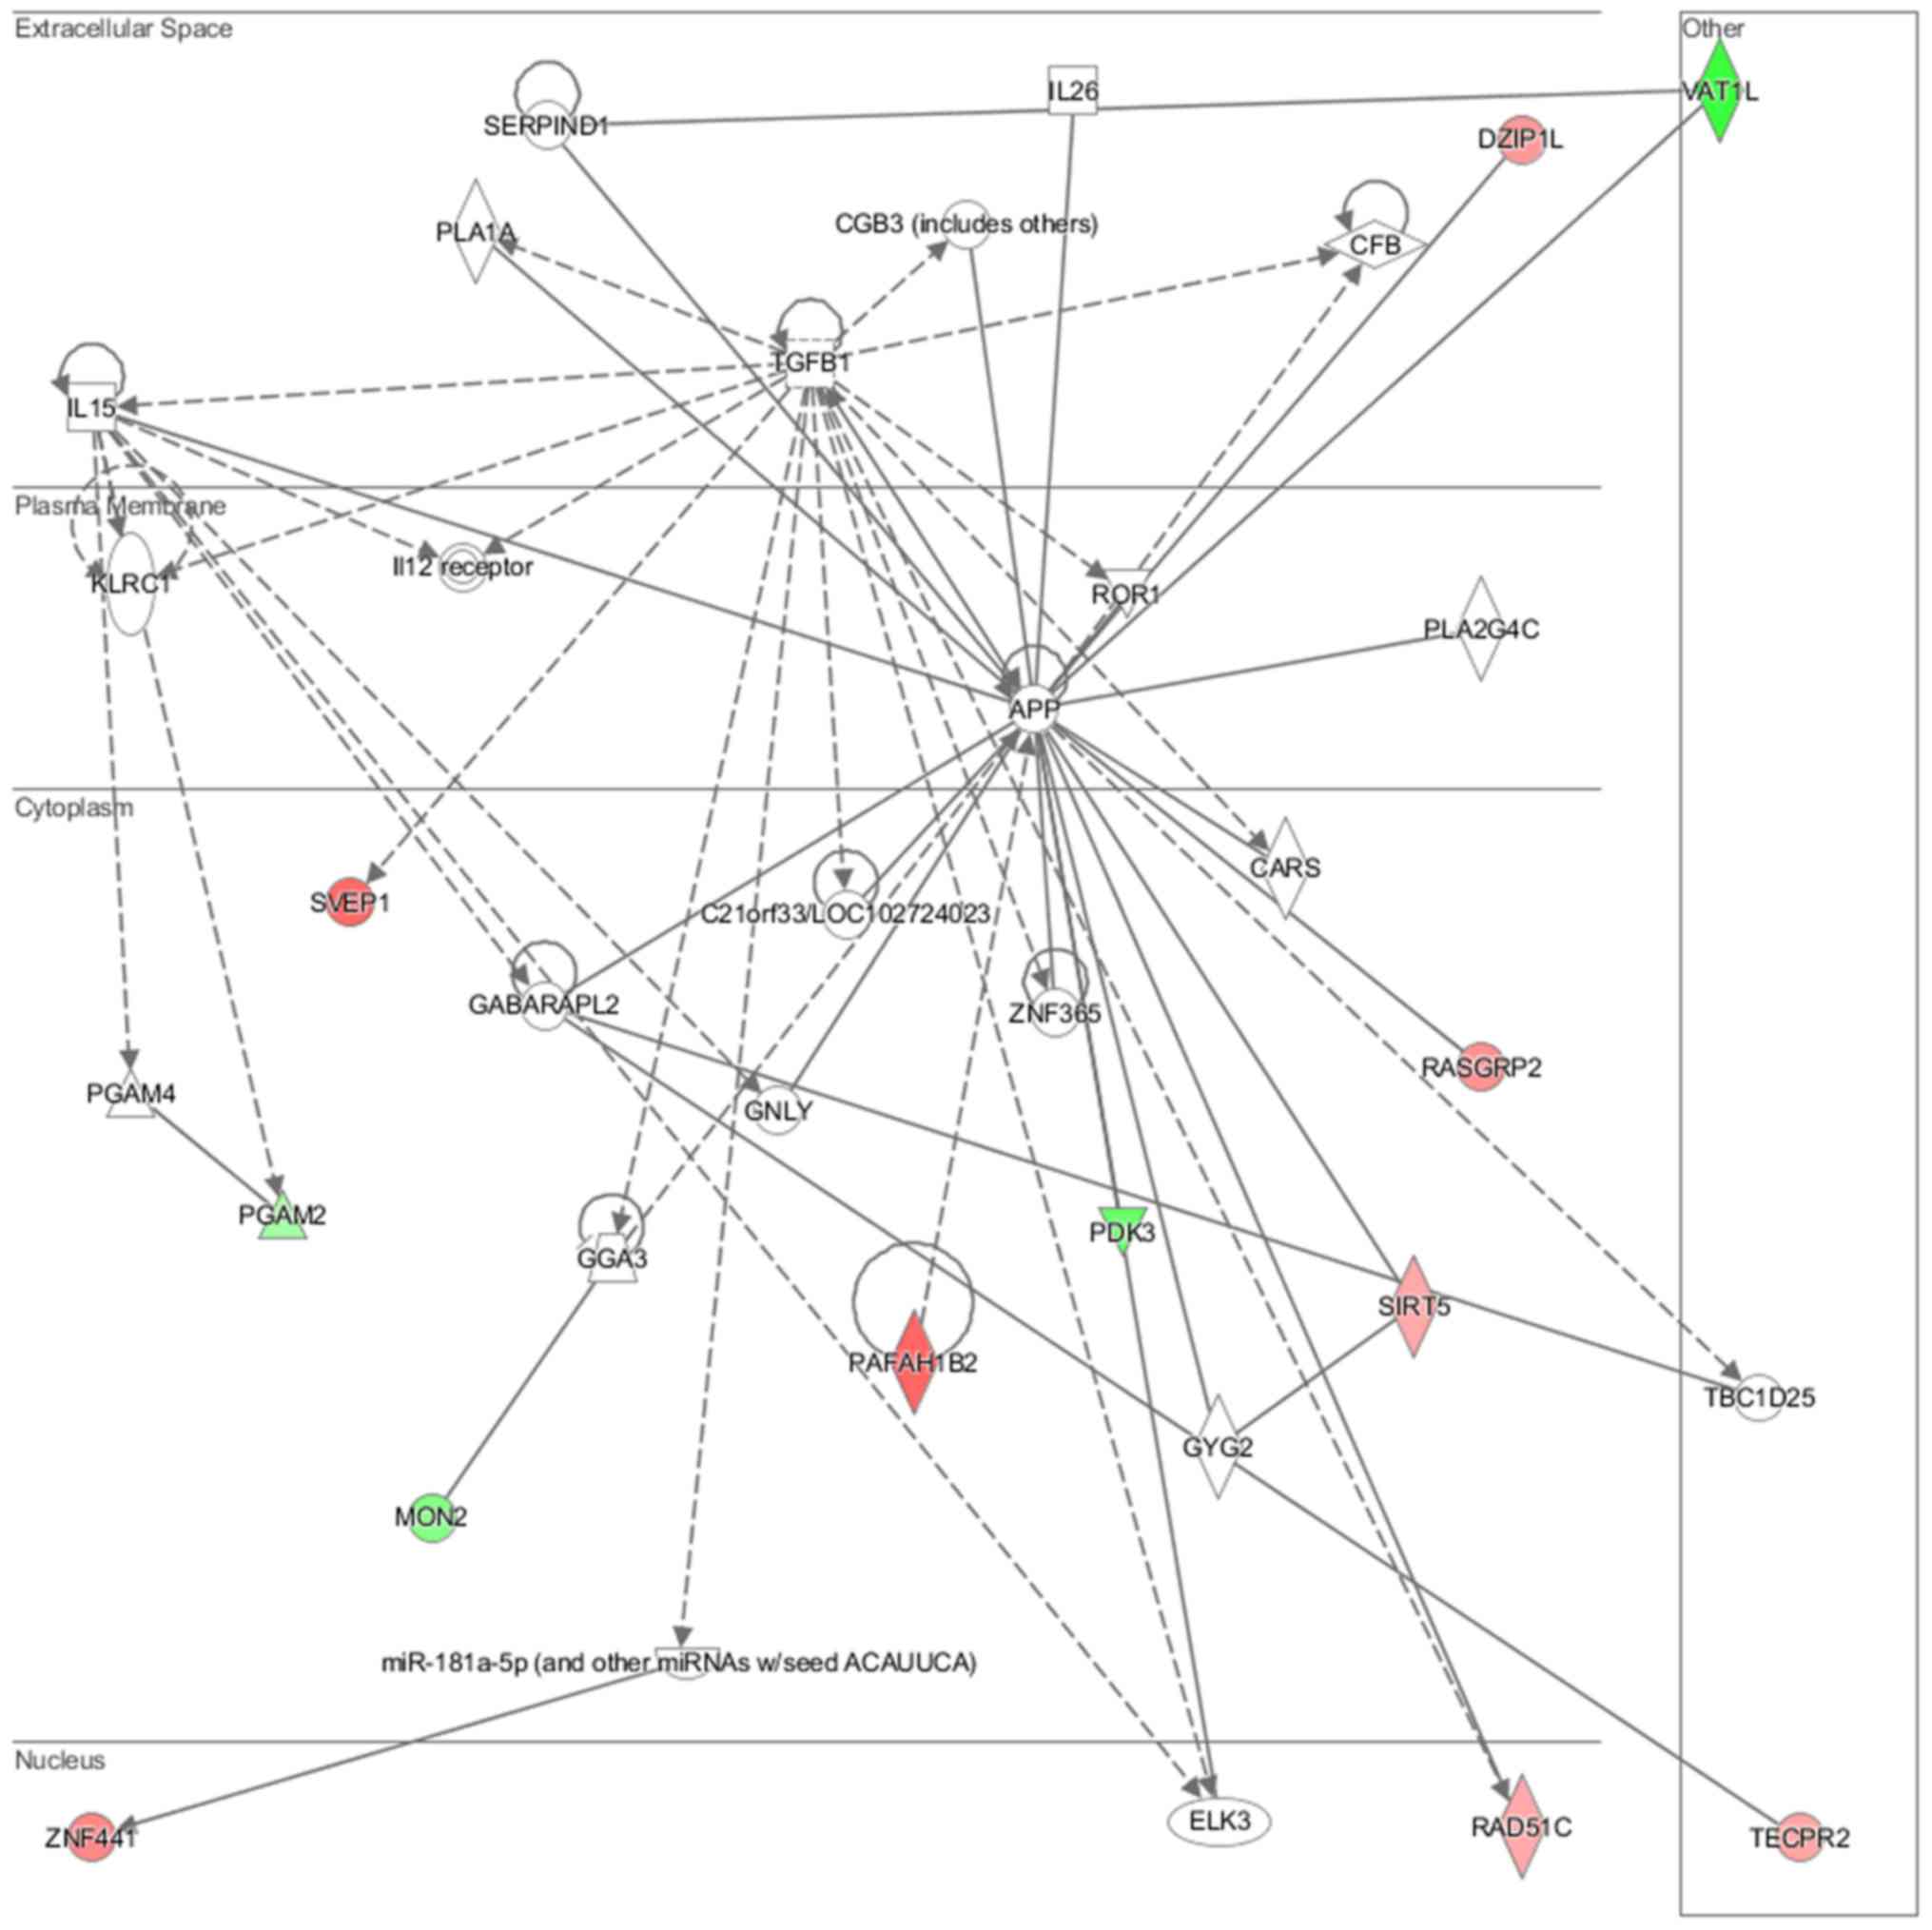
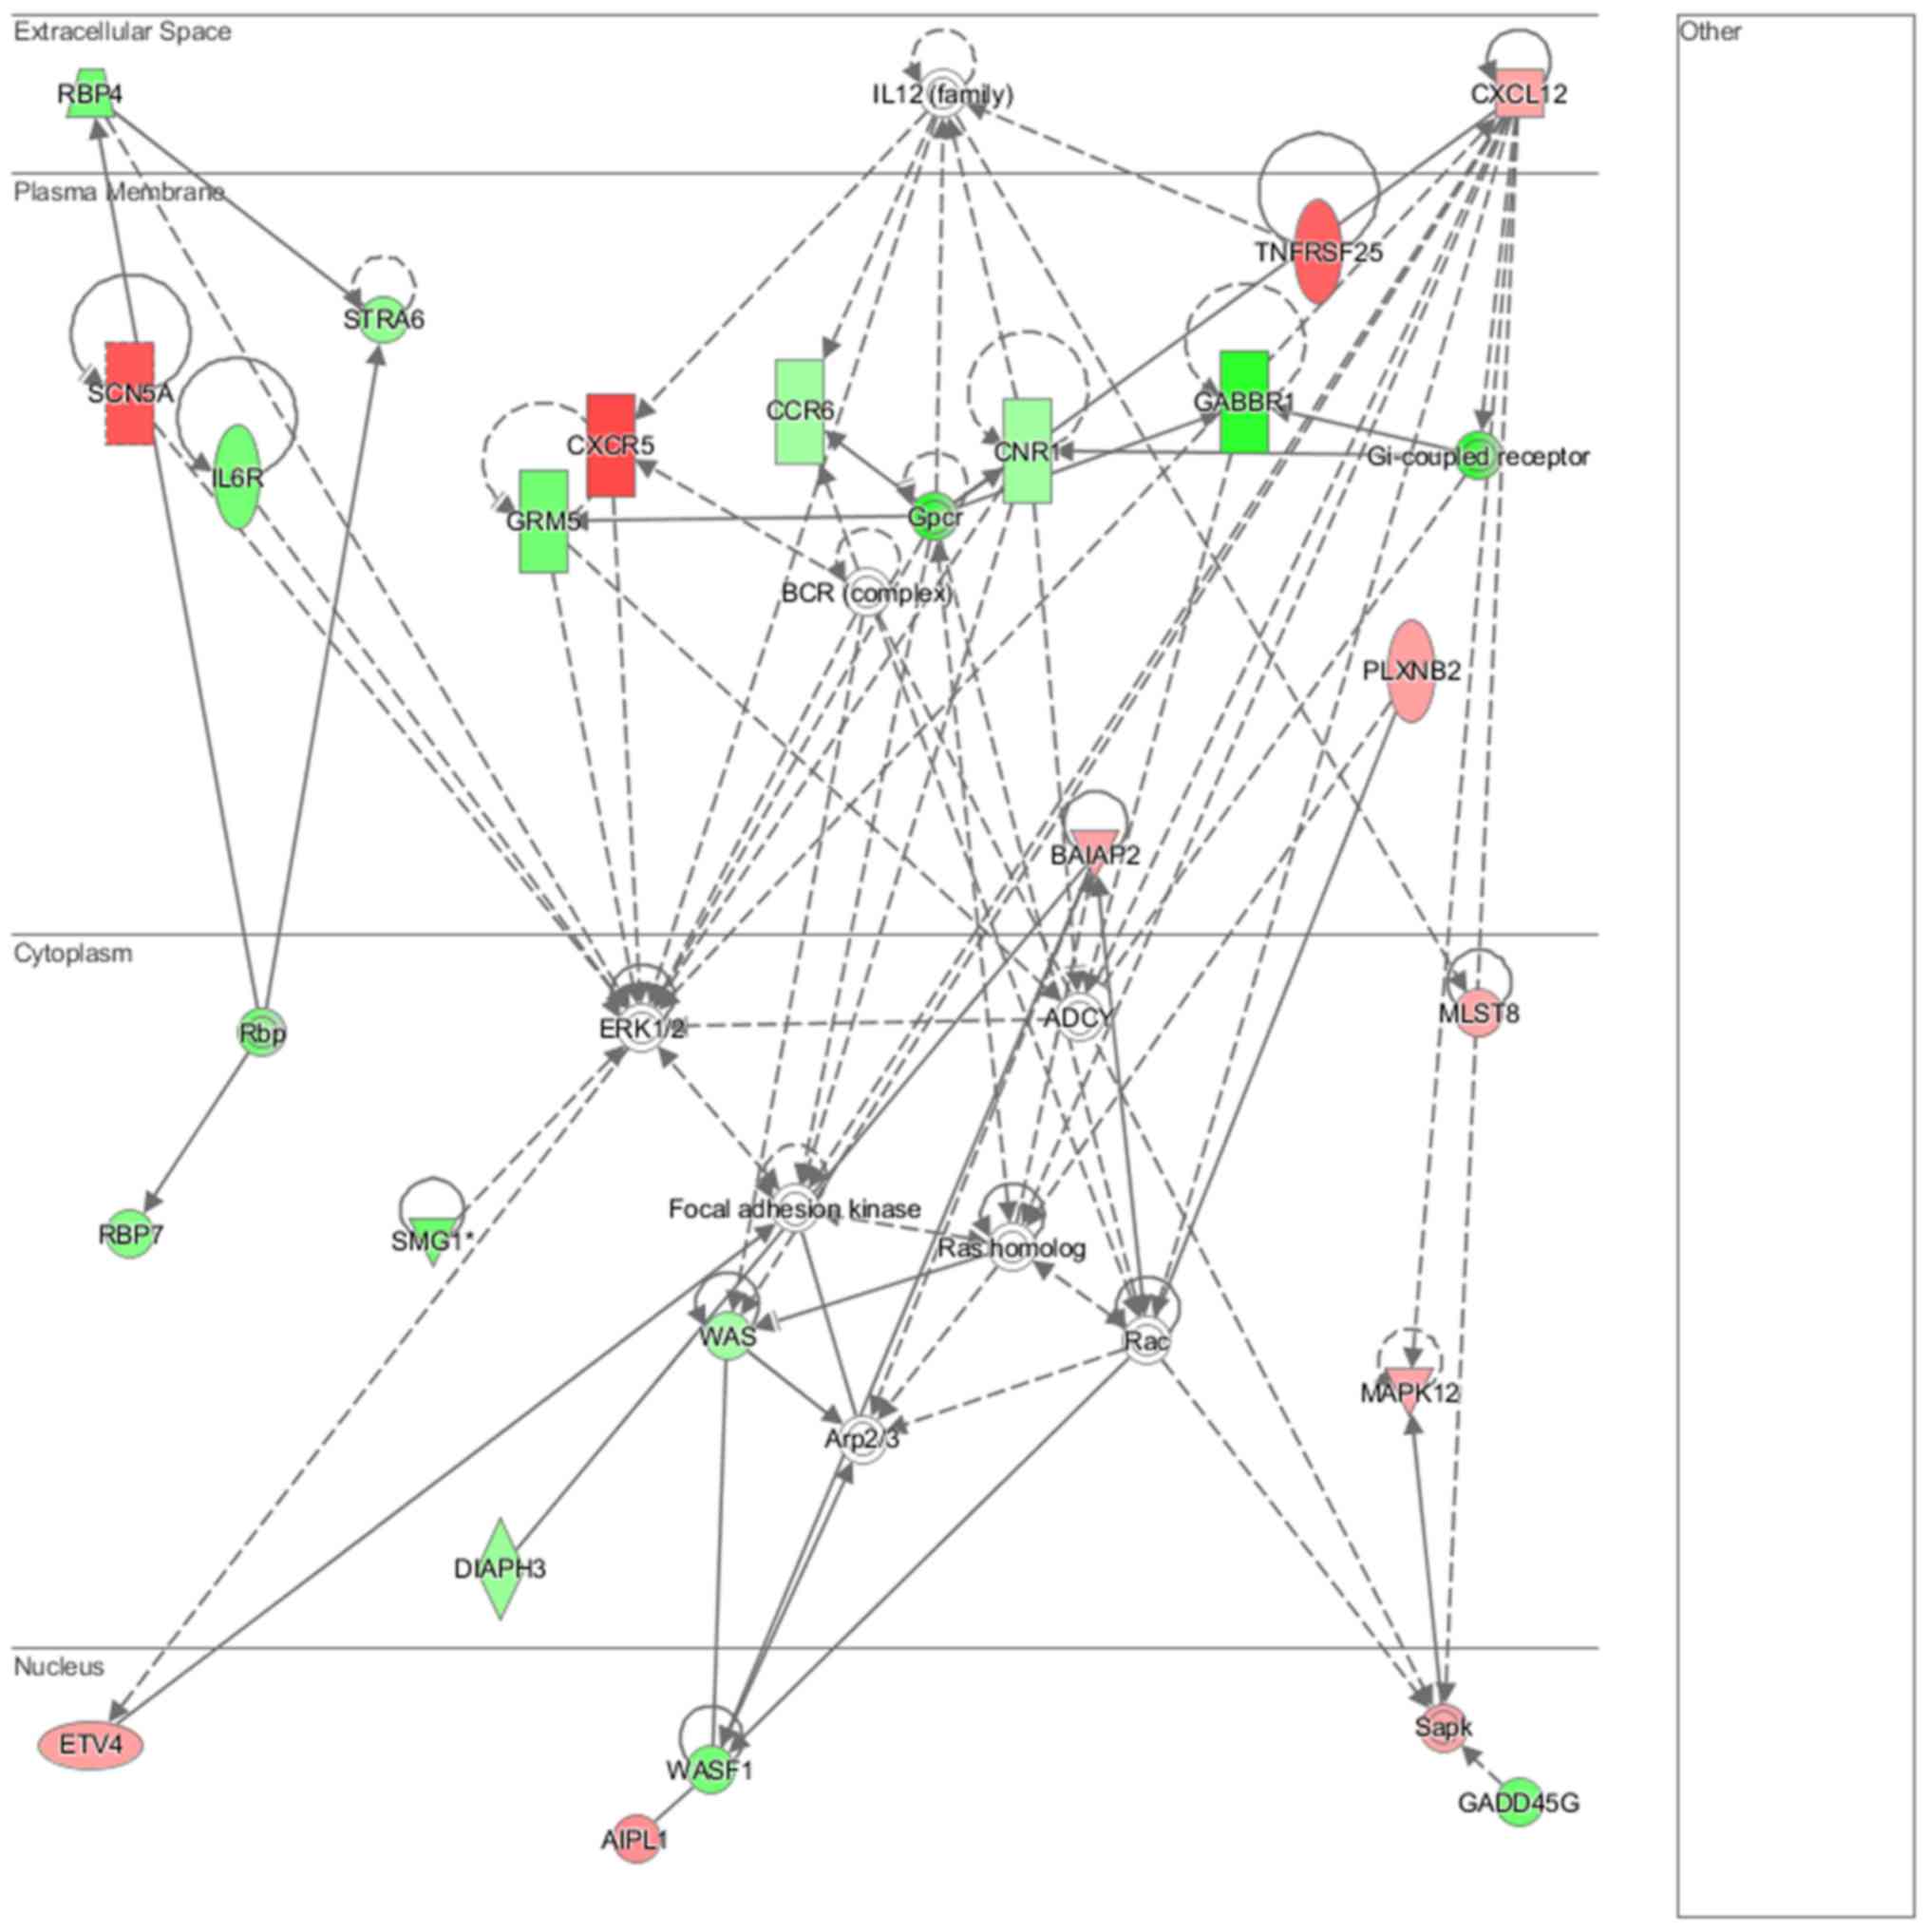
Cell morphology, lipid metabolism and molecular transport (Fig. 16), cell death and survival,
embryonic development, nervous system development and function
(Fig. 17), cell signaling and
interaction (Fig. 18) network
analysis revealed that the ACHN-induced NL-20 cell-cell
communication was mediated by IL-1, IL-12, VEGF, putative protease
inhibitor WAP1 (WFDC5), while C-X-C motif chemokine ligand 12
(CXCL12), trefoil factor 3 (TFF3), serpin family B member 5
(SERPINB5), bone morphogenetic protein 7 (BMP7) signaling was
upregulated.
IPA analysis also revealed that networks deregulated
upon interaction were responsible for cell morphology, lipid
metabolism, molecular transport (score = 42), cell death and
survival, embryonic development, nervous system development and
function (score = 35), cancer, organismal injury and abnormalities,
(score = 32) and connective tissue disorders (score = 30). Upon
interaction in the NL-20 cells, IL-6, opioid and DAG and IP3
signaling were deregulated with mothers against decapentaplegic
homologs (SMAD)2-SMAD3-SMAD4 deregulated (Table III), C-X-C motif chemokine
receptor 5 (CXCR5) and zinc finger proteins upregulated (Table VII).
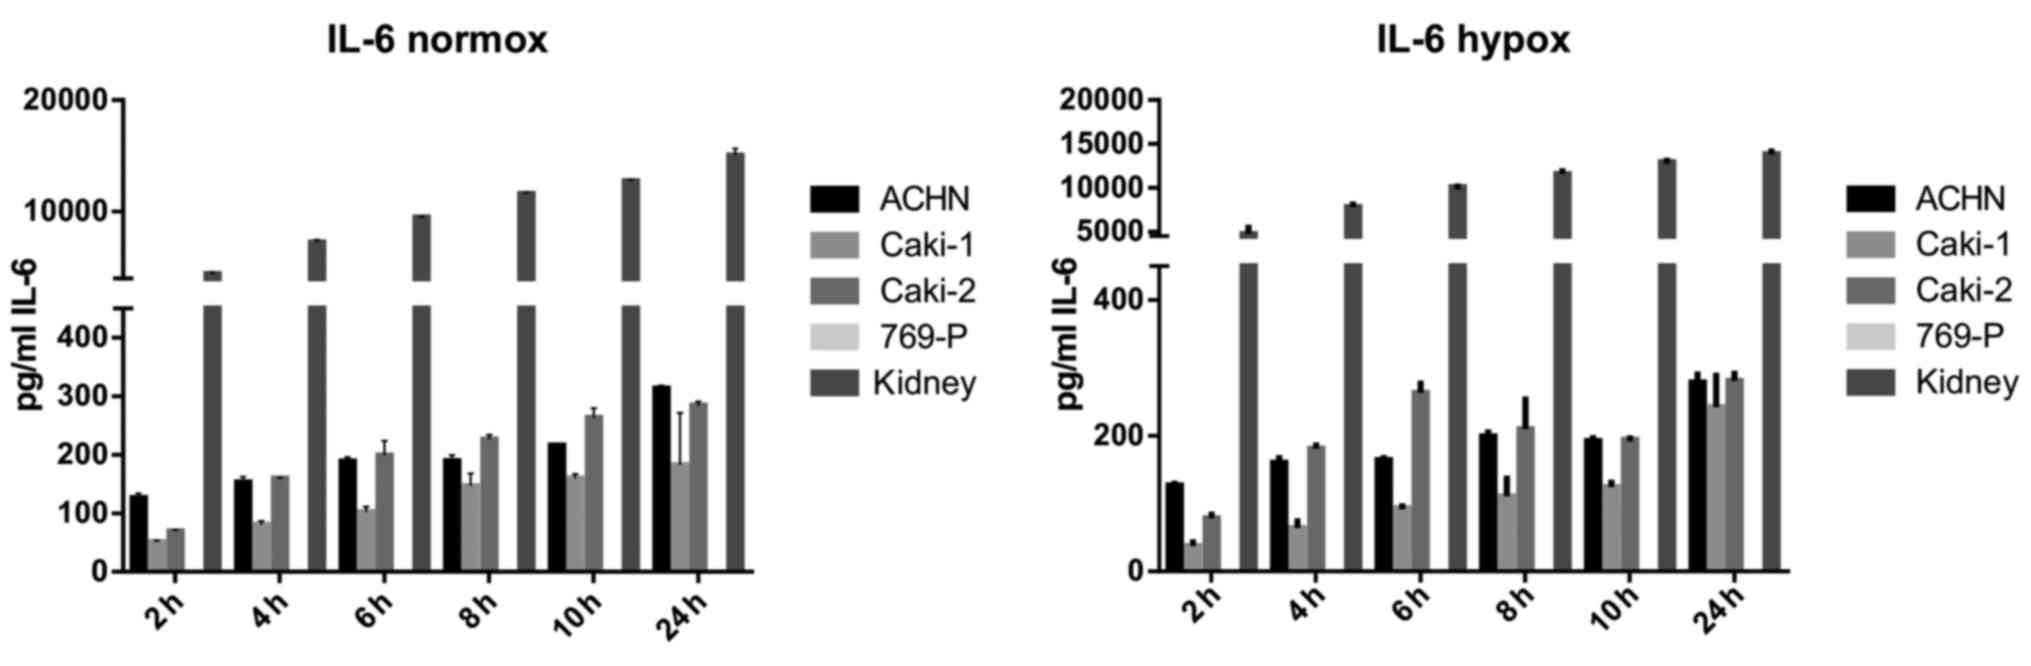
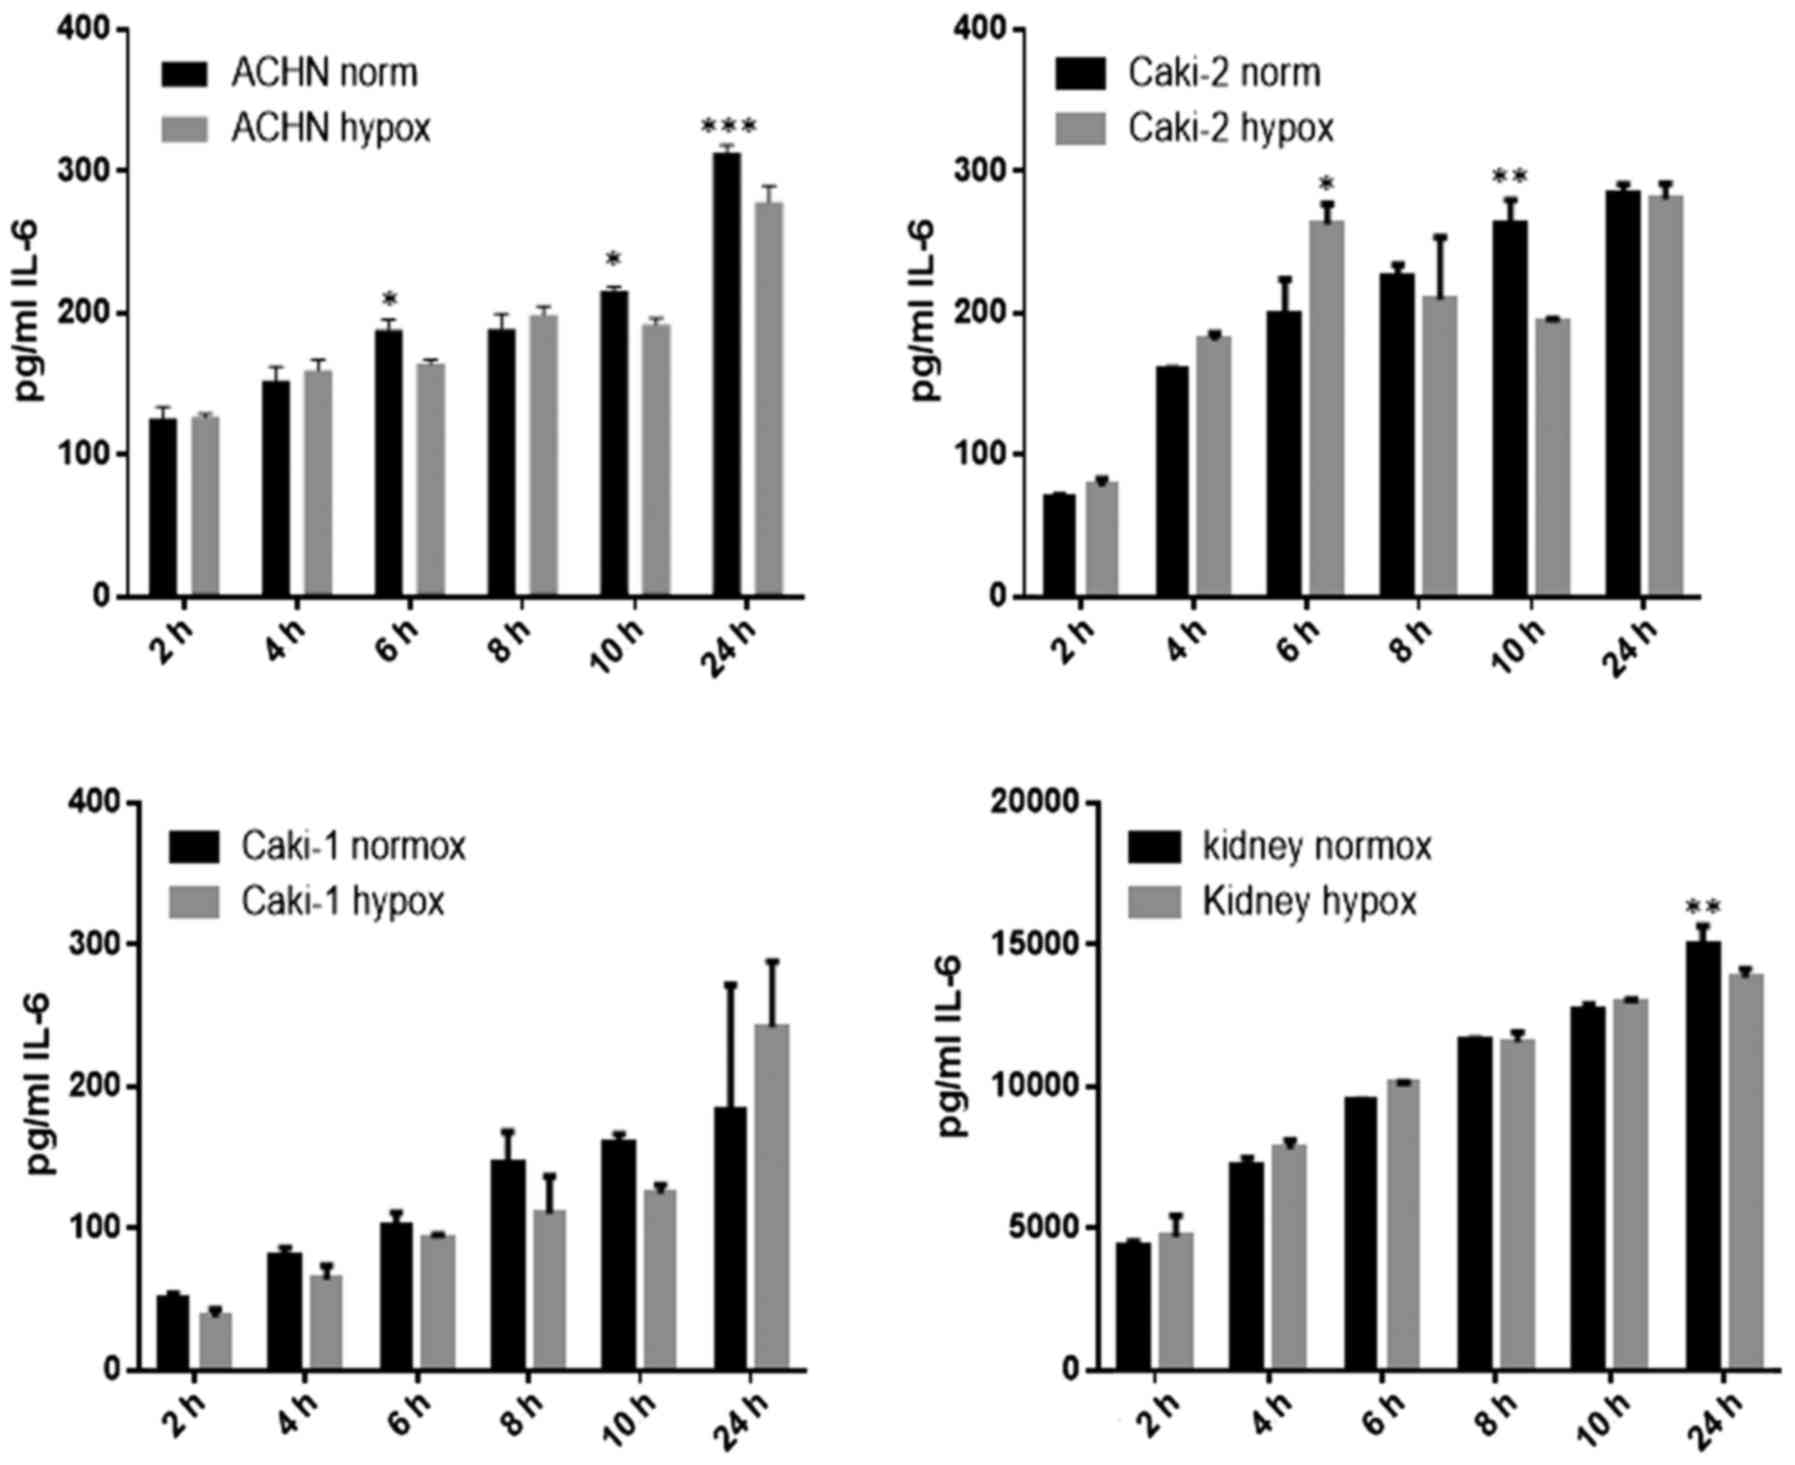
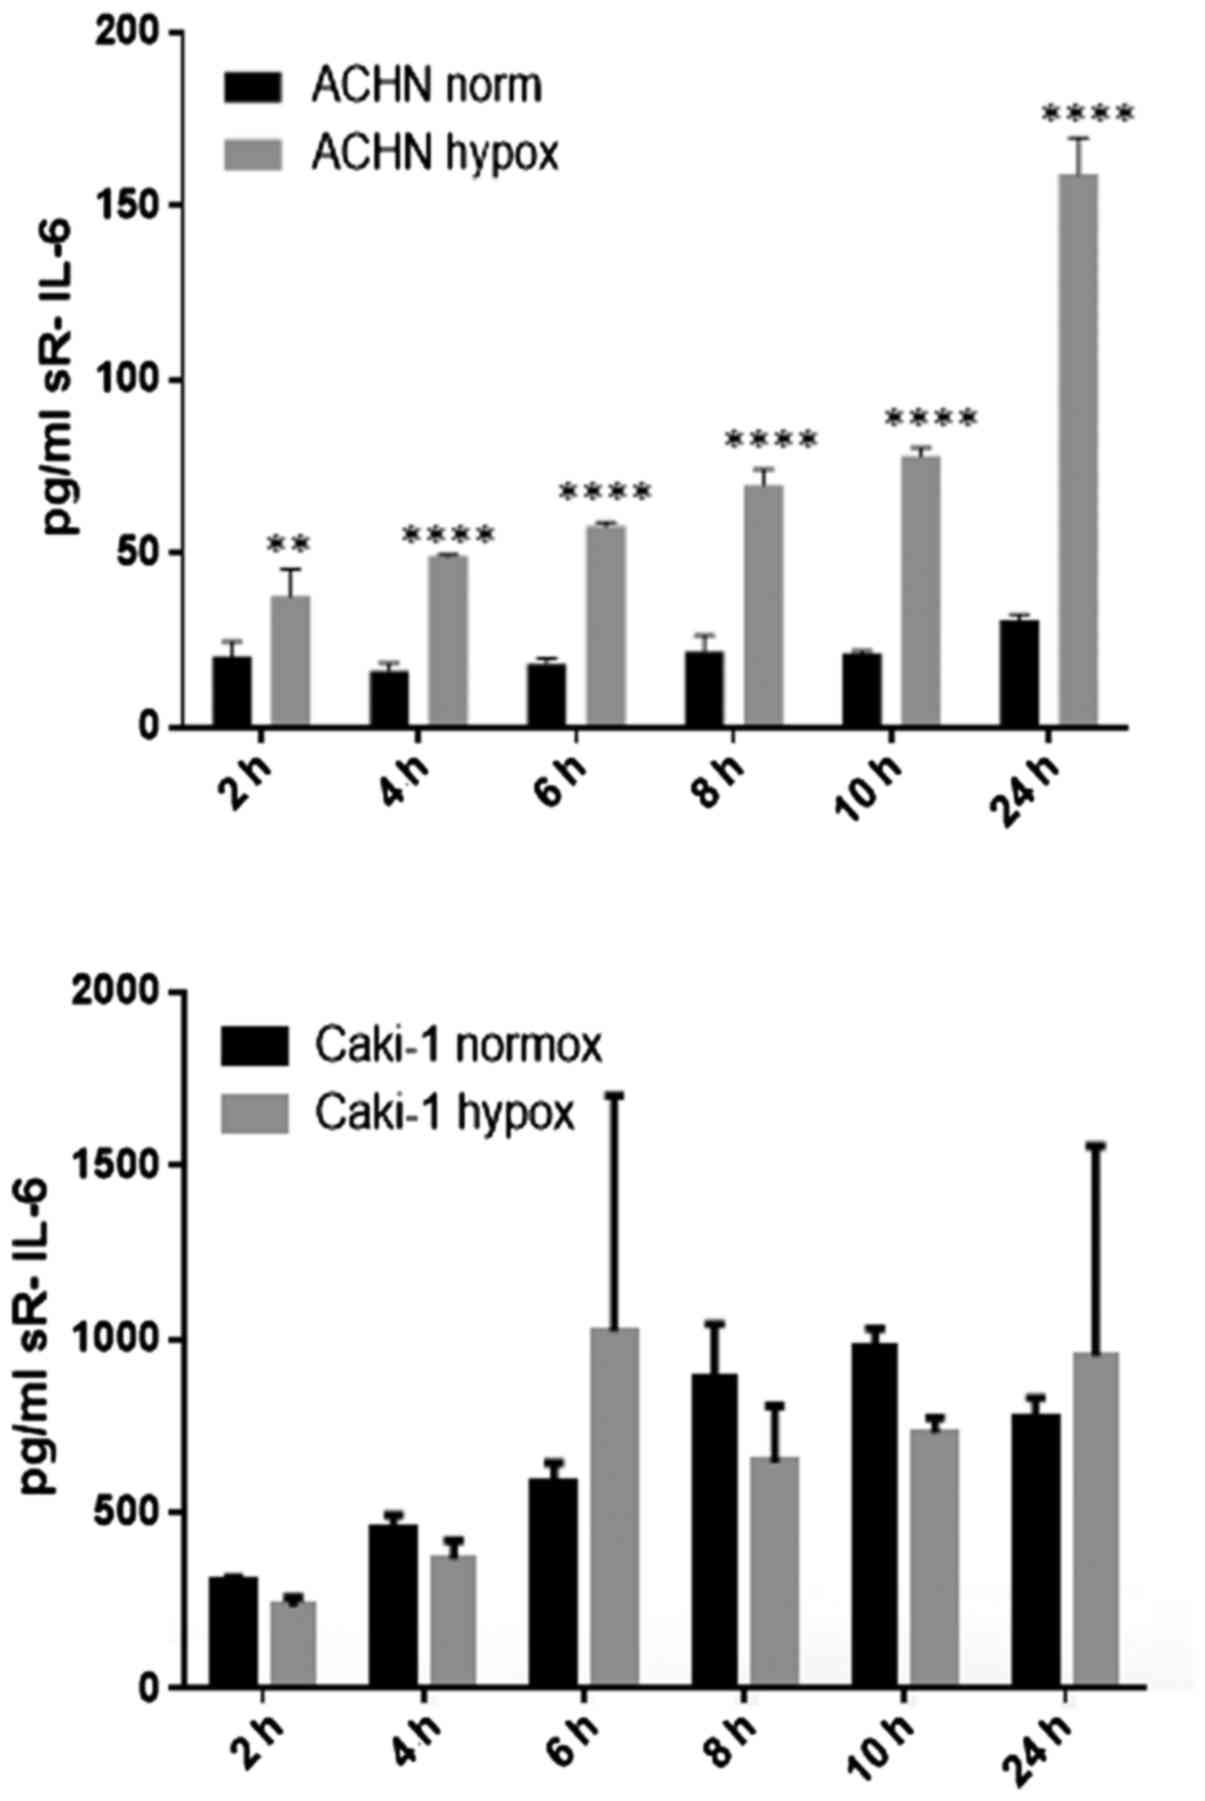
IL-6 was secreted by RCC cancer cell lines (ACHN,
Caki-1, Caki-2, 769-P), as well as normal renal cells (RPTEC)
(Fig. 19), both under normoxic
and hypoxic conditions, with a trend towards a higher expression in
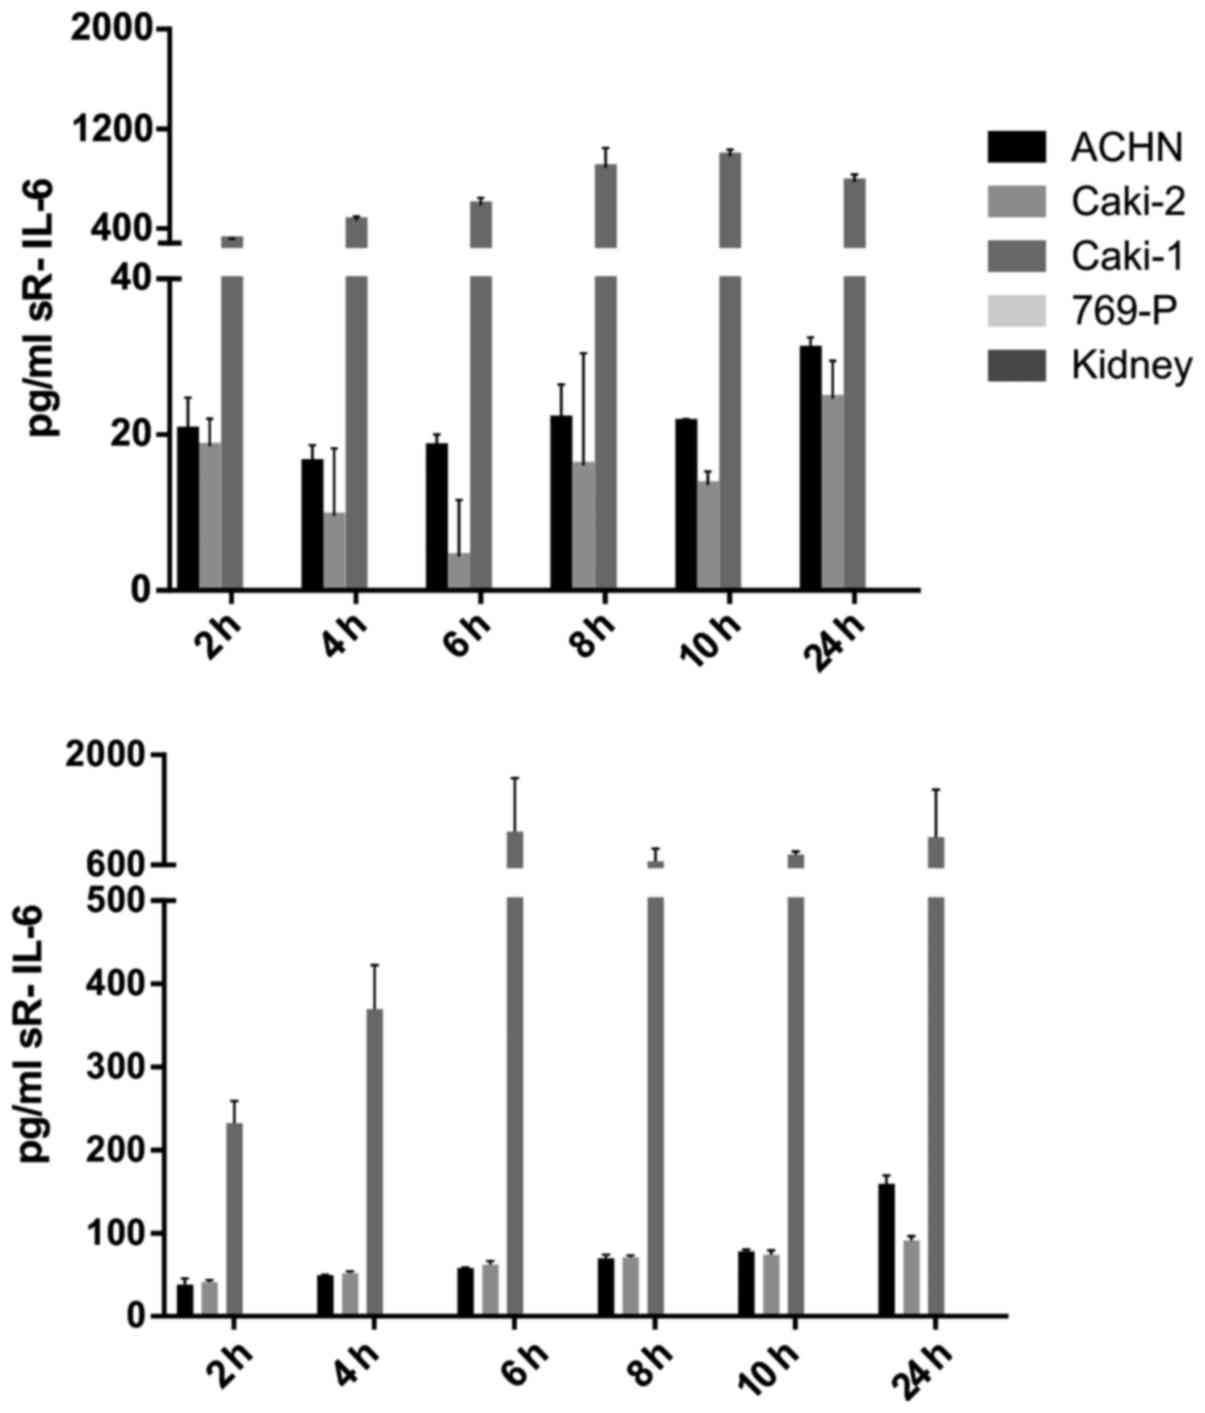
21% O2 (Fig. 20). On
the contrary, under the hypoxic (1% O2) condition, the
RCC cell lines secreted significantly more IL-6sR than under
normoxic conditions (Figs. 21 and
22). The secretion of IL-6sR by
cells derived from normal renal cells was below the detection limit
(Fig. 21).
Genes deregulated in ACHN cells from A + N
co-culture, compared with ACHN monoculture were clustered in 397 GO
pathways and 67 WikiPathways in the ACHN cells (P≤0.05). Multiple
channels activity, extracellular matrix component and basement
membrane signaling are deregulated along with transcriptional
regulation of pluripotent stem cells (Tables VIII and IX). The inhibition of complex
IL-6/IL-6sR signaling by gp130 decreased the proliferation of
induced RCC cell lines. Alternative signal transduction pathways
other than gp130/STAT3 are responsible for this phenomenon as STAT3
and gp130 were not overexpressed in RCC cells and STAT3 was not
phosphorylated upon CM induction, although IL-6R (membrane
receptor) was expressed by the cells (data not shown).
Discussion
From the number of deregulated pathways reported
above, we concluded that there was a larger influence of cancer
cells on normal cells than vice versa in RCC metastasis
development. Our analysis of cDNA array data indicated that
crosstalk between healthy NL-20 cells and RCC cells mostly results
in the deregulation of cell-cell signaling, mitosis and cell
cycling, cell motility pathways, as well as intracellular transport
and metabolism, including the regulation of RNA biosynthesis
(Tables I–IX). Our findings are in accordance with
those of other high throughput whole-genome reports which indicate
alterations in genes controlling RCC development (25,26).
Genes deregulated in pleural cells following
interaction with RCC cells were found to be involved in multiple
metabolic pathways, including terpenoid, isoprenoid, retinol and
vitamin transport, as well as fatty acid oxidation,
Rapoport-Luebering glycolytic shunt and dTMP de novo
biosynthesis (Table I). These
pathways may be considered as targets for cancer-selective
therapies, including the development of small molecules targeting
metabolic enzymes, metabolic modulators or pharmacologic activators
that could be combined with cytotoxic therapies to increase
apoptosis induction in RCC cells. In fact our study supports the
hypothesis that metastatic RCC could potentially become the disease
of interest for metabolic oncology research (27). Terpenoids currently used in humans
constitute 6 major drug classes: steroids, tocopherols, taxanes,
artemisinins, ingenanes and cannabinoids, all of which are of
potential interest in oncology (28). As terpenoids are useful in the
prevention and therapy of several diseases, including cancer, and
also have anti-spasmodic, antimicrobial, anti-parasitic,
anti-fungal, anti-viral, anti-allergenic, anti-hyperglycemic,
anti-inflammatory, and immunomodulatory properties, the
deregulation of their transport into the cells may significantly
impact RCC treatment, but may also represent a novel therapeutic
target. Currently, over 40,000 individual compounds have been
described in this group of molecules and many may be potentially
important for RCC treatment (29).
At the same time, natural isoprenoids in cancer cells are generated
by the mevalonate (MEV) cascade that is commonly deregulated upon
cell transformation. In cancer cells, glucose, glutamine and
acetate are substrates for anabolic MEV pathway. Moreover,
3-hydroxy-3-methylglutaryl-CoA reductase (HMGCR) that is the
rate-limiting enzyme of MAV, is now considered a metabolic oncogene
(30). Furthermore, the
Rapoport-Luebering glycolytic shunt generates and dephosphorylates
2,3-diphospho-D-glycerate (2,3-BPG). In cells, 2,3-BPG functions as
a biochemical link between the turnover of phosphorylated inositol
derivatives and glycolysis. It is a regulator of type I
inositol-1,4,5-trisphosphate 5-phosphatase and
phosphatidylinositol-3,4,5-trisphosphate 5-phosphatase 1 (SHIP). In
turn, SHIP1, following stimulation by different cytokine receptors,
interacts with activated Shc protein, and promotes its binding to
Grb2/Sos1 complexes. The membrane recruitment of SHIP1 serves as
the inhibitory signals modulating phosphatidylinositol 3-kinase
(PI3K)-dependent signaling pathways (31). The PI3K/AKT pathway is often
mutated and most often highly activated in RCC and it is a
promising drug target. In fact PI3K pathway inhibitors of the
rapalog family are approved for use in RCC. On the tissue level,
the activation of the PI3K/AKT pathway, subsequently increasing the
expression levels of matrix metalloproteinase (MMP)-13 and
urokinase plasminogen activator (uPA), promotes the invasion and
migration of RCC cells (32,33).
We also demonstrated that histone H3-K4
trimethylation, MAPKKK activity or cellular response to calcium ion
(Table I), as well as apoptotic
signaling (Table II) were
deregulated in metastatic target organ cells upon interaction with
RCC cancer cells. It is well known that abnormal MAPK pathway
signaling is often involved in the progression of cancer, since
MAPKs are involved in cell migration and invasion, since these
kinases regulate the expression and activation of focal adhesion
kinase (FAK) and MMPs (34). In
accordance with our results, it has also been reported that RCC
histone H3 lysine 4-trimethyl (H3K4me3) levels inversely correlate
with Fuhrman grading, pT stage, lymph node involvement and distant
metastasis and that global histone modifications are possibly
potential RCC prognosis markers (35). Our analysis also revealed that the
interaction with RCC cells resulted in induced glycosylation end
product receptor signaling and syndecan interactions (Table II). In humans, syndecan-1 (CD138)
is a cell-surface heparan sulfate proteoglycan expressed on most
epithelial cells, and a decreased CD138 expression has previously
been shown to be associated with increased invasive and metastatic
potential in cancers. In terms of function syndecan-1 affects
mesenchymal tumor cell proliferation, adhesion, migration and
motility (36). Syndecan-1 exerts
its functions via the heparan sulfate chains, that bind multiple
receptors, including FGFs, VRGF, TGF-β, Wnt, HGF fibronectin or
antithrombin-1, all known to play significant roles in RCC
development and progression (37,38).
Concurrently, prolactin receptor signaling via JAK/STAT,
RAS/RAF/MAPK, PI3-Kinase/AKT and RAC is also deregulated in pleural
epithelial cells upon RCC cell interaction, while JAK/STAT3
signaling, AMPK and PPARα, are putative therapeutic targets in
renal cell carcinoma (39–41).
Indeed, the deregulation in signaling was also
observed in NL-20 cells co-cultured with the RCC metastatic cell
line (Table III and Figs. 15Figure 16Figure 17–18). Primarily, the IL-6 signaling
pathway was deregulated in NL-20 cells. It has been shown that in
patients with RCC, the level of IL-6, inter alia, is increased
(42) and RCC primary cultures
secrete elevated levels of IL-6 as well (43). These data suggest the involvement
of this cytokine in the progression of RCC. Moreover, in men with
prostate cancer which has metastasized to the bone, plasma IL-6
levels and its soluble receptor (IL-6sR) levels are extremely high
(44), what indicates their role
in metastasis. IL-6sR is released from membrane-bound receptor IL-6
(IL-6R) by ectodomain shedding (45) by the enzymes which belong to the A
disintegrin and metalloproteinase (ADAM) gene family of
metalloproteases, ADAM-17 and ADAM-10 (46). ADAM17 expression has been shown to
be upregulated in several types of cancer, including breast cancer,
head and neck cancer and prostate cancer, hepatocellular cancer and
non-small cell lung cancer (NSCLC), which may also lead to the
increased generation of sIL-6R and activation of IL-6
trans-signaling (47). In ccRCC,
the loss of TIMP-3, which is the inhibitor of the actions of
ADAM-10 and ADAM-17, expression is observed (48). These data suggest the great
potential of ccRCC for releasing of IL-6sR. Thus, it can be
hypothesized that this complex, IL-6sR/IL6, may be a mediator in
the metastasis of ccRCC. It was previously shown that signaling via
the sIL-6R is often observed in chronic inflammatory disorders,
such as rheumatoid arthritis, Crohn's disease and colon cancer
(49,50). IL-6 trans-signaling promotes
pro-inflammatory pathways via the inhibition of lamina propria
T-cell apoptosis, the stimulation of enhanced IEC proliferation and
maintenance of the TH17 phenotype in inflamed tissues. Endothelial
cells upregulated the expression of gp130, downregulated the
expression of the membrane-bound IL-6R and were targeted by the
IL-6/IL-6sR complex, which led to proliferation, inhibition of
apoptosis and enhanced colonic carcinogenesis (51). Furthermore, the IL-6/sIL-6R complex
is commonly upregulated under pathophysiological situations
(52) and IL-6 trans-signaling
appears to be only activated during immunological stress
conditions, such as cancer. In addition to the increased secretion
of IL-6 by the primary culture of RCC cells and the lack of natural
inhibitor of enzymes which generate IL-6sR, it is possible that the
IL-6sR/IL6 complex may play a role in the metastasis of ccRCC. An
association has been reported between IL-6Rα expression and
lymphocyte antigen 75 (LY75) expression and the promotion of
cellular adherence (53). These
authors also claimed that this may be an additional mechanism by
which IL6 signaling influences the progression of ovarian cancer,
and they suggest that blocking LY75 may be a beneficial
clinical strategy for inhibiting the early metastasis of cancer
(53). Based on our results, we
propose that in RCC metastatic development, the IL-6/IL-6sR complex
seems to be responsible for the enhanced proliferation rate of RCC
cells. A high secretion level of IL-6sR characteristic of malignant
cells in comparison to normal renal cells seems to confirm the
influence of IL-6/IL-6sR in renal cancer development (Figs. 19Figure 20Figure 21–22). The complex of IL-6 and its soluble
receptor (IL-6sR; complex IL-6/IL-6sR) may be responsible for the
crosstalk between cells and may determine metastatic homing.
Our results indicated that the zinc finger proteins
are the most overexpressed genes in the NL-20 cell line co-cultured
with Caki-2 and ACHN cells in comparison to monocultured NL-20
cells (Tables IV and V). The obtained data confirm alterations
in normal cell signaling under the influence of cancer cells,
changing functional cell properties to create a metastatic niche
(Figs. 11Figure 12–13 and 16Figure 17–18). In the co-cultured cells (NL-20 and
ACHN cells), we observed the perturbation of the IL-6 signaling
pathway (Table III and Figs. 19Figure 20Figure 21–22), confirming that a tumor 'creates' a
microenvironment and metastatic development is dominated by
tumor-induced interactions, which is in accordance with conclusions
broadly reviewed elsewhere (54).
In particular, in normal pleural cells, multiple cancer-related
networks (Tables I–III), were deregulated. These pathways
may determine the most important proteins involved in RCC
metastatic development (Tables IV
and V).
Our study demonstrated that in the co-culture system
of RCC and NL-20 cell lines, mostly genes connected with metastasis
were deregulated. Microarray analysis of the NL-20 cells
co-cultured with RCC indicated that the expression of MAPKKK
activity was high and calcium ion signaling was deregulated,
independent of whether the cells were co-cultured with metastatic
or primary renal cancer cell lines. The deregulated genes are
implicated in invasion and metastasis in other cancer types
(55–58). The co-culture of healthy NL-20 and
RCC cells also resulted in as many deregulated pathways in RCC cell
lines. This indicates a greater impact of cancerous cells on normal
cells than vice versa. Moreover, most differently activated
pathways are often characteristic of renal biology including
regulation of water balance by renal aquaporins, potassium
channels, cation channel activity or passive transmembrane
transporter activity (Tables
VI–IX).
In recent years, the tumor microenvironment has
received much attention from scientists due to its fundamental
involvement in carcinogenesis, tumor growth, migration, invasion
and immune escape by neoplastic cells from the host response. High
throughput technologies for assaying gene expression, such as those
used in the cDNA microarrays in the present study, may provide the
ability to identify clinically relevant genes that are highly
differentially expressed between different cell lines. Our results
revealed an alteration of normal cell activity (e.g., gene
expression) when cultured with cancer cells. Demonstrating the
influence of cancerous cells on normal cells contributes to the
development of a favorable niche for metastatic phenotype.
RCC cells induce the proliferation of lung
epithelial cells upon interaction, and they, in turn, proliferate
more rapidly. The crosstalk of RCC cells with normal lung cells
results in the deregulation of multiple signaling pathways,
including replication, mitotic division, cell cycling, cell
motility, RNA biosynthetic process, and cell-cell communication.
The identified signaling pathways may be considered as potentially
'druggable' in metastatic renal cancer. Cell-cell communications
may contribute to the development of a favorable metastatic niche
and promote disease progression. Nevertheless, the obtained results
warrant further investigation and validation.
Abbreviations:
|
ccRCC
|
clear cell renal cell carcinoma
|
|
HKCSC
|
human kidney cancer stem cells
|
|
RCC
|
renal cell carcinoma
|
|
TGF-β
|
transforming growth factor-β
|
|
TME
|
tumor microenvironment
|
|
EGFR/MAPK
|
epidermal growth factor
receptor/mitogen-activated protein kinase
|
|
IL-6
|
interleukin 6
|
|
FGFs
|
fibroblast growth factors
|
|
VEGF
|
vascular endothelial growth
factor
|
Acknowledgments
This study was supported by the Foundation for
Polish Science TEAM project TEAM/2010-6/8 (C.S., K.K., A.M.C. and
M.I.K.) and NCN UMO-2011/01/B/NZ4/01602 grant (K.K., A.M.C. and
C.S.). W.F. received support from the Foundation for Polish Science
First TEAM project financed by the Smart Growth Operational
Program. We are grateful to Mr Roman Demianenko for providing
technical support, and to Dr Aleksandra Fruba, Ms Magdalena Bucholc
for providing administrative support. The authors would also like
to thank the Experimental and Clinic Oncology Foundation (FODiK,
Warsaw, Poland) for purchasing the necessary reagents.
Notes
[1] Competing
interests
The authors declare that they have no competing
interests.
References
|
1
|
Coon JT, Hoyle M, Green C, Liu Z, Welch K,
Moxham T and Stein K: Bevacizumab, sorafenib tosylate, sunitinib
and temsirolimus for renal cell carcinoma: A systematic review and
economic evaluation. Health Technol Assess. 14:1–184. 2010.
|
|
2
|
Schachter LR, Cookson MS, Chang SS, Smith
JA Jr, Dietrich MS, Jayaram G and Herrell SD: Second prize:
Frequency of benign renal cortical tumors and histologic subtypes
based on size in a contemporary series: What to tell our patients.
J Endourol. 21:819–823. 2007. View Article : Google Scholar : PubMed/NCBI
|
|
3
|
Bhat S: Bhat. Indian J Urol. 26:167–176.
2010. View Article : Google Scholar : PubMed/NCBI
|
|
4
|
Thyavihally YB, Mahantshetty U,
Chamarajanagar RS, Raibhattanavar SG and Tongaonkar HB: Management
of renal cell carcinoma with solitary metastasis. World J Surg
Oncol. 3:482005. View Article : Google Scholar : PubMed/NCBI
|
|
5
|
Miyata Y, Koga S, Kanda S, Nishikido M,
Hayashi T and Kanetake H: Expression of cyclooxygenase-2 in renal
cell carcinoma: Correlation with tumor cell proliferation,
apoptosis, angiogenesis, expression of matrix metalloproteinase-2,
and survival. Clin Cancer Res. 9:1741–1749. 2003.PubMed/NCBI
|
|
6
|
Jemal A, Siegel R, Ward E, Hao Y, Xu J and
Thun MJ: Cancer statistics, 2009. CA Cancer J Clin. 59:225–249.
2009. View Article : Google Scholar : PubMed/NCBI
|
|
7
|
Bruno JJ II, Snyder ME, Motzer RJ and
Russo P: Renal cell carcinoma local recurrences: Impact of surgical
treatment and concomitant metastasis on survival. BJU Int.
97:933–938. 2006. View Article : Google Scholar : PubMed/NCBI
|
|
8
|
Hanahan D and Coussens LM: Accessories to
the crime: Functions of cells recruited to the tumor
microenvironment. Cancer Cell. 21:309–322. 2012. View Article : Google Scholar : PubMed/NCBI
|
|
9
|
Spano D and Zollo M: Tumor
microenvironment: A main actor in the metastasis process. Clin Exp
Metastasis. 29:381–395. 2012. View Article : Google Scholar : PubMed/NCBI
|
|
10
|
Wang X: Wang. In Silico Biol. 11:1–10.
2011–2012.
|
|
11
|
Brodaczewska KK, Szczylik C, Fiedorowicz
M, Porta C and Czarnecka AM: Choosing the right cell line for renal
cell cancer research. Mol Cancer. 15:832016. View Article : Google Scholar : PubMed/NCBI
|
|
12
|
Tanaka T, Torigoe T, Hirohashi Y, Sato E,
Honma I, Kitamura H, Masumori N, Tsukamoto T and Sato N:
Hypoxia-inducible factor (HIF)-independent expression mechanism and
novel function of HIF prolyl hydroxylase-3 in renal cell carcinoma.
J Cancer Res Clin Oncol. 140:503–513. 2014. View Article : Google Scholar : PubMed/NCBI
|
|
13
|
Gati A, Da Rocha S, Guerra N, Escudier B,
Moretta A, Chouaib S, Angevin E and Caignard A: Analysis of the
natural killer mediated immune response in metastatic renal cell
carcinoma patients. Int J Cancer. 109:393–401. 2004. View Article : Google Scholar : PubMed/NCBI
|
|
14
|
Hamburger AW, White CP and Dunn FE:
Secretion of transforming growth factors by primary human tumour
cells. Br J Cancer. 51:9–14. 1985. View Article : Google Scholar : PubMed/NCBI
|
|
15
|
Nakayama GR, Caton MC, Nova MP and
Parandoosh Z: Assessment of the Alamar Blue assay for cellular
growth and viability in vitro. J Immunol Methods. 204:205–208.
1997. View Article : Google Scholar : PubMed/NCBI
|
|
16
|
Boos DD and Stefanski LA: P-Value
precision and reproducibility. Am Stat. 65:213–221. 2011.
View Article : Google Scholar : PubMed/NCBI
|
|
17
|
Khan MI, Dębski KJ, Dabrowski M, Czarnecka
AM and Szczylik C: Gene set enrichment analysis and ingenuity
pathway analysis of metastatic clear cell renal cell carcinoma cell
line. Am J Physiol Renal Physiol. 311:F424–F436. 2016. View Article : Google Scholar : PubMed/NCBI
|
|
18
|
Khan MI, Czarnecka AM, Lewicki S,
Helbrecht I, Brodaczewska K, Koch I, Zdanowski R, Król M and
Szczylik C: Comparative gene expression profiling of primary and
metastatic renal cell carcinoma stem cell-like cancer cells. PLoS
One. 11:e01657182016. View Article : Google Scholar : PubMed/NCBI
|
|
19
|
Dresen IM, Hüsing J, Kruse E, Boes T and
Jöckel KH: Software packages for quantitative microarray-based gene
expression analysis. Curr Pharm Biotechnol. 4:417–437. 2003.
View Article : Google Scholar : PubMed/NCBI
|
|
20
|
Savli H, Szendröi A, Romics I and Nagy B:
Gene network and canonical pathway analysis in prostate cancer: A
microarray study. Exp Mol Med. 40:176–185. 2008. View Article : Google Scholar : PubMed/NCBI
|
|
21
|
Krämer A, Green J, Pollard J Jr and
Tugendreich S: Causal analysis approaches in ingenuity pathway
analysis. Bioinformatics. 30:523–530. 2014. View Article : Google Scholar :
|
|
22
|
Harris MA, Clark J, Ireland A, Lomax J,
Ashburner M, Foulger R, Eilbeck K, Lewis S, Marshall B, Mungall C,
et al: Gene Ontology Consortium: The Gene Ontology (GO) database
and informatics resource. Nucleic Acids Res. 32:D258–D261. 2004.
View Article : Google Scholar
|
|
23
|
Balakrishnan R, Harris MA, Huntley R, Van
Auken K and Cherry JM: A guide to best practices for Gene Ontology
(GO) manual annotation. Database (Oxford). 2013.bat0542013.
|
|
24
|
Kutmon M, Riutta A, Nunes N, Hanspers K,
Willighagen EL, Bohler A, Mélius J, Waagmeester A, Sinha SR, Miller
R, et al: WikiPathways: Capturing the full diversity of pathway
knowledge. Nucleic Acids Res. 44(D1): D488–D494. 2016. View Article : Google Scholar :
|
|
25
|
Network TCGAR, Cancer Genome Atlas and
Research Network: Comprehensive molecular characterization of clear
cell renal cell carcinoma. Nature. 499:43–49. 2013. View Article : Google Scholar
|
|
26
|
Cancer Genome Atlas Research Network;
Linehan WM, Spellman PT, Ricketts CJ, Creighton CJ, Fei SS, Davis
C, Wheeler DA, Murray BA, et al: Comprehensive molecular
characterization of papillary renal-cell carcinoma. N Engl J Med.
374:135–145. 2016. View Article : Google Scholar
|
|
27
|
Kinnaird A and Michelakis ED: Metabolic
modulation of cancer: A new frontier with great translational
potential. J Mol Med (Berl). 93:127–142. 2015. View Article : Google Scholar
|
|
28
|
Khan MI, Sobocińska AA, Czarnecka AM, Król
M, Botta B and Szczylik C: The therapeutic aspects of the
endocannabinoid system (ECS) for cancer and their development: From
nature to laboratory. Curr Pharm Des. 22:1756–1766. 2016.
View Article : Google Scholar
|
|
29
|
Thoppil RJ and Bishayee A: Terpenoids as
potential chemopreventive and therapeutic agents in liver cancer.
World J Hepatol. 3:228–249. 2011. View Article : Google Scholar : PubMed/NCBI
|
|
30
|
Alizadeh J, Zeki AA, Mirzaei N, Tewary S,
Rezaei Moghadam A, Glogowska A, Nagakannan P, Eftekharpour E,
Wiechec E, Gordon JW, et al: Mevalonate cascade inhibition by
simvastatin induces the intrinsic apoptosis pathway via depletion
of isoprenoids in tumor cells. Sci Rep. 7:448412017. View Article : Google Scholar : PubMed/NCBI
|
|
31
|
Damen JE, Liu L, Rosten P, Humphries RK,
Jefferson AB, Majerus PW and Krystal G: The 145-kDa protein induced
to associate with Shc by multiple cytokines is an inositol
tetraphosphate and phosphatidylinositol 3,4,5-triphosphate
5-phosphatase. Proc Natl Acad Sci USA. 93:1689–1693. 1996.
View Article : Google Scholar : PubMed/NCBI
|
|
32
|
Guo H, German P, Bai S, Barnes S, Guo W,
Qi X, Lou H, Liang J, Jonasch E, Mills GB, et al: The I3K/AKT
pathway and renal cell carcinoma. J Genet Genomics. 42:343–353.
2015. View Article : Google Scholar : PubMed/NCBI
|
|
33
|
Sun Z, Cao B and Wu J: Protease-activated
receptor 2 enhances renal cell carcinoma cell invasion and
migration via PI3K/AKT signaling pathway. Exp Mol Pathol.
98:382–389. 2015. View Article : Google Scholar : PubMed/NCBI
|
|
34
|
Yang M and Huang CZ: Mitogen-activated
protein kinase signaling pathway and invasion and metastasis of
gastric cancer. World J Gastroenterol. 21:11673–11679. 2015.
View Article : Google Scholar : PubMed/NCBI
|
|
35
|
Ellinger J, Kahl P, Mertens C, Rogenhofer
S, Hauser S, Hartmann W, Bastian PJ, Büttner R, Müller SC and von
Ruecker A: Prognostic relevance of global histone H3 lysine 4
(H3K4) methylation in renal cell carcinoma. Int J Cancer.
127:2360–2366. 2010. View Article : Google Scholar : PubMed/NCBI
|
|
36
|
Szatmári T and Dobra K: The role of
syndecan-1 in cellular signaling and its effects on heparan sulfate
biosynthesis in mesenchymal tumors. Front Oncol. 3:3102013.
View Article : Google Scholar
|
|
37
|
Kamińska K, Szczylik C, Bielecka ZF,
Bartnik E, Porta C, Lian F and Czarnecka AM: The role of the
cell-cell interactions in cancer progression. J Cell Mol Med.
19:283–296. 2015. View Article : Google Scholar
|
|
38
|
Myszczyszyn A, Czarnecka AM, Matak D,
Szymanski L, Lian F, Kornakiewicz A, Bartnik E, Kukwa W, Kieda C
and Szczylik C: The role of hypoxia and cancer stem cells in renal
cell carcinoma pathogenesis. Stem Cell Rev. 11:919–943. 2015.
View Article : Google Scholar : PubMed/NCBI
|
|
39
|
Woodard J, Joshi S, Viollet B, Hay N and
Platanias LC: AMPK as a therapeutic target in renal cell carcinoma.
Cancer Biol Ther. 10:1168–1177. 2010. View Article : Google Scholar : PubMed/NCBI
|
|
40
|
Tong WH, Sourbier C, Kovtunovych G, Jeong
SY, Vira M, Ghosh M, Romero VV, Sougrat R, Vaulont S, Viollet B, et
al: The glycolytic shift in fumarate-hydratase-deficient kidney
cancer lowers AMPK levels, increases anabolic propensities and
lowers cellular iron levels. Cancer Cell. 20:315–327. 2011.
View Article : Google Scholar : PubMed/NCBI
|
|
41
|
Li S, Priceman SJ, Xin H, Zhang W, Deng J,
Liu Y, Huang J, Zhu W, Chen M, Hu W, et al: Icaritin inhibits
JAK/STAT3 signaling and growth of renal cell carcinoma. PLoS One.
8:e816572013. View Article : Google Scholar : PubMed/NCBI
|
|
42
|
Chuang MJ, Sun KH, Tang SJ, Deng MW, Wu
YH, Sung JS, Cha TL and Sun GH: Tumor-derived tumor necrosis
factor-alpha promotes progression and epithelial-mesenchymal
transition in renal cell carcinoma cells. Cancer Sci. 99:905–913.
2008. View Article : Google Scholar : PubMed/NCBI
|
|
43
|
Sievers E, Dreimuller P, Haferkamp A,
Schmidt-Wolf IG, Buchler MW, Schmidt J and Marten A:
Characterization of primary renal carcinoma cultures. Urol Int.
79:235–243. 2007. View Article : Google Scholar : PubMed/NCBI
|
|
44
|
Shariat SF, Andrews B, Kattan MW, Kim J,
Wheeler TM and Slawin KM: Plasma levels of interleukin-6 and its
soluble receptor are associated with prostate cancer progression
and metastasis. Urology. 58:1008–1015. 2001. View Article : Google Scholar : PubMed/NCBI
|
|
45
|
Müllberg J, Schooltink H, Stoyan T,
Günther M, Graeve L, Buse G, Mackiewicz A, Heinrich PC and
Rose-John S: The soluble interleukin-6 receptor is generated by
shedding. Eur J Immunol. 23:473–480. 1993. View Article : Google Scholar : PubMed/NCBI
|
|
46
|
Müllberg J, Oberthür W, Lottspeich F, Mehl
E, Dittrich E, Graeve L, Heinrich PC and Rose-John S: The soluble
human IL-6 receptor. Mutational characterization of the proteolytic
cleavage site. J Immunol. 152:4958–4968. 1994.PubMed/NCBI
|
|
47
|
Kamińska K, Czarnecka AM, Escudier B, Lian
F and Szczylik C: Interleukin-6 as an emerging regulator of renal
cell cancer. Urol Oncol. 33:476–485. 2015. View Article : Google Scholar
|
|
48
|
Masson D, Rioux-Leclercq N, Fergelot P,
Jouan F, Mottier S, Théoleyre S, Bach-Ngohou K, Patard JJ and Denis
MG: Loss of expression of TIMP3 in clear cell renal cell carcinoma.
Eur J Cancer. 46:1430–1437. 2010. View Article : Google Scholar : PubMed/NCBI
|
|
49
|
Kishimoto T: Kishimoto. Int Immunol.
22:347–352. 2010. View Article : Google Scholar : PubMed/NCBI
|
|
50
|
Mihara M, Hashizume M, Yoshida H, Suzuki M
and Shiina M: IL-6/IL-6 receptor system and its role in
physiological and pathological conditions. Clin Sci (Lond).
122:143–159. 2012. View Article : Google Scholar
|
|
51
|
Matsumoto M, Tsujino T, Lee-Kawabata M,
Naito Y, Sakoda T, Ohyanagi M and Masuyama T: Serum interleukin-6
and C-reactive protein are markedly elevated in acute decompensated
heart failure patients with left ventricular systolic dysfunction.
Cytokine. 49:264–268. 2010. View Article : Google Scholar
|
|
52
|
Jones SA, Horiuchi S, Topley N, Yamamoto N
and Fuller GM: The soluble interleukin 6 receptor: Mechanisms of
production and implications in disease. FASEB J. 15:43–58. 2001.
View Article : Google Scholar : PubMed/NCBI
|
|
53
|
Giridhar PV, Funk HM, Gallo CA, Porollo A,
Mercer CA, Plas DR and Drew AF: Interleukin-6 receptor enhances
early colonization of the murine omentum by upregulation of a
mannose family receptor, LY75, in ovarian tumor cells. Clin Exp
Metastasis. 28:887–897. 2011. View Article : Google Scholar : PubMed/NCBI
|
|
54
|
Whiteside TL: Whiteside. Oncogene.
27:5904–5912. 2008. View Article : Google Scholar : PubMed/NCBI
|
|
55
|
Eguchi D, Ohuchida K, Kozono S, Ikenaga N,
Shindo K, Cui L, Fujiwara K, Akagawa S, Ohtsuka T, Takahata S, et
al: MAL2 expression predicts distant metastasis and short survival
in pancreatic cancer. Surgery. 154:573–582. 2013. View Article : Google Scholar : PubMed/NCBI
|
|
56
|
Russo J and Russo IH: The role of the
basal stem cell of the human breast in normal development and
cancer. Adv Exp Med Biol. 720:121–134. 2011. View Article : Google Scholar : PubMed/NCBI
|
|
57
|
Qin Q, Xu Y, He T, Qin C and Xu J: Normal
and disease-related biological functions of Twist1 and underlying
molecular mechanisms. Cell Res. 22:90–106. 2012. View Article : Google Scholar :
|
|
58
|
Sun M, Song CX, Huang H, Frankenberger CA,
Sankarasharma D, Gomes S, Chen P, Chen J, Chada KK, He C, et al:
HMGA2/TET1/HOXA9 signaling pathway regulates breast cancer growth
and metastasis. Proc Natl Acad Sci USA. 110:9920–9925. 2013.
View Article : Google Scholar : PubMed/NCBI
|