Introduction
Colorectal cancer (CRC) is the third most common
malignancy and fourth most common cause of cancer-related mortality
worldwide (1). Despite effective
multi-modal therapeutic options, metastatic CRC remains challenging
to treat due to the amount of tumor burden and increasing
resistance (1,2). Among a plethora of genetic and
epigenetic events eliciting tumor progression, it is well known
that the loss of cell-cell contacts promotes local tumor
infiltration and serves as a prerequisite for distant metastasis
(3). Although often speculated,
the function of cell-cell contacts for radiochemosensitivity
warrants clarification as cell-cell contacts consist of numerous
novel druggable targets.
Cell-cell contacts and adhesion are mediated by the
homophilic interaction of E-cadherins on neighboring cells
(4). Intracellularly, different
adapter proteins, including β- and γ-catenin bind to E-cadherin and
α-catenin, connecting these complexes to the actin cytoskeleton for
adherens junction assembly (4).
The dysregulation or loss of cell adhesion proteins, such as
E-cadherin or α-catenin is frequently found in carcinomas and has
been shown to correlate with invasion and metastasis (5–8). Of
clinical importance is the question of whether the loss of
cell-cell contact affects the sensitivity of the cells to therapy.
While early studies on floating tumor cell spheroids indicated a
radioprotective impact of cell-cell adhesion, later studies
addressing different cell-cell contact molecules, as well as
studies on circulating tumor cells provided conflicting results
with regards to radiochemosensitivity, invasion and cell-cell
contacts mediated by integrins and intercellular adhesion molecule
1 (ICAM) (9–14).
Owing to the difficulty which is encountered in the
treatment of patients with late-stage metastatic CRC, in this
study, we investigated the growth of a number of widely used CRC
cell lines embedded in more physiological laminin-rich
extracellular matrix (lrECM) or collagen type 1 (col-I), two
abundantly expressed extracellular matrix (ECM) proteins in CRC
(15–17). Furthermore, we made use of the
α-catenin deletion status of DLD-1 cells to address its impact on
radiochemosensitivity and invasion into col-I.
Materials and methods
Antibodies and reagents
Antibodies against β-actin (A5441; Sigma-Aldrich,
Taufkirchen, Germany), α-catenin (3236S), β-catenin (9587),
p-β-catenin S675 (4176S), TGF-β (3709) (all from Cell Signaling
Technology, Frankfurt am Main, Germany), E-cadherin (610181),
fibronectin (610077) (both from BD Biosciences, Heidelberg,
Germany), Zonula occludens-1 (ZO-1; 40-2300; Zymed Laboratories,
San Francisco, CA, USA) and horseradish peroxidase-conjugated
donkey anti-rabbit (NA934) and goat anti-mouse (NA9310) antibodies
(GE Healthcare, Buckinghamshire, UK), as well as Alexa Fluor 488
and Alexa Fluor 594 secondary antibodies (A11001 and A1037;
Invitrogen, Karlsruhe, Germany) were purchased as indicated. lrECM
(Matrigel™) and col-I were from BD Biosciences, and 5-fluorouracil
(5-FU) was from Medac (Wedel, Germany).
Cells and cell culture
The human CRC cell lines, DLD-1, HCT-15, HT-29,
HCT-116, SW48 and SW480, were obtained from the American Type
Culture Collection (ATCC, Manassas, VA, USA). The SW620 cells,
originating from a lymph node metastasis of the same patient as the
SW480 cell line, and the SW837 cells, were a kind gift from Dr J.
Cinatl (University of Frankfurt, Germany). The cells were cultured
in Dulbecco's modified Eagle's medium containing Glutamax-I
supplemented with 1% non-essential amino acids (Sigma-Aldrich) and
10% fetal bovine serum (FBS; PAA, Cölbe, Germany) at 37°C in a
humidified atmosphere containing 8.5% CO2. All
experiments were performed with asynchronous, exponentially growing
cells.
Three-dimensional (3D) colony formation
assay, 5-FU treatment and radiation exposure
3D colony formation assay was performed as
previously described (18,19). For 3D colony formation, the cells
were embedded in 0.5 mg/ml lrECM, 1 mg/ml col-I or a 1:1 mixture of
both matrices. At 24 h after plating, the cells were treated with
5-FU as indicated or irradiated at room temperature using 2–6 Gy
single doses of 200 kV X-rays (Yxlon Y.TU 320; Yxlon, Copenhagen,
Denmark; dose rate, 1.3 Gy/min at 20 mA). After cell line-dependent
times (6–14 days) colonies (>50 cells) were counted.
Matrix-switch experiments
The cells were embedded in 3D lrECM or col-I,
cultivated for 5 days, and retrieved by treatment with EDTA or
collagenase (Merck, Darmstadt, Germany) followed by trypsinization.
After counting using a microscope (Axiovert 40 C; Carl Zeiss Inc.,
Jena, Germany), the cells were embedded in the same or different
matrices for 6–8 days.
Phenotype isolation
The DLD-1 cells were cultivated on top of 3D col-I
for 8 days. Subpopulations exhibiting distinct phenotypes, namely
the formation of cell clusters or single cell groups were isolated
and further propagated to establish two separate cell lines (cell
clusters, DLD-1α-cat; and single cell groups,
DLD-1Δα-cat).
siRNA, esiRNA and plasmid
transfection
Transfection with siRNA, esiRNA and plasmids was
performed with Oligofectamine or Lipofectamine 2000 (Invitrogen) as
previously described (18).
pcDNA3-α-cat (20) was kindly
provided by Dr C. Gottardi (Northwestern University, Chicago, IL,
USA). E-cadherin and α-catenin knockdown was performed with siRNA.
siRNA E-cadh. #2 (5′-CGAAUGUGGUACCUUUUG Att-3′; ID no. 146382) was
from Applied Biosystems (Foster City, CA, USA), and siRNA E-cadh.
#3 (5′-GAGUGAAUUUUGAAG AUUGtt-3′; ID no. 44988) and siRNA α-cat
(5′-GGUUACAACCCUUGUAAACtt-3′; ID no. 10582) were from Life
Technologies (Carlsbad, CA, USA). Non-specific control siRNA
(5′-GCAGCUAUAUGAAUGUUGUtt-3′) was from Eurofins MWG Operon
(Ebersberg, Germany). The knockdown of upregulated genes in the
DLD-1Δα-cat cells was performed with esiRNA (Eupheria
Biotech, Dresden, Germany) against various target genes
[alpha-2-macroglobulin (A2M), aldehyde dehydrogenase 1
family member L1 (ALDH1L1), FERM domain containing 4A
(FRMD4A), guanylate binding protein 2 (GBP2), heat
shock protein family H (Hsp110) member 1 (HSPH1), kallikrein
related peptidase 7 (KLK7), laminin subunit alpha 2
(LAMA2), L3MBTL4, histone methyl-lysine binding protein
(L3MBTL4), MTSS1, I-BAR domain containing (MTSS1),
nectin cell adhesion molecule 3 (NECTIN3), NIMA related
kinase 10 (NEK10), olfactomedin like 3 (OLFML3),
oxidation resistance 1 (OXR1), ring finger protein 144B
(RNF144B), ribosomal protein S6 kinase A6 (RPS6KA6),
SH3 domain binding glutamate rich protein like (SH3BGRL),
transmembrane protein 150A (TMEM150A) and very low density
lipoprotein receptor (VLDLR)]. At 24 h following
transfection, the cells were used for colony formation or invasion
assays. The efficient knockdown or DNA delivery was confirmed at 48
h after transfection by western blot analysis.
Adhesion assay
For the evaluation of adhesion, the cells were
plated on cell culture dishes pre-coated with col-I (1
µg/cm2). After 3 h, non-attached cells were
removed with phosphate-buffered saline (PBS) and the adherent cells
were fixed with 70% ethanol and stained with Coomassie (AppliChem,
Darmstadt, Germany) for microscopic evaluation (Axiovert 40 C; Carl
Zeiss Inc.).
Proliferation assay
Equal cell numbers were seeded in 3D lrECM or col-I
for 96 h. The cells were retrieved by treatment with EDTA or
collagenase followed by trypsinization and cell counting using a
microscope (Axiovert 40 C; Carl Zeiss Inc.) (19).
Spheroid formation and 3D invasion
assay
3D invasion assay was performed as previously
described (19). Briefly,
spheroids were produced by seeding 104 cells into
agarose-coated round-bottom 96-well plates for 1–3 days. For 3D
invasion, the spheroids were embedded into 3D col-I (1 mg/ml) and
invasion was measured after 24 and 48 h using an Axiovert 200
microscope (Carl Zeiss Inc.).
Immunofluorescence staining
For the localization of indicated proteins,
immunofluorescence analysis was performed as previously described
(18). Briefly, staining of the
proteins of interest was performed with specific primary antibodies
and fluorescence-labeled secondary antibodies and nuclei were
stained with DAPI (Alexis, Grünberg, Germany). Representative
immunofluorescence images were obtained using a Laser Scanning
microscope LSM510 Meta (Carl Zeiss Inc.).
Total protein extracts and western blot
analysis
Cells grown under 2D or 3D conditions for 24 to 96 h
were lysed using modified RIPA buffer [50 mM Tris-HCl (pH 7.4), 1%
Nonidet-P40, 0.25% sodium deoxycholate, 150 mM NaCl, 1 mM EDTA,
complete protease inhibitor cocktail (Roche, Mannheim, Germany), 1
mM Na3VO4 and 2 mM NaF]. Cell homogenization
was performed with a 29-gauge needle and following centrifugation
for 20 min at 13,000 × g the samples were stored at −80°C.
SDS-PAGE, western blot analysis and the detection of specific
proteins were performed as previously described (18,19).
Briefly, proteins were separated by SDS-PAGE and transferred onto
nitrocellulose membranes (GE Healthcare). After blocking with 5%
non-fat dried milk powder (AppliChem) in PBS (Sigma-Aldrich) and
subsequent incubation with primary and horseradish
peroxidase-conjugated secondary antibodies (overnight at 4°C and
1.5 h at room temperature, respectively), the proteins of interest
were detected with Amersham ECL Prime Western Blotting Detection
Reagent (GE Healthcare). X-ray films were scanned (Epson Perfection
4490 Photo; Epson, Tokyo, Japan) and used for densitometric
analysis.
Microarray-based genome and transcriptome
analysis
DNA was isolated from DLD-1 subpopulations grown
under 3D culture conditions according to the manufacturer's
instructions using the NucleoSpin Tissue kit (Macherey-Nagel,
Düren, Germany). Genomic analysis was performed using Affymetrix
CytoScan HD Arrays (Affymetrix, Santa Clara, CA, USA). Affymetrix
Chromosome Analysis Suite (ChAS) software was used for data
processing and copy number aberration detection using the
manufacturer's standard settings and array annotation database
build 32.3. Gene expression profiles were measured as previously
described (21). Total RNA was
isolated from DLD-1 subpopulations grown under 3D culture
conditions using the NucleoSpin RNA II kit (Macherey-Nagel) and
used for transcriptome analysis using Affymetrix Human
Transcriptome Arrays 2.0 and Affymetrix Human Genome U133 Plus 2.0
Arrays (Affymetrix). Procedures for cDNA synthesis, labeling,
hybridization, washing and staining were carried out per the
manufacturer's (Affymetrix) instructions and recommendations using
the manufacturer's dedicated Reagent kits. Affymetrix Gene
Expression Console (v.1.1) software was used for data processing
using standard settings (quantile normalization, RMA correction).
GenePattern software (Broad Institute, Cambridge, MA, USA) was used
to reduce (collapse) multiple gene occurrences on the arrays via
gene symbol to one signal per gene and sample. Microarray data are
accessible on NCBI GEO under series accession number GSE109047.
Differential gene expression was determined within each array
platform using a t-test with unequal variance, a P-value threshold
of 0.1 and a signal-log-ratio of 0.65. esiRNA transfection
experiments were carried out to analyze the functional impact of
some major candidates. Those candidates were selected through
application of a more stringent P-value threshold of 0.05 observed
in both array types and a signal-log-ratio of 0.65 in at least one
type.
Patient characteristics, treatment and
biopsy samples
Following an institutional review board approval
[Ethics Committee of the University of Erlangen (approval no.
3085)] and after obtaining written informed consent, a total of 33
patients with locally advanced (UICC stage II/III) rectal
adenocarcinoma were included in this study. The median age was 61.8
years with a range of 40 to 74 years. Within a prospective protocol
(XELOX-RT) (22), all patients
received pre-operative radiotherapy with 1.8 Gy single doses to a
total dose of 50.4 Gy. Capecitabine was administered concurrently
at 825 mg/m2 twice daily on days 1 to 14 and 22 to 35,
and oxaliplatin 50 mg/m2 on days 1, 8, 22 and 29.
Paraffin-embedded tissue specimens were obtained from
pretherapeutic rectal biopsies routinely used for diagnostic
purpose. Additionally, biopsies from pre-treated tumors were
collected from 15 consecutive patients with informed consent for
additional translational research on biopsy samples. Following the
removal of portions needed for pathological evaluation, biopsies
were immediately flash-frozen in liquid nitrogen, and stored until
the extraction of mRNA.
Follow-up and criteria for relapse
Patients were re-evaluated at 3-month intervals for
2 years and every 6 months thereafter, for a total of 5 years.
Proctoscopy (if the rectum was in place) was performed at 6-month
intervals in the first year, and once a year thereafter. A
follow-up schedule consisted of abdominal ultrasound (every 6
months for 2 years, then once per year for 3 years), computerized
tomography of the abdomen and pelvis (3 months after completion of
adjuvant treatment), and chest X-rays (once a year for the first 3
years). Histological confirmation of locoregional and distant
relapse was encouraged.
Microarray expression analysis in patient
biopsies
A total of 10 µg total RNA were used to
prepare biotinylated cRNAs. The hybridization of 15 µg
labeled cRNA was performed on HG-U133A Affymetrix microarrays
(Affymetrix) as previously described (23). All arrays were globally scaled to a
target value of 1,000, and E-cadherin and α-catenin mRNA values
(Affymetrix Average Difference Units) were evaluated using
Microarray Suite 5.0 software.
Immunohistochemical detection of
E-cadherin, α-catenin and scoring
Formalin-fixed, paraffin-embedded (FFPE) tissues
from 33 patients were subjected to a staining procedure with DAKO
EnVision™ FLEX peroxidase blocking reagent (K8000; Dako, Hamburg,
Germany) and antigen retrieval via pre-treatment with citrate
buffer pH 6.0 (Abcam, Cambridge, UK) for 20 min. The slides were
then incubated with primary antibodies to either E-cadherin (1:400,
ab40772) or α-catenin (1:100, ab51032) (both from Abcam) for 120
min at room temperature. Following this, dextran polymer conjugated
horseradish peroxidase and 3,3′-diamino-benzidine (DAB) chromogen
was used for visualization and hematoxylin solution (Gill 3;
Sigma-Aldrich, Munich, Germany) for counterstaining. Negative
control slides in the absence of primary antibodies were included
for each staining. Marker expression was evaluated
semi-quantitatively by two independent investigators (F.R. and
S.H.) without knowledge of the clinical characteristics. The
percentage of positive tumor cells was assigned to one of the
following categories: 0 (<5%), 1 (5–25%), 2 (26–50%), 3 (51–75%)
and 4 (>75%). The intensity of immunostaining was scored as
follows: 1+ (weak), 2+ (moderate) and
3+ (intense) and the percentages of positive tumor cells
and staining intensity were then multiplied to produce an
individual weighted score of 0–12.
Data analysis and statistics
Densitometric analysis of the results of western
blot analysis was performed using ImageJ software (http:www.nih.gov). Unless indicated otherwise, the
results are shown as the means ± SD of 3 independent experiments.
P-values are based on an unpaired, two-sided Student's t-test or
one-way ANOVA and Dunnett's multiple comparisons test using
Microsoft Excel 2010 or Prism 6 (GraphPad Software) and P<0.05
was considered to indicate a statistically significant difference.
Due to the limited number of patients and to facilitate further
statistical analysis, the weighted histochemical scores were
arbitrarily dichotomized: A score of ≤6 was classified as 'low
E-cadherin and low α-catenin expression', and a score of >6 was
classified as 'high E-cadherin and high α-catenin expression'.
Further endpoints of this study were actuarial overall survival
rates as calculated using the method of Kaplan-Meier, and freedom
from local relapse and distant disease. The level of significance
was 0.05 (two-sided) in all statistical testing. Statistical
analysis was performed using IBM SPSS version 21 software.
Results
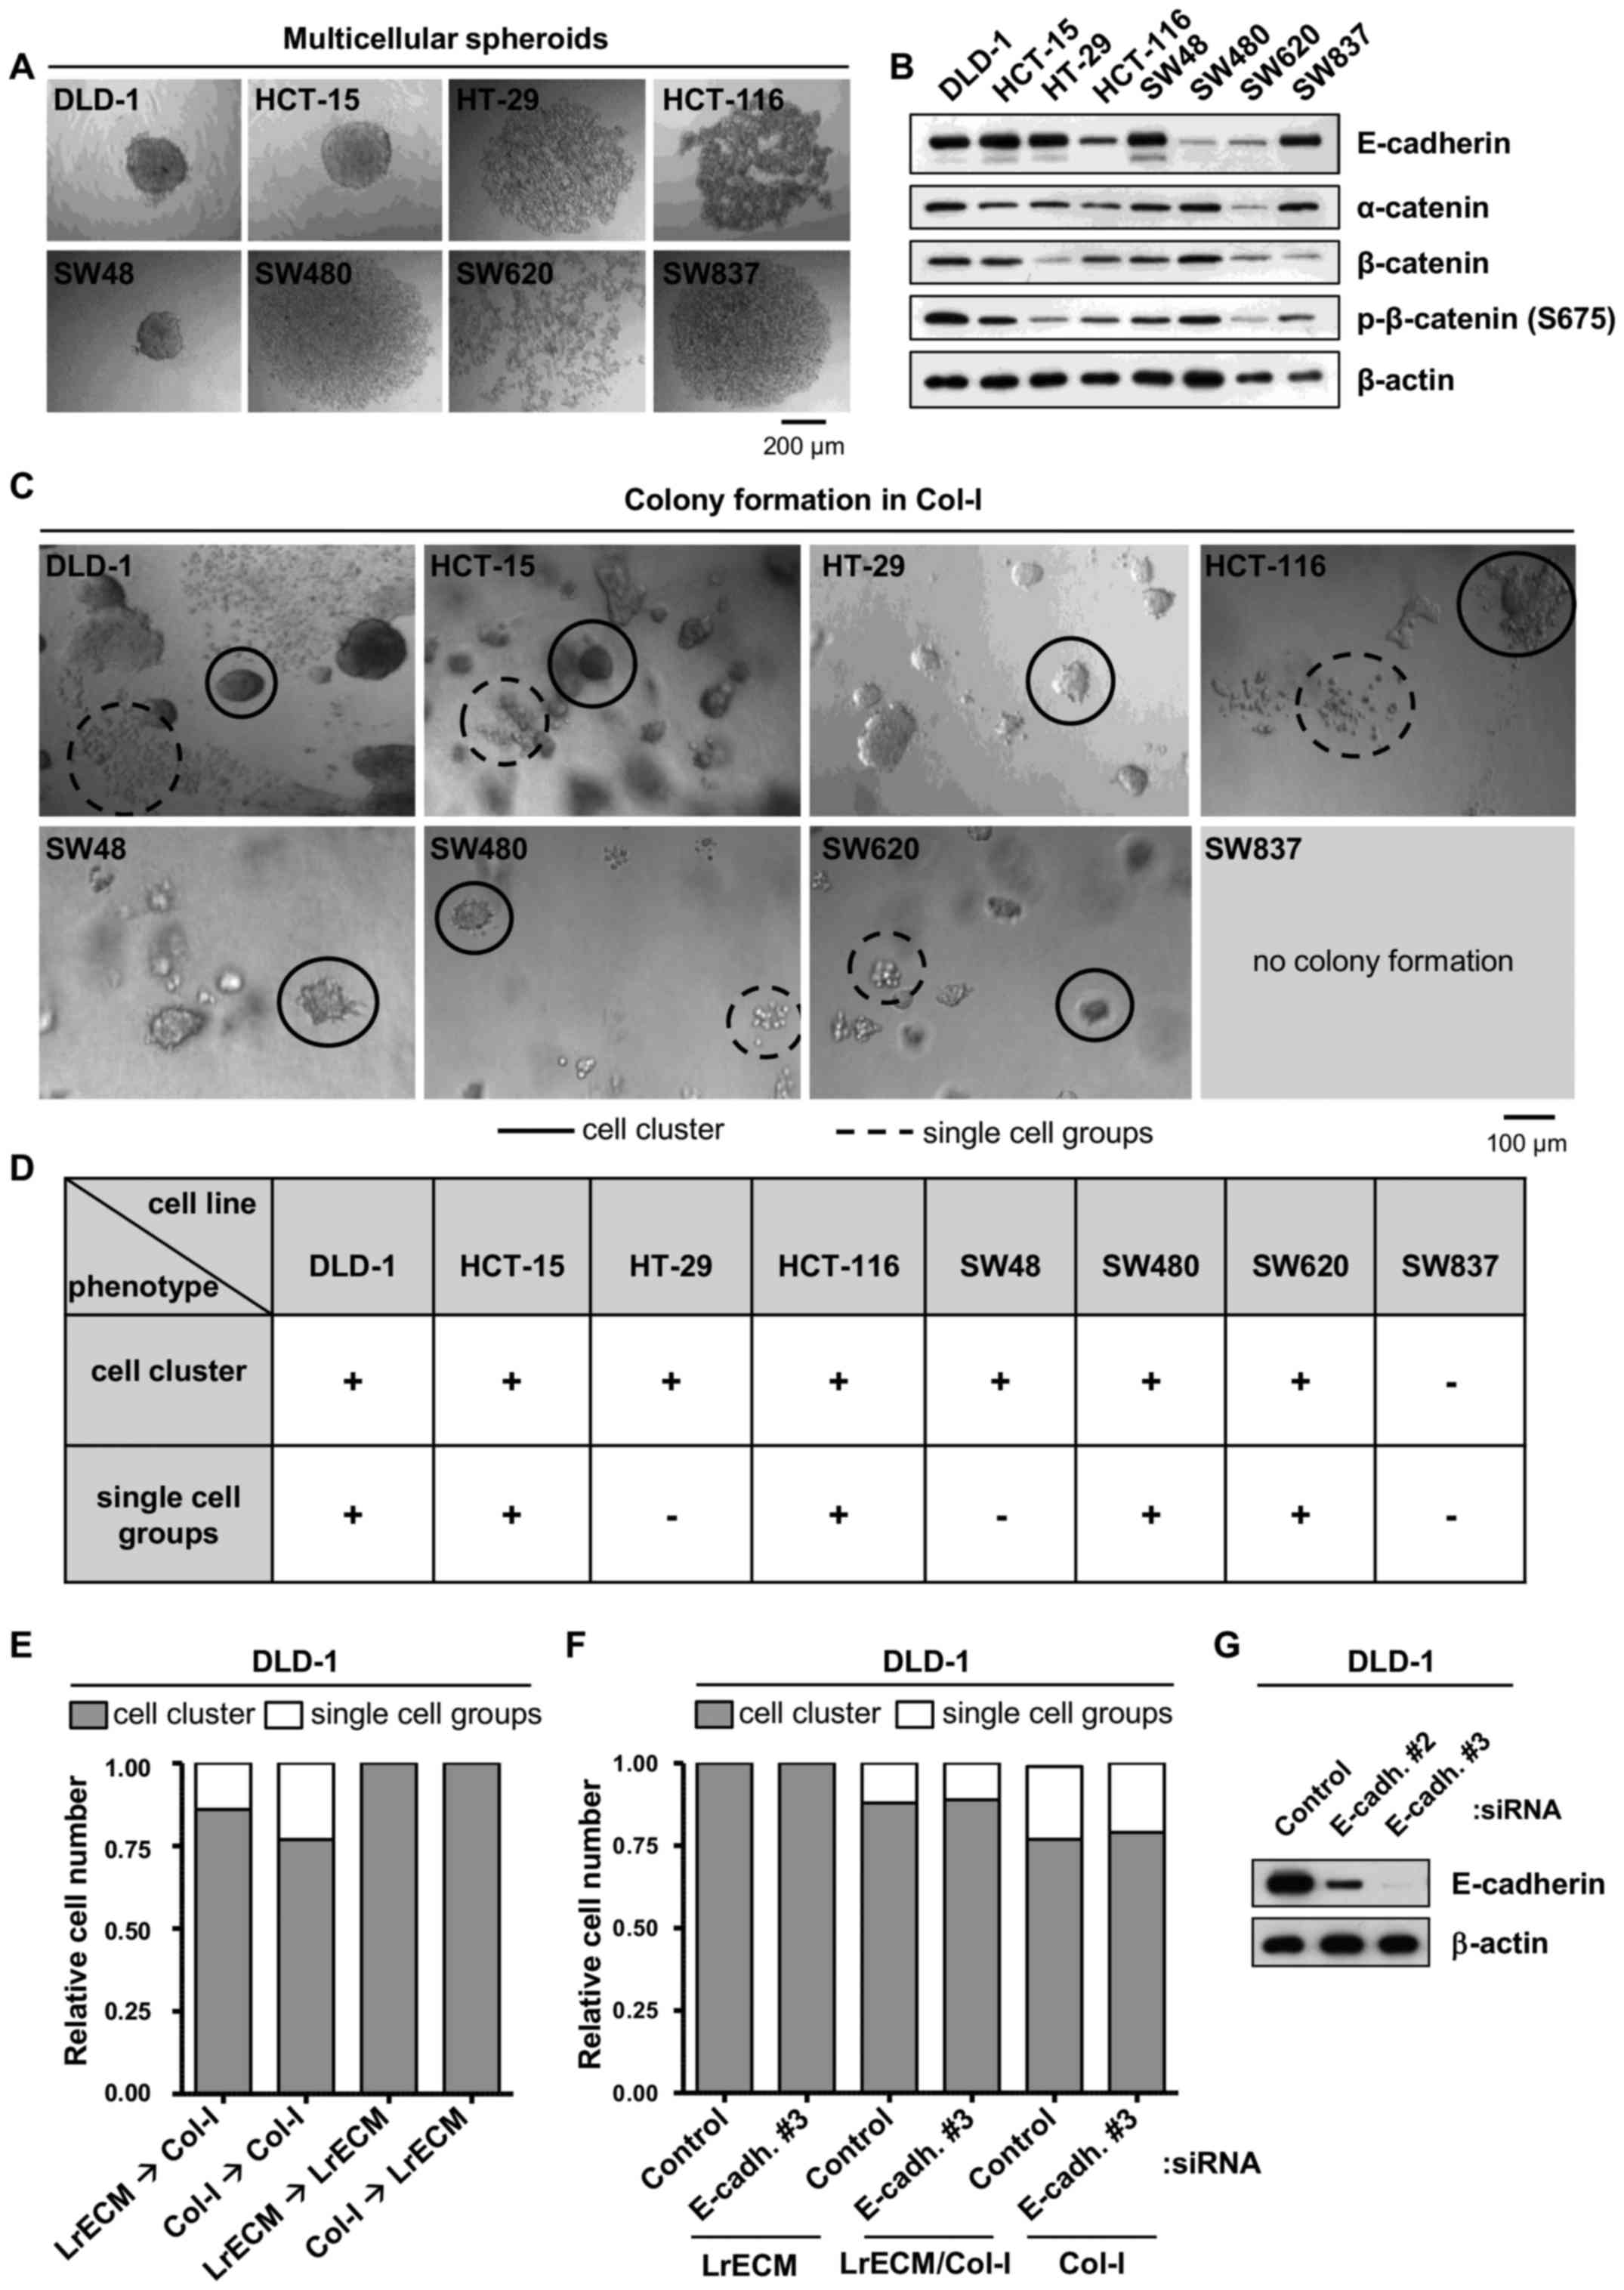
CRC cell lines exhibit distinct
morphologies in 3D culture
Since the growth of cancer cells in spheroids and in
a 3D matrix is well known to resemble physiological growth
conditions (24,25), we examined the capability of a
panel of CRC cell lines to grow as free-floating multicellular
spheroids (Fig. 1A). Whereas the
DLD-1, HCT-15 and SW48 cells formed compact spheroids, the HT-29,
HCT-116, SW480 and SW837 cells appeared as loose cell clusters.
SW620, the only cell line derived from a lymph node metastasis of a
CRC, failed to aggregate.
Due to their roles in spheroid formation and
cell-cell adhesion, the expression of E-cadherin, α-catenin and
β-catenin was then determined. The expression and phosphorylation
patterns of these proteins were heterogeneous among the tested CRC
cell lines (Fig. 1B) and failed to
correlate with spheroid formation capability (data not shown).
Based on the differences in tight versus loose
spheroid formation and the fact that col-I is abundantly expressed
in CRC and generally serves as a stimulus for the invasion of
various types of cancer cells, including cells originating from CRC
(17,26) in this study, the cells were
embedded in 3D col-I. With the exception of the SW837 cells, all
CRC cell lines formed colonies in col-I. Of note, the DLD-1,
HCT-15, HCT-116, SW480 and SW620 cells exhibited two distinct
morphological phenotypes in col-I, namely cell clusters and groups
of single cells (Fig. 1C and
D).
To test for the matrix dependence of the formation
of clusters or single cell groups, the cells were embedded into
lrECM, a matrix consisting of various ECM proteins such as laminins
and collagens. Of note, no single cell groups grew in lrECM,
leading us to perform crossover experiments, in which the cells
from lrECM were re-embedded into col-I and vice versa (Fig. 1E). While embedding the cells from
either lrECM or col-I into col-I led to 20–25% single cell groups,
re-seeding into lrECM induced the disappearance of single cells
(Fig. 1E). We also depleted
E-cadherin and found unaffected cell cluster/single cell group
distributions (Fig. 1F and G). Of
note, testing for markers of the epithelial-mesenchymal transition
(EMT) (27) process, such as
fibronectin, TGF-β and ZO-1 indicated no EMT (data not shown).
These findings indicate that the formation of cell clusters seems
to be independent from E-cadherin, α-catenin and β-catenin, and
provide evidence as to the mechanisms through which col-I drives a
phenotypical, EMT-unrelated change in some CRC cell lines. However,
further experiments are warranted to fully elucidate the underlying
mechanisms.
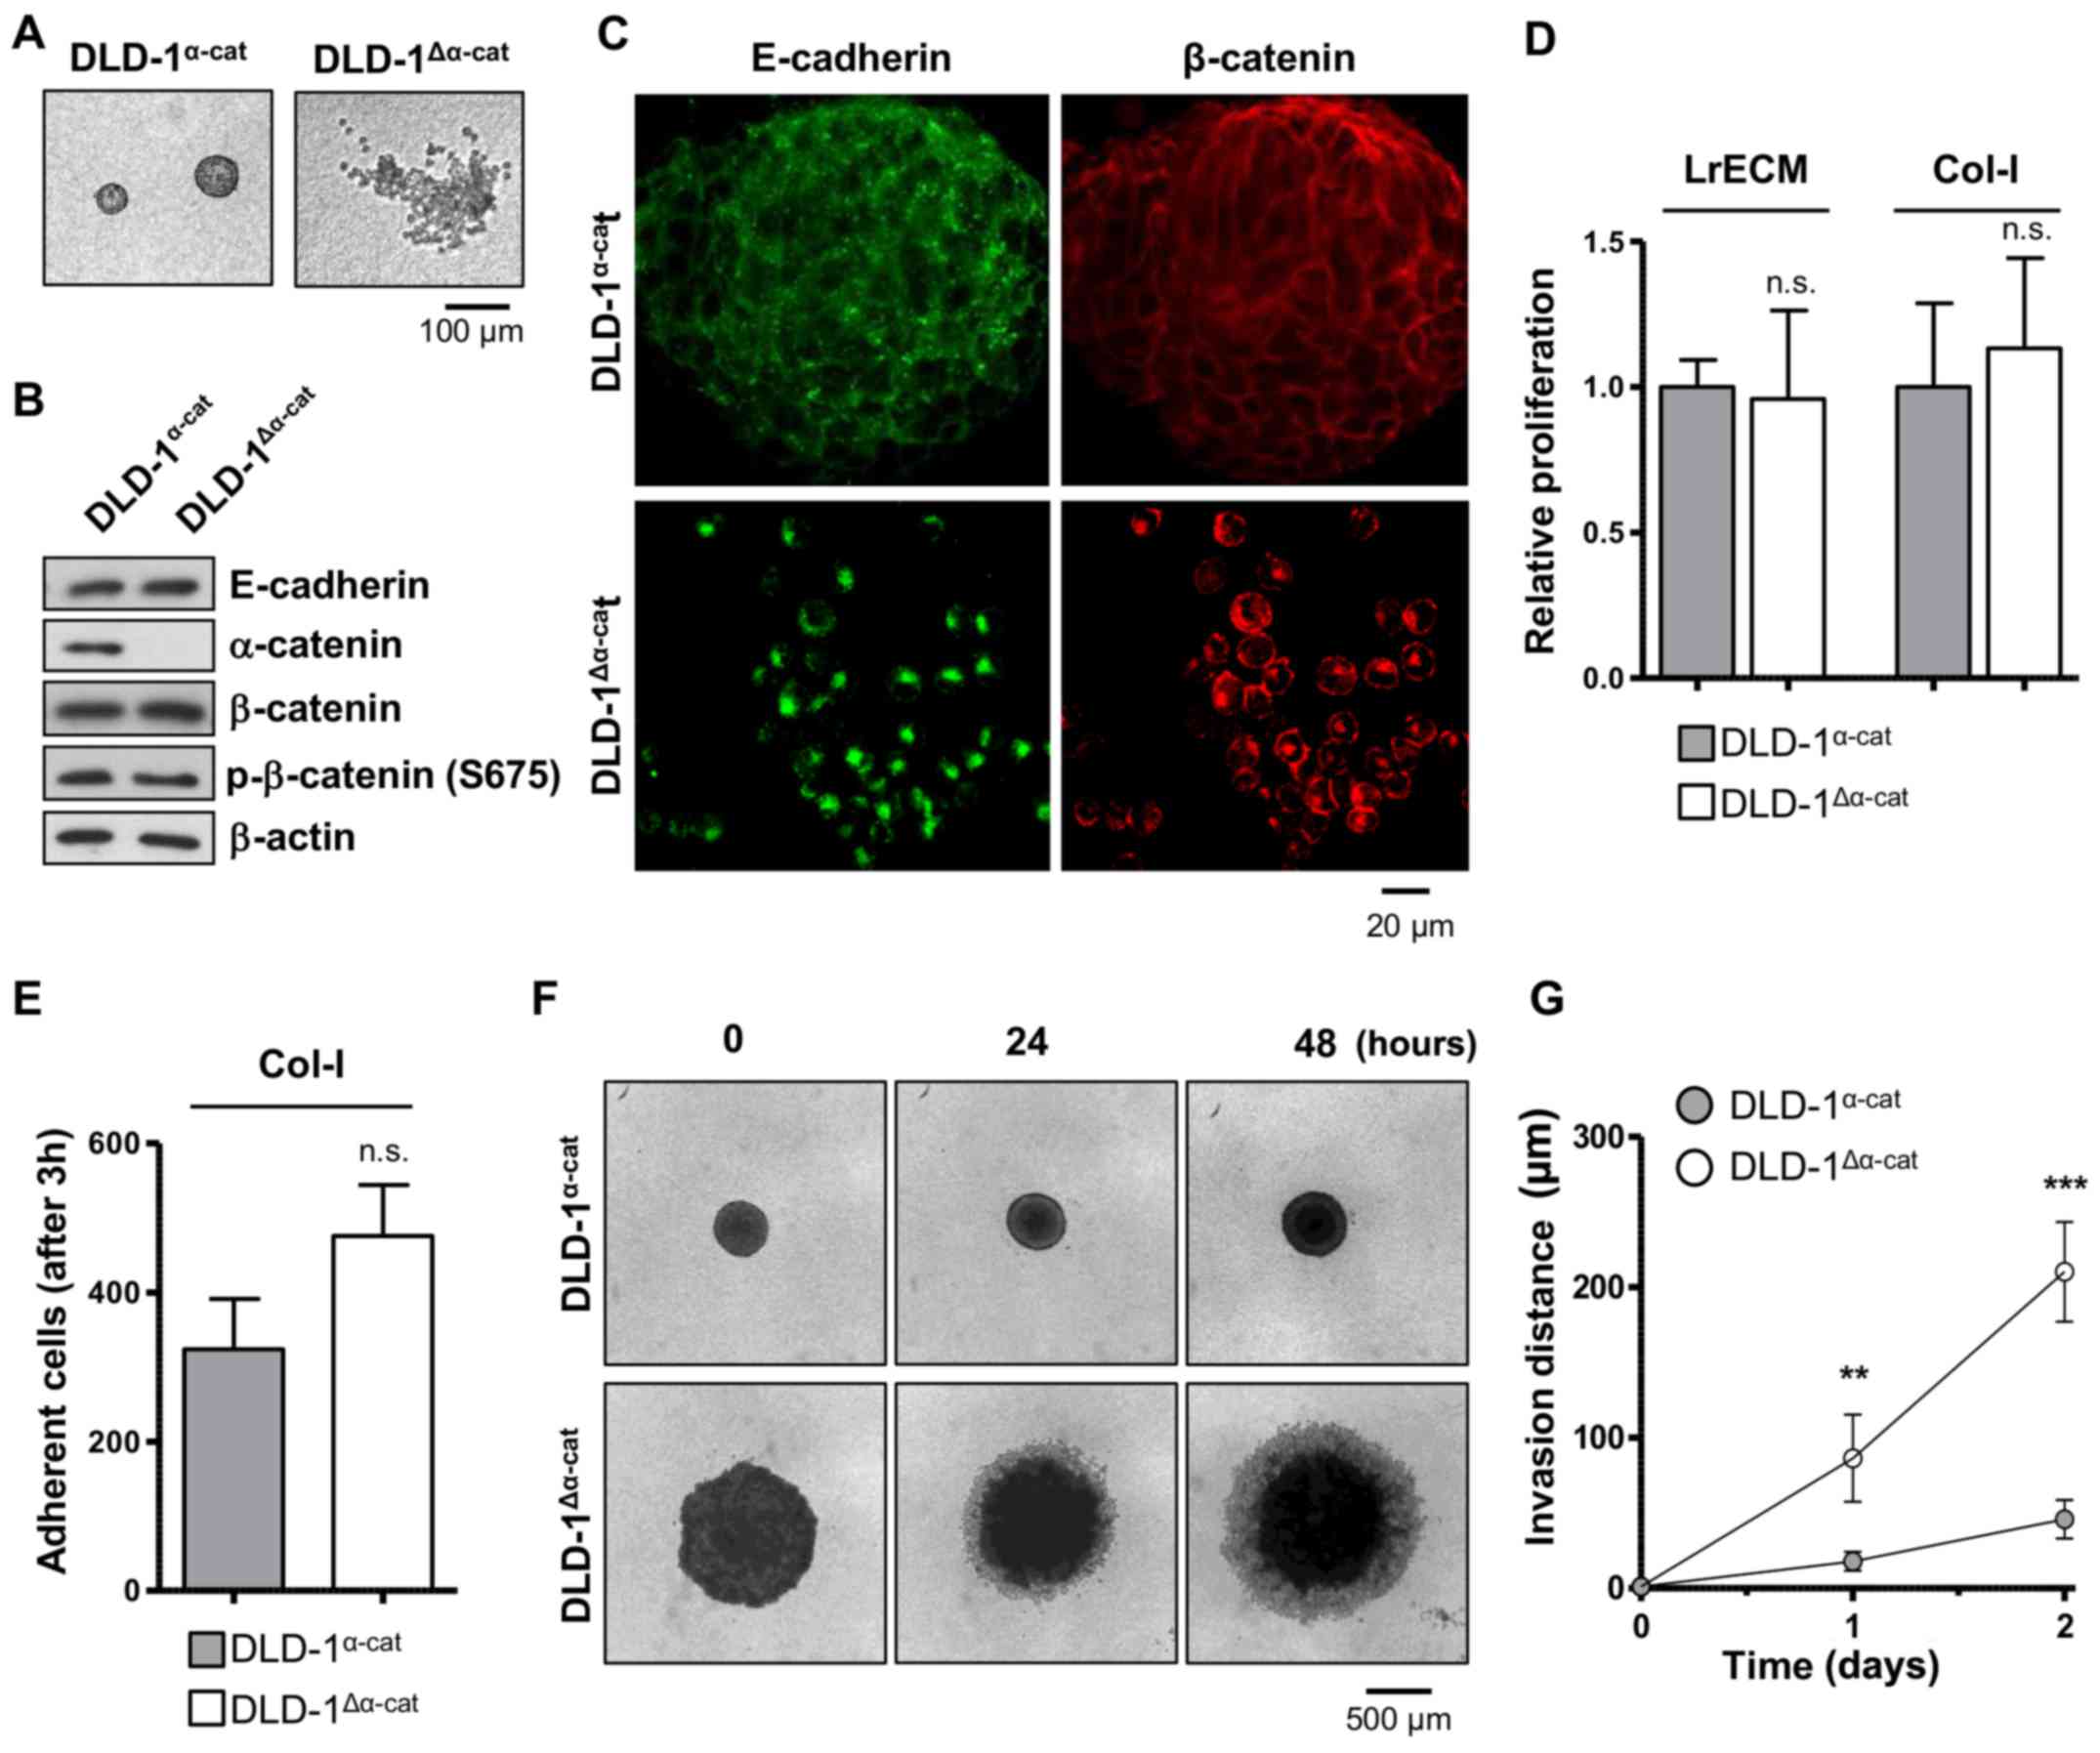
α-catenin affects cell adhesion and
invasion but not radiochemosensitivity
In line with other studies (26,28,29),
we isolated, propagated and characterized the two distinct DLD-1
subpopulations. The DLD-1 subpopulations grew either as compact
cell clusters or as groups of single cells in 3D col-I (Fig. 2A). Our corroborative data further
revealed the absence of α-catenin in DLD-1 single cells in contrast
to DLD-1 cell clusters (Fig. 2B)
(26,29). Accordingly, the subpopulations were
termed as DLD-1α-cat (epithelioid or forming cell
clusters in col-I) and DLD-1Δα-cat (round or forming
single cell groups in col-I). Despite a similar protein expression
of E-cadherin and β-catenin in the two subpopulations (Fig. 2B), the staining of these proteins
revealed an altered subcellular localization, i.e., physiological
E-cadherin and β-catenin localization at the cell membrane in the
DLD-1α-cat cells as opposed to cytosolic, peri-nuclear
E-cadherin and β-catenin in the DLD-1Δα-cat cells
(Fig. 2C).
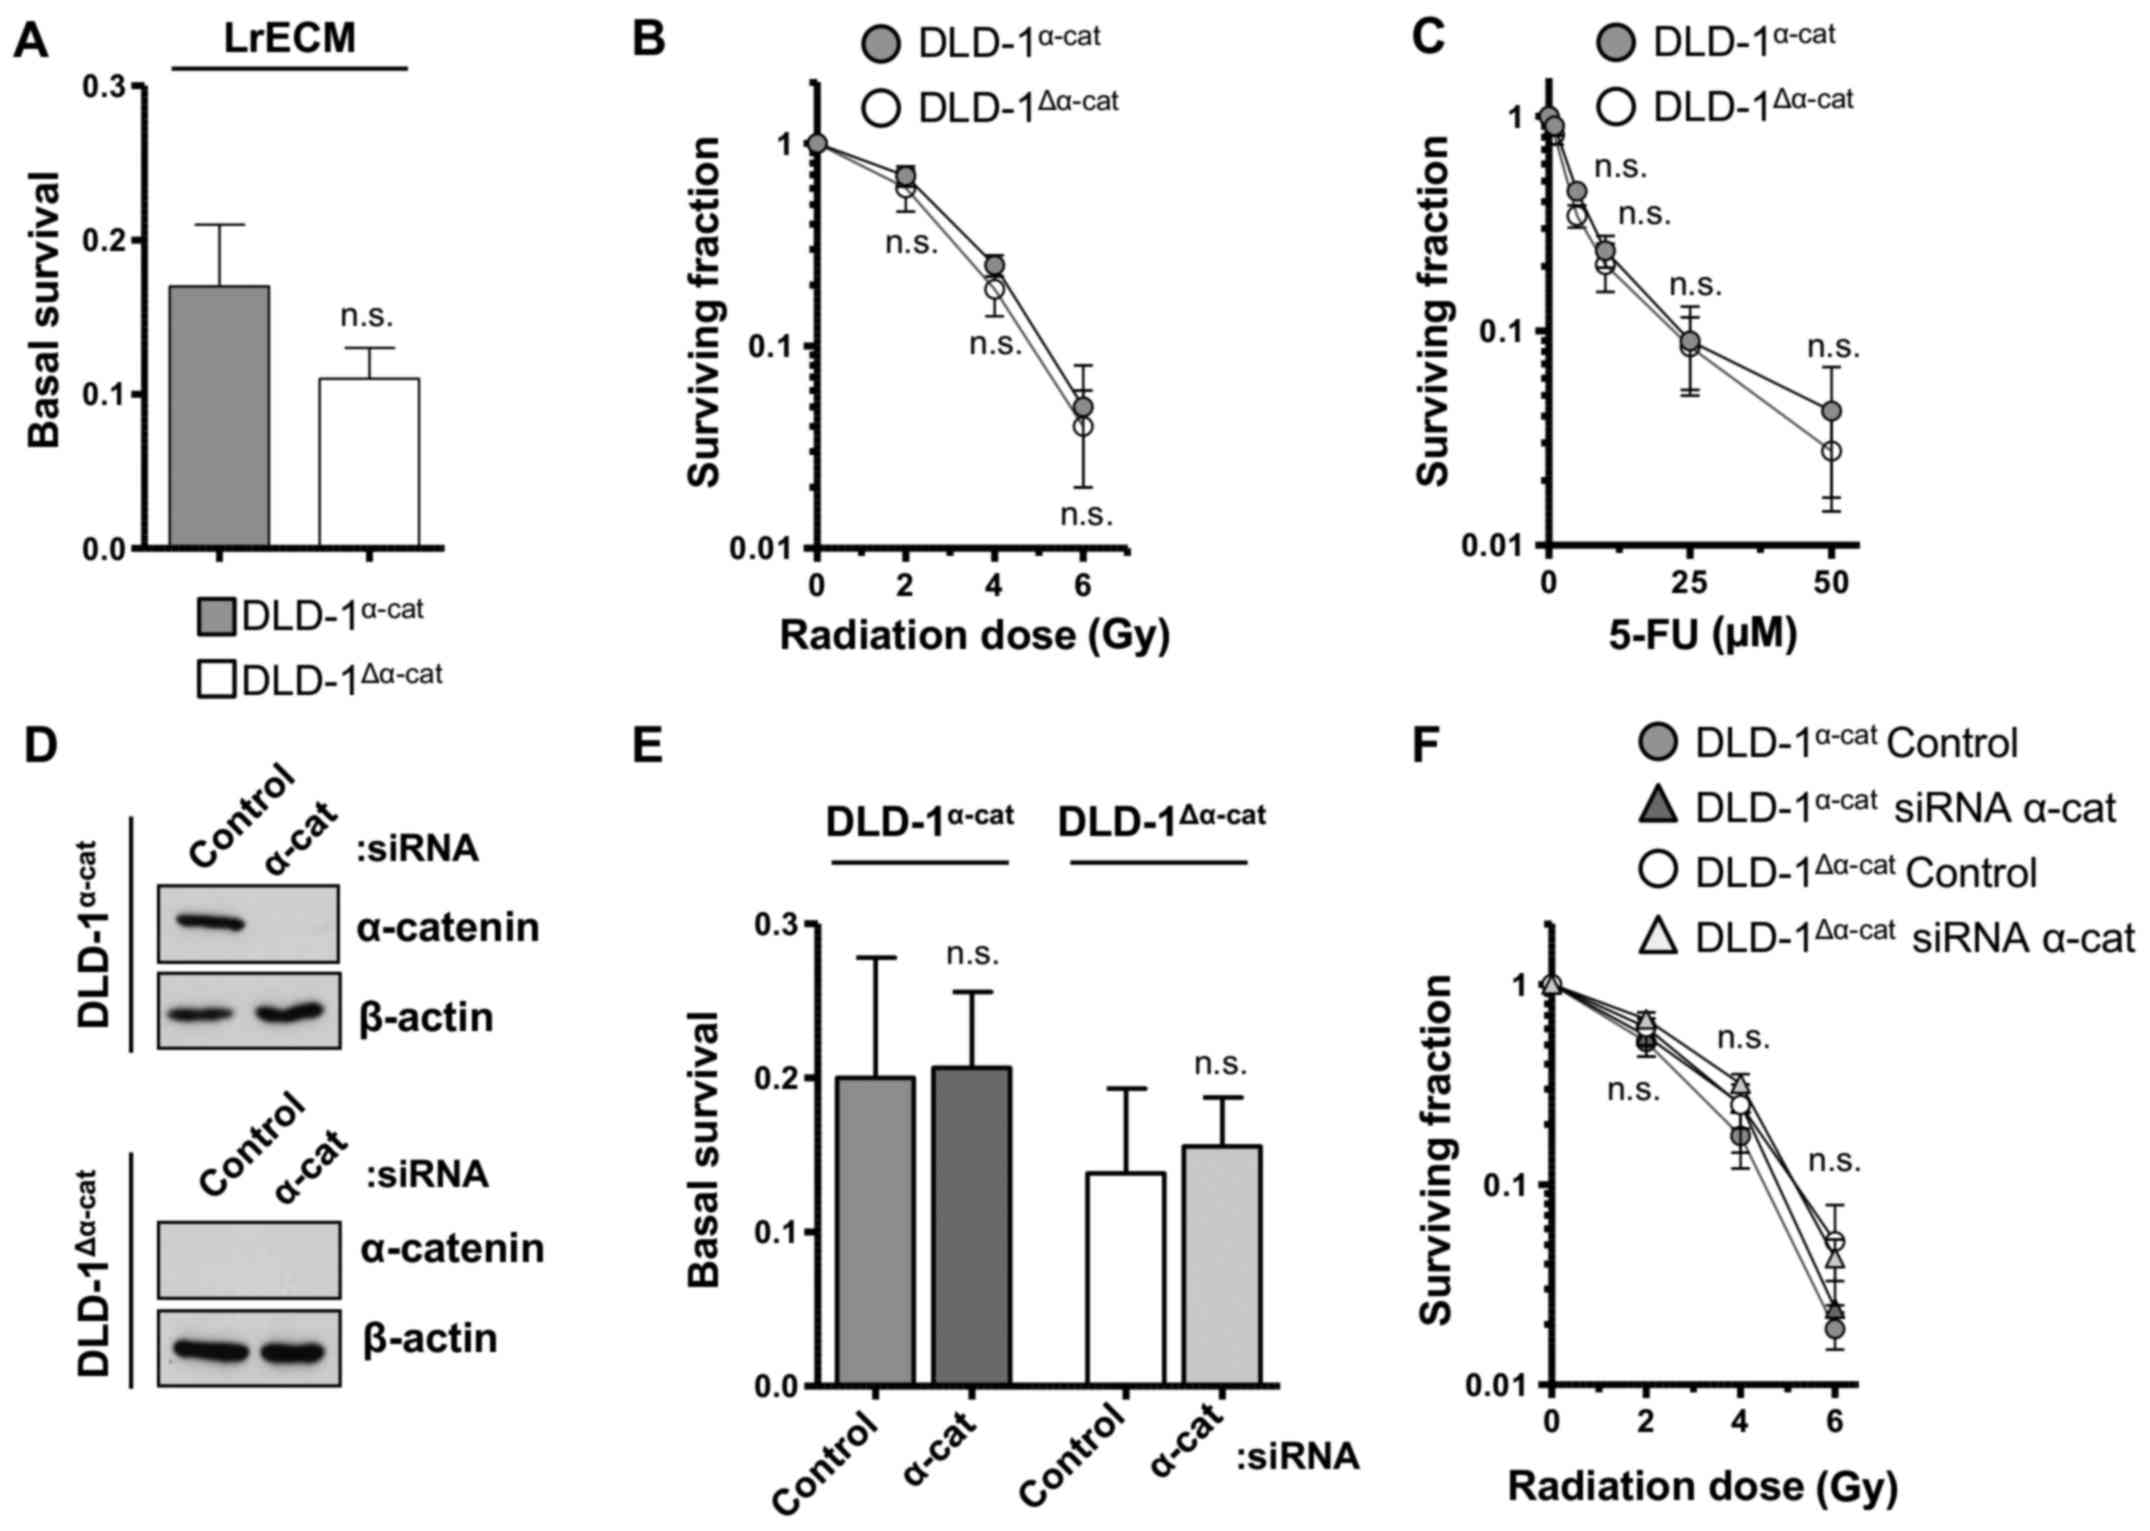
Connecting α-catenin to the adhesion, invasion and
radio-chemosensitivity of CRC cells, we then investigated DLD-1
subpopulation behavior in and on lrECM and col-I. Despite clear
morphological differences, the DLD-1 subpopulations exhibited a
similar proliferation in 3D lrECM and col-I (Fig. 2D). Although not significantly
different, the adhesion to col-I was less in the
DLD-1α-cat cells than in the DLD-1Δα-cat
cells (Fig. 2E). By testing for 3D
col-I invasion, we addressed the spheroid formation characteristics
and invasion simultaneously. Whereas the DLD-1Δα-cat
cells formed large disk-like spheroids, the DLD-1α-cat
cells grew in small, round spheroids (Fig. 2F). Due to their improper cell-cell
contacts, it was not surprising that the invasion distance covered
by the DLD-1Δα-cat cells was 5-fold greater than that of
the DLD-1α-cat cells (Fig.
2F and G). Moreover, basal clonogenic survival, sensitivity to
radiation and treatment with 5-FU were found to be similar between
α-catenin wild-type and deleted cell populations (Fig. 3A–C). In agreement, α-catenin
silencing did not alter basal and radiation survival (Fig. 3D–F). These results clearly indicate
that α-catenin is pivotal for invasion more than for adhesion, but
is clearly not pivotal for the radiochemosensitivity of DLD-1 CRC
cells.
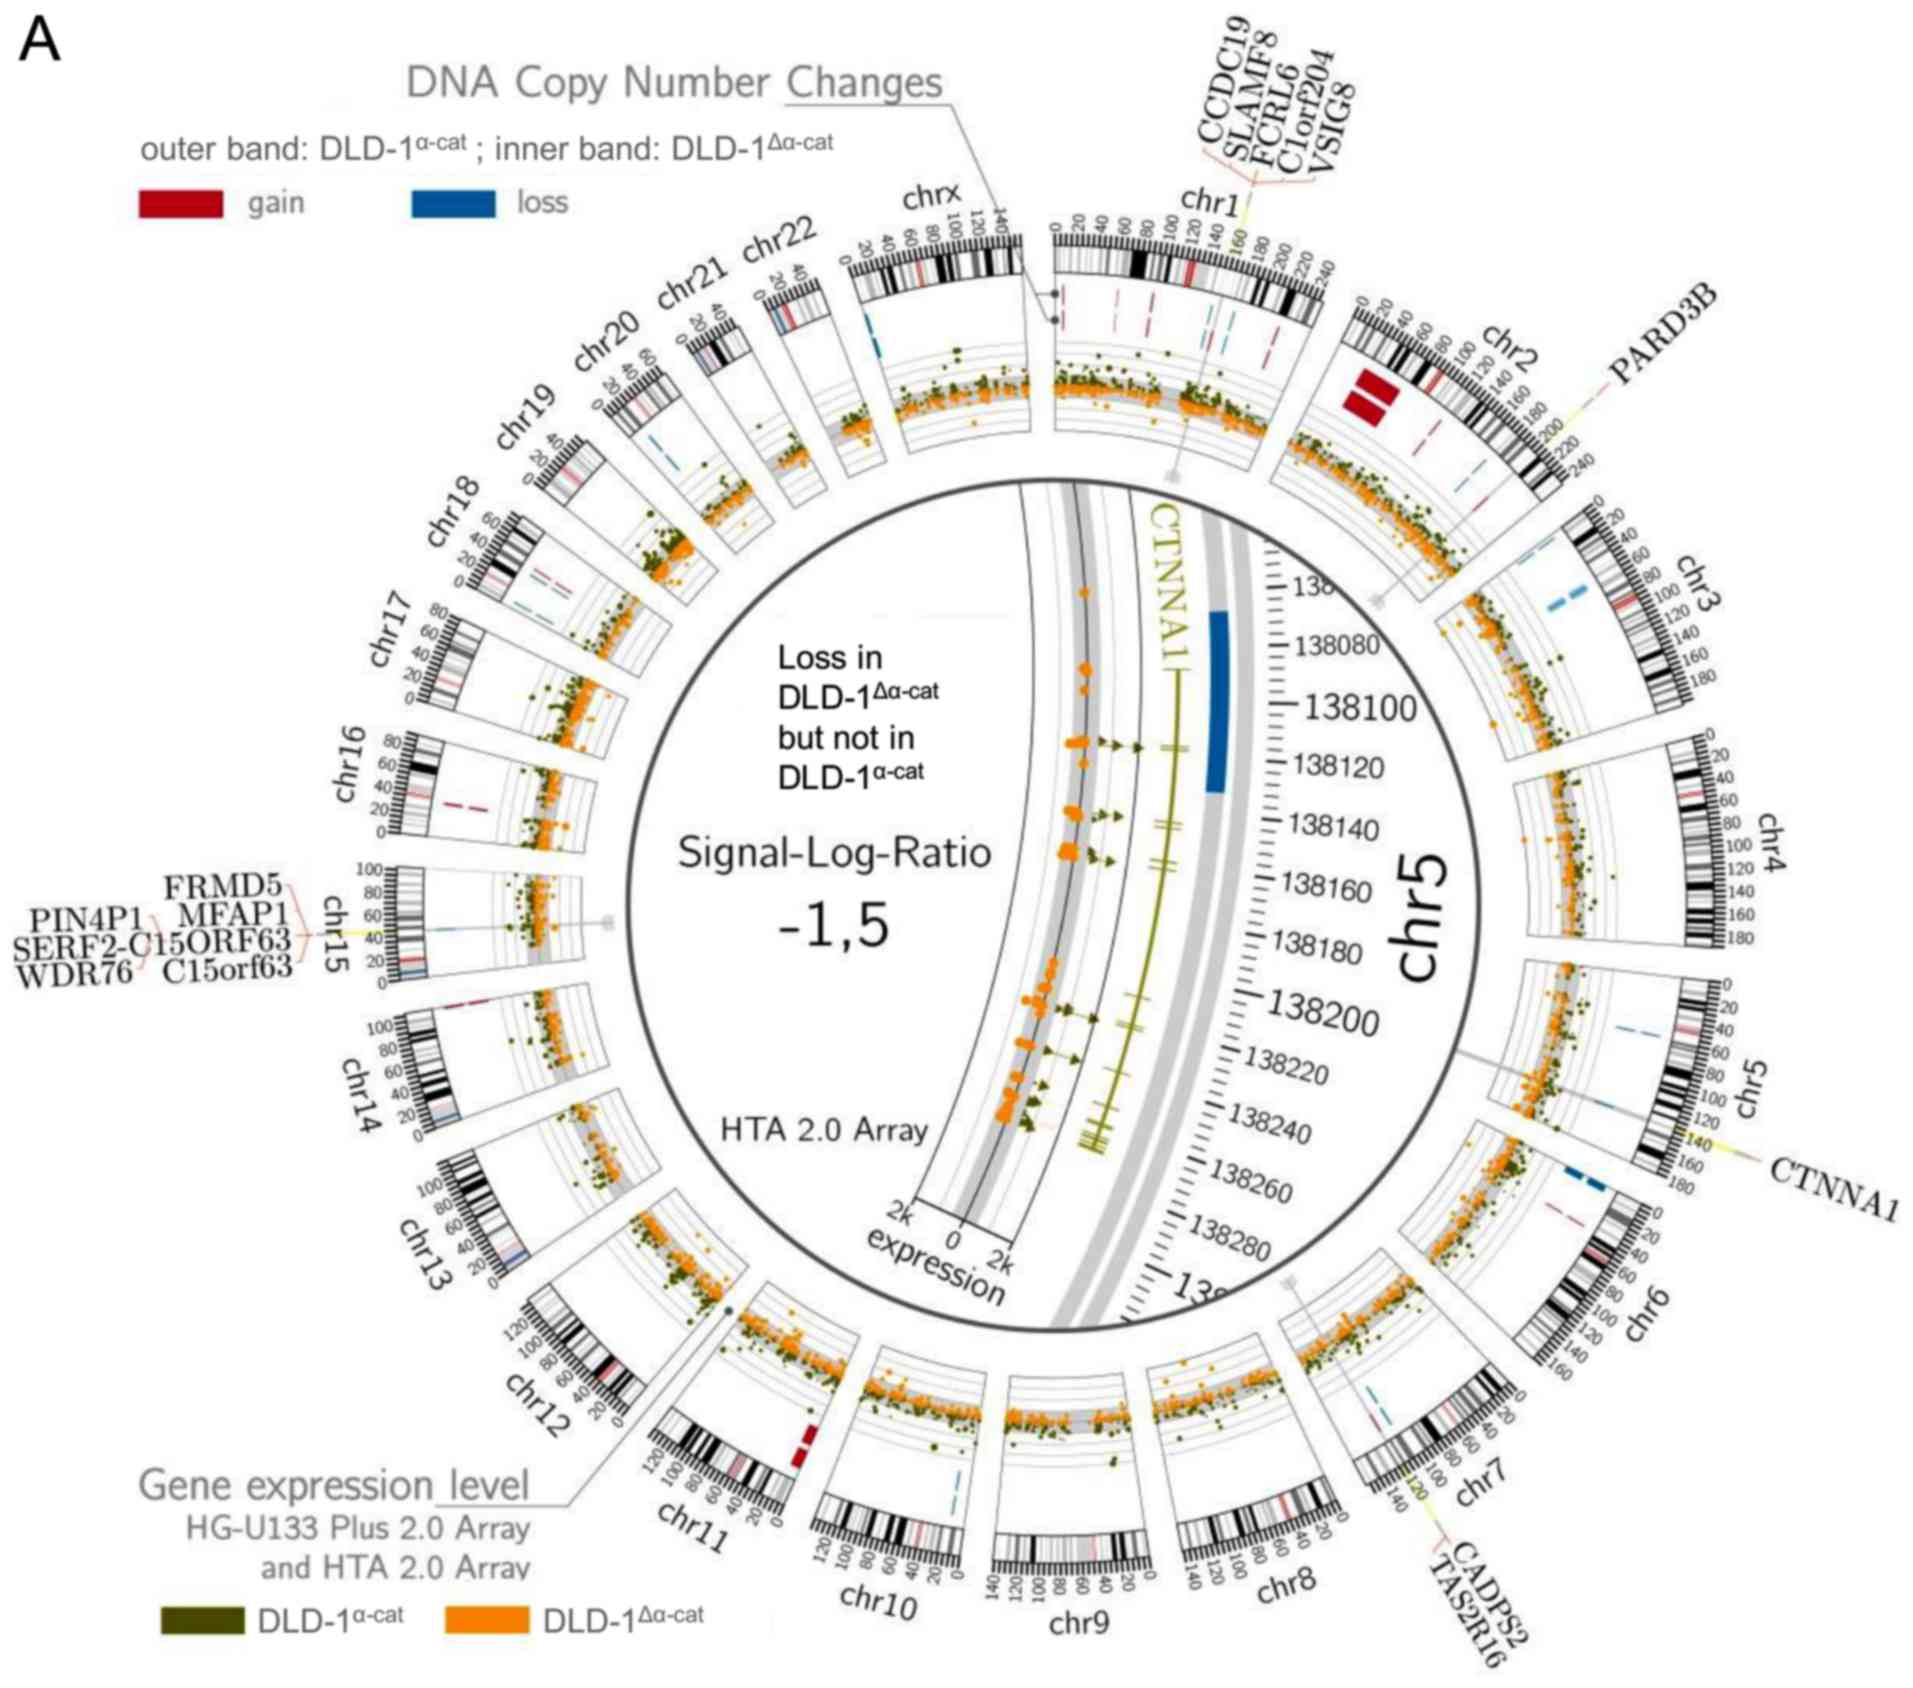
DNA copy number changes and differential
gene expression in DLD-1 subpopulations
In addition to what is already known about DLD-1
subpopulations (26,28–31),
we determined DNA copy number changes and performed transcriptome
and genome analysis. We found the loss of the CTNNA1 gene located
on chromosome 5 in the DLD-1Δα-cat cells as opposed to
the DLD-1α-cat cells. The FCRL6, SLAMF8,
C1orf204, VSIG8, CCDC19 genes on chromosome 1,
as well as the PARD3B gene on chromosome 2 revealed
increased DNA copy numbers in the DLD-1Δα-cat cells
compared with the DLD-1α-cat cells. By contrast,
FRMD5, MFAP1, PIN4P1,
SERF2-C15ORF63, WDR76 and C15orf63 on
chromosome 15, as well as CADPS2 and TAS2R16 on chromosome 7
indicated the loss or gain in the DLD-1α-cat cells
(Fig. 4A).
Comparing the DLD-1 subpopulations, we identified a
number of differentially expressed genes (Fig. 4B). The genomic alterations
described above are also observed at the transcription level, e.g.,
CTNNA1 was downregulated, while FRMD5 was upregulated
in the DLD-1Δα-cat cells. Among the upregulated genes,
we identified S100A4 as a β-catenin target gene (Fig. 4B). Among the downregulated genes,
we found the β-catenin target genes, LGR5 and ABCB1
(Fig. 4B).
Targeting of differentially expressed
genes fails to modify the invasive phenotype of
DLD-1Δα-cat cells
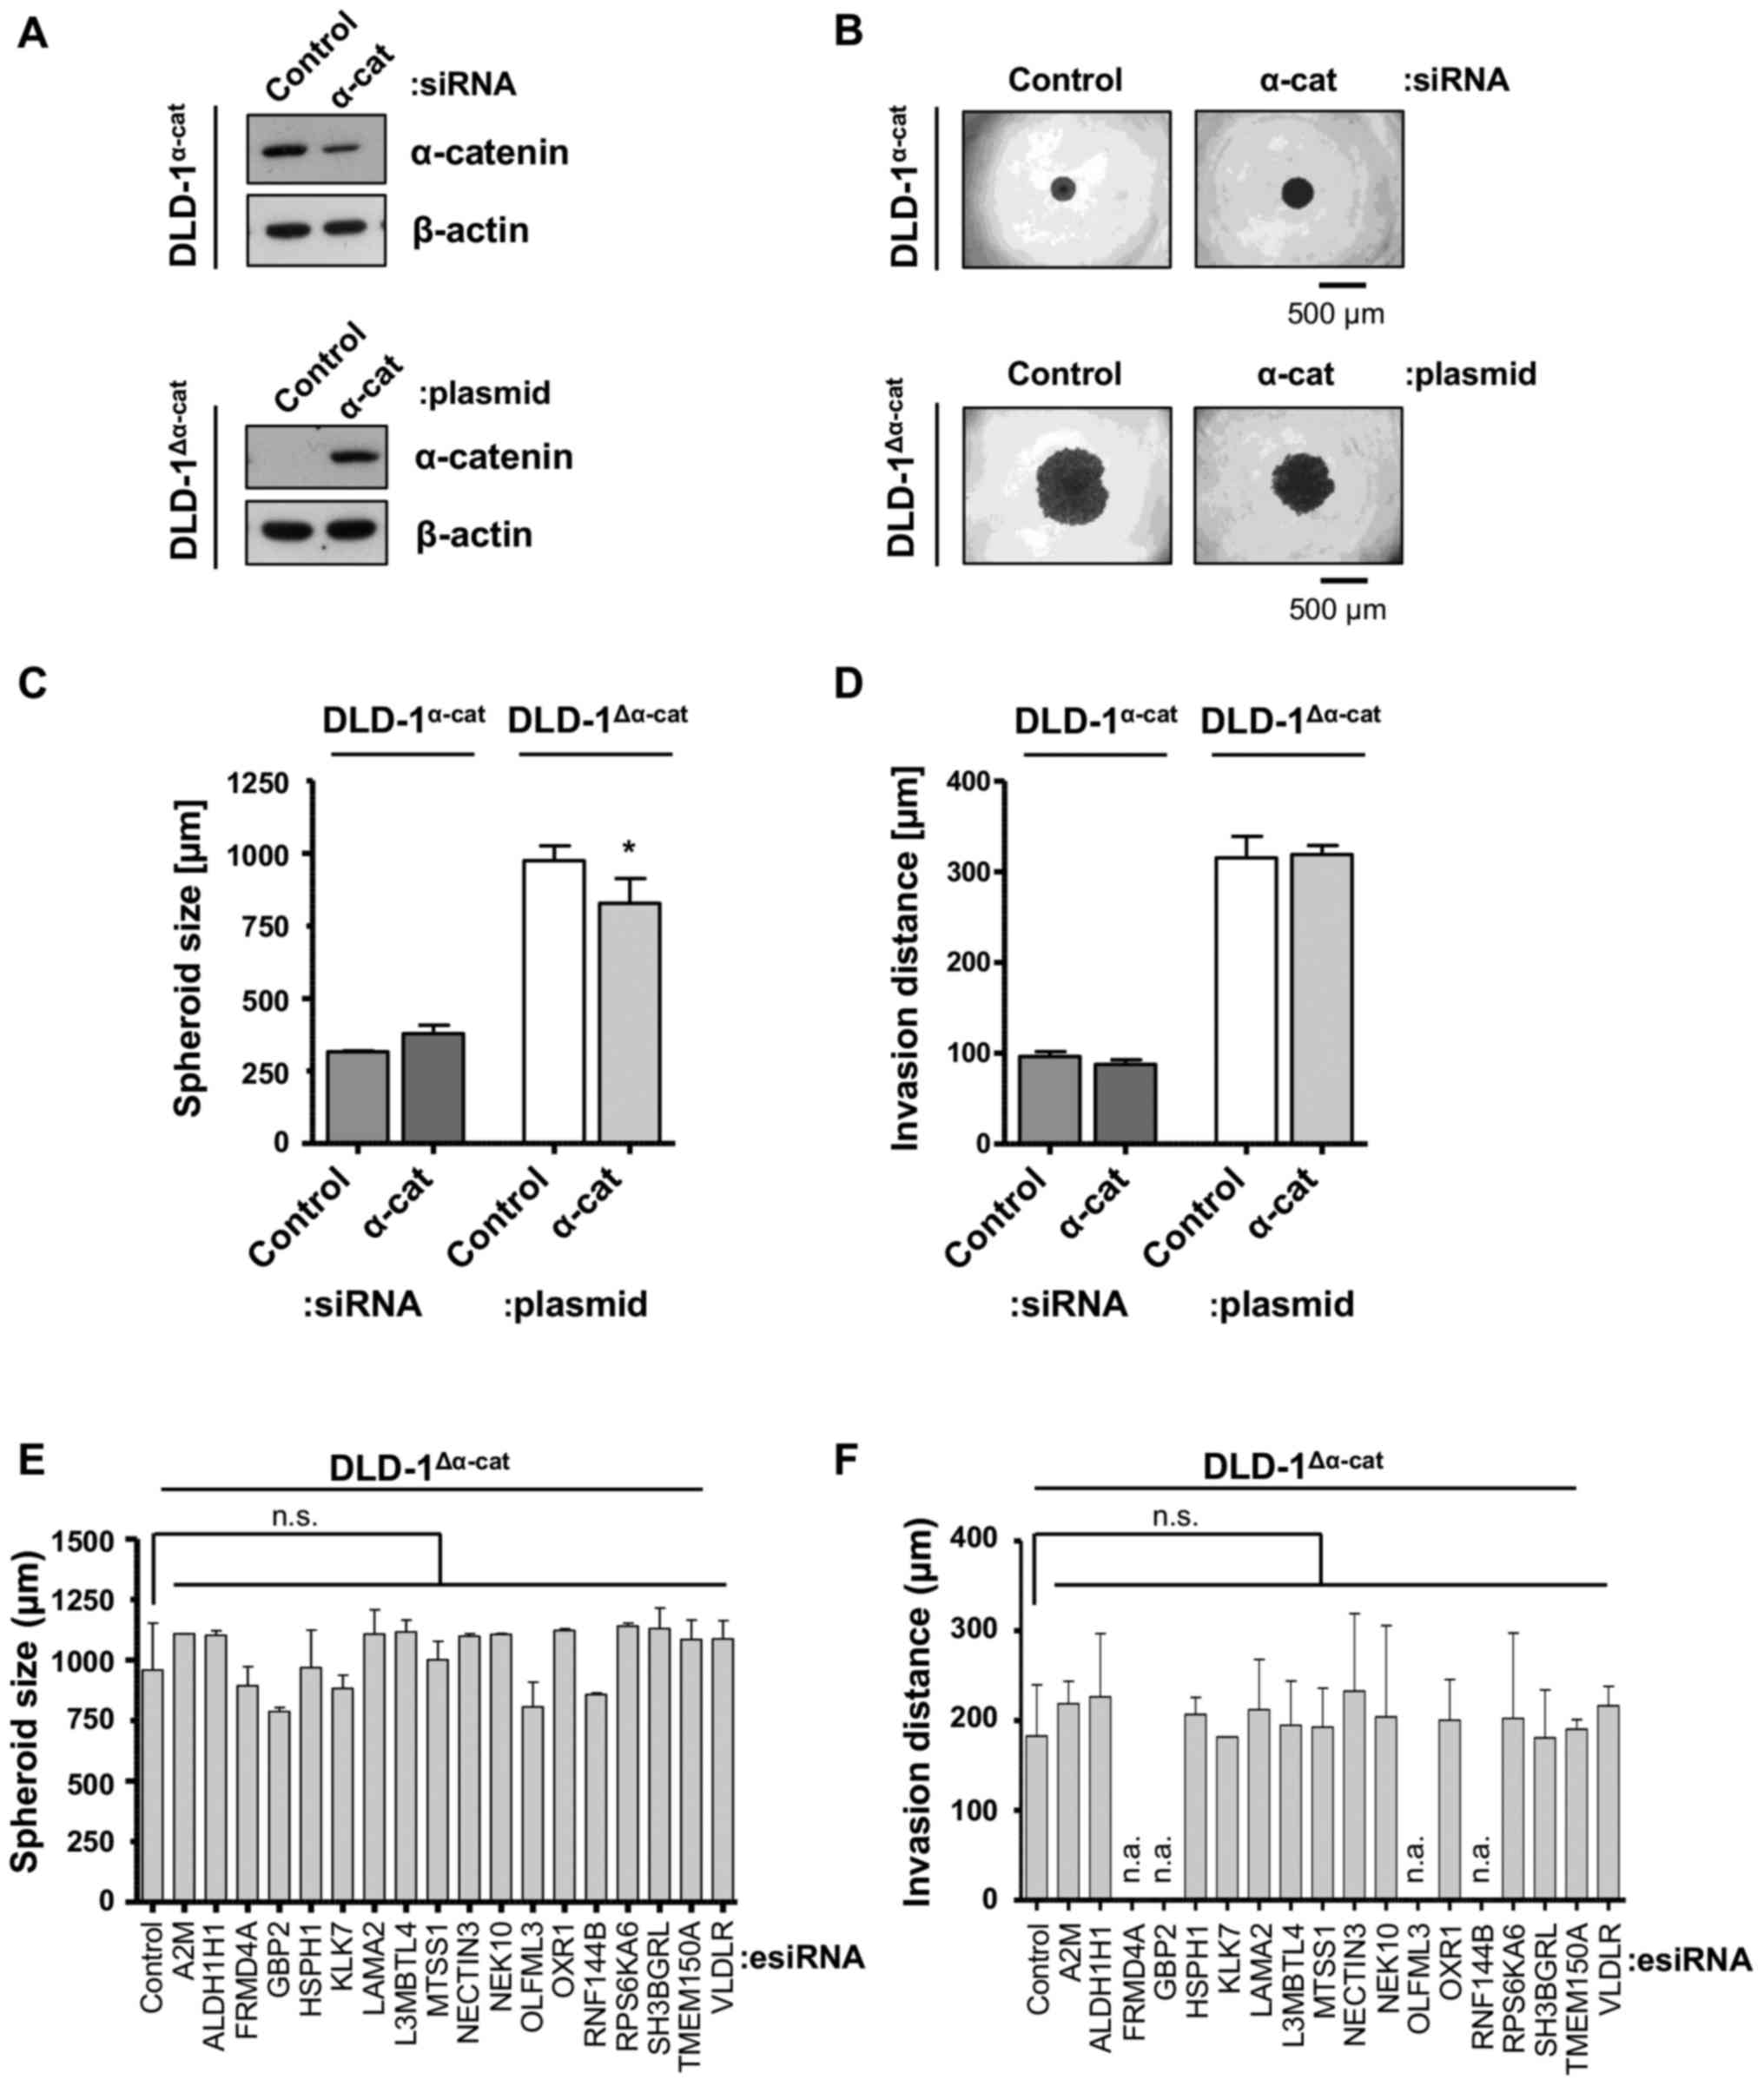
Unexpectedly, the knockdown or reconstitution of
α-catenin in the DLD-1α-cat or DLD-1Δα-cat
cells, respectively, only marginally affected the spheroid size,
but had no effect on invasion (Fig.
5A–D). Based on the identified transcriptomic alterations in
the DLD-1Δα-cat cells compared with the
DLD-1α-cat cells, we performed the knockdown of a subset
of elevated genes to discover essential drivers of the
DLD-1Δα-cat invasive phenotype. As CTNNA1 was the
only gene deleted in both alleles, the changes in the transcriptome
may at least be partially influenced by this genetic phenotype. Of
note, the targeting of these genes had no effect on either spheroid
formation (Fig. 5E) or on the
invasive capacity of the DLD-1Δα-cat cells (Fig. 5F). Thus, our data suggest no
critical impact of the overexpressed genes on
DLD-1Δα-cat cell invasion.
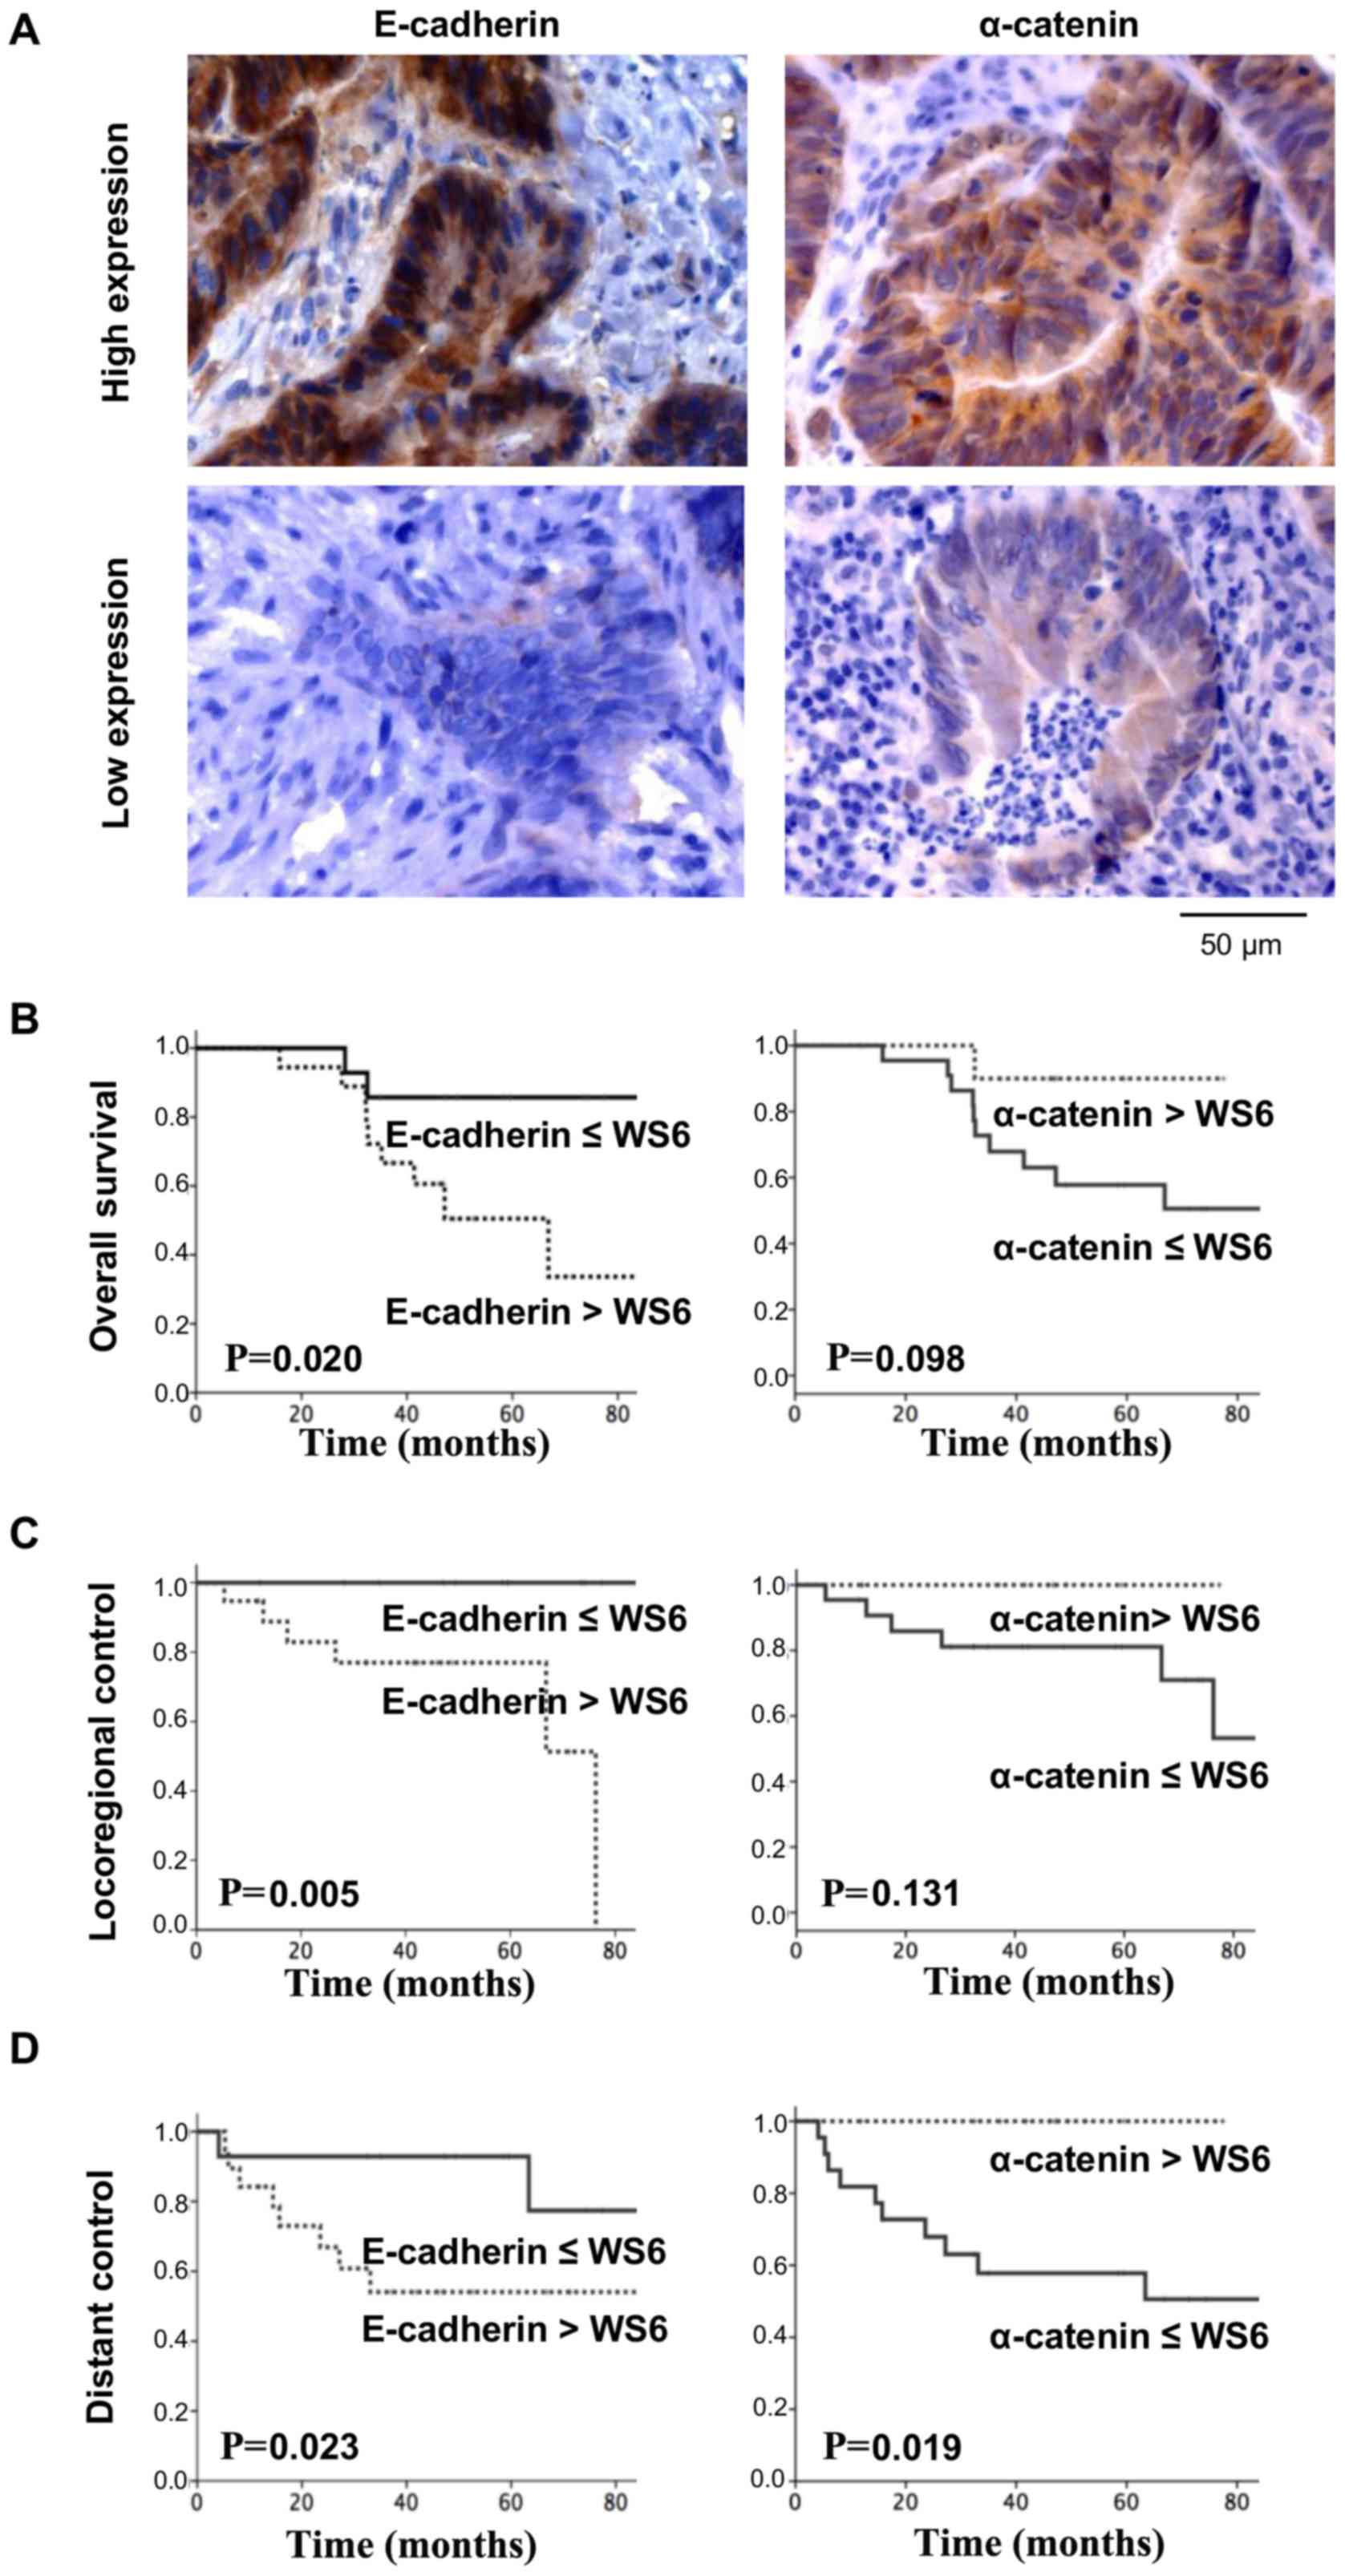
E-cadherin and α-catenin expression in
rectal carcinoma
Despite our observations, which lack a clear
connection between CRC cell behavior and therapy responsiveness, we
then stained rectal cancer biopsies for E-cadherin and α-catenin,
as neoadjuvant chemoradiotherapy comprises part of the standard
therapy for advanced stages of rectal cancer (Fig. 6A). Astonishingly, E-cadherin and
α-catenin inversely correlated with the clinical endpoints, overall
survival (Fig. 6B), locoregional
control (Fig. 6C) and distant
control (Fig. 6D). Assuming a
cooperative and tumor progression- and spreading-impairing function
of E-cadherin and α-catenin (8),
the association between low α-catenin expression and low survival
seems more logical. Thus, our data indicated that a low α-catenin
expression trended with a lower overall survival and lower
locoregional control, and significantly correlated with a lower
distant control. By contrast, high E-cadherin expression levels
significantly correlated with all three measured endpoints, i.e.,
overall survival, locoregional and distant control (Fig. 6B–D).
Discussion
Novel therapies for late-stage, metastatic CRC are
urgently required. As the mechanisms of the metastatic process
require further elucidation, we, as well as others have made use of
distinct subpopulations appearing in CRC cell lines when grown 2D
as well as in matrix (26,28,29).
Due to their depletions in cell-cell contact molecules, these cell
lines are valuable tools which may be used to investigate the
associated molecular mechanisms. In this study, we employed CRC
cell lines, including DLD-1, which present an α-catenin null
phenotype. In our study addressing the radiochemosensitivity of 3D
grown CRC cell populations and invasion, the following findings
were obtained: i) Differential, col-I-induced 3D growth phenotypes
in the CRC cell line panel; ii) a significant distinction in the
invasion, but not the adhesion, proliferation and
radiochemosensitivity of DLD-1α-cat compared to the
DLD-1Δα-cat cells; iii) an ineffectiveness to impair
col-I invasion by the targeting of genes highly overexpressed in
DLD-1Δα-cat cells; and iv) low levels of α-catenin
correlating with a worse prognosis following the chemoradiation of
patients suffering from rectal carcinomas.
Alterations of transmembrane and cytosolic compounds
critical for cell-cell contact assembly are frequent events in
cancer (32,33). Numerous studies have demonstrated
that cell-cell contact molecules, such as α-catenin and E-cadherin
are downregulated in CRC (34,35),
cervical carcinoma (36), oral
carcinoma (37), as well as other
types of cancer. Similar to other cancer types, ECM proteins, such
as laminin and col-I are overexpressed in CRC and often dominate a
later, more aggressive and metastatic stage of the disease
(17,38). Hence, cell-cell contact and ECM
composition are important characteristics of the inter- and
intra-tumor heterogeneity to consider for therapy optimization
(39,40).
For our efforts to better understand CRC biology
with particular emphasis on cell-cell-contact, we selected the
presented CRC cell line panel with, at least partially, known
morphological distinctions in 3D and known differences in the
expression of E-cadherin/catenin complex proteins (26,41–44).
Despite that fact that the DLD-1 and HCT-15 cells have been found
to have the same genetic background (45), we intentionally examined these two
cell lines for further proof in our study. As its original tumor,
we also found two phenotypically distinct subpopulations of DLD-1
cells (26,28–31),
which are epithelioid/cell cluster-forming/α-catenin-positive
(DLD-1α-cat) versus round/single cell
group-forming/α-catenin-negative (DLD-1Δα-cat). It
should be noted that EMT seemed not to occur according to our
expression analysis of key EMT markers, such as fibronectin and
TGF-β. Instead, the subcellular localization of E-cadherin changed
from a membrane-associated to a peri-nuclear-associated one in the
α-catenin deficient subpopulation, while the E-cadherin and
β-catenin protein levels were unaffected (29,46).
The loss of membranous E-cadherin and β-catenin is in agreement
with cell-cell adhesion dysfunction observed in
DLD-1Δα-cat cells and could explain, at least in part,
why the DLD-1Δα-cat cells present a round morphology and
grow as single cells in col-I. The underlying mechanisms may be
that α-catenin directly or indirectly anchors the
E-cadherin/catenin protein complex to and stabilizes actin
filaments as suggested by Abe and Takeichi (47). In addition to a cell-cell adhesion
dysfunction, this could explain, at least partly, why
DLD-1Δα-cat cells present a round morphology. For the
transcriptional co-activator β-catenin, we observed, in contrast to
previous studies (20,30), no nuclear localization of β-catenin
in either DLD-1 subpopulation. Causative may be our 3D matrix-based
cell system, which differs from the work of others.
To provide even more genetic and transcriptional
information, our genome and transcriptome analysis revealed several
differentially expressed genes in DLD-1Δα-cat versus the
DLD-1α-cat cells, including the β-catenin target genes,
S100A4, LGR5 and ABCB1 (48). Using bioinformatics analysis (such
as cytoscape), no α-catenin-dependent interactions between proteins
of the E-cadherin/β-catenin complex and the differentially
expressed genes were found (data not shown).
Based on these clear genetic and transcriptional
differences in the two DLD-1 cell populations, we tested for
various endpoints. 3D matrix-based cultures of the
DLD-1α-cat and DLD-1Δα-cat cells revealed
similarities in adhesion, the proliferation rate, basal clonogenic
survival and survival after single-dose X-ray irradiation or
treatment with the chemotherapeutic agent, 5-FU. These observations
are in contrast to reports showing the differential effects of
irradiation and 5-FU on DLD-1 subpopulations (28,49).
Responsible, again, seem to be the well-known discrepancies between
conventional 2D monolayer and more physiological 3D matrix-based
cell cultures (24,50,51).
With regards to clinical relevance, it is important to point out
that neither our, nor a previous study (28) analyzed the effects of dose
fractionation on the survival of these two subpopulations. Thus,
this gap needs to be closed in future experiments. Of note, and in
line with α-catenin silencing, the knockdown of E-cadherin failed
to modify radiation survival in several other tested cell lines
(A431, UT-SCC15, DLD-1, HCT-15 and HT-29) (52) (data not shown).
In addition to the above-mentioned endpoints, we
measured 3D invasion into col-I. In agreement with the role of
α-catenin in invasion (26), the
invasive capability of the DLD-1Δα-cat cells exceeded
the one of DLD-1α-cat cells by ~5-fold. Intriguing to us
was that we were unable to i) induce a clear switch in the
morphological and invasive phenotype of the DLD-1Δα-cat
cells by α-catenin reconstitution; and ii) link the overexpressed
genes detected in the DLD-1Δα-cat cells through their
knockdown functionally to morphology, spheroid formation and
invasion. Vice versa, also the knockdown of α-catenin in the
DLD-1α-cat cells failed to result in a clear switch to
the invasive phenotype as observed in DLD-1Δα-cat cells.
Causative may be the incomplete knockdown mediated by siRNA in
contrast to the complete genetic deletion in DLD-1Δα-cat
cells. Mechanistically, α-catenin dysfunction is likely to
represent only one of the multiple facets in the interplay between
cadherins, catenins and a plethora of cytoplasmic effectors like
tyrosine kinases, protein tyrosine phosphatases and cytoskeletal
regulators functioning in filament dynamics and cell polarity
(53–55).
Another data set that requires further investigation
came from our immunohistochemical analysis of α-catenin and
E-cadherin in patients with rectal cancer treated with neoadjuvant
radiochemotherapy. In agreement with a low overall survival and low
locoregional control, α-catenin expression was low and correlated
with these endpoints with a positive trend, while it significantly
correlated with a lower distant control. E-cadherin expression, by
contrast, was high and significantly correlated with these three
clinical endpoints in an inverse manner relative to α-catenin.
In conclusion, our data indicate that α-catenin is
partially involved in CRC cell invasion via yet to be determined
mechanisms. Although one might anticipate a multiplicity of effects
by adhesive dysfunctions, it is astonishing to detect that, if at
all, only very minor modifications can be found in biologically and
clinically relevant endpoints such as proliferation and therapy
sensitivity. Owing to fundamental processes orchestrated in both
cancer and normal cells through cell-cell adhesion, it remains
challenging to identify novel potential cancer targets in cell-cell
contacts. Further studies are warranted to better understand the
molecular circuitry how cadherins and catenins promote
tumorigenesis and resistance.
Acknowledgments
The authors are grateful to Dr J. Cinatl (University
of Frankfurt, Germany) for providing the SW620 and SW837 cells and
to Dr C. Gottardi (Northwestern University, Chicago, USA) for
providing the pcDNA3-α-cat plasmid. The authors would also like to
thank Mrs. I. Lange, Mrs. J. Singh-Müller and Mr. J. Oppermann for
their excellent technical assistance.
Notes
[1]
Funding
The study and authors were in part supported by the
EFRE Europäische Fonds für regionale Entwicklung, Europa fördert
Sachsen (100066308).
[2] Availability
of data and materials
The analyzed datasets generated during the study are
available from the corresponding author on reasonable request.
[3] Authors'
contributions
NC conceived and designed the study; SF performed
the cell culture experiments; SH performed the immunohistochemical
analysis on patient material; BO performed and analyzed the
genomics and transcriptomics experiments; FR supplied the patient
survival data; all authors wrote and edited and have approved the
manuscript.
[4] Ethics
approval and consent to participate
This study was approved by the Ethics Committee of
the University of Erlangen (approval no. 3085). Each patient
provided written informed consent before being accrued.
[5] Consent for
publication
Not applicable.
[6] Competing
interests
The authors declare that they have no competing
interests.
References
|
1
|
Kuipers EJ, Grady WM, Lieberman D,
Seufferlein T, Sung JJ, Boelens PG, van de Velde CJ and Watanabe T:
Colorectal cancer. Nat Rev Dis Primers. 1:150652015. View Article : Google Scholar : PubMed/NCBI
|
|
2
|
Stein A and Bokemeyer C: How to select the
optimal treatment for first line metastatic colorectal cancer.
World J Gastroenterol. 20:899–907. 2014. View Article : Google Scholar : PubMed/NCBI
|
|
3
|
Canel M, Serrels A, Frame MC and Brunton
VG: E-cadherin-integrin crosstalk in cancer invasion and
metastasis. J Cell Sci. 126:393–401. 2013. View Article : Google Scholar : PubMed/NCBI
|
|
4
|
van Roy F and Berx G: The cell-cell
adhesion molecule E-cadherin. Cell Mol Life Sci. 65:3756–3788.
2008. View Article : Google Scholar : PubMed/NCBI
|
|
5
|
Raftopoulos I, Davaris P, Karatzas G,
Karayannacos P and Kouraklis G: Level of alpha-catenin expression
in colorectal cancer correlates with invasiveness, metastatic
potential, and survival. J Surg Oncol. 68:92–99. 1998. View Article : Google Scholar : PubMed/NCBI
|
|
6
|
Filiz AI, Senol Z, Sucullu I, Kurt Y,
Demirbas S and Akin ML: The survival effect of E-cadherin and
catenins in colorectal carcinomas. Colorectal Dis. 12:1223–1230.
2010. View Article : Google Scholar
|
|
7
|
Chen X, Wang Y, Xia H, Wang Q, Jiang X,
Lin Z, Ma Y, Yang Y and Hu M: Loss of E-cadherin promotes the
growth, invasion and drug resistance of colorectal cancer cells and
is associated with liver metastasis. Mol Biol Rep. 39:6707–6714.
2012. View Article : Google Scholar : PubMed/NCBI
|
|
8
|
Christou N, Perraud A, Blondy S,
Jauberteau MO, Battu S and Mathonnet M: E-cadherin: A potential
biomarker of colorectal cancer prognosis. Oncol Lett. 13:4571–4576.
2017. View Article : Google Scholar : PubMed/NCBI
|
|
9
|
Kwok TT and Sutherland RM: The influence
of cell-cell contact on radiosensitivity of human squamous
carcinoma cells. Radiat Res. 126:52–57. 1991. View Article : Google Scholar : PubMed/NCBI
|
|
10
|
Moussa H, Mitchell SA, Grénman R and
Joiner MC: Cell-cell contact increases radioresistance in head and
neck carcinoma cell lines. Int J Radiat Biol. 76:1245–1253. 2000.
View Article : Google Scholar : PubMed/NCBI
|
|
11
|
Meineke V, Gilbertz KP, Schilperoort K,
Cordes N, Sendler A, Moede T and van Beuningen D: Ionizing
radiation modulates cell surface integrin expression and adhesion
of COLO-320 cells to collagen and fibronectin in vitro.
Strahlenther Onkol. 178:709–714. 2002. View Article : Google Scholar : PubMed/NCBI
|
|
12
|
Cordes N, Hansmeier B, Beinke C, Meineke V
and van Beuningen D: Irradiation differentially affects
substratum-dependent survival, adhesion, and invasion of
glioblastoma cell lines. Br J Cancer. 89:2122–2132. 2003.
View Article : Google Scholar : PubMed/NCBI
|
|
13
|
Ni J, Cozzi P, Hao J, Beretov J, Chang L,
Duan W, Shigdar S, Delprado W, Graham P, Bucci J, et al: Epithelial
cell adhesion molecule (EpCAM) is associated with prostate cancer
metastasis and chemo/radioresistance via the PI3K/Akt/mTOR
signaling pathway. Int J Biochem Cell Biol. 45:2736–2748. 2013.
View Article : Google Scholar : PubMed/NCBI
|
|
14
|
Yuan D, Chen L, Li M, Xia H, Zhang Y, Chen
T, Xia R, Tang Q, Gao F, Mo X, et al: Isolation and
characterization of circulating tumor cells from human gastric
cancer patients. J Cancer Res Clin Oncol. 141:647–660. 2015.
View Article : Google Scholar
|
|
15
|
Coulson-Thomas VJ, Coulson-Thomas YM,
Gesteira TF, de Paula CA, Mader AM, Waisberg J, Pinhal MA, Friedl
A, Toma L and Nader HB: Colorectal cancer desmoplastic reaction
up-regulates collagen synthesis and restricts cancer cell invasion.
Cell Tissue Res. 346:223–236. 2011. View Article : Google Scholar : PubMed/NCBI
|
|
16
|
Mylonas CC and Lazaris AC: Colorectal
cancer and basement membranes: Clinicopathological correlations.
Gastroenterol Res Pract. 2014:5801592014. View Article : Google Scholar
|
|
17
|
Vellinga TT, den Uil S, Rinkes IHB, Marvin
D, Ponsioen B, Alvarez-Varela A, Fatrai S, Scheele C, Zwijnenburg
DA, Snippert H, et al: Collagen-rich stroma in aggressive colon
tumors induces mesenchymal gene expression and tumor cell invasion.
Oncogene. 35:5263–5271. 2016. View Article : Google Scholar : PubMed/NCBI
|
|
18
|
Eke I, Koch U, Hehlgans S, Sandfort V,
Stanchi F, Zips D, Baumann M, Shevchenko A, Pilarsky C, Haase M, et
al: PINCH1 regulates Akt1 activation and enhances radioresistance
by inhibiting PP1alpha. J Clin Invest. 120:2516–2527. 2010.
View Article : Google Scholar : PubMed/NCBI
|
|
19
|
Poschau M, Dickreuter E, Singh-Müller J,
Zscheppang K, Eke I, Liersch T and Cordes N: EGFR and β1-integrin
targeting differentially affect colorectal carcinoma cell
radiosensitivity and invasion. Radiother Oncol. 116:510–516. 2015.
View Article : Google Scholar : PubMed/NCBI
|
|
20
|
Daugherty RL, Serebryannyy L, Yemelyanov
A, Flozak AS, Yu HJ, Kosak ST, deLanerolle P and Gottardi CJ:
α-Catenin is an inhibitor of transcription. Proc Natl Acad Sci USA.
111:5260–5265. 2014. View Article : Google Scholar
|
|
21
|
Zschenker O, Streichert T, Hehlgans S and
Cordes N: Genome-wide gene expression analysis in cancer cells
reveals 3D growth to affect ECM and processes associated with cell
adhesion but not DNA repair. PLoS One. 7:e342792012. View Article : Google Scholar : PubMed/NCBI
|
|
22
|
Rödel C, Liersch T, Hermann RM, Arnold D,
Reese T, Hipp M, Fürst A, Schwella N, Bieker M, Hellmich G, et al:
Multicenter phase II trial of chemoradiation with oxaliplatin for
rectal cancer. J Clin Oncol. 25:110–117. 2007. View Article : Google Scholar
|
|
23
|
Schlingemann J, Habtemichael N, Ittrich C,
Toedt G, Kramer H, Hambek M, Knecht R, Lichter P, Stauber R and
Hahn M: Patient-based cross-platform comparison of oligonucleotide
microarray expression profiles. Lab Invest. 85:1024–1039. 2005.
View Article : Google Scholar : PubMed/NCBI
|
|
24
|
Bissell MJ, Kenny PA and Radisky DC:
Microenvironmental regulators of tissue structure and function also
regulate tumor induction and progression: The role of extracellular
matrix and its degrading enzymes. Cold Spring Harb Symp Quant Biol.
70:343–356. 2005. View Article : Google Scholar
|
|
25
|
Kenny PA, Lee GY, Myers CA, Neve RM,
Semeiks JR, Spellman PT, Lorenz K, Lee EH, Barcellos-Hoff MH,
Petersen OW, et al: The morphologies of breast cancer cell lines in
three-dimensional assays correlate with their profiles of gene
expression. Mol Oncol. 1:84–96. 2007. View Article : Google Scholar
|
|
26
|
Vermeulen SJ, Bruyneel EA, Bracke ME, De
Bruyne GK, Vennekens KM, Vleminckx KL, Berx GJ, van Roy FM and
Mareel MM: Transition from the noninvasive to the invasive
phenotype and loss of alpha-catenin in human colon cancer cells.
Cancer Res. 55:4722–4728. 1995.PubMed/NCBI
|
|
27
|
Zeisberg M and Neilson EG: Biomarkers for
epithelial-mesenchymal transitions. J Clin Invest. 119:1429–1437.
2009. View Article : Google Scholar : PubMed/NCBI
|
|
28
|
Dexter DL, Spremulli EN, Fligiel Z,
Barbosa JA, Vogel R, VanVoorhees A and Calabresi P: Heterogeneity
of cancer cells from a single human colon carcinoma. Am J Med.
71:949–956. 1981. View Article : Google Scholar : PubMed/NCBI
|
|
29
|
Plumb CL, Adamcic U, Shahrzad S, Minhas K,
Adham SA and Coomber BL: Modulation of the tumor suppressor protein
alpha-catenin by ischemic microenvironment. Am J Pathol.
175:1662–1674. 2009. View Article : Google Scholar : PubMed/NCBI
|
|
30
|
Giannini AL, Vivanco M and Kypta RM:
alpha-catenin inhibits beta-catenin signaling by preventing
formation of a beta-catenin*T-cell factor*DNA complex. J Biol Chem.
275:21883–21888. 2000. View Article : Google Scholar : PubMed/NCBI
|
|
31
|
Takaya Y, Tanaka K, Hirakawa C, Tagawa Y
and Niwa M: New method for separation of subpopulations from a
heterogeneous colon cancer cell line. Anticancer Res. 28:3665–3670.
2008.
|
|
32
|
Huber O and Petersen I: 150th Anniversary
Series: Desmosomes and the hallmarks of cancer. Cell Commun Adhes.
22:15–28. 2015. View Article : Google Scholar : PubMed/NCBI
|
|
33
|
Rodriguez FJ, Lewis-Tuffin LJ and
Anastasiadis PZ: E-cadherin's dark side: Possible role in tumor
progression. Biochim Biophys Acta. 1826:23–31. 2012.PubMed/NCBI
|
|
34
|
Lee CC, Chen WS, Chen CC, Chen LL, Lin YS,
Fan CS and Huang TS: TCF12 protein functions as transcriptional
repressor of E-cadherin, and its overexpression is correlated with
metastasis of colorectal cancer. J Biol Chem. 287:2798–2809. 2012.
View Article : Google Scholar :
|
|
35
|
Chen X, Zhu H, Wu X, Xie X, Huang G, Xu X,
Li S and Xing C: Downregulated pseudogene CTNNAP1 promote tumor
growth in human cancer by downregulating its cognate gene CTNNA1
expression. Oncotarget. 7:55518–55528. 2016.PubMed/NCBI
|
|
36
|
Peng J, Qi S, Wang P, Li W, Song L, Liu C
and Li F: Meta-analysis of downregulated E-cadherin as a poor
prognostic biomarker for cervical cancer. Future Oncol. 12:715–726.
2016. View Article : Google Scholar
|
|
37
|
Rajwar YC, Jain N, Bhatia G, Sikka N, Garg
B and Walia E: Expression and significance of cadherins and its
subtypes in development and progression of oral cancers: A review.
J Clin Diagn Res. 9:ZE05–ZE07. 2015.PubMed/NCBI
|
|
38
|
Daneker GW Jr, Mercurio AM, Guerra L, Wolf
B, Salem RR, Bagli DJ and Steele GD Jr: Laminin expression in
colorectal carcinomas varying in degree of differentiation. Arch
Surg. 122:1470–1474. 1987. View Article : Google Scholar : PubMed/NCBI
|
|
39
|
Burrell RA, McGranahan N, Bartek J and
Swanton C: The causes and consequences of genetic heterogeneity in
cancer evolution. Nature. 501:338–345. 2013. View Article : Google Scholar : PubMed/NCBI
|
|
40
|
Fouad YA and Aanei C: Revisiting the
hallmarks of cancer. Am J Cancer Res. 7:1016–1036. 2017.PubMed/NCBI
|
|
41
|
Ireton RC, Davis MA, van Hengel J, Mariner
DJ, Barnes K, Thoreson MA, Anastasiadis PZ, Matrisian L, Bundy LM,
Sealy L, et al: A novel role for p120 catenin in E-cadherin
function. J Cell Biol. 159:465–476. 2002. View Article : Google Scholar : PubMed/NCBI
|
|
42
|
El-Bahrawy M, Poulsom R, Rowan AJ and
Tomlinson IT, Alison MR, Poulsom SR and Tomlinson IT:
Characterization of the E-cadherin/catenin complex in colorectal
carcinoma cell lines. Int J Exp Pathol. 85:65–74. 2004. View Article : Google Scholar : PubMed/NCBI
|
|
43
|
Luca AC, Mersch S, Deenen R, Schmidt S,
Messner I, Schäfer KL, Baldus SE, Huckenbeck W, Piekorz RP, Knoefel
WT, et al: Impact of the 3D microenvironment on phenotype, gene
expression, and EGFR inhibition of colorectal cancer cell lines.
PLoS One. 8:e596892013. View Article : Google Scholar : PubMed/NCBI
|
|
44
|
Ludwig K, Tse ES and Wang JY: Colon cancer
cells adopt an invasive phenotype without mesenchymal transition in
3-D but not 2-D culture upon combined stimulation with EGF and
crypt growth factors. BMC Cancer. 13:2212013. View Article : Google Scholar : PubMed/NCBI
|
|
45
|
Vermeulen SJ, Chen TR, Speleman F, Nollet
F, Van Roy FM and Mareel MM: Did the four human cancer cell lines
DLD-1, HCT-15, HCT-8, and HRT-18 originate from one and the same
patient. Cancer Genet Cytogenet. 107:76–79. 1998. View Article : Google Scholar : PubMed/NCBI
|
|
46
|
Piao H-L, Yuan Y, Wang M, Sun Y, Liang H
and Ma L: α-catenin acts as a tumour suppressor in
E-cadherin-negative basal-like breast cancer by inhibiting NF-κB
signalling. Nat Cell Biol. 16:245–254. 2014. View Article : Google Scholar : PubMed/NCBI
|
|
47
|
Abe K and Takeichi M: EPLIN mediates
linkage of the cadherin catenin complex to F-actin and stabilizes
the circumferential actin belt. Proc Natl Acad Sci USA. 105:13–19.
2008. View Article : Google Scholar
|
|
48
|
Herbst A, Jurinovic V, Krebs S, Thieme SE,
Blum H, Göke B and Kolligs FT: Comprehensive analysis of β-catenin
target genes in colorectal carcinoma cell lines with deregulated
Wnt/β-catenin signaling. BMC Genomics. 15:742014. View Article : Google Scholar
|
|
49
|
Leith JT, Dexter DL, DeWyngaert JK, Zeman
EM, Chu MY, Calabresi P and Glicksman AS: Differential responses to
X-irradiation of subpopulations of two heterogeneous human
carcinomas in vitro. Cancer Res. 42:2556–2561. 1982.PubMed/NCBI
|
|
50
|
Eke I and Cordes N: Radiobiology goes 3D:
How ECM and cell morphology impact on cell survival after
irradiation. Radiother Oncol. 99:271–278. 2011. View Article : Google Scholar : PubMed/NCBI
|
|
51
|
Eke I, Hehlgans S, Zong Y and Cordes N:
Comprehensive analysis of signal transduction in three-dimensional
ECM-based tumor cell cultures. J Biol Methods. 2:312015. View Article : Google Scholar
|
|
52
|
Mazzeo E, Hehlgans S, Valentini V, Baumann
M and Cordes N: The impact of cell-cell contact, E-cadherin and EGF
receptor on the cellular radiosensitivity of A431 cancer cells.
Radiat Res. 178:224–233. 2012. View Article : Google Scholar : PubMed/NCBI
|
|
53
|
Perez-Moreno M, Jamora C and Fuchs E:
Sticky business: Orchestrating cellular signals at adherens
junctions. Cell. 112:535–548. 2003. View Article : Google Scholar : PubMed/NCBI
|
|
54
|
Mège RM, Gavard J and Lambert M:
Regulation of cell-cell junctions by the cytoskeleton. Curr Opin
Cell Biol. 18:541–548. 2006. View Article : Google Scholar : PubMed/NCBI
|
|
55
|
Jeanes A, Gottardi CJ and Yap AS:
Cadherins and cancer: How does cadherin dysfunction promote tumor
progression. Oncogene. 27:6920–6929. 2008. View Article : Google Scholar : PubMed/NCBI
|