Introduction
Colorectal cancer (CRC) is one of the common types
of gastrointestinal cancer, with high mortality rates worldwide. It
is estimated that 1,361,000 new cases of CRC were diagnosed in 2012
worldwide, and 18.6% (253,000/1,361,000) of these were diagnosed in
China, where CRC has already become the third most common
malignancy (1). Metastases,
particularly liver metastases, are the main cause of mortality
(2,3). The screening of populations at
high-risk and the identification of new methods with which to
prevent metastasis are the most important aspects for improving the
patient survival rate.
The trefoil factors (TFFs) are small secretory
peptides with three loop structures that contain a highly conserved
motif of cysteine disulfide bonds that maintain the functional
stability of the protein (4–7).
Even though TFFs have been shown to protect the gastrointestinal
tract against mucosal damage (8,9),
there is evidence to indicate a pivotal role for TFFs in the
oncogenic transformation, growth and metastasis of human solid
tumors (10–12). The TFF family is composed of 3
proteins, TFF1 (pS2), TFF2 (SP) and TFF3 (ITF), and TFF1 is
predominantly expressed in the stomach and colon, while TFF3
expression is commonly observed in the intestines (13). In addition, a high expression level
of TFF1 has been observed in different tumor tissues (colonic,
pancreatic and ovarian) compared with their normal counterparts,
and it has also been shown to be associated with cell survival,
migration, invasive ness and tumor dissemination (14–16).
TFF3 has also been reported to function as an oncogene, promoting
cell proliferation and invasion, and increasing the oncogenicity of
cells from mammary, gastric and prostate carcinoma tissues
(17–19). TFF1 and TFF3 have already been used
as markers for the detection of metastatic breast cancer cells
(20,21) and have been used as prognostic
factors for gastric (22),
prostate (23) and rectal cancer
(24).
Primarily expressed in the colon, it should be of
interest to determine whether TFF1 and TFF3 may be used as
effective biomarkers for the prognosis of CRC. It would also be of
interest to determine whether a correlation exists between the
expression of these two genes and their promoter methylation, as
well as whether there is a pathway activated by TFF3 that leads to
CRC metastasis. To address these questions, in our previous study,
the expression of TFF1, TFF3 and Twist1 in different metastatic CRC
tissues was evaluated, and different colon cancer cell lines were
analyzed to determine the associations between TFF expression and
epithelial-mesenchymal transition (EMT), a process required for
tumor cell invasion and metastasis in a number of solid tumors.
During the EMT process, epithelial cells lose their apico-basal
polarity and adherent cell junctions to gain mesenchymal traits,
both in morphology and gene expression, becoming more motile and
invasive. EMT can be initiated via the expression of various
transcription factors, including Twist, Snail, Slug and zinc finger
E-box binding homeobox 1 (25-27).
In the present study, the mRNA expression levels and
promoter methylation of TFF1 and TFF3 in cancer and adjacent normal
tissues were investigated, and their associations with
clinicopathological factors and prognosis were determined. The
correlation between TFF promoter methylation and mRNA expression
was evaluated and discussed. Lastly, the association between TFF3
and EMT was examined by overexpressing or inhibiting TFF3
expression in vitro.
Materials and methods
CRC patients and samples
From January, 2011 to January, 2012, 115 patients
with CRC who underwent radical resection at the Department of
Gastrointestinal Surgery, Tumor Hospital of Xin Jiang Medical
University (Ürümqi, China), were enrolled in this study. This study
was approved by the Ethics Committee of the Tumor Hospital of Xin
Jiang Medical University (approval no. 20110110, 10 January, 2011)
and all procedures followed the principles of the Declaration of
Helsinki. All subjects provided written informed consent prior to
participation. None of the patients had received systemic
chemotherapy or radiotherapy prior to surgery. All adjuvant
treatments after surgery for all patients were identical. All CRC
tissues and their corresponding adjacent normal tissues were
collected during surgery, and immediately snap frozen in liquid
nitrogen. Follow-up visits were performed for survival analysis for
up to 75 months after surgery. All clinical features were obtained
from medical records.
All cell culture media were purchased from HyClone
(GE Healthcare Life Sciences). Three human colon cancer cell (CCC)
lines with different invasive potentials (HT29, SW620 and LoVo) and
an immortalized human epithelial cell line (HIEC) were donated by
the National Laboratory of Xi Jing Digestive Disease Hospital
(Fourth Military Medical University, Xi'an). All cell lines were
maintained in RPMI-1640 growth medium (Thermo Fisher Scientific,
Inc.) supplemented with 10% heat-inactivated fetal bovine serum, 1%
penicillin and 1% streptomycin (Thermo Fisher Scientific, Inc.).
The HIEC cells were also supplemented with human insulin (0.1
U/ml).
Total RNA preparation from tissue or
cells
Cancer tissues and normal matched normal tissues
(which were 15 cm away from the lesion margin) were obtained during
surgery, and stored at −80°C after being snap-frozen. Total RNA was
extracted from the tissues and cell lines using TRIzol®
reagent (Thermo Fisher Scientific, Inc.), following the
manufacturer's protocol. The concentration and purity of the total
RNA were determined by measuring the optical density at 260 and 280
nm. The mRNA extracted from 115 CRC tissue samples and 85 matched
normal tissues were included for further analyses.
Reverse transcription-quantitative
polymerase chain reaction (RT-qPCR)
A total of 1 µg total RNA from the tissue or
cell lines was used to synthesize cDNA with the help of the
PrimeScript RT reagent kit through reverse transcription.
Subsequently, qPCR was performed using Brilliant SYBR-Green QRT-PCR
Master Mix as part of a 2-Step kit (Agilent Technologies, Inc.)
with the following primers: TFF1 forward, 5′-AATAAGGGCTGCTGTTTCG-3′
and reverse, 5′-ACTCCTCTTCTGGAGGGAC-3′; TFF3 forward,
5′-CTGCTGCTTTGACTCCAGGAT-3′ and reverse,
5′-CAGCTGGAGGTGCCTCAGAA-3′; Twist1 forward, 5′-CATGTCCGCGTCCCAC
TAG-3′ and reverse, 5′-TGTCCATTTTCTCCTTCTCTGG-3′; E-cadherin
forward, 5′-GAGTGCCAACTGGACCATTCA GTA-3′ and reverse,
5′-AGTCACCCACCTCTAAGGCCATC-3′; Vimentin forward,
5′-CAGGCAAAGCAGGAGTCCAC-3′ and reverse,
5′-GCAGCTTCAACGGCAAAGTTC-3′; Snail forward,
5′-CGCGCTCTTTCCTCGTCA-3′ and reverse, 5′-TCCCAGATGAGCATTGGCAG-3;
and GAPDH forward, 5′-AGCCTTCTCCATGGTGGTGAA-3′ and reverse,
5′-ATCACCATCTTCCAGGAGCGA-3′. All reactions were performed in
triplicate in a 25 µl reaction volume. The PCR amplification
program consisted of 30 sec of an initial denaturation at 95°C,
followed by 40 cycles of PCR at 95°C, for 5 sec, and then 60°C for
30 sec. The comparative ΔΔCq method was used to determine the
relative levels of gene expression (28). Standard curves were drawn, and the
relative amount of target gene mRNA was normalized to that of
GAPDH. Specificity was verified via melting curve analysis. All
experiments were repeated in triplicate.
Sample processing and DNA extraction for
promoter methylation
A total of 21 CRC samples and 10 adjacent normal
samples were used to evaluate the methylation levels of TFF1 and
TFF3 promoter regions. Fresh tumor tissues were snap-frozen in
liquid nitrogen instantly after surgical resection and stored at
‒80°C. All tumor specimens were carefully micro dissected, ensuring
that the final tissue samples consisted of at least 85% tumorous
cells. Tissue processing and DNA extraction were performed using
the QIAamp DNA Mini kit (Qiagen GmbH), according to the
manufacturer's protocol.
In vitro transcription and T-cleavage
(RNase A digestion) assay
Genomic DNA was treated with bisulfite using an
EpiTect Bisulfite kit (Qiagen AB) and then amplified using PCR
Accessory Set (Sequenom). In vitro transcription and T
cleavage were performed with Shrimp alkaline phosphatase (Mass
CLEAVE kit, Sequenom) before the acquisition of a purified
resin-treated product.
Mass spectrometry
The entire RNase A and clean resin treated product
were automatically dispensed onto silicon matrix preloaded chips
(SpectroCHIP; Sequenom), and the mass spectra were obtained using a
Mass ARRAY Compact matrix assisted laser desorption ionization-time
of flight mass spectrometry (MALDI-TOF-MS) analyzer (Sequenom). The
mass spectrometry methylation ratios were generated using EpiTYPER
(ver. 4.0; Sequenom).
Western blot analysis
The colon cancer cell lines were harvested
separately in ice-cold PBS. Total protein was extracted employing
RIPA lysis and extraction buffer (Thermo Fisher Scientific) and
quantified by measuring the integrated optical density (IOD) using
the BCA Protein Assay kit (25 µl per lane), and separated by
15% SDS PAGE gel electrophoresis, and transferred onto PVDF
membranes. The membranes were subsequently blocked with 5% (w/v)
dried skimmed milk powder in Tris-buffered saline (blocking
solution) for 1 h at room temperature. Subsequently, the membranes
were probed with primary antibodies against TFF1 (1:500, ab92377)
TFF3 (1:300, ab108599) and Twist1 (1:500, ab50581), E cadherin
(1:500, ab40772), Vimentin (1:500, ab92547), Snail (1:500,
ab53519), β-actin (1:2,500, ab8226) (all from Abcam) in blocking
solution overnight at 4°C. Following a TBS-Tween wash, the
membranes were incubated with goat anti-rabbit secondary antibody
(HRP; 1:10,000, ab6721) or rabbit anti-goat secondary antibody
(HRP; 1:5,000, ab6741) (both from Abcam) in blocking solution for 1
h at room temperature. Immunoreactive proteins were detected using
enhanced chemiluminescence kit (Thermo Scientific Pierce ECL
Substrate). The intensity of the bands on western blot was
evaluated by Quantity One® 1-D analysis software
(version 4.62, Bio-Rad).
Plasmid construction and cell
transfection
The TFF3 expression plasmid was built by cloning
TFF3 cDNA into a pIRES2-enhanced green fluorescent protein vector
(no. 6029-1, Clontech). The transfection of TFF3 expression or
empty vector plasmids (pIRES2-EGFP) into the HT29 cells was
performed using Lipofectamine 3000 transfection reagent (Thermo
Fisher Scientific, Inc.), according to the manufacturer's protocol.
The cells were incubated at 37°C in 5% CO2 incubator for
48 h, and fluorescence photography following transfection was then
carried out to evaluate the efficiency of transfection.
Gene knockdown assay
The short hairpin RNA (shRNA) sequences against TFF3
and control shRNA were purchased from Thermo Fisher Scientific,
Inc. LoVo cells were transfected with 30 nM shRNAs using
Lipofectamine 3000 transfection reagent (Thermo Fisher Scientific,
Inc.), according to the manufacturer's protocol. Following
incubation at 37°C with 5% CO2 for 48 h, the knockdown
of TFF3 was confirmed by both RT-qPCR and western blot
analysis.
Cell proliferation assay
Cell proliferation rates were measured by CCK 8 cell
proliferation assay. The prepared cell suspension (100
µl/well) in a 96-well plate was pre-incubated at 37°C in 5%
CO2 and 10 µl of the CCK 8 (Alpha CP8 Cell Proliferation
Assay kit, no. A32001-500T, Alpha Applied Bioscience) solution were
added to each well, and incubation was maintained in an incubator
for 1-4 h before measuring the absorbance at 450 nm using a
microplate reader (Varioskan LUX, Thermo Fisher Scientific).
Cell migration and invasion assays
Scratch wound healing and Transwell assays were
performed to evaluate cell migration and invasion. CCCs were grown
to 90% confluence before an ~0.6 mm wide wound was created with the
help of an insert. The wounds were subsequently imaged at 0, 24 and
48 h to assess the level of motility. The cell migratory ability
was quantified by calculating the area between the two leading
edges of cells using ImageJ software (version 1.52e, Broken
Symmetry Software).
For the Transwell assays, 24-well Transwell units
with 8 µm pore-size filters (Corning, Inc.) were precoated
with 40 µl Matrigel (for invasion assay) or without Matrigel
(for migration assay). A total of 200 µl of a cell
suspension containing 5×10⁴ cells/ml in serum free
medium were inserted into the upper chamber. In the lower chamber,
300 µl Dulbecco's modified Eagle's medium containing 20%
fetal calf serum were added. Following a 24-h incubation at 37°C
with 5% CO2, the cells in the upper chamber were removed
with a cotton swab and the traversed cells in the lower chamber
were fixed with 4% paraformaldehyde, stained with 0.5% crystal
violet (no. 32675, Sigma Aldrich) at room temperature for 10 min
and counted in 5 randomly chosen fields under a light microscope
(SFC-100 Series, Motic Europe).
Ultrastructure observation by
transmission electron microscopy (TEM)
The cells were collected and fixed using 2.5%
TEM-specific glutaric dialdehyde solution at 48 h following
transfection. The cells were then centrifugated at a speed of 2,504
× g at room temperature and fixed in 1% osmium tetroxide at 4°C for
15-30 min before dehydrating in acetone solutions of 50, 70, 90 and
100%. The cells were subsequently embedded in epoxy resin
(EPON812), sliced into 50-70 nm ultrathin sections after being
fixed on metal mesh and stained with sodium acetate at room
temperature for 5 30 min, and observed under a transmission
electron microscope (JEM ARM200F NEOARM). Moreover, cell morphology
was photographed under an optical microscope (SFC 100 Series, Motic
Europe) to observe the changes in cell morphology following the
overexpression or silencing of TFF3.
Statistical analysis
The continuous data are presented as the means ±
standard deviation, and compared using a unpaired Student's t-test
(as comparison of mRNA levels of TFF3 or TFF1) or Mann Whitney U
test (due to the unpaired, non-normal distribution of methylation
level of TFF3 or TFF1). One way analysis of variance (ANOVA) with
an LSD post hoc test was used to compare the group data. The
clinicopathological features were analyzed between the high TFF3
and low TFF3 expression groups using a Pearson χ2 test
or χ2 test with Yates' correction. Pearson's correlation
analysis was performed to evaluate the correlation between relevant
factors. The cumulative survival rates were determined using the
Kaplan Meier method and compared with the log rank test. The Cox
proportional hazards test was used for univariate and multivariate
survival analysis. All statistical analyses were performed using
GraphPad Prism 5 software (GraphPad Software, Inc.) or SPSS 18.0
(SPSS, Inc.). P<0.05 was considered to indicate a statistically
significant difference.
Results
mRNA expression of TFF1 and TFF3 and
correlation with clinicopathological factors
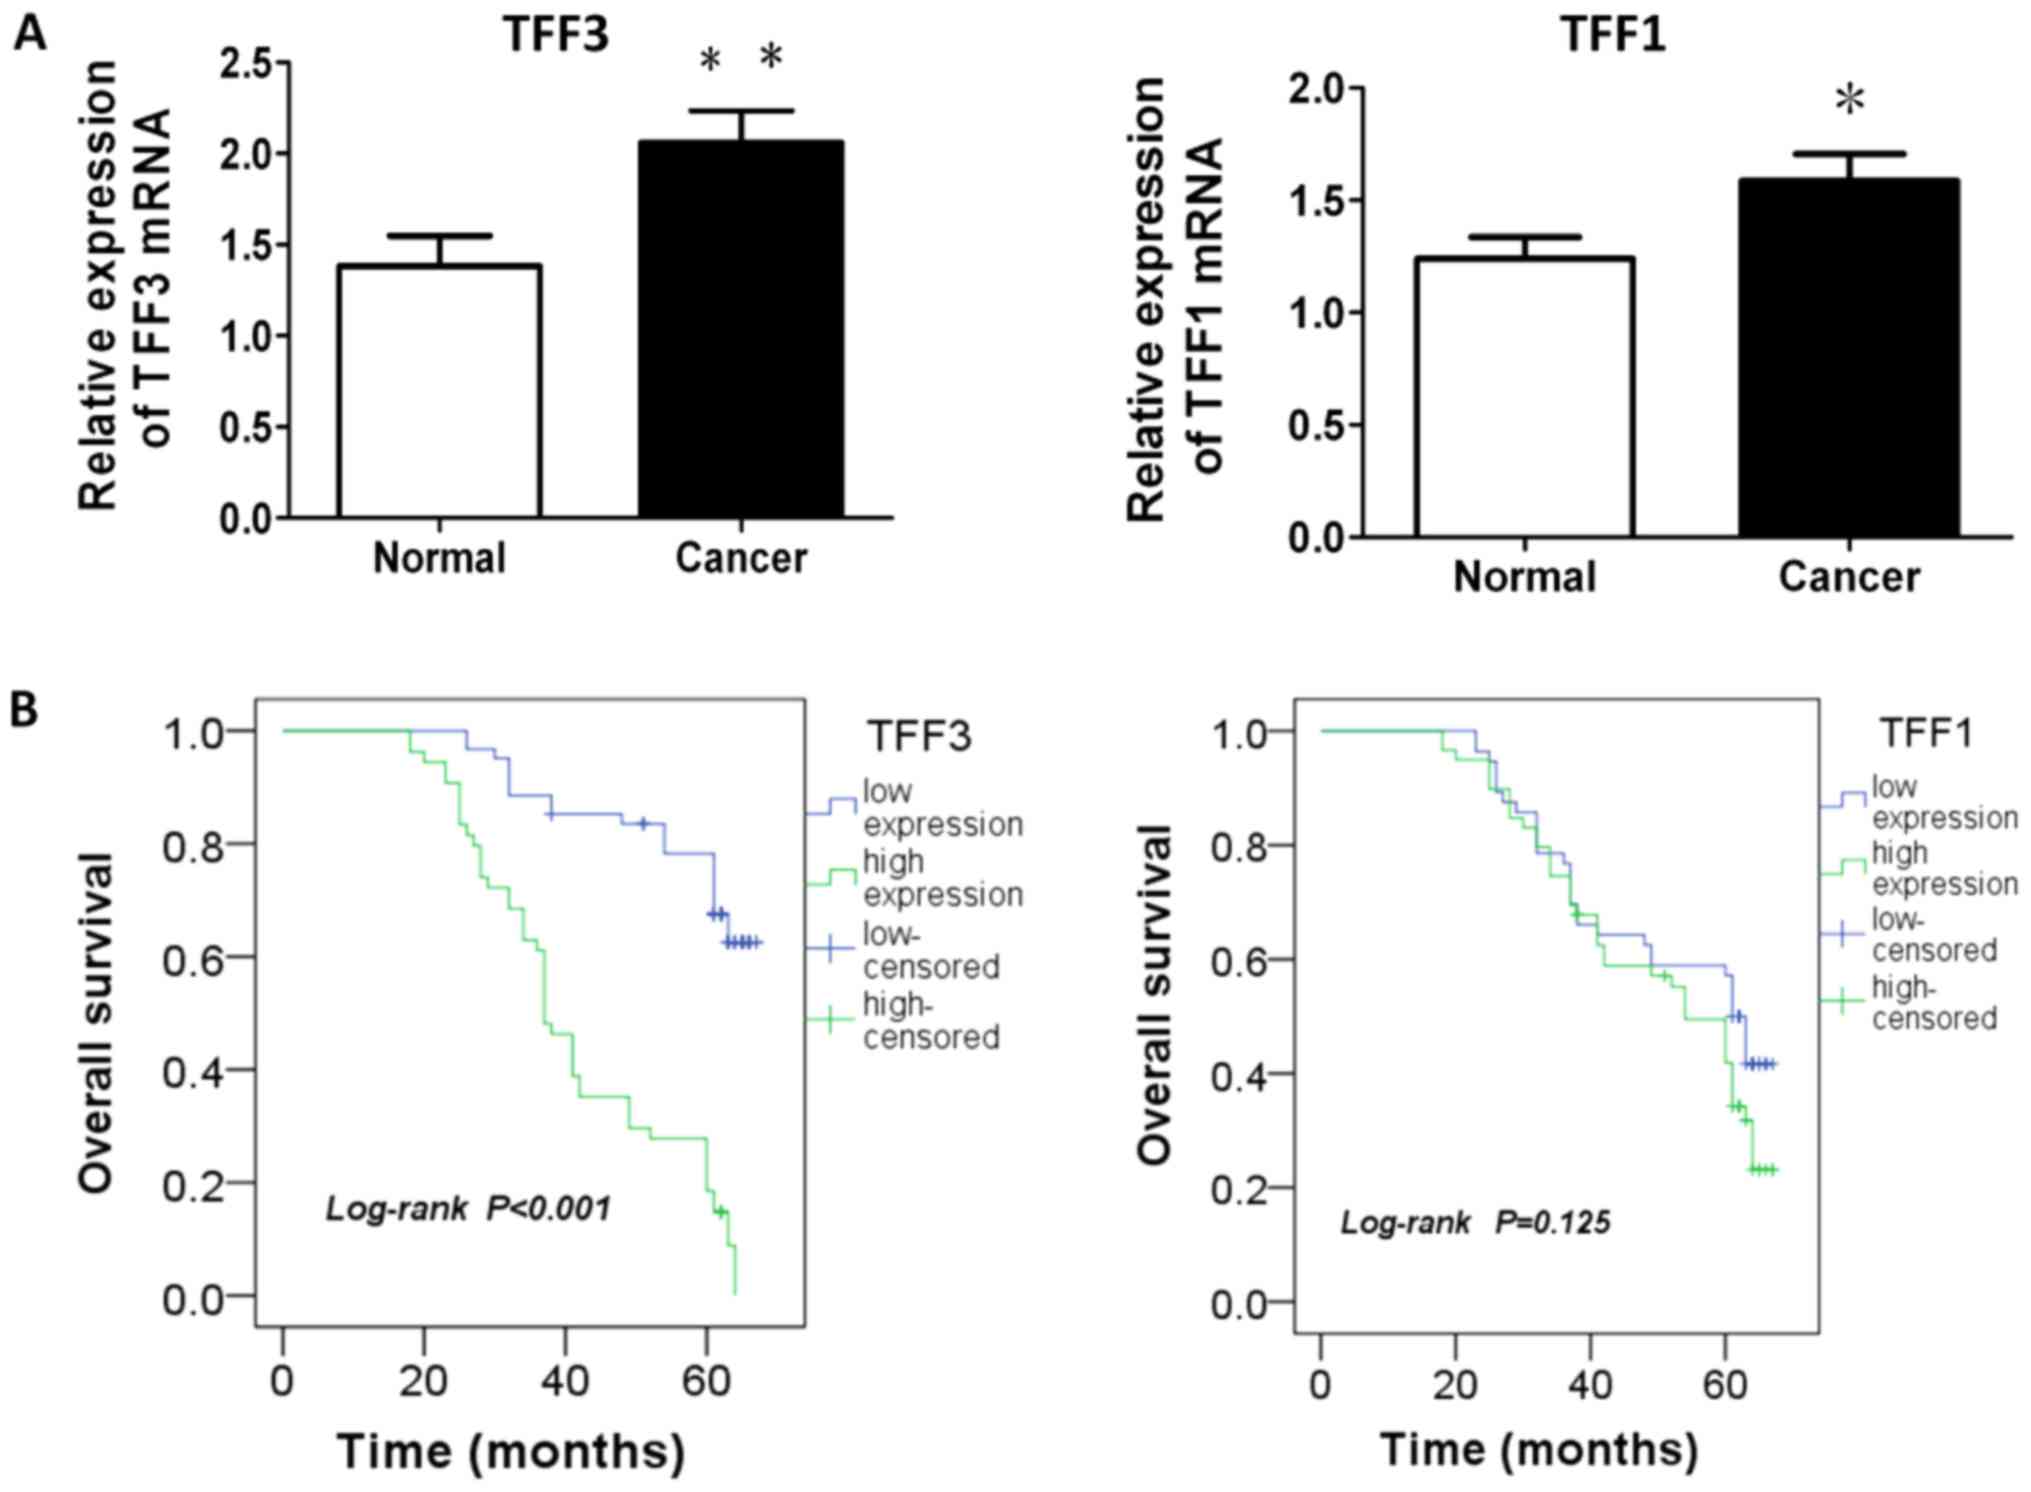
The results from the analysis of the mRNA expression
of TFF1 or TFF3 in the CRC tissues and matched adjacent normal
tissues are presented in Table I
and Fig. 1A. The average mRNA
levels of TFF1 or TFF3 in the cancer tissue were significantly
higher than those in the matched adjacent normal tissue (P=0.034
and P=0.007, respectively). The analysis of correlation between the
mRNA expression of TFF1 and TFF3 indicated the existence of a
positive association between TFF1 and TFF3 mRNA expression in
patients with CRC (r=0.219, P=0.019; Table II).
 | Table IComparison of TFF1 and TFF3 mRNA in
normal and cancer tissue. |
Table I
Comparison of TFF1 and TFF3 mRNA in
normal and cancer tissue.
| Gene | Relative expression
of mRNA
(means ± SD)
| P-value |
|---|
| Normal (n=85) | Cancer (n=115) |
|---|
| TFF1 | 1.228±0.097 | 1.635±0.117 | 0.034 |
| TFF3 | 1.383±0.166 | 2.060±0.175 | 0.007 |
| Table IICorrelation between mRNA expression
of TFF1 and TFF3 in patients with CRC. |
Table II
Correlation between mRNA expression
of TFF1 and TFF3 in patients with CRC.
| Gene | TFF1 | r | P-value |
|---|
| Low n | High n |
|---|
| TFF3 | | | | |
| Low | 36 | 25 | 0.219 | 0.019a |
| High | 20 | 34 | | |
The association between the expression of two TFF
genes and the clinicopathological characteristics of the patients
with CRC was further analyzed. The higher expression of TFF3 was
significantly associated with histological type, invasion depth
(T), lymph node number (N), metastasis at diagnosis (M), overall
TNM staging and recurrence or metastasis following treatment. Only
the circumferential resection margin (CRM), metastasis at diagnosis
and TNM staging were associated with a higher expression of TFF1
(Table III).
| Table IIIAssociation between TFF1 or TFF3 mRNA
expression and patient clinicopathological factors. |
Table III
Association between TFF1 or TFF3 mRNA
expression and patient clinicopathological factors.
| Clinicopathological
factors (n=115) | TFF1 | P value | TFF3 | P value |
|---|
| Low n | High n | Low n | High n |
|---|
| Age (years) | | | 0.710 | | | 0.266 |
| ≤60 | 26 | 25 | | 24 | 27 | |
| >60 | 30 | 34 | | 37 | 27 | |
| Sex | | | 0.519 | | | 0.560 |
| Male | 33 | 34 | | 34 | 33 | |
| Female | 23 | 25 | | 27 | 21 | |
| Race | | | 0.874 | | | 0.668 |
| Han | 42 | 45 | | 45 | 42 | |
| Uyghur | 14 | 14 | | 16 | 12 | |
| Blood type | | | 0.869 | | | 0.135 |
| A | 15 | 18 | | 17 | 16 | |
| B | 22 | 25 | | 30 | 17 | |
| AB | 3 | 2 | | 3 | 2 | |
| O | 16 | 14 | | 11 | 19 | |
| Histological
type | | | 0.348 | | | 0.006a |
|
Adenocarcinoma | 47 | 53 | | 58 | 42 | |
| Mucinous or signet
ring cell | 9 | 6 | | 3 | 12 | |
|
Differentiation | | | 0.111 | | | 0.167 |
| Well | 13 | 20 | | 15 | 18 | |
| Moderate | 29 | 32 | | 35 | 26 | |
| Poor | 9 | 2 | | 8 | 3 | |
| None | 5 | 5 | | 3 | 7 | |
| Location | | | 0.549 | | | 0.335 |
| Colon | 22 | 20 | | 25 | 17 | |
| Rectum | 34 | 39 | | 36 | 37 | |
| Tumor size | | | 0.140 | | | 0.565 |
| ≤5 cm | 37 | 31 | | 36 | 32 | |
| >5 cm | 19 | 28 | | 25 | 22 | |
| Gross type | | | 0.414 | | | 0.670 |
| Massive | 24 | 22 | | 24 | 22 | |
| Ulcerous | 29 | 36 | | 34 | 31 | |
| Infiltrative | 3 | 1 | | 3 | 1 | |
| CRM | | | 0.044a | | | 0.084 |
| Negative | 53 | 48 | | 57 | 44 | |
| Positive | 3 | 11 | | 4 | 10 | |
| Vascular
invasion | | | 0.178 | | | 0.075 |
| Negative | 49 | 46 | | 54 | 41 | |
| Positive | 7 | 13 | | 7 | 13 | |
| Perineural
invasion | | | 0.095 | | | 0.436 |
| Negative | 54 | 51 | | 3 | 3 | |
| Positive | 2 | 8 | | 26 | 30 | |
| Invasion depth | | | 0.428 | | | 0.001a |
| T1+2 | 11 | 10 | | 13 | 8 | |
| T3 | 26 | 22 | | 16 | 32 | |
| T4 | 19 | 27 | | 32 | 14 | |
| Lymph node
number | | | 0.783 | | | 0.001a |
| None | 11 | 9 | | 15 | 5 | |
| <4 | 24 | 25 | | 31 | 18 | |
| ≥4 | 21 | 25 | | 15 | 31 | |
| Metastasis at
diagnosis | | | 0.001a | | | 0.027a |
| No | 51 | 37 | | 52 | 36 | |
| Yes | 5 | 22 | | 9 | 18 | |
| TNM staging | | | 0.020a | | | 0.017a |
| I+II | 11 | 9 | | 15 | 5 | |
| III | 40 | 28 | | 37 | 31 | |
| IV | 5 | 22 | | 9 | 18 | |
| Recurrence or
metastasis after surgery | | | 0.192 | | | 0.001a |
| No | 33 | 27 | | 47 | 13 | |
| Yes | 23 | 32 | | 14 | 41 | |
TFF3 expression is visibly increased in
CRC tissue and is associated with a poor prognosis
The 115 patients with CRC were divided into the high
or low expression group according to the X-tile algorithm (29), which generated optimal cut off
values for the TFF3 and TFF1 mRNA levels in the CRC samples. The 1,
3 and 5 year survival rates of the patients in the high TFF3
expression group were 91, 55.9 and 21.1%, respectively, and in the
low TFF3 in the low TFF3 group, they were 100, 85.2 and 53.9%,
respectively (data not shown). Survival analysis revealed that a
higher expression of TFF3 was associated with a worse overall
survival, while TFF1 expression demonstrated no association with
patient survival (P<0.001 and P=0.125, respectively; Fig. 1B). Furthermore, predictive factors
of patient survival were calculated using a Cox proportional-hazard
model. CRM, vascular invasion, lymph node number (N), metastasis at
diagnosis (M), TNM staging, recurrence or metastasis following
treatment and TFF3 were associated with patient survival by
univariate analysis, while invasion depth (T), metastasis at
diagnosis (M), TNM staging, recurrence or metastasis following
treatment, tumor size and TFF3 were found to be the predictive
factors of patient survival by multivariate analysis (Table IV).
| Table IVSignificant predictive factors
(univariate and multivariate) for overall survival in Cox
proportional-hazard analysis. |
Table IV
Significant predictive factors
(univariate and multivariate) for overall survival in Cox
proportional-hazard analysis.
| Prognostic
factor | Univariate HR (95%
CI) | P value | Multivariate HR
(95% CI) | P value |
|---|
| Age | 0.723
(0.454-1.151) | 0.171 | 1.436
(0.600-3.435) | 0.416 |
| Sex | 1.147
(0.715-1.838) | 0.570 | 1.414
(0.566-3.535) | 0.458 |
| Race | 1.182
(0.704-1.984) | 0.527 | 1.580
(0.624-4.000) | 0.334 |
| Blood type | 0.910
(0.686-1.208) | 0.514 | 1.518 (0.887
2.597) | 0.128 |
| Location | 0.782
(0.473-1.292) | 0.338 | 0.730
(0.297-1.793) | 0.493 |
| Histological
type | 0.974
(0.484-1.960) | 0.942 | 0.380 (0.080
1.809) | 0.224 |
|
Differentiation | 0.753
(0.561-1.010) | 0.059 | 0.717
(0.415-1.239) | 0.234 |
| Gross type | 1.080
(0.718-1.626) | 0.712 | 1.327
(0.590-2.980) | 0.494 |
| CRM | 2.259
(1.198-4.260) | 0.012a | 2.997
(0.412-21.822) | 0.278 |
| Perineural
invasion | 1.869
(0.891-3.918) | 0.098 | 0.196
(0.023-1.690) | 0.138 |
| Vascular
invasion | 2.269
(1.323-3.890) | 0.003a | 1.210
(0.317-4.612) | 0.780 |
| T | 0.987
(0.722-1.350) | 0.936 | 3.100
(1.159-8.292) | 0.024a |
| N | 1.476
(1.080-2.019) | 0.015a | 1.125
(0.480-2.639) | 0.786 |
| M | 2.103
(1.264-3.496) | 0.004a | 0.048
(0.004-0.635) | 0.021a |
| Staging | 1.979
(1.380-2.840) | 0.001a | 8.141
(1.076-61.563) | 0.042a |
| Recurrence or
metastasis | 6.844
(4.018-11.656) | 0.001a | 12.048
(3.310-3.852) | 0.001a |
| TFF1 | 1.427
(0.894-2.277) | 0.137 | 1.311
(0.392-4.381) | 0.660 |
| TFF3 | 5.645
(3.342-9.533) | 0.000a | 3.432
(1.056-11.155) | 0.040a |
| Tumor size | 0.975
(0.611-1.557) | 0.917 | 0.321
(0.107-0.964) | 0.043a |
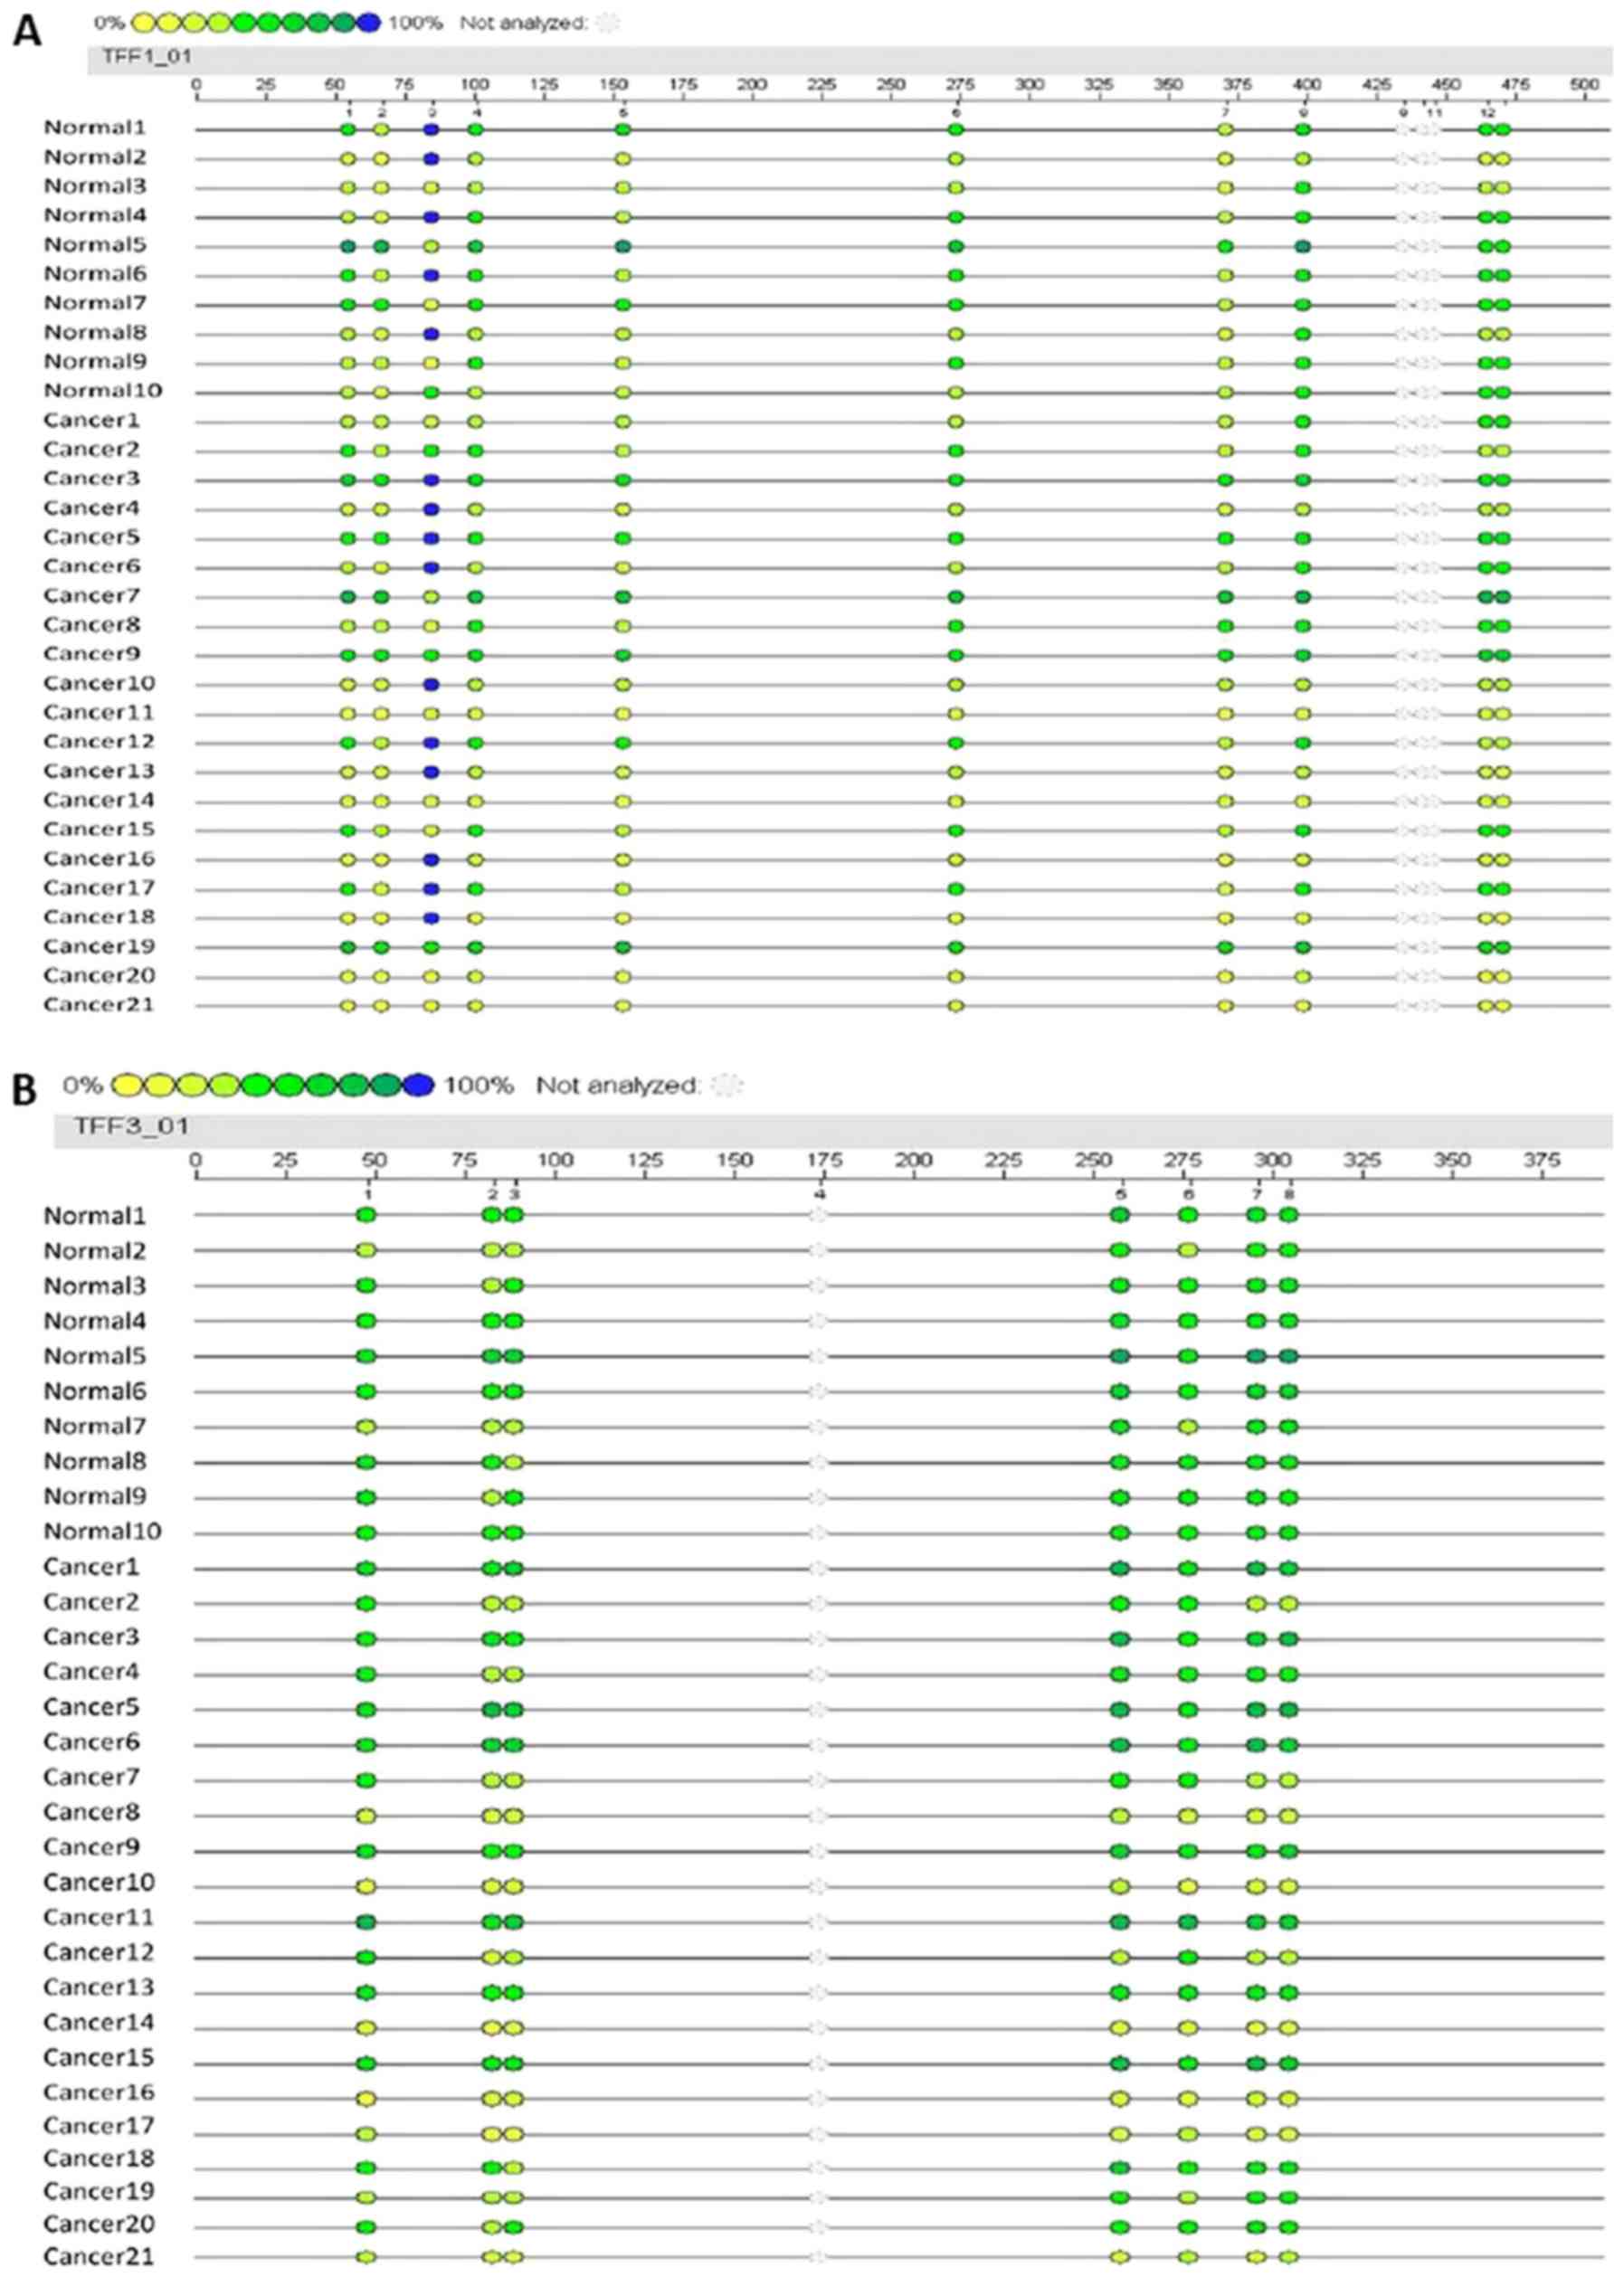
Promoter methylation level of TFF1 and
TFF3 and respective gene expression
To evaluate the potential association between the
level of promoter methylation and respective gene expression, the
promoter methylation patterns of TFF1 and TFF3 in 21 CRC samples
and 10 adjacent normal samples were evaluated using MALDI-TOF-MS. A
total of 527 CpG sites were observed and 465 sites (88.2%) were
analyzed. A total of 10 promoter region units of TFF1 and 7 units
of TFF3 were successfully detected (Fig. 2). The average methylation levels of
the TFF1 or TFF3 promoter region in the CRC group were observed to
be lower than those in normal group, although these differences
were not statistically significantly (P=0.374 and P=0.145,
respectively; Table VII). The
methylation levels of each promoter unit of TFF1 or TFF3 did not
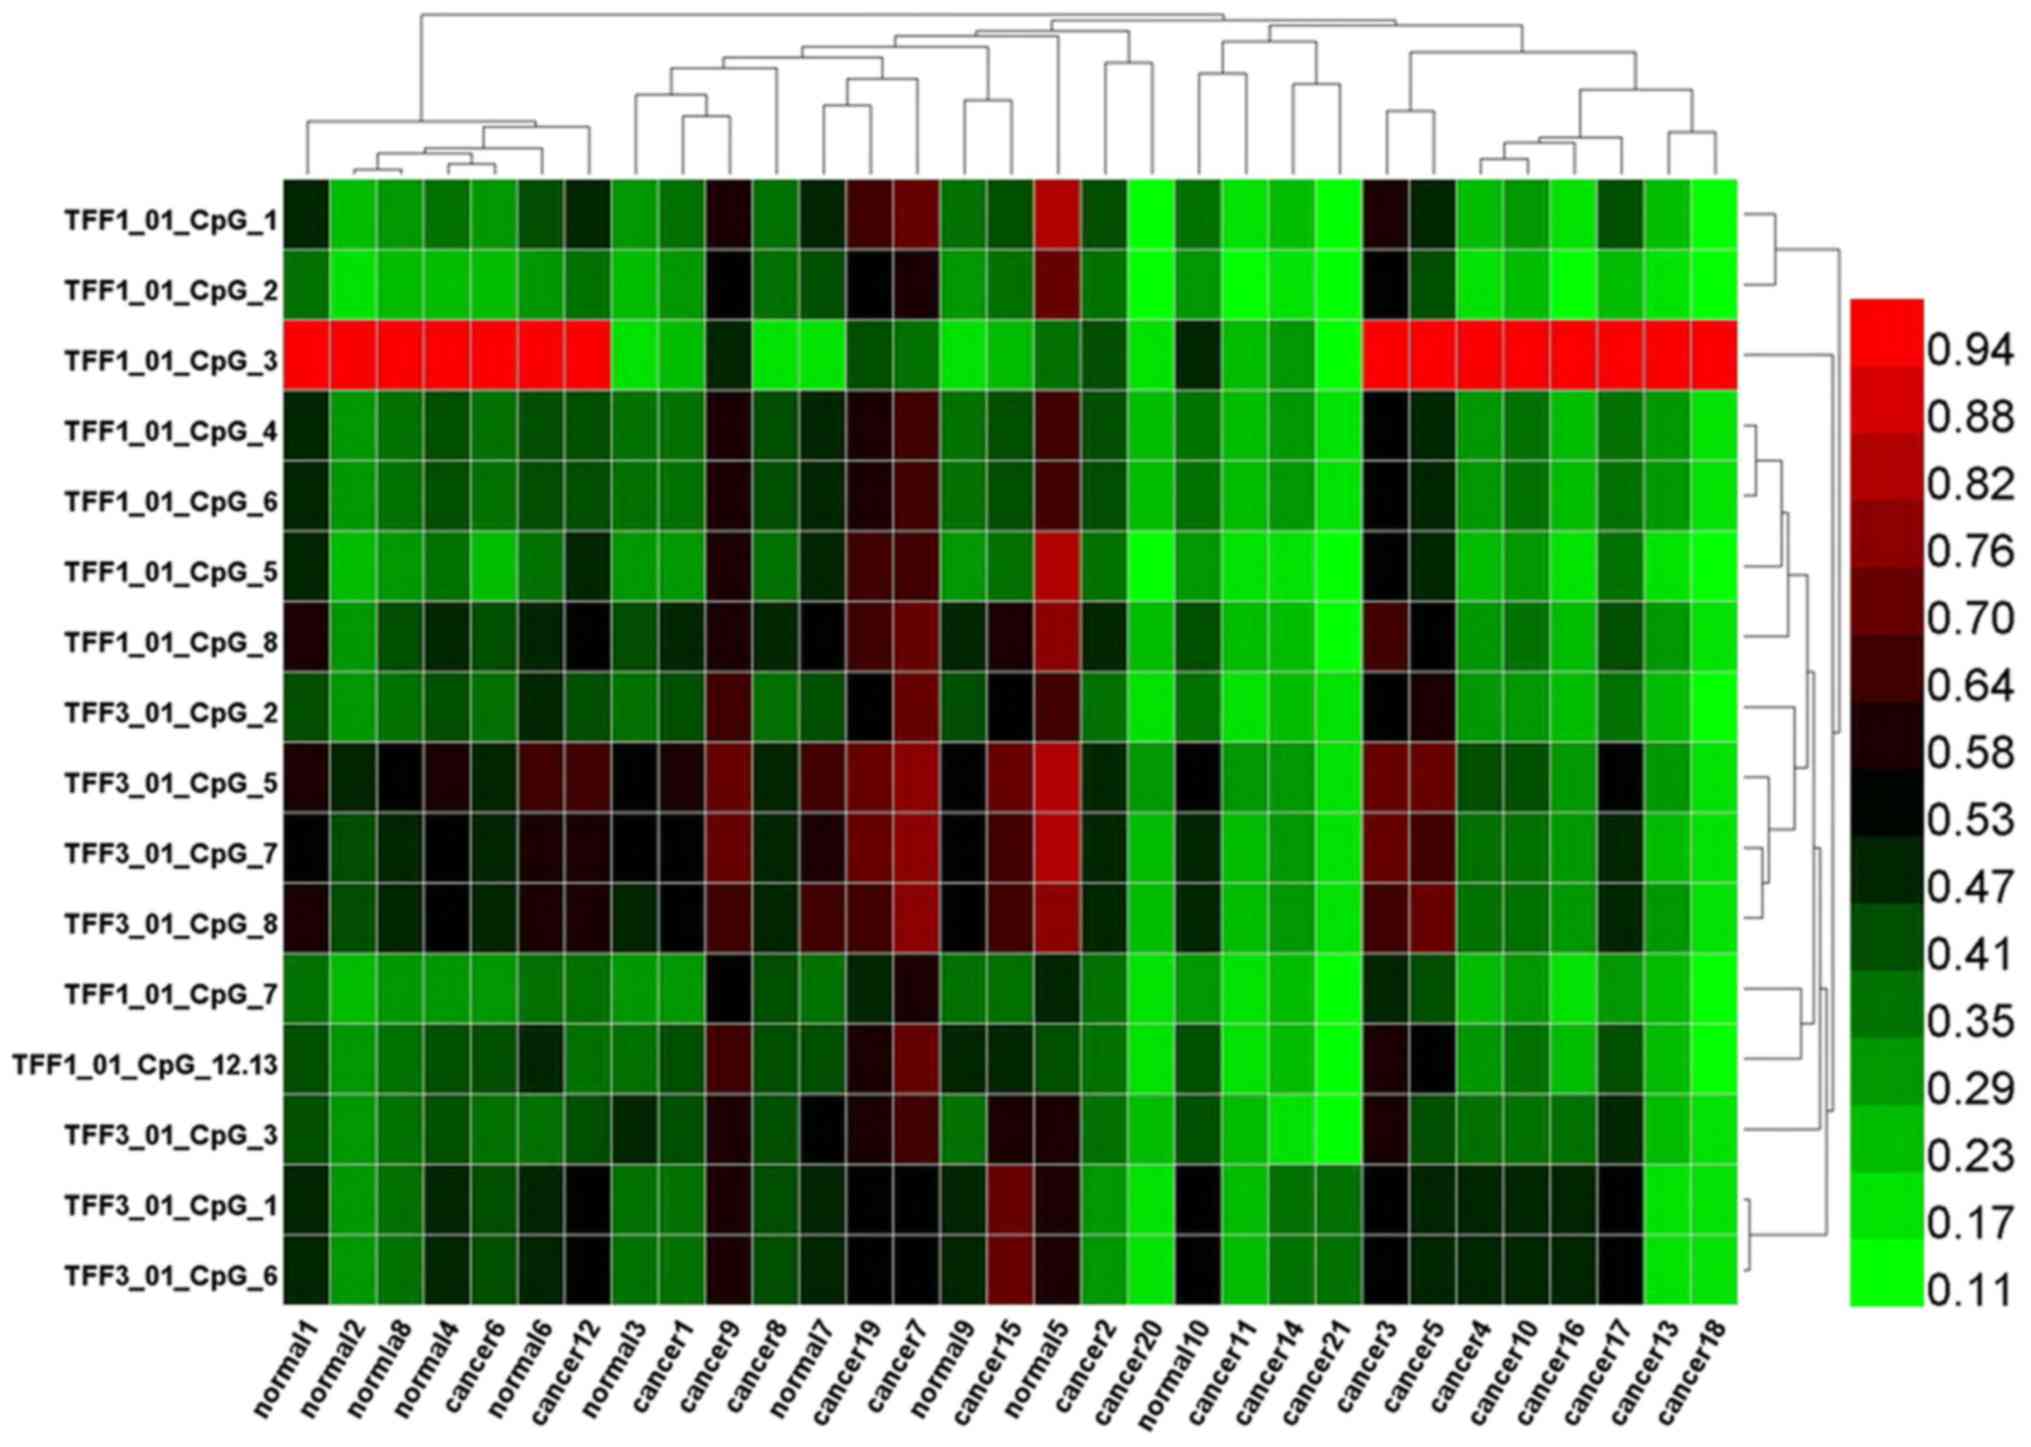
markedly differ between the CRC group and normal group (Tables V and VI). Two way hierarchical cluster
analysis also revealed that less dominant clustering was found in
the cancer or normal tissues. The hierarchical cluster algorithm
could not separate the colon cancer samples from the normal tissue
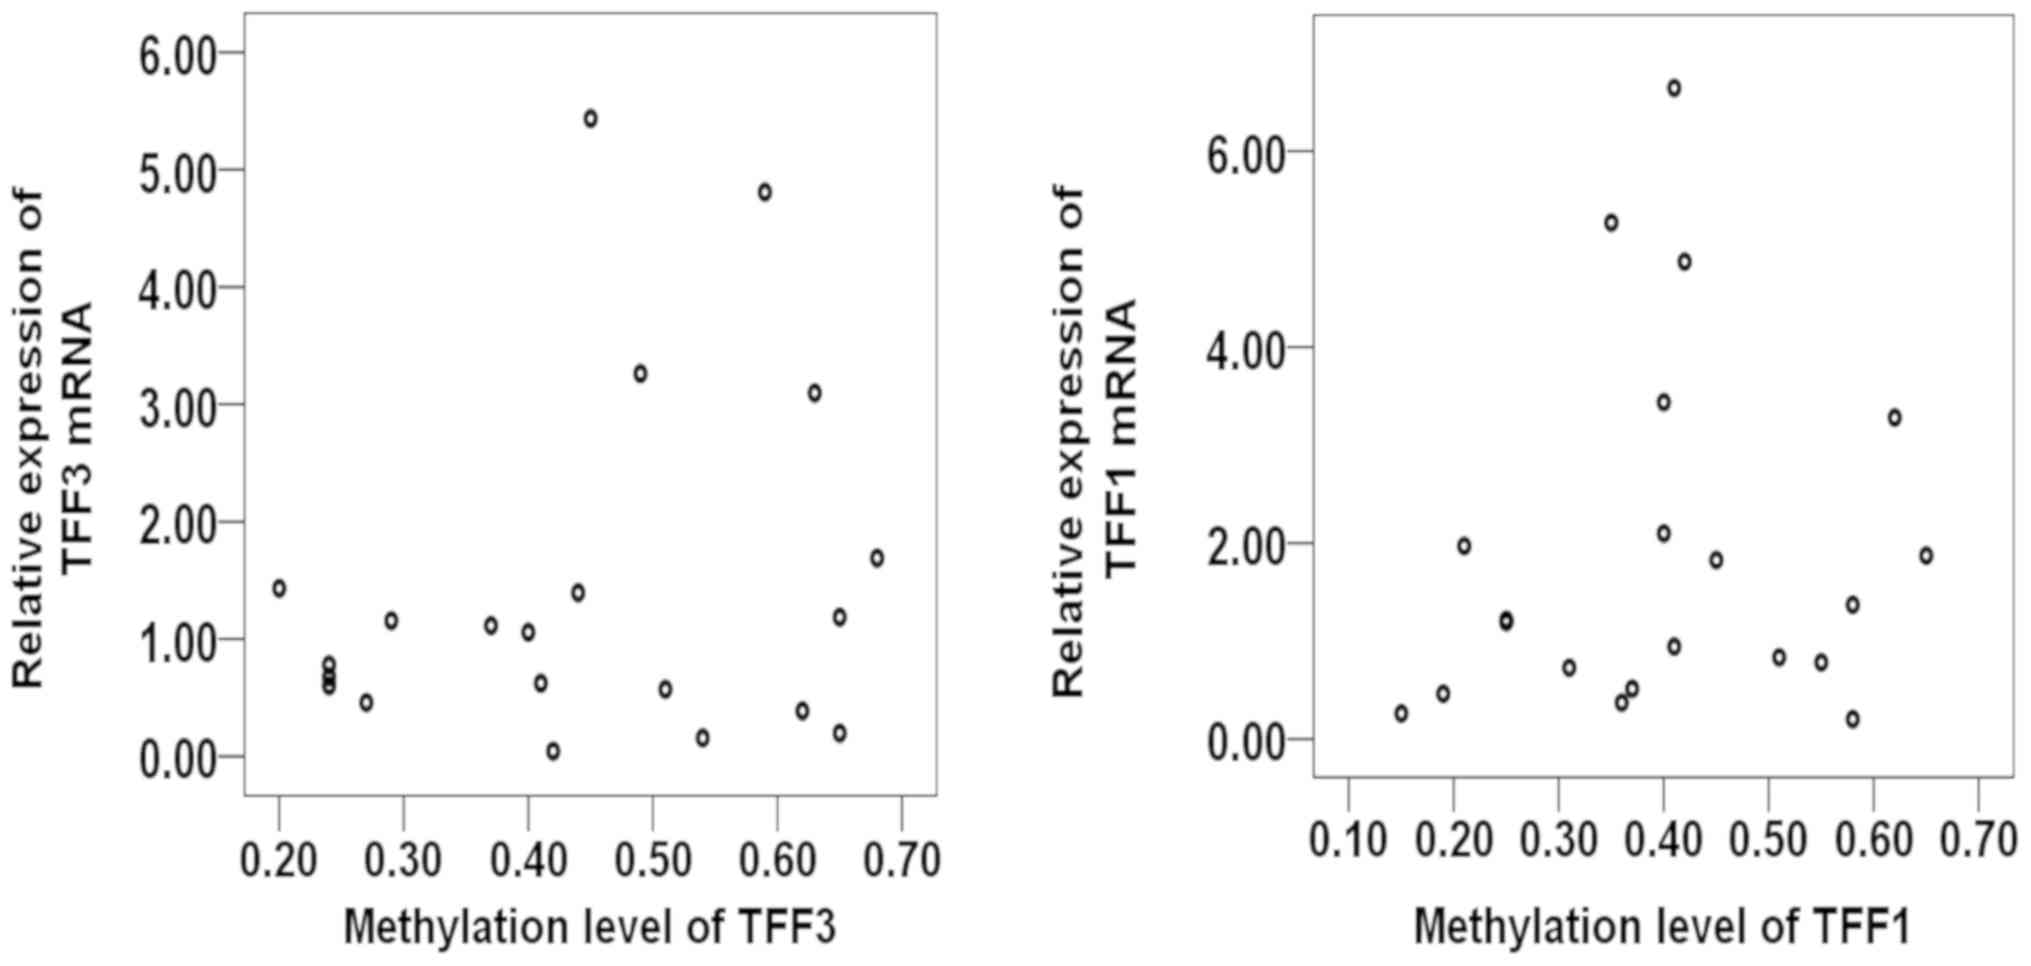
samples (Fig. 3). In addition,
following correlation analysis, no correlation was observed between
the promoter methylation and expression of TFF1 or TFF3 (Tables VIII and IX, and Fig.
4).
| Table VIIComparison of average methylation
level of TFF1 and TFF3 between normal and cancer groups. |
Table VII
Comparison of average methylation
level of TFF1 and TFF3 between normal and cancer groups.
| CpG | Average methylation
levels (means ± SD)
| P-value |
|---|
| Colorectal
cancer | Normal |
|---|
| TFF1_01 | 0.401±0.143 | 0.441±0.097 | 0.374 |
| TFF3_01 | 0.444±0.157 | 0.508±0.082 | 0.145 |
| Table VComparison of average methylation
levels in different CPG sites of TFF1 between normal and cancer
groups. |
Table V
Comparison of average methylation
levels in different CPG sites of TFF1 between normal and cancer
groups.
| CpG | Average methylation
levels (means ± SD)
| P value |
|---|
| Colorectal
cancer | Normal |
|---|
| TFF1_01_CpG_1 | 0.368±0.179 | 0.422±0.164 | 0.416 |
| TFF1_01_CpG_2 | 0.312±0.156 | 0.347±0.152 | 0.564 |
| TFF1_01_CpG_3 | 0.637±0.363 | 0.644±0.386 | 0.960 |
| TFF1_01_CpG_4 | 0.392±0.130 | 0.436±0.099 | 0.312 |
| TFF1_01_CpG_5 | 0.350±0.177 | 0.410±0.168 | 0.377 |
| TFF1_01_CpG_6 | 0.392±0.130 | 0.436±0.099 | 0.312 |
| TFF1_01_CpG_7 | 0.333±0.141 | 0.350±0.063 | 0.642 |
| TFF1_01_CpG_8 | 0.432±0.170 | 0.501±0.132 | 0.228 |
|
TFF1_01_CpG_12.13 | 0.394±0.163 | 0.421±0.061 | 0.506 |
| Table VIComparison of average methylation
levels in different CPG sites of TFF3 between normal and cancer
groups. |
Table VI
Comparison of average methylation
levels in different CPG sites of TFF3 between normal and cancer
groups.
| CpG | Average methylation
levels (means ± SD)
| P value |
|---|
| Colorectal
cancer | Normal |
|---|
| TFF3_01_CpG_1 | 0.435±0.145 | 0.469±0.075 | 0.394 |
| TFF3_01_CpG_2 | 0.386±0.161 | 0.432±0.088 | 0.314 |
| TFF3_01_CpG_3 | 0.400±0.151 | 0.439±0.088 | 0.379 |
| TFF3_01_CpG_4 | NA | NA | NA |
| TFF3_01_CpG_6 | 0.435±0.145 | 0.469±0.075 | 0.394 |
| TFF3_01_CpG_7 | 0.471±0.188 | 0.571±0.101 | 0.066 |
| TFF3_01_CpG_8 | 0.474±0.181 | 0.571±0.097 | 0.062 |
| Table VIIICorrelation between the methylation
level and mRNA expression of TFF3. |
Table VIII
Correlation between the methylation
level and mRNA expression of TFF3.
| Continuous
variable | No. | Means ± SD | Pearson's
correlation | P-value |
|---|
| TFF3 methylation
level | 21 | 0.441±0.097 | 0.231 | 0.315 |
| TFF3 mRNA | 21 | 2.612±1.631 | | |
| Table IXCorrelation between methylation level
and mRNA expression for TFF1. |
Table IX
Correlation between methylation level
and mRNA expression for TFF1.
| Continuous
variable | No. | Means ± SD | Pearson's
correlation | P-value |
|---|
| TFF1 methylation
level | 21 | 0.441±0.097 | 0.126 | 0.587 |
| TFF1 mRNA | 21 | 2.101±1.802 | | |
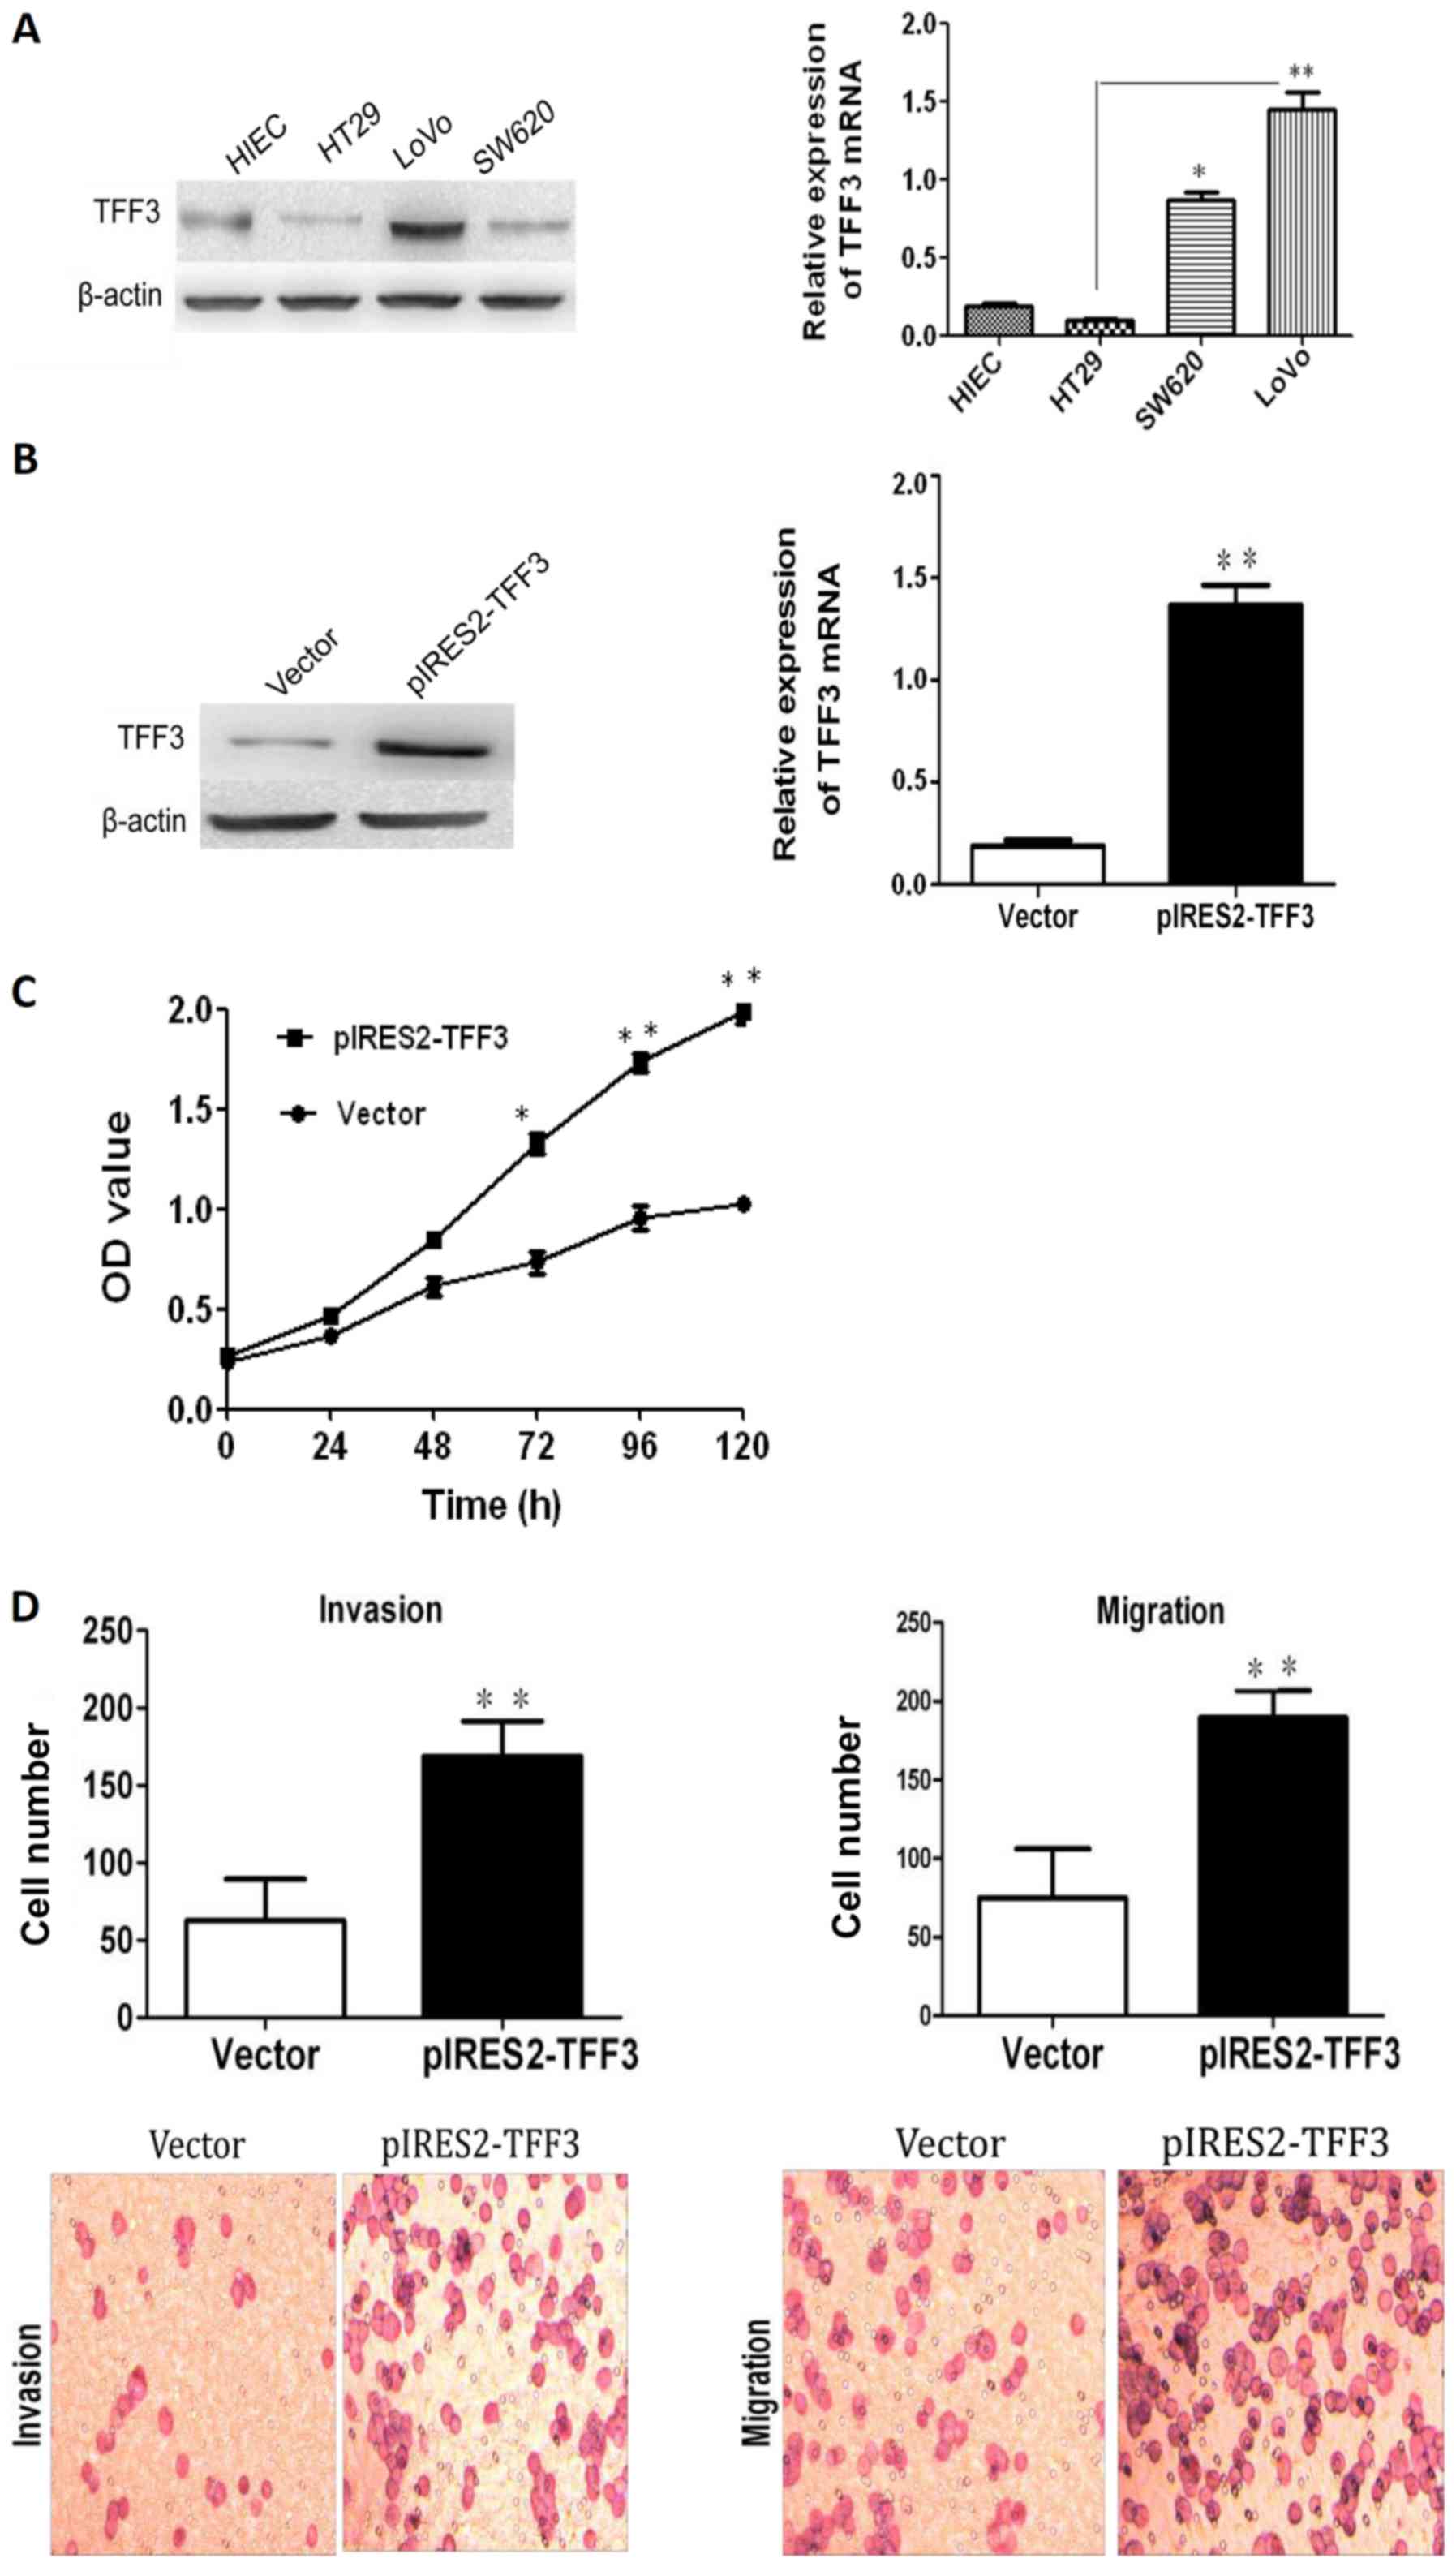
TFF3 enhances the proliferation,
migration and invasion of CCCs
TFF3 expression in 3 human CCC lines (HT29, SW620
and LoVo) and an immortalized human epithelial cell line (HIEC) was
examined by both RT-qPCR and western blot analysis. As illustrated
in Fig. 5A, TFF3 expression in the
HT29 cells was the lowest among the 4 cell lines, while the highest
expression of TFF3 was observed in the LoVo cells. Both RT-qPCR and
western blot analysis demonstrated that transfection with a TFF3
expression plasmid resulted in an enhanced expression of TFF3 in
the HT29 cells (Fig. 5B). The Cell
Counting kit-8 (CCK-8) assay revealed an apparently higher
proliferation in the pIRES2-TFF3-transfected cells than in the
empty vector transfected controls (Fig. 5C). An elevated expression of TFF3
was also found to have increased the invasive and migratory ability
of the pIRES2-TFF3-transfected cells (Fig. 5D). Furthermore, wound healing assay
revealed that the pIRES2-TFF3-transfected cells migrated at a more
rapid rate (as shown by the wound closure speed) than the empty
vector transfected cells (Fig.
5E). Lastly, compared with the control group, the
pIRES2-TFF3-transfected cells exhibited fewer intercellular
junctions and a reduced number of villi and less pseudopodia. An
increased number of polygonal or spindle cells in the TFF3
overexpression group was also observed (Fig. 5F).
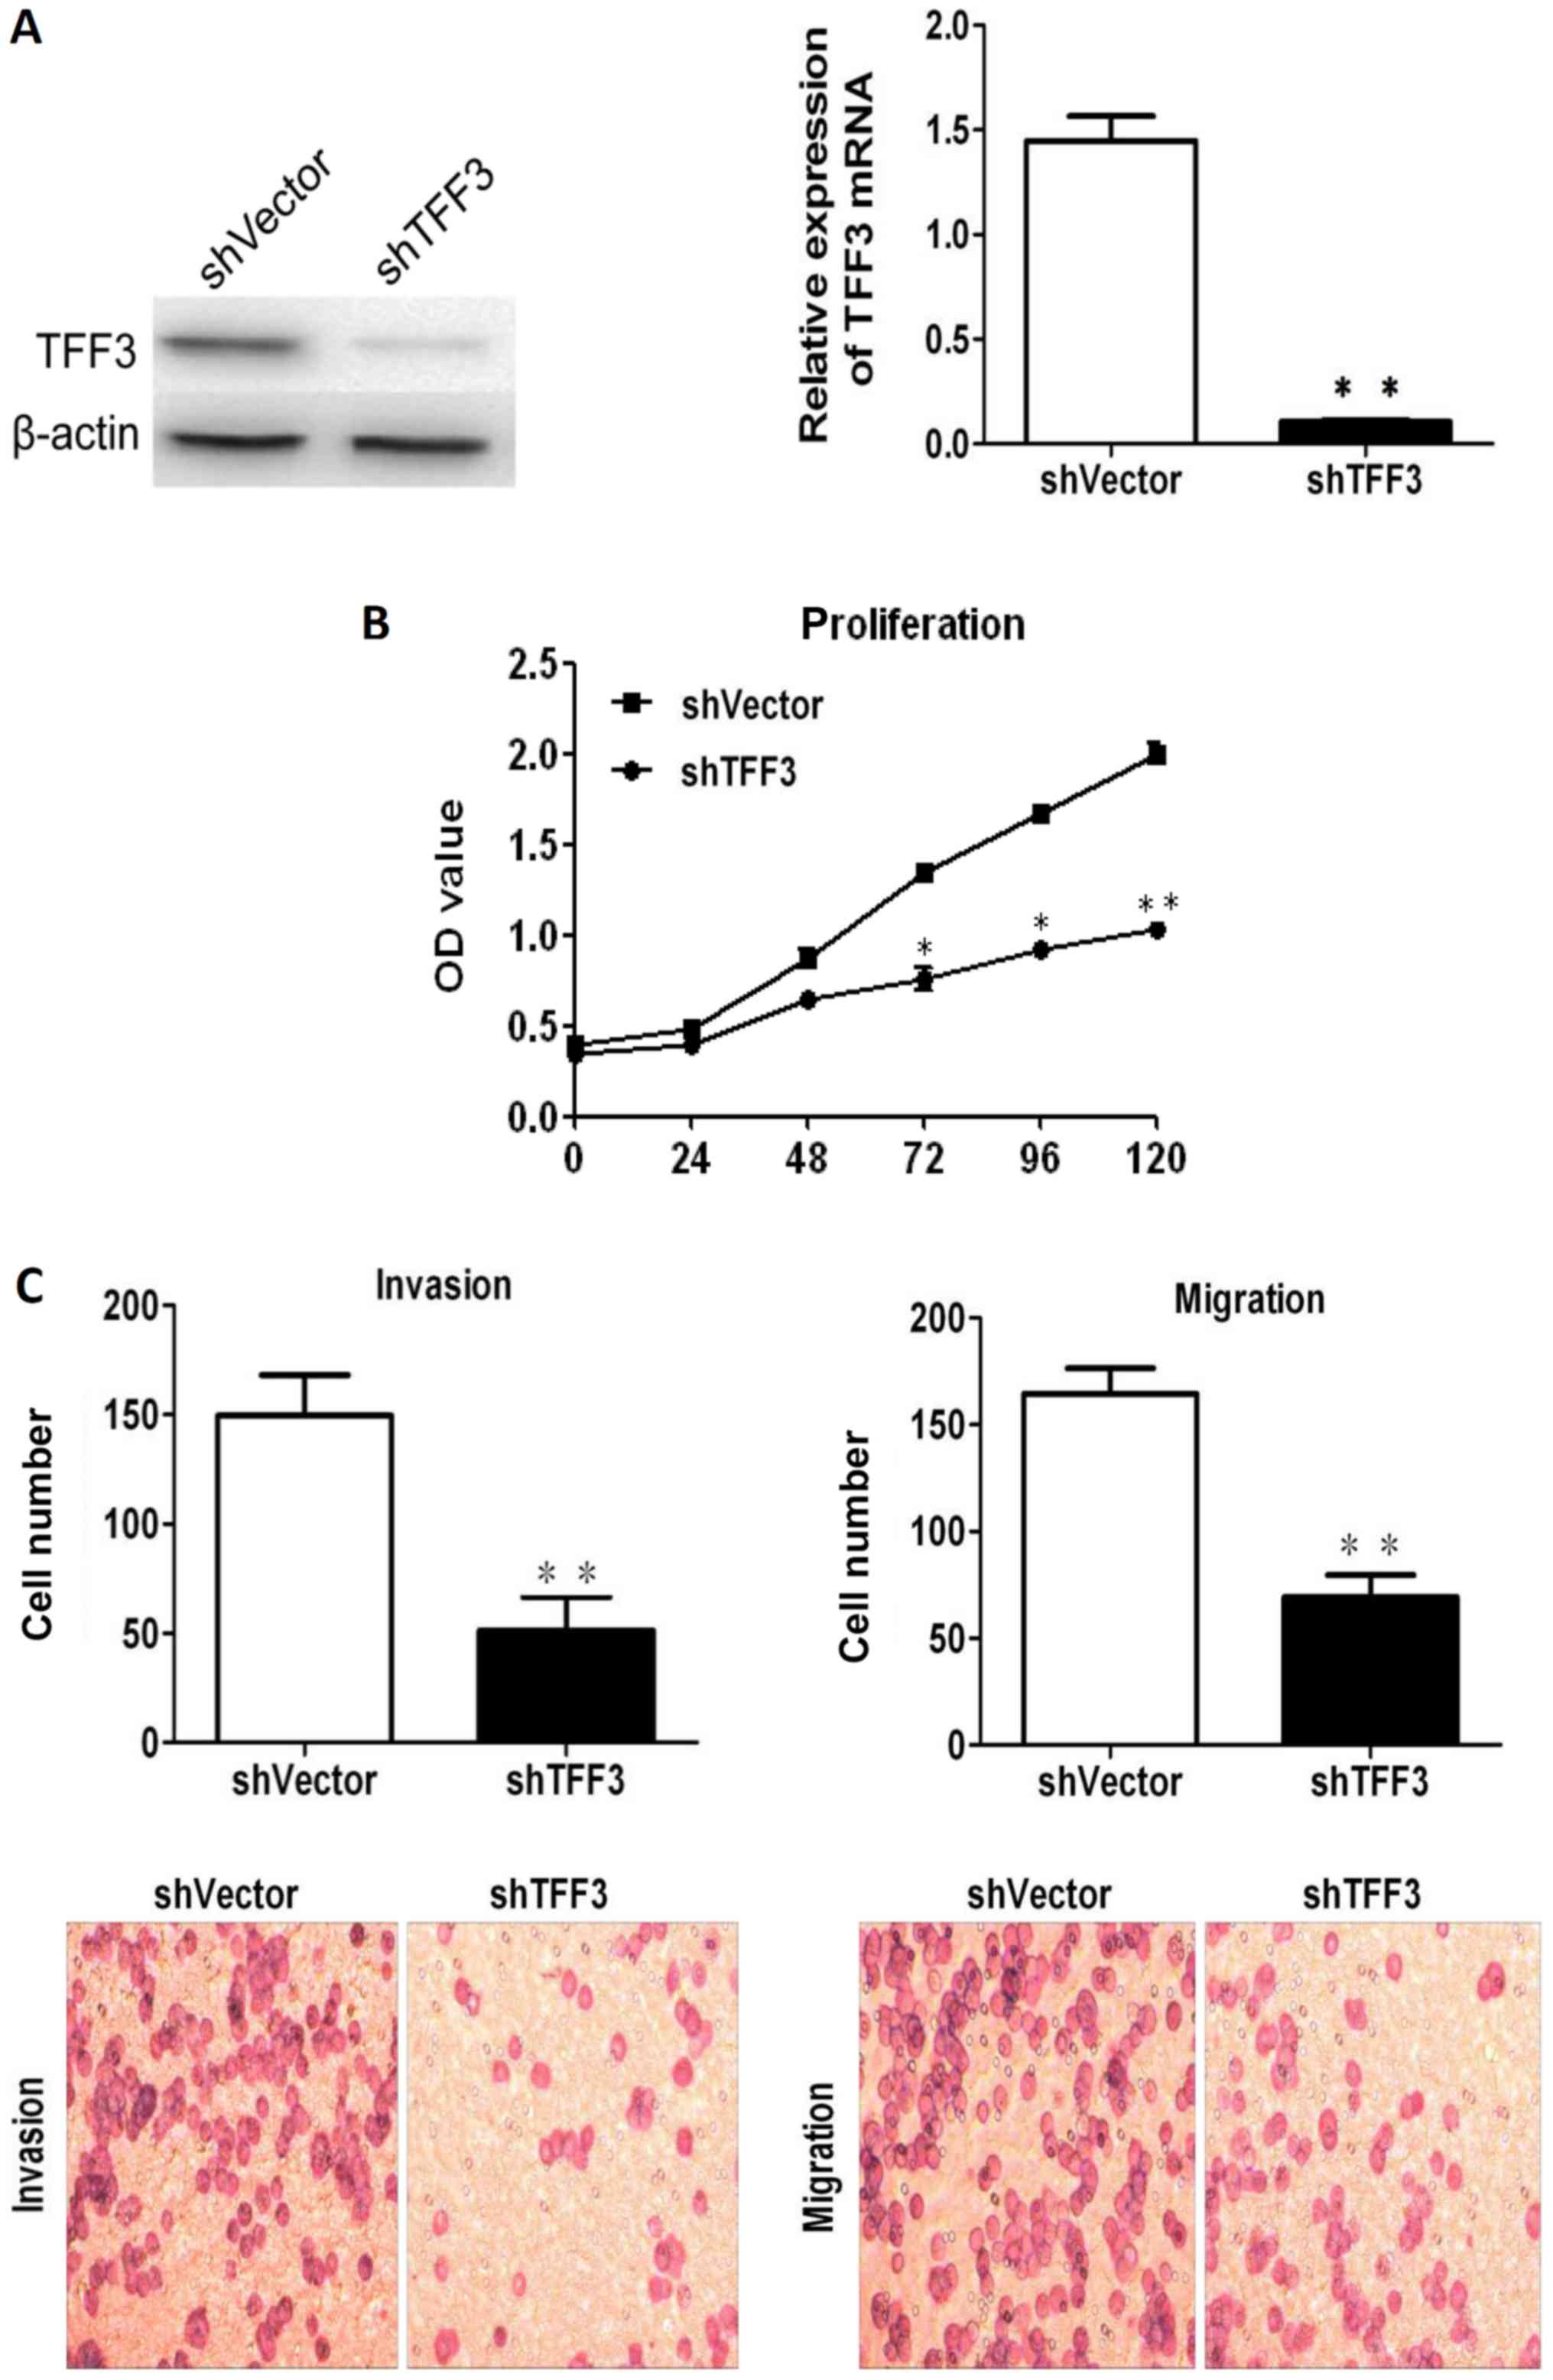
Downregulation of TFF3 inhibits CCC
proliferation, migration and invasion
TFF3 was silenced in the LoVo cells, which expressed
the highest levels of TFF3, via shRNA transfection in order to
further assess the effects of TFF3 on cancer progression. As shown
in Fig. 6A, both RT-qPCR and
western blot analysis revealed that TFF3 expression was markedly
reduced following transfection with the shRNA sequences. The
downregulation of TFF3 notably reduced the proliferation of the
LoVo cells, as indicated by the results of CCK-8 assay (Fig. 6B). The invasive and migratory
abilities of the LoVo cells were also found to be markedly reduced
following the knockdown of TFF3, as shown by the Transwell assay
results (Fig. 6C). Lastly, the
wound healing assay also demonstrated that the migratory capacity
of the LoVo cells was impaired by the silencing of TFF3 (Fig. 6D).
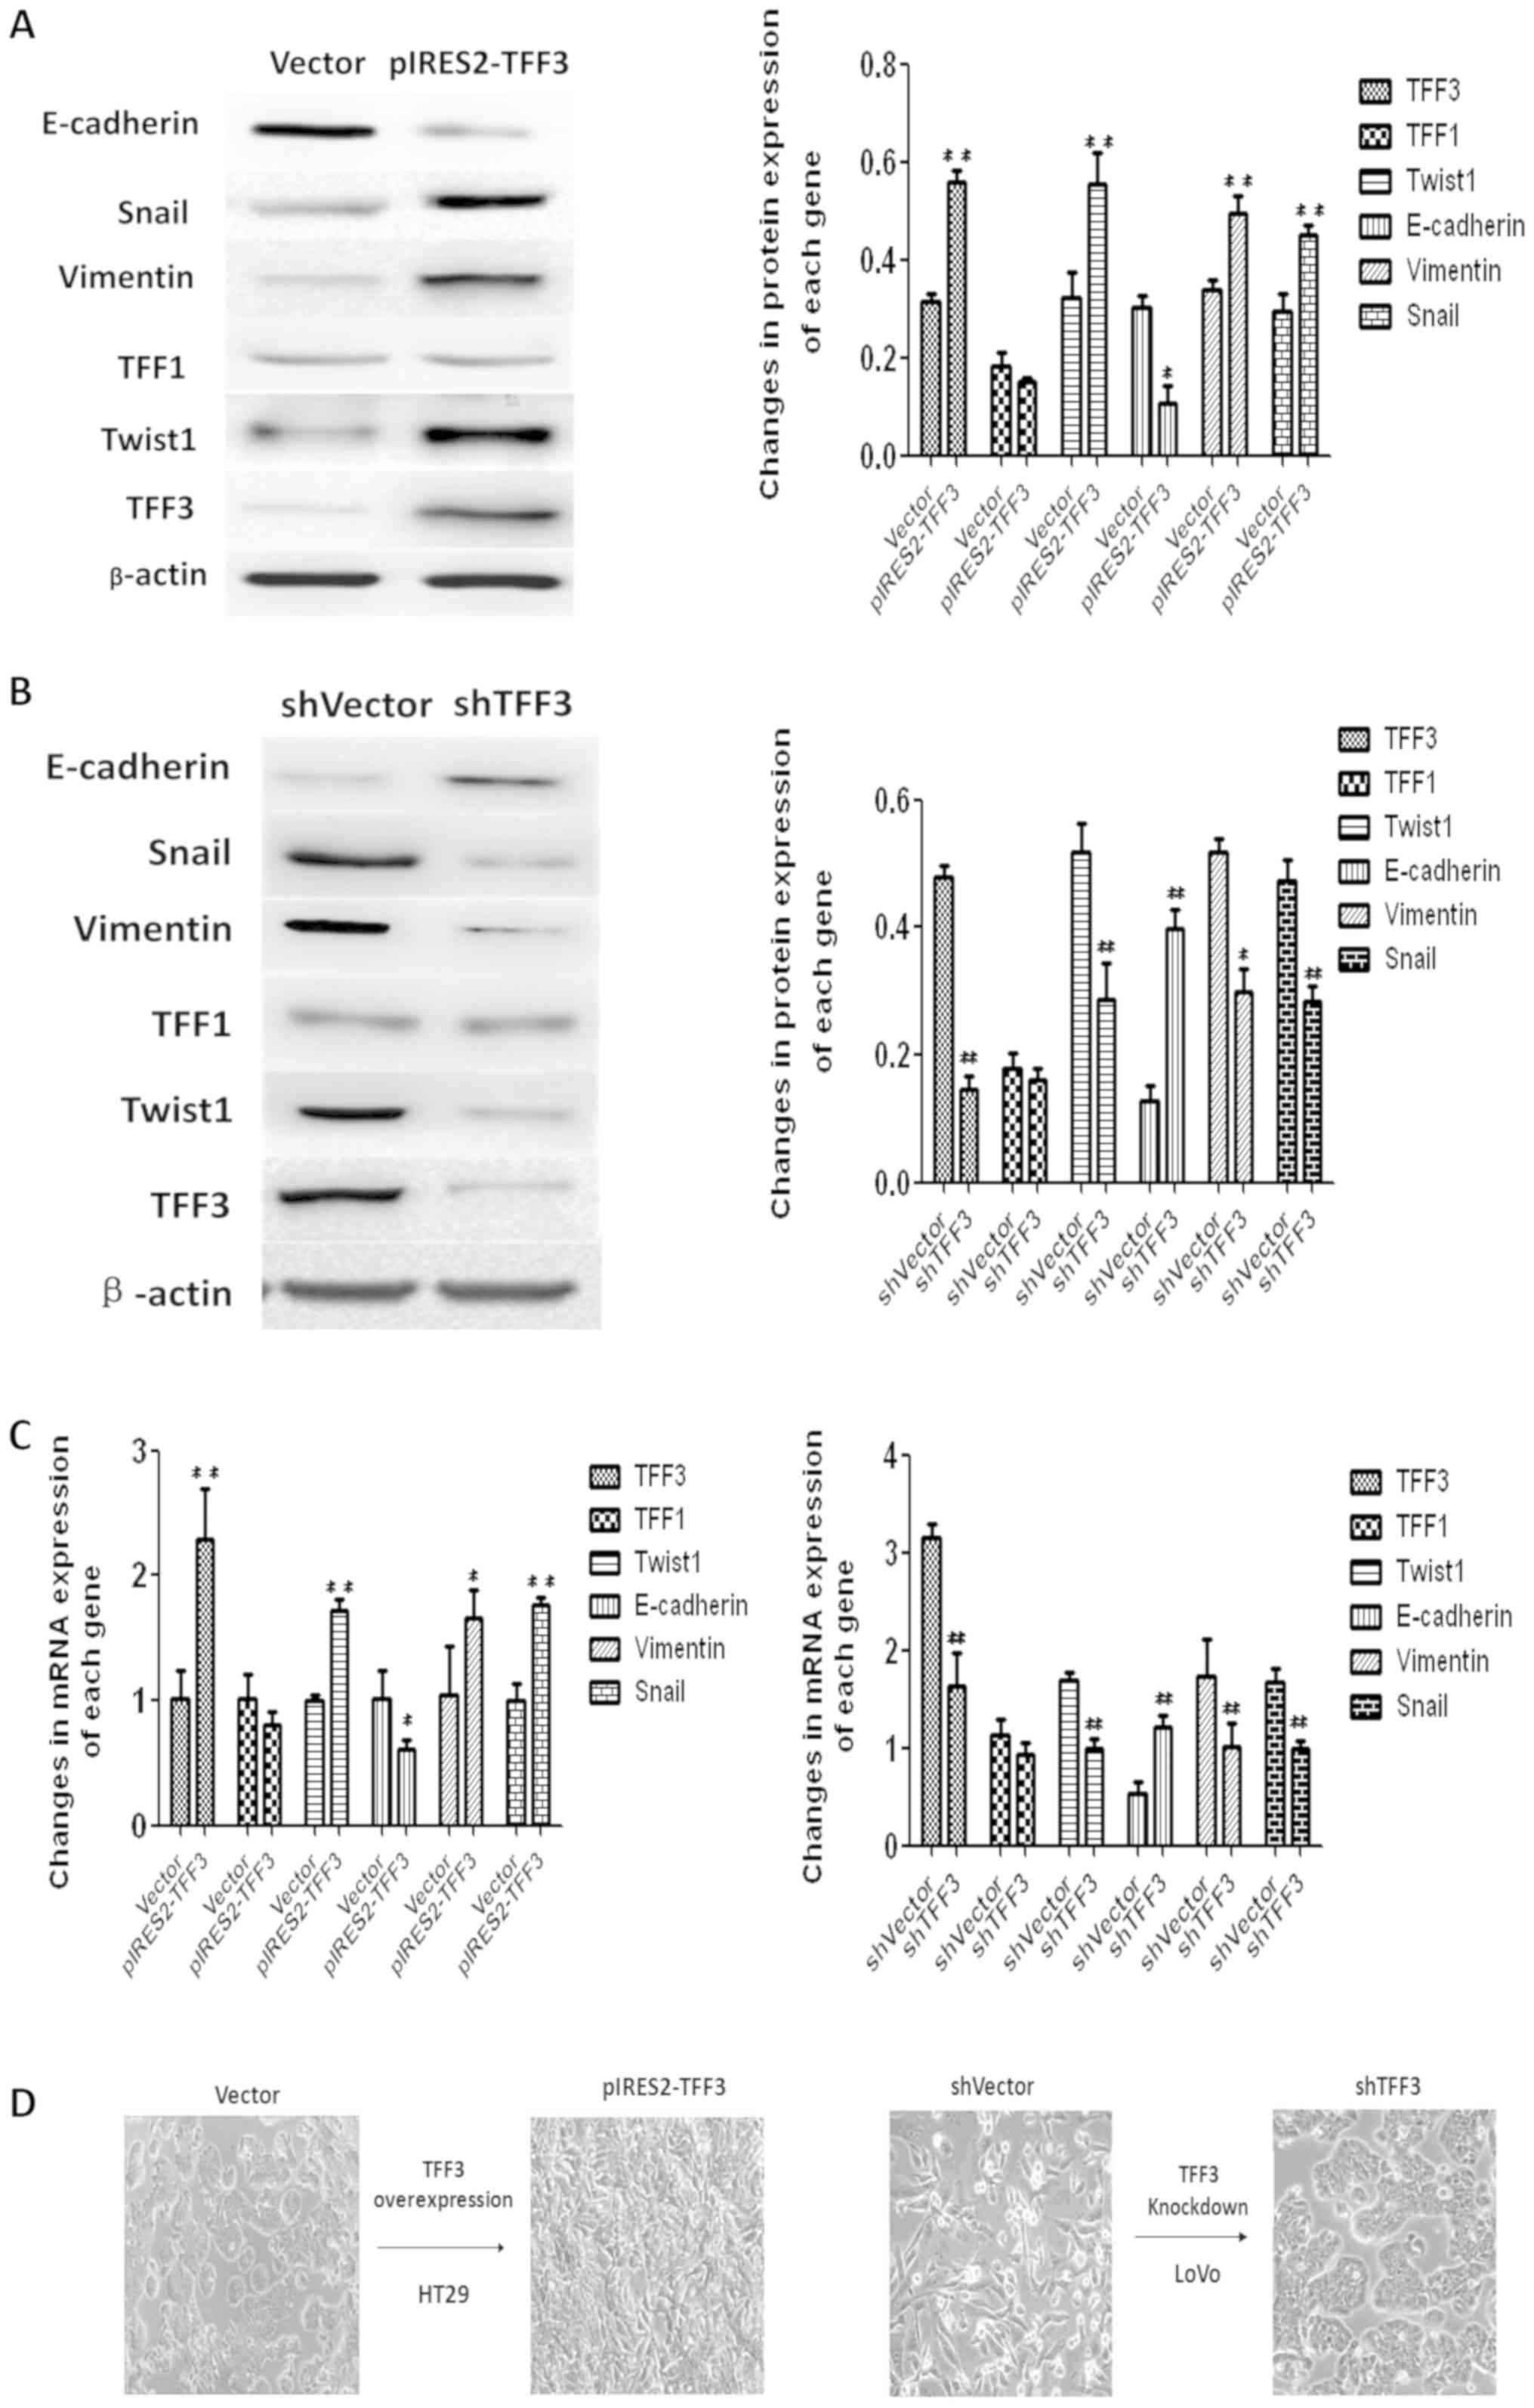
TFF3 accelerates the EMT process of
CCCs
The expression of EMT markers was examined by both
western blot analysis and RT-qPCR to confirm whether TFF3 promotes
cancer progression through EMT. As illustrated in Fig. 7A and C, the elevated expression of
TFF3 in the HT29 cells resulted in the downregulation of
E-cadherin, a well-established epithelial marker, at both the
protein and mRNA level. TFF3 expression also promoted an increase
in the mRNA and protein levels of the mesenchymal markers, Twist1,
Snail and Vimentin. Furthermore, the shRNA mediated knockdown of
TFF3 upregulated E-cadherin expression, and suppressed the
expression of Twist1, Snail and Vimentin in the LoVo cells at both
the protein and mRNA level (Fig. 7B
and C). The EMT like morphological changes in the cells were
also observed under an optical microscope. The shape of the HT29
cells changed from a round or volmer-weber mode into a triangular
or spindle form following the overexpression of TFF3. LoVo cells
displayed a reversed morphological changes from the scattered cord
like forms to the round, rectangular or clustered patterns
following the silencing of TFF3 (Fig.
7D).
Discussion
Studies have indicated that TFF expression may
produce undesirable outcomes if overexpressed in tumor tissues,
although these proteins have a number of beneficial cytoprotective
effects. As a secreted protein, the serum or tissue levels of TFF3
or both TFF1 and TFF3 have been reported to be biomarkers for
several malignancies (30-37). Huang et al (38) reported that TFF3 mRNA expression
was upregulated in CRC, although not significantly, when compared
with paired normal colonic mucosa. TFF3 mRNA is also elevated in
CRCs with lymph node metastasis when compared with that of
non-metastatic cancer. Our previous study observed higher protein
levels of TFF1 and decreased levels of TFF3 in cancer tissue than
in adjacent normal tissue via immunohistochemistry, and revealed
that a higher expression of TFF3 was associated with lymph node
metastasis, TNM stage and a poor prognosis (39). In the present study, a higher
number of samples were used to confirm the mRNA expression levels
of both TFF1 and TFF3 and verify previous results. The results of
the present study confirmed the elevated expression levels of both
TFF1 and 3 in neoplastic tissues compared with adjacent normal
tissues. Moreover, a higher TFF1 mRNA expression was associated
with metastasis prior to treatment, TNM staging and CRM, but was
not associated with survival. On the other hand, a higher
expression of TFF3 was associated with histological type, invasion
depth, lymph node number, metastasis prior to treatment, TNM
staging, recurrence or metastasis after surgery and poor survival,
indicating that higher expression of TFF3 is predominantly
associated with cancer malignancy. Thus, TFF3 expression in CRC
tissues may be a novel prognostic factor.
Changes in DNA methylation of certain tumor
suppressor genes and consecutive changes in mRNA expression are one
of the earliest events in the development of CRC, often occurring
prior to the appearance of mutations in well-known genes, including
the adenomatous polyposis coli gene (40-42).
TFF3 overexpression associated with specific promoter CpG
hypomethylation has been identified in mouse and human
hepatocellular carcinoma tissues, and promoter CpG hypomethylation
of TFF3 has been posited to be a potential mechanism of TFF3
overexpression in hepatocellular cancer (43). Vestergaard et al (44) reported the hypomethylation of TFF1
and TFF3 promoter regions in prostate cancer (PC) cell lines, with
significantly increased TFF expression compared with both benign
immortalized prostate cell lines and PC cell lines not expressing
TFF. In clinical samples, methylation of the TFF1 and TFF3 promoter
regions has been observed to be significantly lower in PC samples
compared with benign prostatic hyperplastic samples. Moreover, the
hypomethylation of CpG sites has also been reported in mouse small
intestine tissue overexpressing TFF3 (45) and in human pancreatic ductal
carcinomas (46). Based on these
data, the present study also evaluated the levels of promoter
methylation of TFF1 and TFF3 in CRC samples in order to determine
whether their expression levels at the transcriptional level are
regulated by their promoter methylation patterns. The results
revealed that there was no apparent difference in methylation
levels between neoplastic and normal tissue. In addition, no
correlation between methylation level and mRNA expression of TFF1
or TFF3 in CRC samples was observed (P>0.05), which may indicate
that the mRNA expression of the two genes in CRC tissues is not
determined by promoter methylation. However, this may have been
influenced by the insufficient number of samples, and further
research is required to confirm these results.
Although TFF3 is associated with malignancy in a
number of types of cancer, its underlying signaling pathway is not
yet well understood. TFF3 may promote the development of malignant
tumors by acting both directly on malignant cells and indirectly on
the vasculature (29). TFF3 has
also been reported to participate in the metastasis of breast
cancer through the repression of cadherin 1 via STAT3 (19). TFF3 was also first associated with
Twist-mediated cell migration in gastric cancer cells (47). However, controversial reports have
emerged, raising doubts regarding the exact role of TFF3 in cancer
progression. Uchino et al (48) reported that TFF3 inhibited the
growth of CRC cells. It was also shown that TFF3 overexpression
markedly decreased the proliferation of the SW837 and LoVo CCC
lines (49). TFF3 has also been
reported to promote the migration and invasiveness of rat
fibroblasts (50), the migration
of gastric mucosal epithelial cells (51), and the proliferation, viability and
survival of breast cancer (17)
and prostate carcinoma cells (52,53).
The present study performed a number of functional
tests on the role of TFF3 to explore its involvement in colon
cancer progression. The results revealed that the overexpression of
TFF3 intensified proliferation, migration and invasion capacities
of HT29 cells, and induced an increase in Twist1, Snail Vimentin
levels while causing a decrease in the levels of E cadherin
expressions at both the protein and mRNA levels, indicating that
cells were potentially undergoing EMT. On the contrary, the
knockdown of TFF3 resulted in opposite effects in the LoVo cells.
Moreover, the EMT like morphological changes in cells were observed
following the overexpression or silencing of TFF3. The HT29 cells
lost the epithelial forms gradually and obtained mesenchymal
patterns following the overexpression of TFF3, while the LoVo cells
demonstrated a reversed morphological changes after the silencing
of TFF3. Therefore, these results suggest that TFF3 may promote
colon cancer progression via EMT.
In conclusion, the results of the present study
suggest that TFF3 may be a novel biomarker for survival estimates
of patients with colon cancer, and may promote the malignant
progression of CCCs by activating the EMT process. In addition, the
present study also provided preclinical proof that TFF3 may be a
potential target for the treatment of CRC.
Acknowledgments
Not applicable.
Funding
This study was supported by the Natural Science Fund
of the Xin Jiang Uyghur Autonomous Region (grant no.
2019D01C253).
Availability of data and materials
All data generated or analyzed during this study are
included in this published article or are available from the
corresponding author on reasonable request.
Authors' contributions
AY and HW conceived and designed the study. AY wrote
the first draft of the manuscript. PS and RT assisted with the
collection of the clinicopathological materials and the overall
statistics and analysis of the data. CF and FW assisted in
performing experiments, such as transfection, proliferation,
invasion, migration, RT-qPCR and western blot analysis. All authors
have read and approved the final manuscript.
Ethics approval and consent to
participate
This study was approved by the Ethics Committee of
the Tumor Hospital of Xin Jiang Medical University (approval no.
20110110, 10 January, 2011) and all procedures followed the
principles of the Declaration of Helsinki. All subjects provided
written informed consent prior to participation.
Patient consent for publication
Not applicable.
Competing interests
The authors declare that they have no competing
interests
References
|
1
|
Cai SJ and Peng JJ: Colorectal cancer
epidemiology and prevention strategies. In: Proc Academic Annual
Conference of CSCO 2014; pp. 294–301. Peking, China. 2014
|
|
2
|
Li S, Wang J, Lu Y and Fan D: Screening
and early diagnosis of colorectal cancer in China: A 12 year
retrospect (1994 2006). J Cancer Res Clin Oncol. 133:679–686. 2007.
View Article : Google Scholar : PubMed/NCBI
|
|
3
|
Gespach C: Trefoil factors. Encyclopedia
of Cancer. Schwab M: Springer; Berlin, Heidelberg: pp. 4652–4658.
2011
|
|
4
|
Sands BE and Podolsky DK: The trefoil
peptide family. Annu Rev Physiol. 58:253–273. 1996. View Article : Google Scholar : PubMed/NCBI
|
|
5
|
Wright NA, Poulsom R, Stamp G, Van Noorden
S, Sarraf C, Elia G, Ahnen D, Jeffery R, Longcroft J, Pike C, et
al: Trefoil peptide gene expression in gastrointestinal epithelial
cells in inflammatory bowel disease. Gastroenterology. 104:12–20.
1993. View Article : Google Scholar : PubMed/NCBI
|
|
6
|
Regalo G, Wright NA and Machado JC:
Trefoil factors: From ulceration to neoplasia. Cell Mol Life Sci.
62:2910–2915. 2005. View Article : Google Scholar : PubMed/NCBI
|
|
7
|
Hernández C, Santamatilde E, McCreath KJ,
Cervera AM, Díez I, Ortiz Masiá D, Martínez N, Calatayud S,
Esplugues JV and Barrachina MD: Induction of trefoil factor (TFF)1,
TFF2 and TFF3 by hypoxia is mediated by hypoxia inducible factor 1:
Implications for gastric mucosal healing. Br J Pharmacol.
156:262–272. 2009. View Article : Google Scholar
|
|
8
|
Taupin D and Podolsky DK: Trefoil factors:
Initiators of mucosal healing. Nat Rev Mol Cell Biol. 4:7217322003.
View Article : Google Scholar : PubMed/NCBI
|
|
9
|
May FE and Westley BR: Trefoil proteins:
Their role in normal and malignant cells. J Pathol. 183:4–7. 1997.
View Article : Google Scholar : PubMed/NCBI
|
|
10
|
Prest SJ, May FE and Westley BR: The
estrogen-regulated protein, TFF1, stimulates migration of human
breast cancer cells. FASEB J. 16:592–594. 2002. View Article : Google Scholar : PubMed/NCBI
|
|
11
|
Machado JC, Nogueira AM, Carneiro F, Reis
CA and Sobrinho-Simões M: Gastric carcinoma exhibits distinct types
of cell differentiation: An immunohistochemical study of trefoil
peptides (TFF1 and TFF2) and mucins (MUC1, MUC2, MUC5AC, and MUC6).
J Pathol. 190:437–443. 2000. View Article : Google Scholar : PubMed/NCBI
|
|
12
|
Dhar DK, Wang TC, Tabara H, Tonomoto Y,
Maruyama R, Tachibana M, Kubota H and Nagasue N: Expression of
trefoil factor family members correlates with patient prognosis and
neoangiogenesis. Clin Cancer Res. 11:6472–6478. 2005. View Article : Google Scholar : PubMed/NCBI
|
|
13
|
Madsen J, Nielsen O, Tornøe I, Thim L and
Holmskov U: Tissue localization of human trefoil factors 1, 2, and
3. J Histochem Cytochem. 55:505–513. 2007. View Article : Google Scholar : PubMed/NCBI
|
|
14
|
Rodrigues S, Rodrigue CM, Attoub S, Fléjou
JF, Bruyneel E, Bracke M, Emami S and Gespach C: Induction of the
adenoma carcinoma progression and Cdc25A-B phosphatases by the
trefoil factor TFF1 in human colon epithelial cells. Oncogene.
25:6628–6636. 2006. View Article : Google Scholar : PubMed/NCBI
|
|
15
|
Arumugam T, Brandt W, Ramachandran V,
Moore TT, Wang H, May FE, Westley BR, Hwang RF and Logsdon CD:
Trefoil factor 1 stimulates both pancreatic cancer and stellate
cells and increases metastasis. Pancreas. 40:815–822. 2011.
View Article : Google Scholar : PubMed/NCBI
|
|
16
|
Zhao S, Ma Y and Huang X: Trefoil factor 1
elevates the malignant phenotype of mucinous ovarian cancer cell
through Wnt/β catenin signaling. Int J Clin Exp Pathol.
8:10412–10419. 2015.
|
|
17
|
Kannan N, Kang J, Kong X, Tang J, Perry
JK, Mohankumar KM, Miller LD, Liu ET, Mertani HC, Zhu T, et al:
Trefoil factor 3 is oncogenic and mediates anti-estrogen resistance
in human mammary carcinoma. Neoplasia. 12:1041–1053. 2010.
View Article : Google Scholar : PubMed/NCBI
|
|
18
|
Gu J, Zheng L, Zhang L, Chen S, Zhu M, Li
X and Wang Y: TFF3 and HER2 expression and their correlation with
survival in gastric cancer. Tumour Biol. 36:3001–3007. 2015.
View Article : Google Scholar
|
|
19
|
Pandey V, Wu ZS, Zhang M, Li R, Zhang J,
Zhu T and Lobie PE: Trefoil factor 3 promotes metastatic seeding
and predicts poor survival outcome of patients with mammary
carcinoma. Breast Cancer Res. 16:429–448. 2014. View Article : Google Scholar : PubMed/NCBI
|
|
20
|
Ishibashi Y, Ohtsu H, Ikemura M, Kikuchi
Y, Niwa T, Nishioka K, Uchida Y, Miura H, Aikou S, Gunji T, et al:
Serum TFF1 and TFF3 but not TFF2 are higher in women with breast
cancer than in women without breast cancer. Sci Rep. 7:4846–4854.
2017. View Article : Google Scholar : PubMed/NCBI
|
|
21
|
Lacroix M: Significance, detection and
markers of disseminated breast cancer cells. Endocr Relat Cancer.
13:1033–1067. 2006. View Article : Google Scholar : PubMed/NCBI
|
|
22
|
Im S, Yoo C, Jung JH, Choi HJ, Yoo J and
Kang CS: Reduced expression of TFF1 and increased expression of
TFF3 in gastric cancer: Correlation with clinicopathological
parameters and prognosis. Int J Med Sci. 10:133–140. 2013.
View Article : Google Scholar : PubMed/NCBI
|
|
23
|
Vestergaard EM, Borre M, Poulsen SS, Nexø
E and Tørring N: Plasma levels of trefoil factors are increased in
patients with advanced prostate cancer. Clin Cancer Res.
12:807–812. 2006. View Article : Google Scholar : PubMed/NCBI
|
|
24
|
Casado E, Garcia VM, Sánchez JJ, Gómez Del
Pulgar MT, Feliu J, Maurel J, Castelo B, Moreno Rubio J, López RA,
García-Cabezas MÁ, et al: Upregulation of trefoil factor 3 (TFF3)
after rectal cancer chemoradiotherapy is an adverse prognostic
factor and a potential therapeutic target. Int J Radiat Oncol Biol
Phys. 84:1151–1158. 2012. View Article : Google Scholar : PubMed/NCBI
|
|
25
|
Martin TA, Goyal A, Watkins G and Jiang
WG: Expression of the transcription factors snail, slug, and twist
and their clinical significance in human breast cancer. Ann Surg
Oncol. 12:488–496. 2005. View Article : Google Scholar : PubMed/NCBI
|
|
26
|
Khan MA, Chen HC, Zhang D and Fu J: Twist:
A molecular target in cancer therapeutics. Tumour Biol.
34:2497–2506. 2013. View Article : Google Scholar : PubMed/NCBI
|
|
27
|
Hu P, Yang J, Hou Y, Zhang H, Zeng Z, Zhao
L, Yu T, Tang X, Tu G, Cui X, et al: lncRNA expression signatures
of twist induced epithelial to mesenchymal transition in MCF10A
cells. Cell Signal. 26:83–93. 2014. View Article : Google Scholar
|
|
28
|
Livak KJ and Schmittgen TD: Analysis of
relative gene expression data using real-time quantitative PCR and
the 2(-Δ Δ C(T)) Method. Methods. 25:402–408. 2001. View Article : Google Scholar
|
|
29
|
Camp RL, Dolled-Filhart M and Rimm DL:
X-tile: A new bio informatics tool for biomarker assessment and
outcome based cut point optimization. Clin Cancer Res.
10:7252–7259. 2004. View Article : Google Scholar : PubMed/NCBI
|
|
30
|
May FE: The potential of trefoil proteins
as biomarkers in human cancer. Biomarkers Med. 6:301–304. 2012.
View Article : Google Scholar
|
|
31
|
Xiao P, Ling H, Lan G, Liu J, Hu H and
Yang R: Trefoil factors: gastrointestinal specific proteins
associated with gastric cancer. Clin Chim Acta. 450:127–134. 2015.
View Article : Google Scholar : PubMed/NCBI
|
|
32
|
Qu Y, Yang Y, Ma D and Xiao W: Increased
trefoil factor 3 levels in the serum of patients with three major
histological subtypes of lung cancer. Oncol Rep. 27:1277–1283.
2012. View Article : Google Scholar : PubMed/NCBI
|
|
33
|
Meng JR, Tang HZ, Zhou KZ, Shen WH and Guo
HY: TFF3 and survivin expressions associate with a lower survival
rate in gastric cancer. Clin Exp Med. 13:297–303. 2013. View Article : Google Scholar
|
|
34
|
May FE and Westley BR: TFF3 is a valuable
predictive biomarker of endocrine response in metastatic breast
cancer. Endocr Relat Cancer. 22:465–479. 2015. View Article : Google Scholar : PubMed/NCBI
|
|
35
|
Elnagdy MH, Farouk O, Seleem AK and Nada
HA: TFF1 and TFF3 mRNAs are hgher in blood from breast cancer
patients with metastatic disease than those without. J Oncol.
2018:47934982018. View Article : Google Scholar
|
|
36
|
Terris B, Blaveri E, Crnogorac-Jurcevic T,
Jones M, Missiaglia E, Ruszniewski P, Sauvanet A and Lemoine NR:
Characterization of gene expression profiles in intraductal
papillary-mucinous tumors of the pancreas. Am J Pathol.
160:1745–1754. 2002. View Article : Google Scholar : PubMed/NCBI
|
|
37
|
Faith DA, Isaacs WB, Morgan JD, Fedor HL,
Hicks JL, Mangold LA, Walsh PC, Partin AW, Platz EA, Luo J, et al:
Trefoil factor 3 overexpression in prostatic carcinoma: Prognostic
importance using tissue microarrays. Prostate. 61:215–227. 2004.
View Article : Google Scholar : PubMed/NCBI
|
|
38
|
Huang YG, Li YF, Wang LP and Zhang Y:
Aberrant expression of trefoil factor 3 is associated with
colorectal carcinoma metastasis. J Cancer Res Ther. 9:376–380.
2013. View Article : Google Scholar : PubMed/NCBI
|
|
39
|
Yusup A, Huji B, Fang C, Wang F, Dadihan
T, Wang HJ and Upur H: Expression of trefoil factors and TWIST1 in
colorectal cancer and their correlation with metastatic potential
and prognosis. World J Gastroenterol. 23:110–120. 2017. View Article : Google Scholar : PubMed/NCBI
|
|
40
|
Lao VV and Grady WM: Epigenetics and
colorectal cancer. Nat Rev Gastroenterol Hepatol. 8:686–700. 2011.
View Article : Google Scholar : PubMed/NCBI
|
|
41
|
Feinberg AP: The epigenetics of cancer
etiology. Semin Cancer Biol. 14:427–432. 2004. View Article : Google Scholar : PubMed/NCBI
|
|
42
|
Suzuki K, Suzuki I, Leodolter A, Alonso S,
Horiuchi S, Yamashita K and Perucho M: Global DNA demethylation in
gastrointestinal cancer is age dependent and precedes genomic
damage. Cancer Cell. 9:199–207. 2006. View Article : Google Scholar : PubMed/NCBI
|
|
43
|
Okada H, Kimura MT, Tan D, Fujiwara K,
Igarashi J, Makuuchi M, Hui AM, Tsurumaru M and Nagase H: Frequent
trefoil factor 3 (TFF3) overexpression and promoter hypomethylation
in mouse and human hepatocellular carcinomas. Int J Oncol.
26:369–377. 2005.PubMed/NCBI
|
|
44
|
Vestergaard EM, Nexø E, Tørring N, Borre
M, Ørntoft TF and Sørensen KD: Promoter hypomethylation and
upregulation of trefoil factorsin prostate cancer. Int J Cancer.
127:1857–1865. 2010. View Article : Google Scholar : PubMed/NCBI
|
|
45
|
Ribieras S, Lefèbvre O, Tomasetto C and
Rio MC: Mouse Trefoil factor genes: Genomic organization, sequences
and methylation analyses. Gene. 266:67–75. 2001. View Article : Google Scholar : PubMed/NCBI
|
|
46
|
Sato N, Maitra A, Fukushima N, van Heek
NT, Matsubayashi H, Iacobuzio-Donahue CA, Rosty C and Goggins M:
Frequent hypomethylation of multiple genes overexpressed in
pancreatic ductal adenocarcinoma. Cancer Res. 63:4158–4166.
2003.PubMed/NCBI
|
|
47
|
Zheng Q, Gao J, Li H, Guo W, Mao Q, Gao E
and Zhu YQ: Trefoil factor 3 peptide regulates migration via a
Twist-dependent pathway in gastric cell. Biochem Biophys Res
Commun. 438:6–12. 2013. View Article : Google Scholar : PubMed/NCBI
|
|
48
|
Uchino H, Kataoka H, Itoh H, Sekiya R,
Onitsuka T and Koono M: Roles of intestinal trefoil factor (ITF) in
human colorectal cancer: ITF suppresses the growth of colorectal
carcinoma cells. Hum Cell. 12:181–188. 1999.
|
|
49
|
Uchino H, Kataoka H, Itoh H, Hamasuna R
and Koono M: Overexpression of intestinal trefoil factor in human
colon carcinoma cells reduces cellular growth in vitro and in vivo.
Gastroenterology. 118:60–69. 2000. View Article : Google Scholar
|
|
50
|
Chan VY, Chan MW, Leung WK, Leung PS, Sung
JJ and Chan FK: Intestinal trefoil factor promotes invasion in
non-tumorigenic Rat-2 fibroblast cell. Regul Pept. 127:87–94. 2005.
View Article : Google Scholar : PubMed/NCBI
|
|
51
|
Lin J, Sun Z, Zhang W, Liu H, Shao D, Ren
Y, Wen Y, Cao L, Wolfram J, Yang Z, et al: Protective effects of
intestinal trefoil factor (ITF) on gastric mucosal epithelium
through activation of extracellular signal regulated kinase 1/2
(ERK1/2). Mol Cell Biochem. 404:263–270. 2015. View Article : Google Scholar : PubMed/NCBI
|
|
52
|
Perera O, Evans A, Pertziger M, MacDonald
C, Chen H, Liu DX, Lobie PE and Perry JK: Trefoil factor 3 (TFF3)
enhances the oncogenic characteristics of prostate carcinoma cells
and reduces sensitivity to ionising radiation. Cancer Lett.
361:104–111. 2015. View Article : Google Scholar : PubMed/NCBI
|
|
53
|
Liu J, Kim SY, Shin S, Jung SH, Yim SH,
Lee JY, Lee SH and Chung YJ: Overexpression of TFF3 is involved in
prostate carcinogenesis via blocking mitochondria-mediated
apoptosis. Exp Mol Med. 50:110–117. 2018. View Article : Google Scholar : PubMed/NCBI
|