Introduction
Few markers, such as receptor tyrosine kinases
(RTKs) from the epidermal growth factor receptor (EGFR) family, are
currently used in clinical practice to estimate patient prognosis
or determine the appropriate treatment course. However, some
patients continue to develop metastasis, thus indicating the need
for novel clinical markers and therapeutic targets.
Members of the Eph (from the
erythropoietin-producing hepatocellular cell line where it was
first cloned) receptors have been found to be overexpressed in
screens of RTKs in cancer (1,2). The
Eph receptor was first identified in an erythropoietin-producing
human hepatocellular carcinoma cell line (ETL-1) (3) in an effort to discover novel tyrosine
kinase receptors. This family now constitutes the largest family of
RTKs participating in cell-to-cell communications and tissue
integrity during embryogenesis, as well as in cell proliferation,
survival and motility, which are crucial steps towards the
development of metastases (1,4).
The Eph receptors and their ligands, eph receptor
interacting proteins (ephrins) interact upon cell-to-cell contacts
triggering bidirectional signals both inside the Eph (so-called,
forward signal) and the ephrin-expressing cells (so-called, reverse
signal). The forward signal is believed to suppress the tumor,
while the reverse signaling is thought to promote tumor growth.
Thus, Eph receptor and ephrin signaling is complex, leading to
paradoxical results both in vitro and in vivo
(1).
EphB4 and EphA2 are some of the most extensively
studied Eph receptor family members in breast cancer. EphA2 is
related to a poor breast cancer prognosis and resistance to
trastuzumab (5) and tamoxifen
(6-9). EphB4 overexpression has been shown to
be associated with a poor patient outcome and may be a survival
factor for breast cancer cells (6,10,11).
However, the results are still controversial: EphB4 could be highly
expressed in breast cancer cell lines compared to non-transformed
epithelial cells (12); however,
in clinical samples, the receptor has been shown to be associated
with a low histological grade and it is expressed at lower levels
in invasive carcinomas compared to normal breast tissue (13).
The tumorigenic properties of EphB4 may manifest in
the absence of its preferred ligand, ephrin-B2, as suggested by
EphB4 upregulation in mammary epithelial cells, where the
expression of the ligand ephrin-B2 seems to be lost (14). Previous results have indicated that
stimulation with a soluble ephrin-B2-Fc ligand inhibits tumor
formation and growth in a breast cancer xenograft model (12).
Therefore, in this study, we wished to address the
question whether the re-expression of ephrin-B2 in breast cancer
cells, where the EphB4 receptor is present, could inhibit the
tumorigenic properties of these cells. To examine the effects of
EphB4 and ephrin-B2 co-expression in vitro, we used two
lentiviral vectors to stably infect MCF7 cells with a wild-type
EFNB2 (B2-WT) or a mutant EFNB2 (B2-5F) which is
unable to transmit reverse signaling. We found that the
EFNB2-expressing cells (MCF7-B2) exhibited a lower
proliferation, formed less foci and had an impaired cell motility.
The MCF7-B2 cells were also less responsive to growth
factor-induced migration. In particular, the mutant B2-5F cells,
only able to transmit the forward signal, exhibited a decreased
expression of several genes involved in cell motility.
Of note, similar results were observed in our
patient material where ephrin-B and EphB4 protein expression were
investigated by immunohistochemistry in paraffin-embedded tissues
from 216 patients. Ephrin-B2, but not EphB4 expression indicated a
longer metastasis-free survival in both univariate and multivariate
analyses compensating for known clinical markers. Moreover, a
validation survey in public datasets confirmed that a high
EFNB2 gene expression was associated with a longer distant
recurrence-free survival, whereas a high EPHB4 expression
indicated a poor prognosis, particularly for the group of patients
whose tumors expressed EPHB4 in the absence of EFNB2.
Altogether these results suggest that ephrin-B2 may have clinical
value in breast cancer.
Materials and methods
Cell culture and lentiviral
infection
MCF7 cells were purchased from the American Type
Culture Collection (ATCC® No. HTB-22), which also
validated the cell identity as Luminal A. In addition, a PCR
Mycoplasma Test kit I/C from PromoKine (PromoCell GmbH) was used to
periodically examine the cells for mycoplasma infection. The cells
were routinely cultured in Eagle's MEM medium (Gibco, Thermo Fisher
Scientific) containing 2 mM L-glutamine and further supplemented
with Earle's Balanced Salt Solution, 1.5 g/l bicarbonate, 0.1 mM
non-essential amino acids, 1 mM Na pyruvate, 10 µg/ml bovine
insulin, 10% FBS and antibiotics (12). For lentiviral infection, the MCF7
cells were seeded at a density of 60×103 cells/well in a
24-well plate. Following overnight incubation at 37°C in a
CO2 incubator, the cells were infected with the
following multiplicities of infection (MOI): The GFP
(MOI=5), GFP-EFNB2-WT (MOI=7) or GFP-EFNB2-5F
(MOI=10). Lentiviral vectors were added in the presence of
polybrene (3 µg/ml) (Millipore) and the supernatant was
removed 16 h post-infection. Green fluorescent cells, i.e.,
successfully transduced cells, of similar intensity were sorted by
FACS and maintained in culture for use in further experiments.
Ephrin-B2 expression was periodically controlled by fluorescence
microscopy using a Radiance Multiphoton Laser Point Scanning
Confocal Microscope or by immunoblotting.
Antibodies, siRNAs and vectors
Primary antibodies used for immunoblotting and/or
immunoprecipitations were as follows: Mouse anti-EphB4 (clone
3D7/G8, cat. no. 37-1800, Zymed/Invitrogen), mouse anti-pan
ephrin-B (clone 2D3E6 cat. no. 37-8100, Zymed),
anti-phosphotyrosine-conjugated with HRP (4G10, cat. no. 05-321,
Millipore), mouse anti-GAPDH (cat. no. ab185059, Abcam), rabbit
anti-GFP (cat. no. GTX20290, GeneTex), rabbit anti-signal
transducer and activator of transcription 3 (STAT3), purchased from
Cell signaling Technology (cat. no. 87685 and anti-SH3 and PX
domains 2A (SH3PXD2A), obtained from Nordic Biosite (cat. no.
AP16560a). Secondary polyclonal antibodies conjugated with
horseradish peroxidase (HRP) goat anti-rabbit (cat. no. P0448) and
goat anti-mouse (cat. no. P0447) were purchased from Dako (Dako
Denmark) For the EphB4 antibody validation the following siRNAs
were used: FlexiTube EphB4 GS0250 (#1; SI00063748, #2; SI00288596,
#3; SI00063791, #4; SI00288589. Further, we used the AllStar
Negative Control (SI03650318, Qiagen) and the Silencer Control
GAPDH Positive Control (Life Technologies, Thermo Fisher
Scientific). Plasmids and lentiviral vectors were as follows: Mouse
ephrin-B2 (GenBank accession no. NM_010111.5) with an N-terminal
eGFP tag inserted between a signal peptide and the mature coding
sequence (15,16) was cloned into the
pCCLsin.PPT.hPGK.GFP pre-lentiviral vector (17) replacing the eGFP insert of the
vector. A mouse tyrosine phosphorylation-deficient ephrin-B2
(ephrin-B25F), in which tyrosine residues at 307, 314, 319, 333 and
334 were substituted with phenylalanine was modified by PCR-based
techniques. The pCCLsin.PPT.hPGK.GFP pre-lentiviral vector encoding
eGFP was used as a control. All PCR-amplified and mutated cDNAs
were verified by sequencing (18).
The viral vectors were a gift from Dr Ombretta Salvucci (Basic
Research Laboratory, Laboratory of Cellular Oncology, NIH/NCI,
Bethesda, MD, USA).
Immunoblotting and
immunoprecipitations
MCF7 cells were seeded in complete medium into 60-mm
plates (5×10⁵ cells/plate) for immunoprecipitation and
immunoblot-ting. The cells were lysed in cold RIPA buffer
supplemented with a protease inhibitor cocktail (Cat. no. P2850,
Sigma). The total protein concentration was calculated by BCA assay
(Pierce, Thermo Fisher Scientific) and the samples were adjusted to
the same concentration prior to further experiments. Total cell
lysates were diluted with 2X Laemmli sample buffer and boiled for 5
min at 95°C prior to electrophoresis. For immunoprecipitation, cell
lysates were further diluted to 1 ml in RIPA buffer, added to the
tubes with the primary antibody and the beads (gamma bind Plus
Sepharose, GE Healthcare) and rocked for 1 h at 4°C. The
supernatant was discarded after repeated centrifugation steps at
14,000 rpm at 4°C and the beads remaining in the pellet were washed
and boiled at 95°C for 5 min. For SDS-PAGE, equal amount of protein
was loaded/sample in a gradient TGX gel 4-15%. Primary antibodies
(at the indicated dilutions) were incubated overnight at 4°C to
detect ephrin-B (1:200), total phosphotyrosines (1:1,000), GAPDH
(1:5,000) or GFP (1:1,000) in the total lysates or the
immunoprecipitates. HRP-conjugated secondary antibodies were
diluted 1:2,000 in 5% milk blocking buffer and incubated for 1 h at
room temperature. The free software ImageJ v1.4 (N.I.H, USA) was
used to estimate the relative band intensity in the blots. Briefly,
the same region of interest (ROI) was selected for all the bands
and the corresponding background below each band for both, the
protein of interest and the loading control. The pixel density
(intensity) of each band and its corresponding background was
measured. Net values after subtracting the background were used to
calculate the relative ratio protein of interest/loading
control.
Immunofluorescence
The MCF7 cells were seeded in coverslips coated with
10 µg/ml human fibronectin (Millipore) and fixed in 3.7%
formaldehyde/PBS for 15 min. The slides were prepared with
anti-fading mounting medium containing DAPI and examined in an
Inverted Nikon Eclipse TE300. Images were analyzed with the
software SPOT advanced version or in a LM Zeiss inverted confocal
microscope at ×600 magnification.
Cell proliferation, spheroid and colony
formation assays
Prior to each experiment, the cells were counted and
adjusted to the indicated cell density: For cell proliferation
5×10³ cells were plated in 100 µl complete
medium/well in 96-well plates in quadruplicate and harvested daily
for up to 5 days. Cell proliferation was estimated by MTT assay
following the protocol recommendations. Briefly, 15 µl of
MTT stock solution at 0.5 mg/ml were added to each well and
incubated for 4 h in a CO2 incubator at 37°C. The amount
of MTT product, dissolved in 0.2 ml DMSO, was estimated at 570
nm.
For the spheroid formation assay, the cells
(1×10³/100 µl) were seeded in ultra-low cluster
96-well plates (Costar, Corning 7007). The spheroid formation was
initiated by centrifuging the plates at 1,000 × g for 10 min at
room temperature using a centrifuge with swinging buckets. The
plates were incubated for up to 11 days and the medium was renewed
every second day. The spheroid formation was monitored after 1, 3,
7 and 11 days. Each time the fluorescent area occupied by the
spheroids from 10 wells was calculated with the free software Image
J v.1.4.
The ability of the cells to form colonies was
investigated using a colony formation assay where 103
cells were plated in 2 ml/well in 6-well plates and supplemented by
replacing 1 ml medium every other day for up to 11 days.
Fluorescent colonies were photographed in an Inverted Nikon Eclipse
TE300 equipped with a camera coupled to the microscope and the
images analyzed with the software SPOT advance version on the last
day before removing the culture medium. Subsequently, the cells
were washed and fixed with 3.7% paraformaldehyde for 15 min at room
temperature. The cells were then stained with 1% crystal violet
solution for 30 min. The excess of dye was washed away and the
plates were scanned. In order to quantify the colonies, the cells
were dissolved in 1% SDS/PBS solution and the supernatants were
transferred to 96-well plates to determine the optical density at
570 nm.
Transwell assay
Transwell assay was used to measure the ability of
the cells to migrate through a membrane toward a gradient of growth
factors. Cell inserts with 8 µm pore membrane (cat.# 353182,
BD Bioscineces) were coated with human fibronectin (10
µg/ml) and introduced into the wells of a 12-well plate.
Following overnight incubation at 4°C, the inserts were washed and
blocked for 1 h with 1% BSA/PBS. The cells were detached with the
enzyme acutase (Sigma) and centrifuged for 5 min at 1,200 rpm at
room temperature to wash the pellet in starvation medium (medium
w/o insulin and 0.5% FBS). The cells were placed in the insert at a
density of 1×10⁵ cells/0.2 ml starvation medium. A
growth factor gradient was created in the wells by first adding a
mixture of 5 ng/ml heregulin-β1 (HRGβ1) and epidermal growth factor
(EGF) at the bottom of the wells and then filling up with 1.2 ml
starvation medium. Cell migration was assessed after 20 h of
incubation in 5% CO2 and 37°C. The cells remaining at
the top of the insert membrane were removed with cotton tip
applicators, repeating the operation at least 5 times. The
remaining cells in the lower part of the insert membrane were fixed
with 3.7% formaldehyde, permeabilized with 0.1% triton and stained
with Hoechst (1 µg/ml) for 10 min. The membranes were cut
and mounted with the bottom facing up with prolong anti-fading
mounting medium (Molecular Probes). Images of 6-10 random fields
were acquired at ×100 magnification using an inverted fluorescence
microscope Zeiss Axiovert A1.
Wound-healing assay
Two-dimensional invasion assays were performed to
assess lateral migration. Silicon culture inserts inside a 35-mm
dish were used (ibidi). The growth area/well was 0.22
cm2, allowing up to 70 µl culture medium. The
inserts were filled with 8×10⁴ cells to allow
confluence. Upon cell attachment, the cell monolayer was washed
twice with PBS and starved overnight. The following day, the
inserts were removed leaving a 500±50 µm wound and the dish
was washed to remove unattached cells and then refilled with 2 ml
complete medium. Images at ×40 magnification of two different areas
of the wound were acquired at several time points between 0 h
(control) and 45 h. The wounded area between the two migrating
layers of fluorescent cells was calculated using public software
Image J v1.4 (NIH).
Cell motility PCR array
RNA was extracted from 5×10⁶ cells with
mini RNeasy kit (Quiagen). Cell lysis was performed in 0.5 ml lysis
buffer supplied by the kit. The RNA concentration was calculated
using a nanodrop spectrophotometer and the RNA quality using the
Bioanalyzer (Agilent) with the RNA 6000 Nano kit. The RNA
concentration was adjusted to 250 ng/µl. A 96-well plate
format of the human cell motility RT2 Profiler™ PCR
Array (Qiagen) was used to analyze the expression of 84 genes
involved in cell motility. PCR reactions were performed on ABI
Prism 7900.
For data analysis, the Ct and baseline were
calculated and exported to the online tool RT2 profiler
PCR array data analysis v3.5 (Qiagen). The housekeeping genes in
the experiment were B2M, HPRT1, RPL13A,
GAPDH and ACTB. The formula used to calculate the
relative gene expression level [2^(-ΔCt)] was the following: ΔCt=Ct
(gene of interest)-avg. Ct (housekeeping genes). The formula
2^(-ΔΔCt) was used to calculate fold changes between the test
samples (cells expressing ephrin-B2) and control samples
(GFP-expressing cells). The experiment was performed in triplicate
in 3 independent occasions. Differential expression ≥2 was reported
in the figures at a significance level of P<0.05.
Patient material
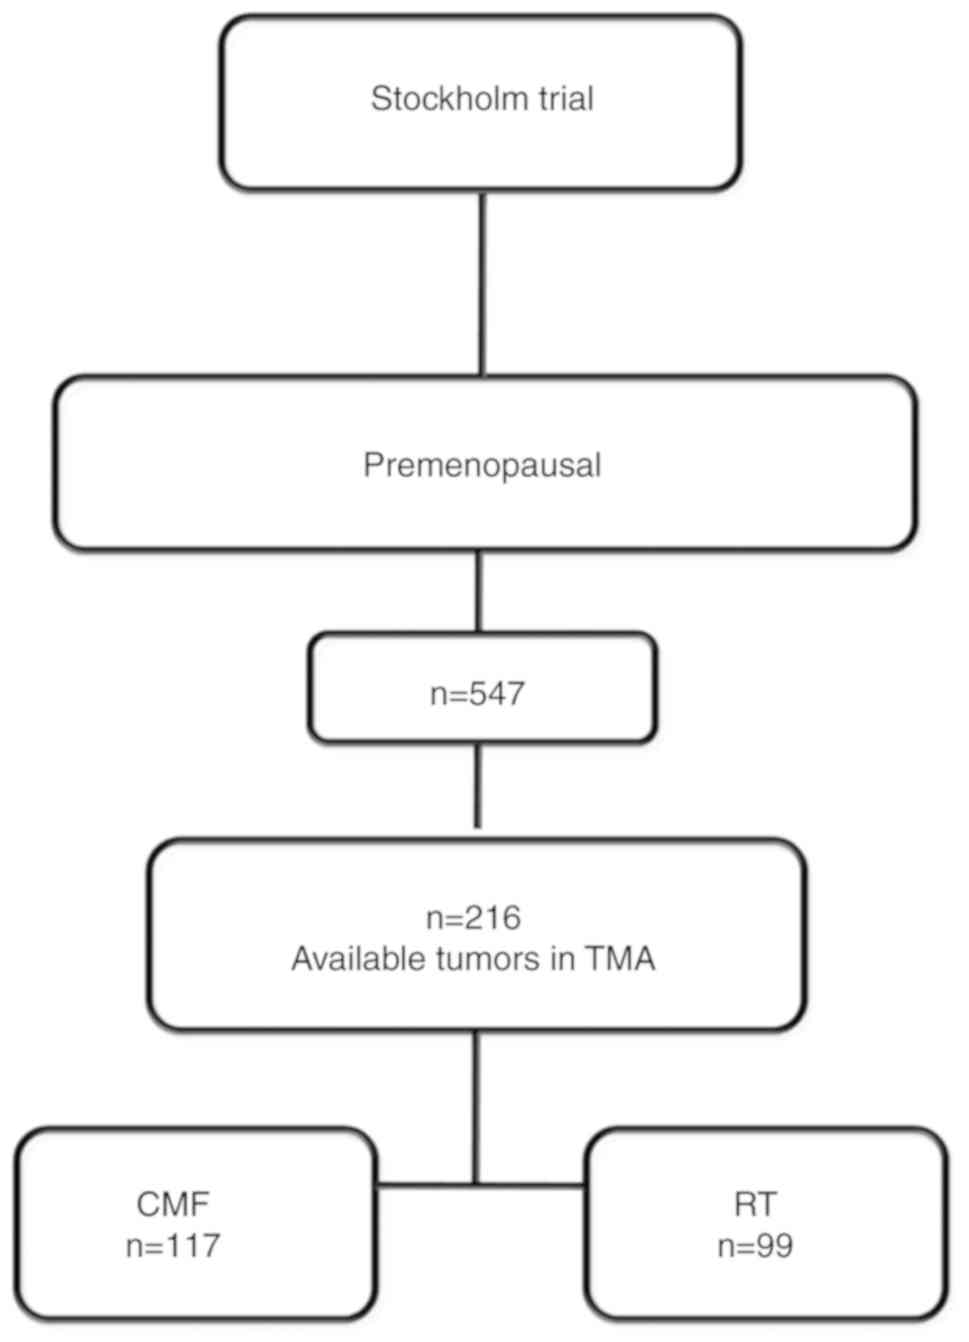
Tumor samples were collected within the Stockholm
clinical trial (1976-1990) (19).
The trial included pre-menopausal and post-menopausal women with a
unilateral, operable breast cancer. Only pre-menopausal patients
were included in this study. The surgical procedure was modified
radical mastectomy. Further inclusion criteria were either
histologically verified lymph node metastasis or a tumor diameter,
exceeding 30 mm, measured on the surgical specimen. Patients were
randomized to receive either adjuvant chemotherapy or radiotherapy.
Patients in the chemotherapy group received 12 courses of
cyclophosphamide, methotrexate, 5-fluorouracil according to the
original Milan protocol (100 mg/m2 cyclophosphamide
orally at days 1-14, 40 mg/m2 methotrexate and 600
mg/m2 5-fluorouracil intravenously on days 1 and 8).
However, during the first 18 months of the trial, 10-15 mg
chlorambucil was administered orally on days 1-8 instead of
cyclophosphamide and to avoid dose reductions up to 18 months
treatment time was allowed for the last 12 courses. Patients
randomized to radiotherapy, received a dose of 46 Gy with 2 Gy per
fraction 5 days a week. Total treatment time was approximately 4.5
weeks and the target volume included the chest wall, the axilla,
the supraclavicular fossa and the internal mammary nodes. Estrogen
receptor (ER) (19) and human
epidermal growth factor receptor 2 (HER2) protein level (20) clinical variables were obtained from
previous studies. The initial material included 547 pre-menopausal
patients. Formalin-fixed and paraffin-embedded tissues from 216
patients were available on tissue microarray (TMA) and included in
this study (Fig. 1). Patient
characteristics did not significantly differ from the ones included
in the larger Stockholm trial (21).
Immunohistochemistry
The patient material used to explore EphB4 and
ephrin-B protein expression was included in TMA slides. Breast
cancer samples from 216 patients from the Stockholm II trial were
analyzed as previously reported (21). Briefly, the slides were baked for 2
h at 60°C before the PT-Link system (Dako) was used at pH 6.0 for
20 min at 97°C for deparaffinization, rehydration and antigen
retrieval. Primary antibodies were diluted 1:50 (mouse anti-EphB4)
or 1:200 (mouse anti-pan ephrin-B) with overnight incubation at
4°C. The HRP-conjugated secondary antibody (Envision+System-HRP
Labelled-Polymer anti mouse, Dako, Ref#4002) was used with
incubation for 30 min. Cell nuclei were counterstained with Mayer's
Hematoxylin prior to stepwise dehydration in an ethanol gradient.
Images were acquired with the Aperio Scanscope AT Turbo (Leica
Biosystems) with 20×/0.75 NA Plan Apo at ×20 magnification. The
software Aperio ImageScope v.11 was used for image analysis and the
free software ImageJ v.1.440 (NIH, USA) was used to quantify the
intensity of the bands when validating the EphB4 antibody by
immunoblotting.
Public gene expression datasets
The exploratory study was performed in the following
gene expression datasets: Karolinska Institute (KI) (GSE1456,
n=159) (22) and van de Vijver
(n=295) (23) and http://bioinformatics.nki.nl/data.php.
For the statistical analysis, the EFNB2 gene expression data
were divided into quartiles (q) where q1 was defined as low
expression and q2-4 was high expression. When several probes were
used to detect the mRNA expression (KI) and the probes were
positively correlated, the average of the gene expression data was
used for the analysis. For EPHB4, q1-3 was low and q4 was
high expression.
Statistical analyses
The statistical analysis for protein expression, in
the clinical material, was performed using Statistica 64 version
12.0 software (StatSoft. Inc.). The association with known clinical
variables in breast cancer was tested with the Pearson's Chi-square
or Spearman's rank correlation tests. Cox regression was used in
univariate and multivariate analyses to examine whether there was
an independent association between EphB4 and ephrin-B protein
expression and the presence of distant metastases, local metastasis
or death due to breast cancer. The survival analysis to estimate
probabilities for distant recurrence-free survival (time from
surgery until distant metastasis was detected), loco regional
recurrence-free survival (time from surgery until loco-regional
recurrence was detected) and breast cancer-free survival (period
from surgery until death due to breast cancer) was performed by
comparing survival in multiple samples and represented with the
Kaplan-Meier plots with the indicated hazard ratios, calculated
with the Cox proportional hazards model. The statistical analysis
for the in vitro part was carried out using software Prism
from GraphPad Software. Statistically significant differences
between the controls and B2-expressing cells were assessed by ANOVA
followed by Bonferroni's multiple comparison post hoc test.
Otherwise, the unpaired t-test was used when comparing 2 groups.
The experiments were repeated at least 2 times and each experiment
included >3 replicates.
Results
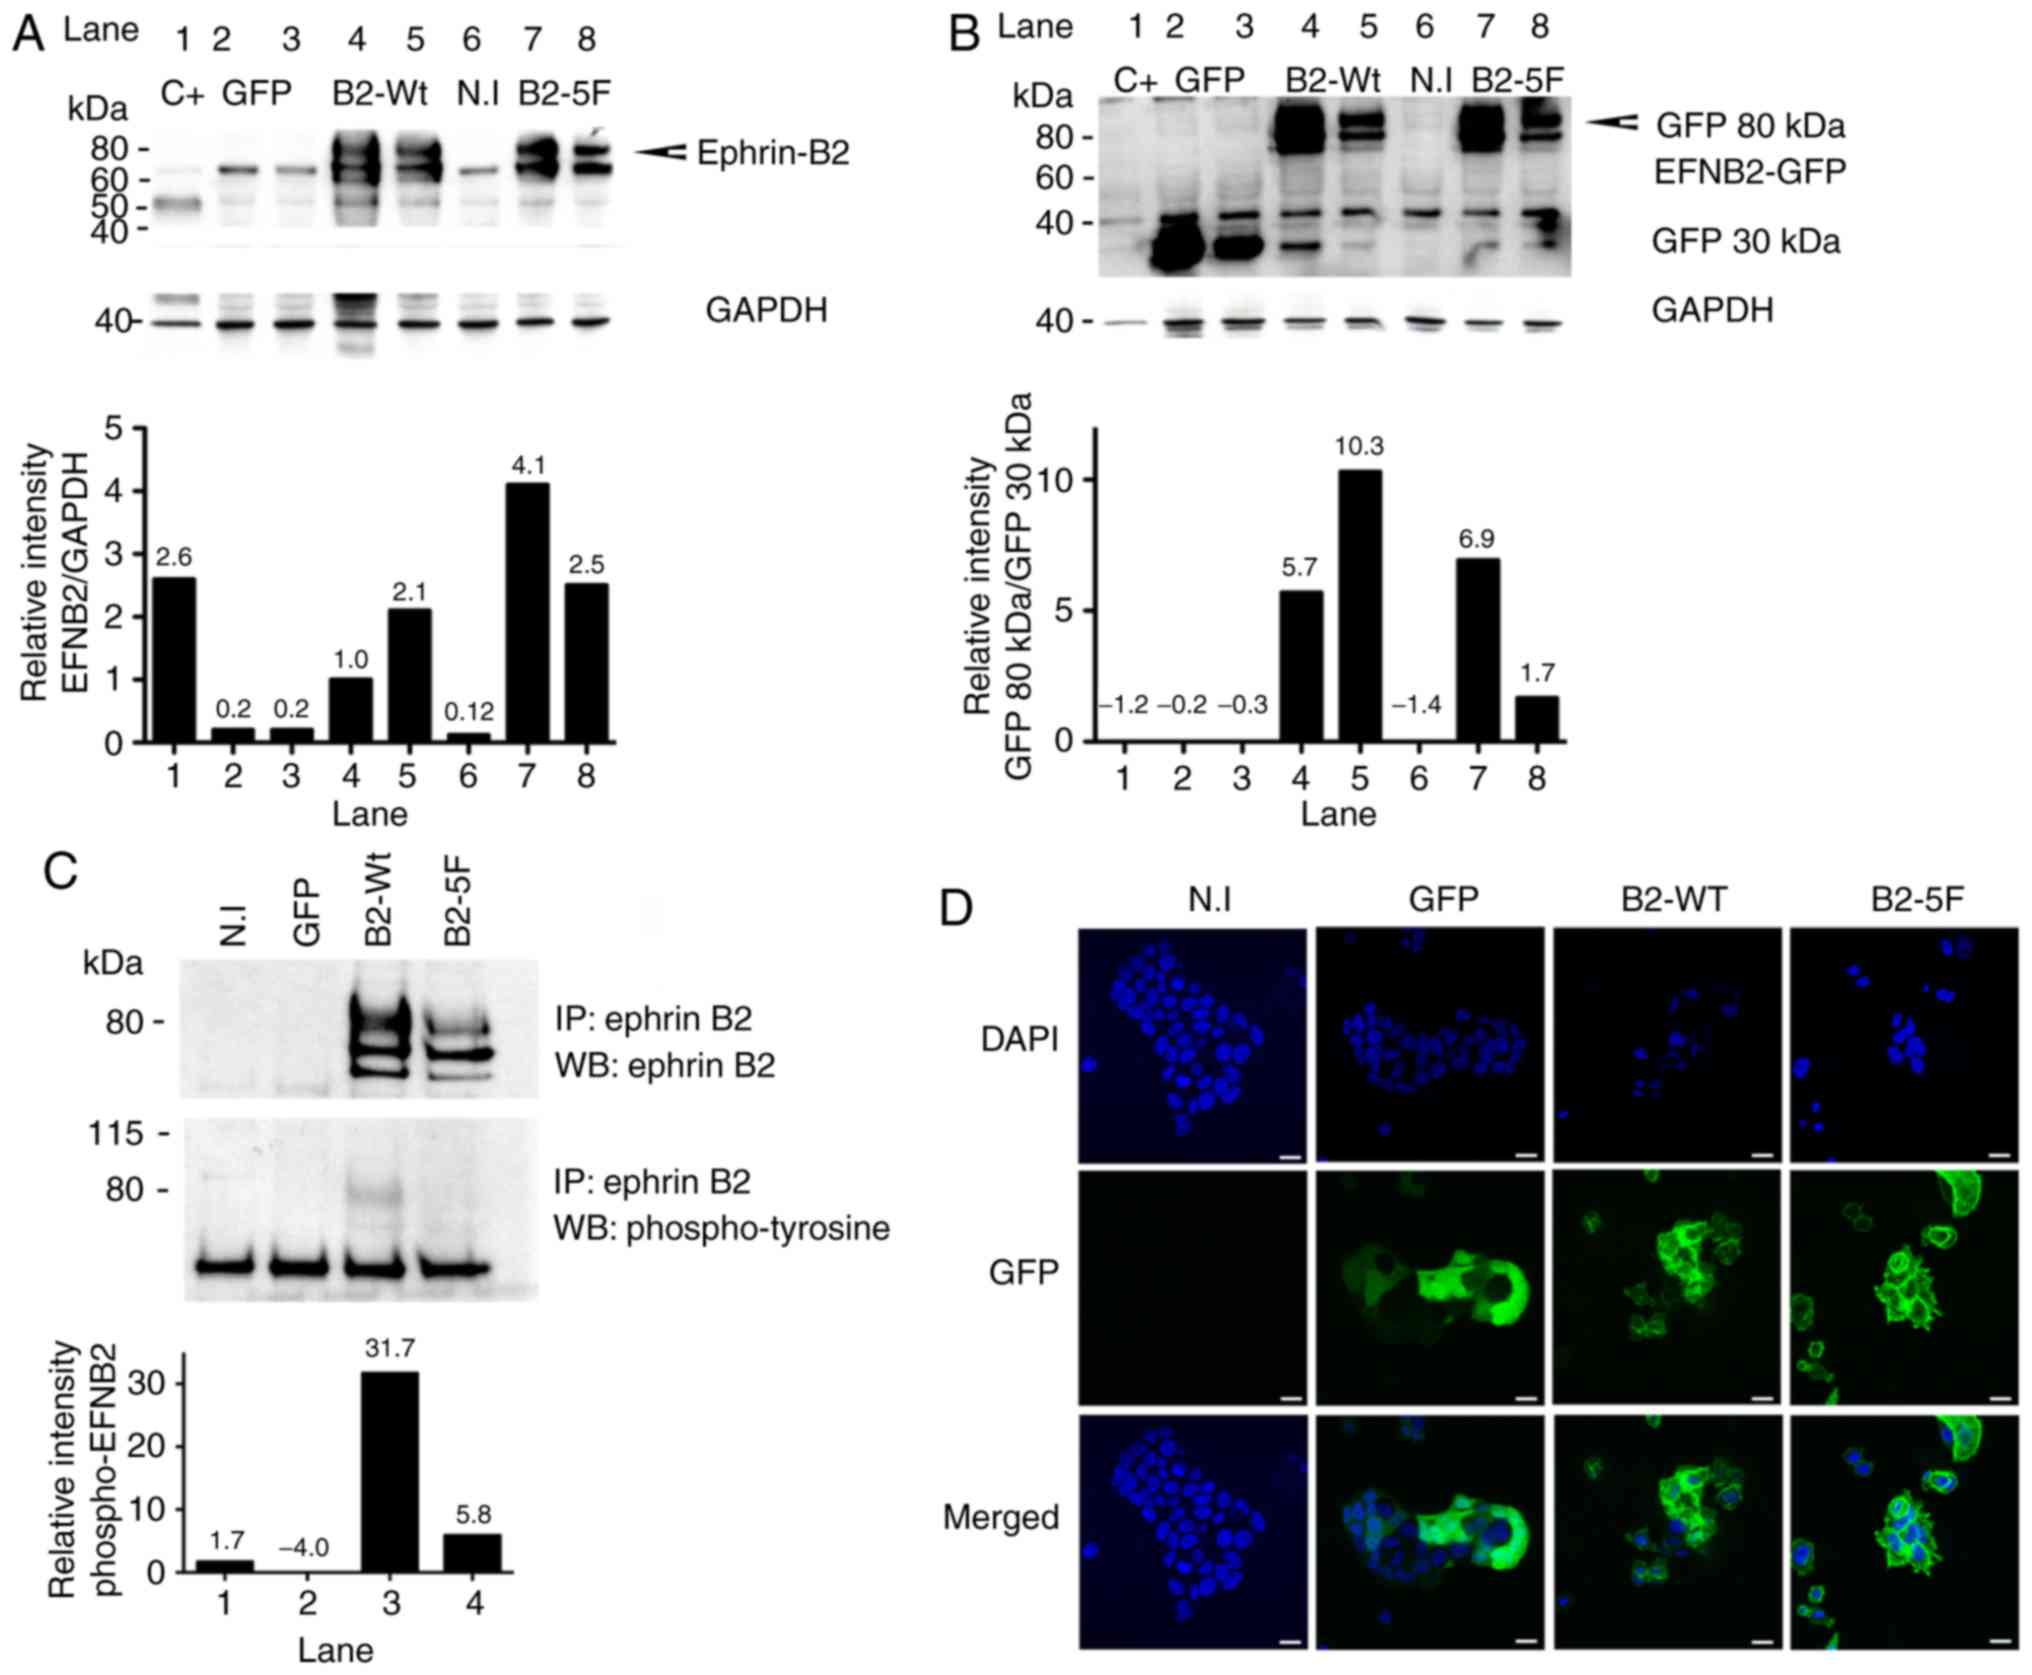
Ephrin-B2 expression in MCF7 cells
Previous research has demonstrated that breast
cancer cell lines, in particular MCF7 cells, express low levels of
ephrin-B2 in the presence of high EphB4 receptor levels (12). Lentiviral vectors encoding GFP
fusion proteins with either wild-type ephrin-B2 (B2-WT) or a
phosphotyrosine-deficient ephrin-B2 (B2-5F) were used to
overexpress ephrin-B2 in MCF7 breast cancer cells. Ephrin-B2
expression was monitored by immunoblotting (Fig. 2A and B) and by immunoprecipitation
(Fig. 2C).
Ephrin-B2 was tyrosine-phosphorylated in the B2-WT
cells, but not in the B2-5F cells as was expected. B2-5F cells
contain 5 phenylalanine residues instead of tyrosines in the
carboxyterminal domain, which renders the protein unable to
transduce phosphotyrosine-dependent-reverse signaling (see
antibodies, siRNAs and vectors). Ephrin-B2 expression was also
visualized by immunofluorescence allowing for the tracking of the
ephrin-B2 protein to the cell membrane in contrast to the GFP
control, that was scattered throughout the cells (Fig. 2D).
After the first screening, the MCF7-infected cells
were sorted by flow cytometry and used in all the experiments
thereafter.
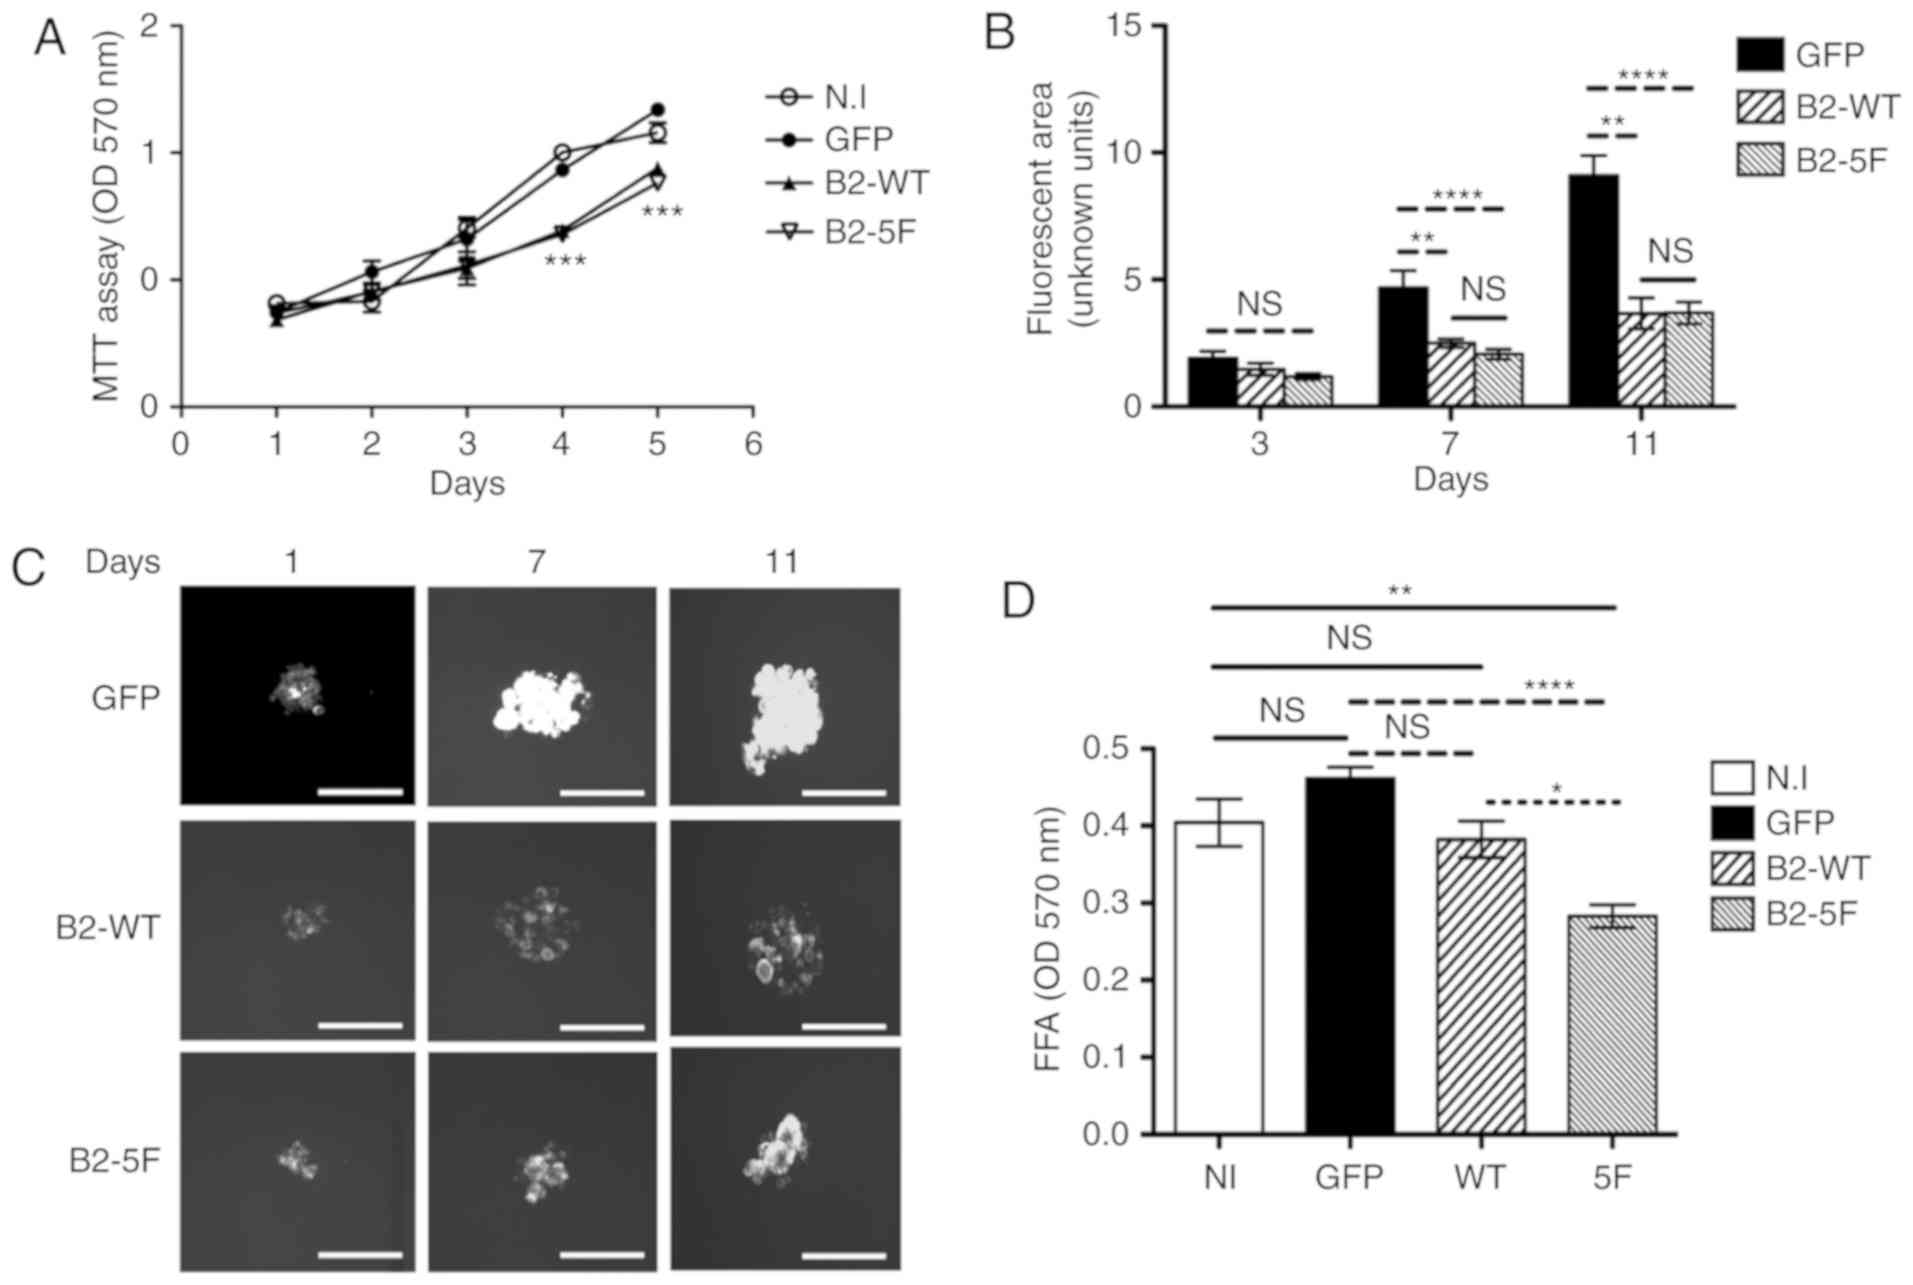
Cell proliferation, spheroid and focal
formation assays
The B2-WT and B2-5F cells exhibited a lower
proliferation compared to the control cells (Fig. 3A) with statistically significant
differences after 3 days in culture. However, no differences were
observed between the B2-WT and the B2-5F cells. The B2-WT and B2-5F
cells formed smaller spheroids under low attachment conditions
compared to the control cells (Fig. 3B
and C). Statistical differences between B2-WT and B2-5F
compared to control cells, were appreciated after 7 days in
culture. However, no marked differences in spheroid size were
identified between the B2-WT and B2-5F cells. By contrast, the
B2-5F cells exhibited a decreased colony formation ability compared
to the B2-WT and control cells. However, no marked differences were
observed as regards colony formation between the B2-WT and control
cells (Fig. 3D).
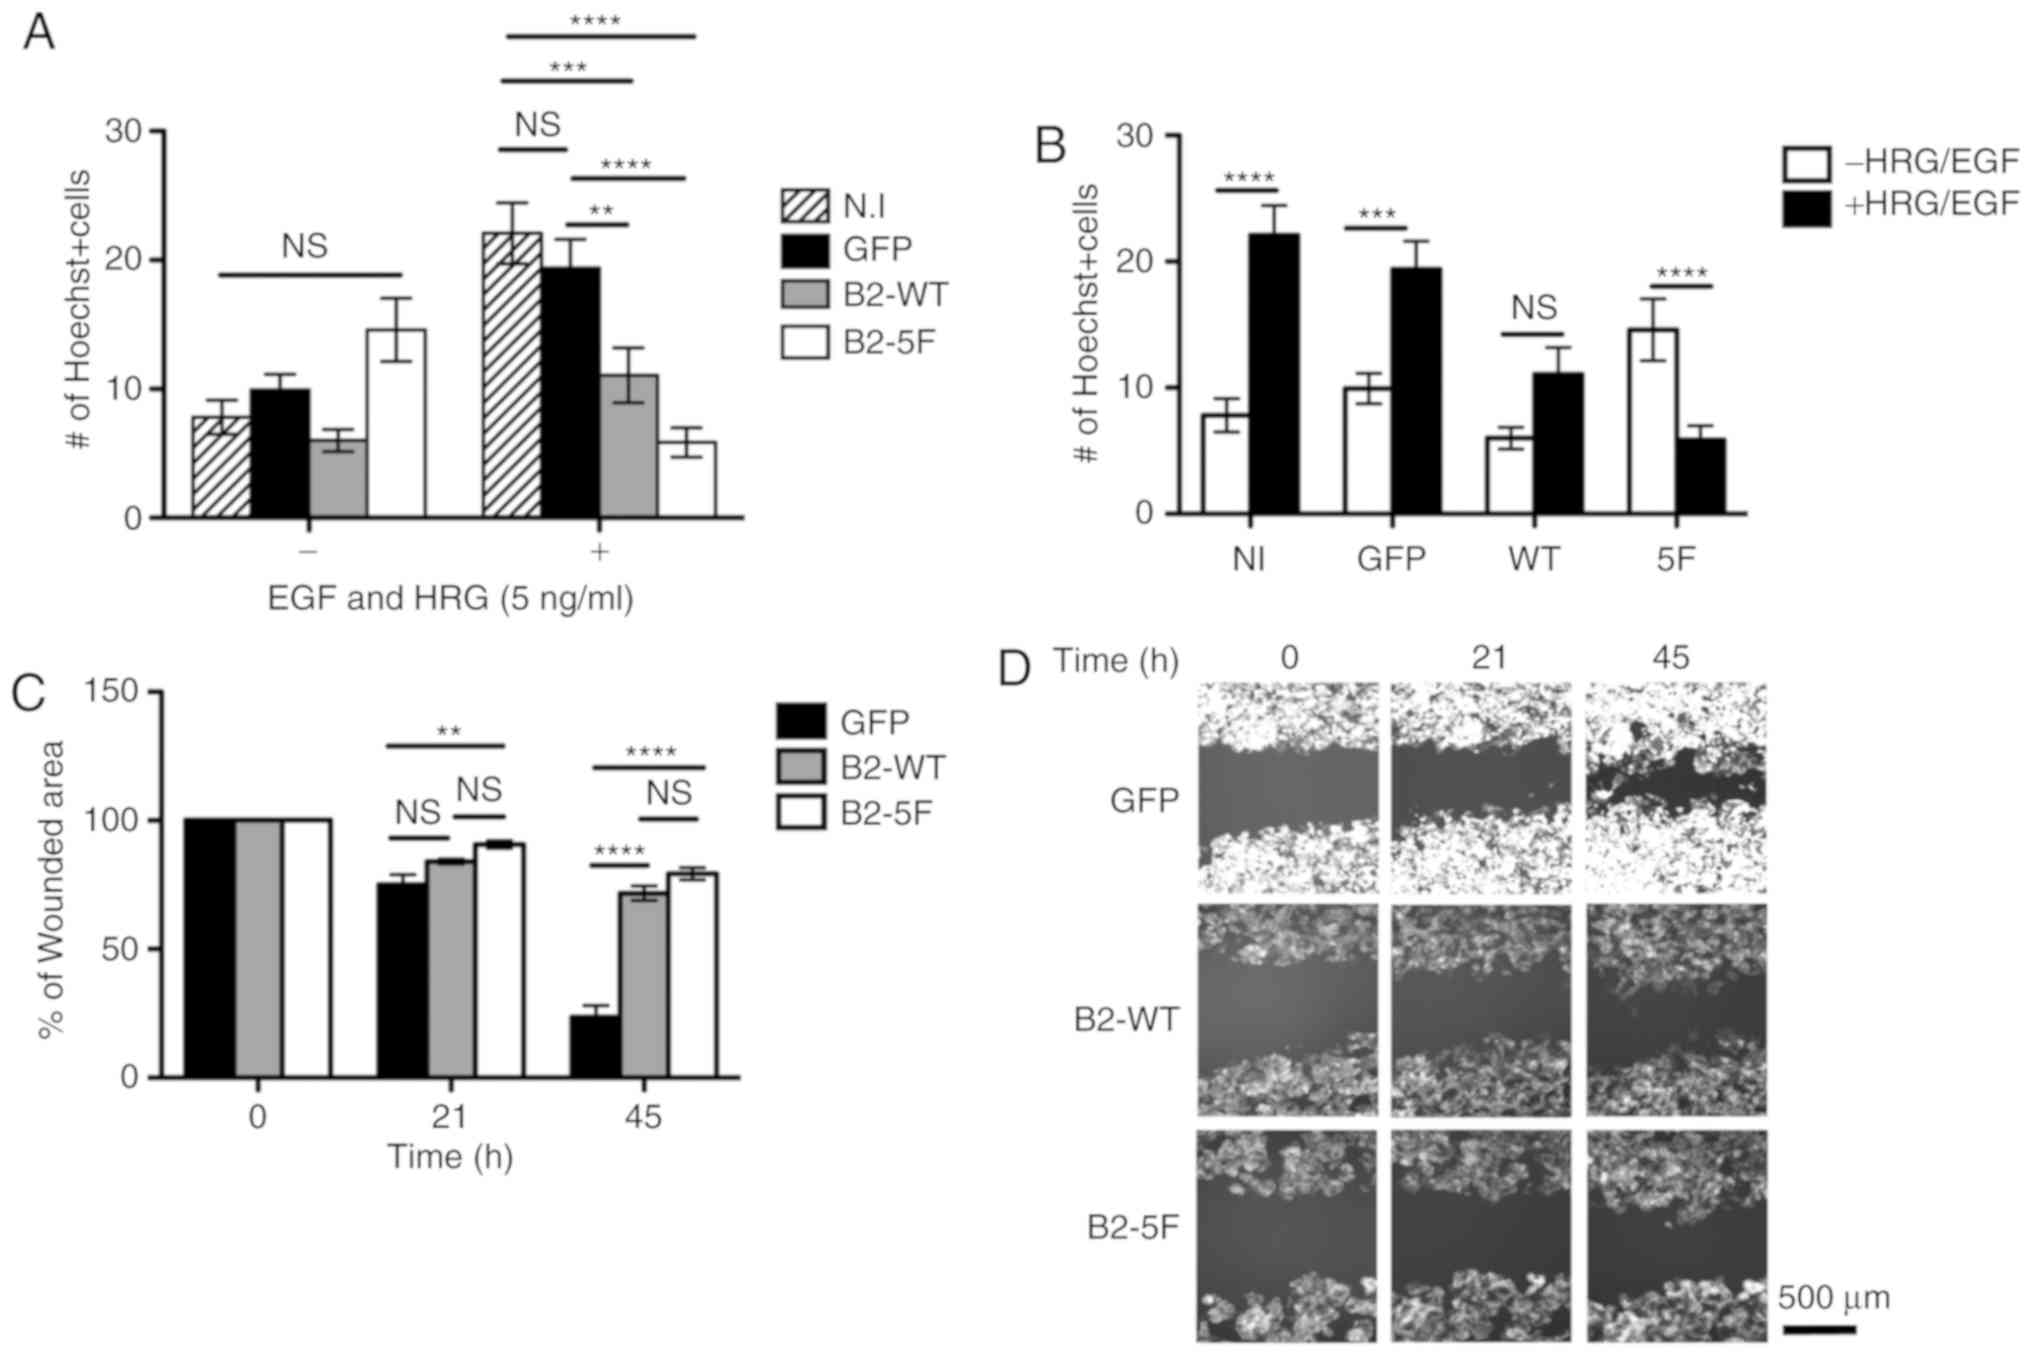
Migration assays
The results of Transwell migration assay presented
in Fig. 4A revealed that, in the
absence of growth factors (−), no significant differences in
migration were observed between the cells. However, when challenged
with EGF and HRG-b1, which stimulate migration, the scattering and
proliferation of MCF7 control cells (24,25),
the B2-WT and B2-5F-expressing cells migrated less compared to the
control cells. The results presented in Fig. 4B revealed that while the treated
control cells migrated more compared to the untreated cells, the
B2-WT cells did not exhibit a significant difference in migration
and only the migration of the treated B2-5F cells was significantly
inhibited compared to the untreated counterparts. The lateral
migration assay presented in Fig. 4C
and D, reveled similar results: Ephrin-B2 expression
contributed to defective migration into the wounded area. since
both the B2-WT and B2-5F-expressing cells exhibited lower lateral
migration compared with the control cells.
These results suggested that the B2-WT and
B2-5F-expressing cells had a delayed cell motility compared to the
control cells. Of note is that the defect in cell motility was
significant in the B2-5F cells already after 21 h compared to 45 h
that it required for the B2-WT cells. This delay in cell motility
may be due to perturbations in the movement direction, as suggested
in Videos S1-3.
Cell motility array
The human cell motility array, including 84 genes,
was performed to identify the relevant genes behind the impaired
movements of the B2-WT and B2-5F cells. Table SI summarizes the genes that were
altered >2-fold between the control cells and B2-expressing
cells. In order to identify the genes which are crucial for
phosphotyrosine-mediated signaling, we analyzed the differences in
gene expression between the B2-WT and B2-5F cells. The selected
genes were those with >2-fold significant differences (P-value
<0.05). WT-B2 expression in the MCF7 cells led to the
dysregulation of several genes towards both up- and downregulation.
However, the B2-5F cells consistently exhibited gene
downregulation, in agreement with the results from the cell
migration assays, where these cells had a significantly impaired
motility. STAT3 and the SH3 and PX Domains 2A
(SH3PXD2A) were used to verify whether the gene expression
changes were also present at the protein level. In agreement with
the gene expression array, both proteins were downregulated in the
B2-5F compared to B2-WT cells. STAT3 but not SH3PXD2A, was
upregulated in B2-WT compared to the GFP control (Fig. S1).
Immunohistochemistry for protein
expression
The obtained patient material was used to examine
the association between protein expression and the prognostic
relevance of ephrin-B and EphB4. The staining was evaluated in
three separate core biopsies by 2 individual observers (JS and ZM)
blinded to the clinical data. The sections were re-evaluated upon
disagreement. EphB4 and ephrin-B were visualized in the cell
membrane, cytoplasm and nucleus. The cytoplasmic and membrane
staining were based on intensity (0=negative/weak, 1=medium and
2=strong). We also observed that some samples exhibited strong and
defined membranous staining around the nuclei (perinuclear
staining). Thus, the cut off for positive cytoplasmic staining was
>0 and for positive membranous staining =2. Nuclear staining was
graded according to the frequency of positive cells: 0, 1-25%,
>25-50%, >50%-75% and >75%. Positive EphB4 expression was
defined as nuclear staining in >75% of the cells. Positive
ephrin-B staining was defined as strong membrane staining and
perinuclear staining (Fig. 5).
Positive ephrin-B expression negatively correlated
with Nottingham histologic grade (NHG) III (r=-0.162) and HER2
expression (r=-0.140) and it positively correlated with ER
(r=0.181) and EphB4 expression (r=0.162) (Tables I and SII). Univariate survival analysis
revealed that a high ephrin-B expression indicated a longer distant
recurrence-free survival, HR (95% CI) 0.65 (0.44-0.98), P=0.04,
while nuclear EphB4 was associated with a shorter survival, HR (95%
CI) 1.75 (1.18-2.61), P=0.006 (Fig.
6). Moreover, a combined variable ephrin-B/EphB4 revealed that
those patients with ephrin-B−/EphB4+ tumors,
survived for a significantly shorter time without distant
recurrences in comparison with the other groups, HR (95% CI) 2.50
(1.55-4.04), P=0.0002 (Fig. 6C).
This result was found at the protein level in our patient material
and validated at the gene-expression level in the Van de Vijver
dataset (23) (Fig. S2).
 | Table IEphrin B protein expression in
relation to known clinical variables and EphB4 expression in breast
cancer. |
Table I
Ephrin B protein expression in
relation to known clinical variables and EphB4 expression in breast
cancer.
| Variables | EFNB− n
(%) | EFNB+e n
(%) | P-value |
|---|
| Lymph nodes | | | 0.09 |
| − | 20 (15) | 6 (8) | |
| + | 111 (85) | 74 (92) | |
| NHGa | | | 0.02 |
| I | 25 (20) | 21 (27) | |
| II | 62 (49) | 45 (57) | |
| III | 39 (31) | 13 (16) | |
| Tumor size | | | 0.75 |
| <20 mm | 49 (38) | 31 (40) | |
| ≥20 mm | 80 (62) | 46 (60) | |
| ERαb | | | 0.012 |
| − | 43 (37) | 15 (20) | |
| + | 73 (63) | 60 (80) | |
| HER2c | | | 0.042 |
| − | 106 (81) | 73 (91) | |
| + | 25 (19) | 7 (9) | |
| Treatment | | | 0.82 |
| Chemotherapy | 70 (53) | 44 (55) | |
| Radiotherapy | 61 (47) | 36 (45) | |
| EphB4d | | | 0.019 |
| − | 105 (81) | 53 (67) | |
| + | 24 (19) | 26 (33) | |
A multivariable model including EphB4, ephrin-B and
other relevant variables, revealed that both ephrin-B and EphB4
were independent prognostic factors, particularly for distant
recurrences, while only ephrin-B was an independent prognostic
factor for loco-regional recurrences (Table II).
| Table IIMultivariable proportional Cox
regression model considering distant recurrence-free survival
(DRFS), breast cancer survival (BCS) and locoregional
recurrence-free survival (LRRFS) as endpoints. |
Table II
Multivariable proportional Cox
regression model considering distant recurrence-free survival
(DRFS), breast cancer survival (BCS) and locoregional
recurrence-free survival (LRRFS) as endpoints.
Endpoints
| DRFS
| BCS
| LRRFS
|
|---|
| Variables | HR (95% CI) | P-value | HR (95% CI) | P-value | HR (95% CI) | P-value |
|---|
| Ephrin-B | | | | | | |
| − | 1.00 | 0.03 | 1.00 | 0.05 | 1.00 | 0.02 |
| + | 0.61
(0.38-0.96) | | 0.63
(0.39-1.01) | | 0.37
(0.17-0.84) | |
| EPHB4 | | | | | | |
| − | 1.00 | 0.002 | 1.00 | 0.10 | 1.00 | 0.54 |
| + | 2.10
(1.31-3.38) | | 1.53
(0.92-2.55) | | 1.28
(0.58-2.81) | |
| ER | | | | | | |
| − | 1.00 | 0.34 | 1.00 | 0.09 | 1.00 | 0.44 |
| + | 0.79
(0.49-1.29) | | 0.65
(0.40-1.06) | | 0.75
(0.37-1.54) | |
| HER2 | | | | | | |
| − | 1.00 | 0.91 | 1.00 | 0.55 | 1.00 | 0.56 |
| + | 1.03
(0.58-1.85) | | 1.20
(0.66-2.19) | | 1.29
(0.55-2.99) | |
| Nodes | | | | | | |
| − | 1.00 | 0.01 | 1.00 | 0.008 | 1.00 | 0.11 |
| + | 2.91
(1.24-6.84) | | 3.52
(1.40-8.89) | | 3.27
(0.76-14.15) | |
| Size | | | | | | |
| − | 1.00 | 0.008 | 1.00 | 0.002 | 1.00 | 0.32 |
| + | 1.86
(1.17-2.94) | | 2.16
(1.32-3.55) | | 1.44
(0.71-2.92) | |
| Therapy | | | | | | |
| Chemotherapy | 1.00 | 0.64 | 1.00 | 0.86 | 1.00 | 0.05 |
| Radiotherapy |
1.11(0.72-1.70) | | 0.95
(0.61-1.49) | | 0.47
(0.23-0.98) | |
Furthermore, the clinical value of EFNB2 was
explored in two public gene expression datasets (22,23),
where univariate analysis revealed that EFNB2 was associated
with a longer relapse-free survival in the Karolinska Institute
(KI) dataset, HR (95% CI) 0.38 (0.17-0.87), P=0.02 and to longer
distant recurrence-free survival in the Van de Vijver dataset, HR
(95% CI) 0.47 (0.27-0.81), P=0.007, while EPHB4 was an
adverse prognostic factor, as already reported (6). Multivariate analysis in both
datasets, revealed that EFNB2 was an independent prognostic
marker (Table SIII).
Discussion
The EphB4 receptor could both, promote and suppress
tumor growth (26) depending on
the presence of its ligand ephrin-B2, which is usually expressed in
a different cell, but is also co-expressed (27-29).
Upon EphB4-ephrin-B2 interaction, it is believed that the signal
transmitted inside the EphB4-expressing cell or 'forward signal' is
tumor suppressive (12), whereas
the signal generated inside the ephrin-B2-expressing cell, the
'reverse signal', is oncogenic. Since the EphB4 appears to be
highly expressed in human breast cancer cells with a low ephrin-B2
expression, it can be deduced that EphB4-ephrin-B2 co-expression
would lead to tumor suppression.
Upon ephrin-B2 expression in the cells, we found
that ephrin-B2-WT, but not the mutated B2-5F, was
tyrosine-phosphorylated, probably due to its interaction with the
EphB4 receptor. However, we cannot disregard the involvement of
other family members, since ephrin-B2 may have promiscuous
interactions within the Eph family (30). Both ephrin-B2-WT and B2-5F were
visualized in the cell membrane as expected.
Furthermore, we expected to find EphB4 activation,
but noted that EphB4 was not constitutively phosphorylated nor
activated as a result of ephrin-B2 expression or upon treatment
with a soluble ephrin-B2-Fc (data not shown). These findings were
in line with previous results where the EphB4 receptor was silenced
by the co-expression of ephrin-B2 in MCF7 cells (18).
EphB4 and ephrin-B2 do not seem to play a main role
in cell proliferation, but rather orchestrate directional movement
by controlling cytoskeletal organization and cell adhesion
(4). In this study, we observed
that B2-expressing cells exhibited a lower proliferation compared
to the control cells, although we did not observe differences in
proliferation between the B2-WT and B2-5F cells. Consistent results
were found when the cells were grown in 2D and 3D conditions. In
addition, only the B2-5F cells were unable to form colonies
suggesting a role for the ephrin-B2 phosphotyrosine-mediated signal
during colony formation.
Moreover, we found defective migration in cells
overexpressing the ephrin-B2. MCF7-B2 cells exhibited a delayed
lateral migration compared to the control cells. The fact that the
B2-5F cells failed to fill the wound after 21 h suggests that the
tyrosine-mediated signaling could also play an important role in
cell motility. The doubling time for MCF7 in complete medium,
according to ATCC recommendations, is approximately 38 h and
therefore we could discard the possibility of inhibited cell
proliferation at 21 h in the wound healing assay.
Impaired cell motility was also observed in a
Transwell assay, where the both the B2-WT and the B2-5F-expressing
cells migrated less in presence of growth factors, such as HRGβ1
and EGF compared with the control cells. These growth factors
stimulate MCF7 cell proliferation and migration via the activation
of HER-family members expressed by these cells (24,25).
Herein, it can be speculated that in presence of HRGβ1 and EGF, the
EphB4 receptor could be activated by crosstalk with other HER
family members, for example the EGFR to induce cell motility.
Instead, in the presence of ephrin-B2, the EphB4 receptor is
inactivated and ephrin-B2 operates in a receptor-independent manner
to inhibit cell motility. Notably, the phosphotyrosine-mediated
signal seems to be important in this context since the B2-5F cells
significantly migrated less in presence of growth factors.
A deficient ephrin-B2 expression in vitro has
been coupled to poor spreading and increased non-directional
motility in normal vascular cells (31). Another study demonstrated that
ephrin-B2 expression in HUVECs contributed to a more rapid, but
random migration (32) in contrast
with our results, showing that ephrin-B2 expression and especially
B2-5F, seems to be responsible for impaired cell movements. These
observations were confirmed with the cell motility array revealing
down regulation of gene expression in the B2-5F cells compared with
the B2-WT and the GFP control cells with a correspondence between
the downregulation of gene, and protein expression for the B2-5F
cells.
Some of the affected genes in the B2-5F compared to
the GFP control cells, were CSF1, PLAUR, RDX,
TGFβ1 and WIPF1 (P≤0.01). The fact that CSF1,
PLAUR, PTK2B, RND3, SH3PXD2A and
VASP were downregulated in the B2-5F cells compared to the
B2-WT cells indicated that these genes may be involved in
tyrosine-mediated signaling.
Furthermore, our results from the clinical material
revealed a positive association between ephrin-B and ER, the
representative marker for the less aggressive breast cancer subtype
luminal A. In addition, a positive ephrin-B expression was
associated with a low HER2 expression and negatively associated
with NHG III. In line with these results, a high ephrin-B
expression in our clinical material, indicated a good prognosis in
both univariate and multivariate analyses. Although we cannot
conclude that ephrin-B2 and EphB4 are co-expressed or co-localized
in the tumor cells, the worse prognosis was registered among the
subgroup of patients with high EphB4 in the absence of the
ligand.
We also found that EphB4 was an adverse prognostic
factor in agreement with other reports (6,33,34).
Nevertheless, the clinical significance of ephrin-B in breast
cancer is still poorly investigated in clinical material. An
analysis of the ephrin-Bs mRNA expression in the Van de Vijver and
the KI datasets, revealed that only EFNB2 seemed to have
prognostic value in comparison with EFNB1 and EFNB3
(Fig. S3). Otherwise, our recent
search in the TCGA and METABRIC databases (35,36)
revealed that EFNB2 overexpression at the mRNA level had no
prognostic significance. However, looking at the copy number
alterations, normal or higher copy number of EFNB2 indicated
longer breast cancer survival (survival time from diagnosis to
death due to breast cancer), HR (95% CI) 0.746 (0.63-0.88) P=0.0007
(METABRIC) and HR (95% CI) 0.58 (0.37-0.90) P=0.01 (TCGA). As
regards EphB4 expression in the cell membrane, it was not
associated with patient survival in this material. However, among
those patients without lymph nodal infiltration (n=26), the
presence of membranous EphB4 indicated good prognosis (data not
shown), reminding of our previous results with the EphB2 receptor
(21).
In conclusion, the findings of this study suggest
that ephrin-B2 expression in EphB4 positive MCF7 cells inhibits
cell proliferation, motility and migration. The phosphotyrosine
mediated- signaling, in particular, seems to play a key role for
cell motility and migration. These in vitro results could
mirror the clinical situation where we found that ephrin-B protein
expression was associated with a positive ER status, low grade and
a low HER-2 expression.
In addition, ephrin-B expression was an independent
prognostic factor for a longer distant recurrence-free survival and
locoregional-free survival in multivariable analyses. On the
contrary, a high EphB4 expression was an independent predictor of a
shorter distant recurrence-free survival in multivariate analysis.
These results were validated in two public datasets at the gene
expression level and only EFNB2, among all ephrin-Bs,
exhibited prognostic value. Since increased cell proliferation,
motility and migration are characteristics of metastatic cells, and
we found that these biological effects were mainly impaired in the
B2-5F cells, we believe that inhibiting the ephrin-B
phosphotyrosine mediated-signal could be a strategy to defy
metastasis. However, further studies are warranted to continue
exploring the ephrin-B2 and EphB4 interactions in single tumor
cells, as well as to validate our results with other antibodies and
in a larger clinical cohort.
Supplementary Data
Abbreviations:
|
RTK
|
receptor tyrosine kinase
|
|
EFNB2
|
ephrin-B2
|
|
EGFR
|
epidermal growth factor receptor
|
|
Eph
|
from the erythropoietin-producing
hepatocellular cell line where it was first cloned
|
|
ephrin
|
eph receptor interacting protein
|
|
B2-WT
|
EFNB2 wild-type
|
|
B2-5F
|
EFNB2 unable to transmit reverse
signaling
|
|
HRGβ1
|
heregulin-β1
|
|
EGF
|
epidermal growth factor
|
|
SH3PXD2A
|
SH3 and PX domains 2A
|
|
STAT3
|
signal transducer and activator of
transcription 3
|
|
ER
|
estrogen receptor
|
|
HER2
|
human epidermal growth factor receptor
2
|
|
CSF1
|
colony stimulating factor 1
|
|
PLAUR
|
plasminogen activator, urokinase
receptor
|
|
RDX
|
radixin
|
|
TGFβ1
|
transforming growth factor β1
|
|
WIPF1
|
WAS/WASL interacting protein family
member 1
|
|
PTK2B
|
protein tyrosine kinase 2 beta
|
|
RND3
|
Rho family GTPase 3
|
|
VASP
|
vasodilator stimulated
phosphoprotein
|
Acknowledgments
The authors would like to thank Dr Elena B. Pasquale
for providing relevant comments and Dr Olle Stål for providing
fruitful discussions and comments.
Funding
This study was supported by a postdoctoral
fellowship Dnr 2009-7360 from the Swedish Research Council and Dnr
160705 from the Swedish Cancer Society. The funders had no role in
the study design, data collection and analysis, decision to
publish, or the preparation of the manuscript.
Availability of data and materials
Public datasets properly referred to in the text
were used to generate part of the results. Patient data supporting
the immunohistochemistry finding is not publicly available, but the
authors are willing to conduct analysis on this upon reasonable
request and with permission from Olle Stål.
Authors' contributions
GPT conceived and designed the experiments. GPT and
ZM performed the experiments. GPT, ZM and JS analyzed the data. GPT
and ZM wrote the manuscript. All authors have read and approved the
final manuscript.
Ethics approval and consent to
participate
The retrospective studies on tumor tissues have been
approved by the Research Ethics Committee at the Karolinska
Institute (dnr 97-451), with amendments.
Patient consent for publication
Not applicable.
Competing interests
The authors declare that they have no competing
interests.
References
|
1
|
Pasquale EB: Eph receptors and ephrins in
cancer: Bidirectional signalling and beyond. Nat Rev Cancer.
10:165–180. 2010. View
Article : Google Scholar : PubMed/NCBI
|
|
2
|
Vaught D, Brantley-Sieders DM and Chen J:
Eph receptors in breast cancer: Roles in tumor promotion and tumor
suppression. Breast Cancer Res. 10:2172008. View Article : Google Scholar
|
|
3
|
Hirai H, Maru Y, Hagiwara K, Nishida J and
Takaku F: A novel putative tyrosine kinase receptor encoded by the
eph gene. Science. 238:1717–1720. 1987. View Article : Google Scholar : PubMed/NCBI
|
|
4
|
Dodelet VC and Pasquale EB: Eph receptors
and ephrin ligands: Embryogenesis to tumorigenesis. Oncogene.
19:5614–5619. 2000. View Article : Google Scholar : PubMed/NCBI
|
|
5
|
Zhuang G, Brantley-Sieders DM, Vaught D,
Yu J, Xie L, Wells S, Jackson D, Muraoka-Cook R, Arteaga C and Chen
J: Elevation of receptor tyrosine kinase EphA2 mediates resistance
to trastu-zumab therapy. Cancer Res. 70:299–308. 2010. View Article : Google Scholar
|
|
6
|
Brantley-Sieders DM, Jiang A, Sarma K,
Badu-Nkansah A, Walter DL, Shyr Y and Chen J: Eph/ephrin profiling
in human breast cancer reveals significant associations between
expression level and clinical outcome. PLoS One. 6:e244262011.
View Article : Google Scholar : PubMed/NCBI
|
|
7
|
Lu M, Miller KD, Gokmen-Polar Y, Jeng MH
and Kinch MS: EphA2 overexpression decreases estrogen dependence
and tamoxifen sensitivity. Cancer Res. 63:3425–3429.
2003.PubMed/NCBI
|
|
8
|
Wu Q, Suo Z, Risberg B, Karlsson MG,
Villman K and Nesland JM: Expression of Ephb2 and Ephb4 in breast
carcinoma. Pathol Oncol Res. 10:26–33. 2004. View Article : Google Scholar : PubMed/NCBI
|
|
9
|
Zelinski DP, Zantek ND, Stewart JC,
Irizarry AR and Kinch MS: EphA2 overexpression causes tumorigenesis
of mammary epithelial cells. Cancer Res. 61:2301–2306.
2001.PubMed/NCBI
|
|
10
|
Brantley-Sieders DM: Clinical relevance of
Ephs and ephrins in cancer: Lessons from breast, colorectal, and
lung cancer profiling. Semin Cell Dev Biol. 23:102–108. 2012.
View Article : Google Scholar :
|
|
11
|
Kumar SR, Singh J, Xia G, Krasnoperov V,
Hassanieh L, Ley EJ, Scehnet J, Kumar NG, Hawes D, Press MF, et al:
Receptor tyrosine kinase EphB4 is a survival factor in breast
cancer. Am J Pathol. 169:279–293. 2006. View Article : Google Scholar : PubMed/NCBI
|
|
12
|
Noren NK, Foos G, Hauser CA and Pasquale
EB: The EphB4 receptor suppresses breast cancer cell tumorigenicity
through an Abl-Crk pathway. Nat Cell Biol. 8:815–825. 2006.
View Article : Google Scholar : PubMed/NCBI
|
|
13
|
Berclaz G, Flütsch B, Altermatt HJ,
Rohrbach V, Djonov V, Ziemiecki A, Dreher E and Andres AC: Loss of
EphB4 receptor tyrosine kinase protein expression during
carcinogenesis of the human breast. Oncol Rep. 9:985–989.
2002.PubMed/NCBI
|
|
14
|
Nikolova Z, Djonov V, Zuercher G, Andres
AC and Ziemiecki A: Cell-type specific and estrogen dependent
expression of the receptor tyrosine kinase EphB4 and its ligand
ephrin-B2 during mammary gland morphogenesis. J Cell Sci.
111:2741–2751. 1998.PubMed/NCBI
|
|
15
|
Mäkinen T, Adams RH, Bailey J, Lu Q,
Ziemiecki A, Alitalo K, Klein R and Wilkinson GA: PDZ interaction
site in ephrinB2 is required for the remodeling of lymphatic
vasculature. Genes Dev. 19:397–410. 2005. View Article : Google Scholar : PubMed/NCBI
|
|
16
|
Salvucci O, Maric D, Economopoulou M,
Sakakibara S, Merlin S, Follenzi A and Tosato G: EphrinB reverse
signaling contributes to endothelial and mural cell assembly into
vascular structures. Blood. 114:1707–1716. 2009. View Article : Google Scholar : PubMed/NCBI
|
|
17
|
Follenzi A and Naldini L: Generation of
HIV-1 derived lentiviral vectors. Methods Enzymol. 346:454–465.
2002. View Article : Google Scholar : PubMed/NCBI
|
|
18
|
Falivelli G, Lisabeth EM, Rubio de la
Torre E, Perez-Tenorio G, Tosato G, Salvucci O and Pasquale EB:
Attenuation of eph receptor kinase activation in cancer cells by
coexpressed ephrin ligands. PLoS One. 8:e814452013. View Article : Google Scholar : PubMed/NCBI
|
|
19
|
Rutqvist LE and Johansson H: Long-term
follow-up of the Stockholm randomized trials of postoperative
radiation therapy versus adjuvant chemotherapy among 'high risk'
pre- and postmenopausal breast cancer patients. Acta Oncol.
45:517–527. 2006. View Article : Google Scholar : PubMed/NCBI
|
|
20
|
Veenstra C, Pérez-Tenorio G, Stelling A,
Karlsson E, Mirwani SM, Nordensköljd B and Fornander T: Met and its
ligand HGF are associated with clinical outcome in breast cancer.
Oncotarget. 7:37145–37159. 2016. View Article : Google Scholar : PubMed/NCBI
|
|
21
|
Husa AM, Magić Ž, Larsson M, Fornander T
and Pérez-Tenorio G: EPH/ephrin profile and EPHB2 expression
predicts patient survival in breast cancer. Oncotarget.
7:21362–21380. 2016. View Article : Google Scholar : PubMed/NCBI
|
|
22
|
Pawitan Y, Bjöhle J, Amler L, Borg AL,
Egyhazi S, Hall P, Han X, Holmberg L, Huang F, Klaar S, et al: Gene
expression profiling spares early breast cancer patients from
adjuvant therapy: Derived and validated in two population-based
cohorts. Breast Cancer Res. 7:R953–R964. 2005. View Article : Google Scholar : PubMed/NCBI
|
|
23
|
van de Vijver MJ, He YD, van't Veer LJ,
Dai H, Hart AA, Voskuil DW, Schreiber GJ, Peterse JL, Roberts C,
Marton MJ, et al: A gene-expression signature as a predictor of
survival in breast cancer. N Engl J Med. 347:1999–2009. 2002.
View Article : Google Scholar : PubMed/NCBI
|
|
24
|
Ruan SQ, Wang SW, Wang ZH and Zhang SZ:
Regulation of HRG-β1-induced proliferation, migration and invasion
of MCF-7 cells by upregulation of GPR30 expression. Mol Med Rep.
6:131–138. 2012.PubMed/NCBI
|
|
25
|
Mezi S, Todi L, Orsi E, Angeloni A and
Mancini P: Involvement of the Src-cortactin pathway in migration
induced by IGF-1 and EGF in human breast cancer cells. Int J Oncol.
41:2128–2138. 2012. View Article : Google Scholar : PubMed/NCBI
|
|
26
|
Rutkowski R, Mertens-Walker I, Lisle JE,
Herington AC and Stephenson SA: Evidence for a dual function of
EphB4 as tumor promoter and suppressor regulated by the absence or
presence of the ephrin-B2 ligand. Int J Cancer. 131:E614–E624.
2012. View Article : Google Scholar
|
|
27
|
Alam SM, Fujimoto J, Jahan I, Sato E and
Tamaya T: Coexpression of EphB4 and ephrinB2 in tumor advancement
of uterine cervical cancers. Gynecol Oncol. 114:84–88. 2009.
View Article : Google Scholar : PubMed/NCBI
|
|
28
|
Liu W, Ahmad SA, Jung YD, Reinmuth N, Fan
F, Bucana CD and Ellis LM: Coexpression of ephrin-Bs and their
receptors in colon carcinoma. Cancer. 94:934–939. 2002. View Article : Google Scholar : PubMed/NCBI
|
|
29
|
Tang XX, Brodeur GM, Campling BG and
Ikegaki N: Coexpression of transcripts encoding EPHB receptor
protein tyrosine kinases and their ephrin-B ligands in human small
cell lung carcinoma. Clin Cancer Res. 5:455–460. 1999.PubMed/NCBI
|
|
30
|
Noberini R, Rubio de la Torre E and
Pasquale EB: Profiling Eph receptor expression in cells and
tissues: A targeted mass spectrometry approach. Cell Adh Migr.
6:102–112. 2012. View Article : Google Scholar : PubMed/NCBI
|
|
31
|
Foo SS, Turner CJ, Adams S, Compagni A,
Aubyn D, Kogata N, Lindblom P, Shani M, Zicha D and Adams RH:
Ephrin-B2 controls cell motility and adhesion during
blood-vessel-wall assembly. Cell. 124:161–173. 2006. View Article : Google Scholar : PubMed/NCBI
|
|
32
|
Bochenek ML, Dickinson S, Astin JW, Adams
RH and Nobes CD: Ephrin-B2 regulates endothelial cell morphology
and motility independently of Eph-receptor binding. J Cell Sci.
123:1235–1246. 2010. View Article : Google Scholar : PubMed/NCBI
|
|
33
|
Guijarro-Muñoz I, Sánchez A,
Martínez-Martínez E, García JM, Salas C, Provencio M,
Alvarez-Vallina L and Sanz L: Gene expression profiling identifies
EPHB4 as a potential predictive biomarker in colorectal cancer
patients treated with bevacizumab. Med Oncol. 30:5722013.
View Article : Google Scholar : PubMed/NCBI
|
|
34
|
Tu Y, He S, Fu J, Li G, Xu R, Lu H and
Deng J: Expression of EphrinB2 and EphB4 in glioma tissues
correlated to the progression of glioma and the prognosis of
glioblastoma patients. Clin Transl Oncol. 14:214–220. 2012.
View Article : Google Scholar : PubMed/NCBI
|
|
35
|
Cancer Genome Atlas Network: Comprehensive
molecular portraits of human breast tumours. Nature. 490:61–70.
2012. View Article : Google Scholar : PubMed/NCBI
|
|
36
|
Pereira B, Chin SF, Rueda OM, Vollan HK,
Provenzano E, Bardwell HA, Pugh M, Jones L, Russell R, Sammut SJ,
et al: The somatic mutation profiles of 2,433 breast cancers
refines their genomic and transcriptomic landscapes. Nat Commun.
7:114792016. View Article : Google Scholar : PubMed/NCBI
|