Introduction
Fibroblast growth factor receptors (FGFRs) are a
family of tyrosine kinase receptors that are deregulated in several
types of cancer, leading to alterations in cell proliferation,
migration, epithelial-mesenchymal transition, invasion, survival
and angiogenesis (1-6). For example, the interaction of FGFR3
with its specific ligands leads to the phosphorylation of the
receptor, and the activation of pathways, such as the
mitogen-activated protein kinase (MAPK) and the phosphoinositide
3-kinase/protein kinase B (PI3K/AKT) pathways. Aberrations in the
FGFR3 gene have been shown to contribute to tumor
development (1). Common
alterations include FGFR3 point mutations, gene
amplification and translocations, the latter resulting in different
fusion genes frequently occurring in bladder cancer, but also in
breast cancer, lung cancer, glioblastoma and human papillomavirus
positive tonsillar and base of the tongue squamous cell carcinoma
(1-6). In addition, early-phase clinical
trials with FGFR-directed targeted therapies for glioblastoma
multiforme, transitional cell carcinoma and multiple myeloma
carrying mutated FGFR3 (NCT01975701, NCT02278978,
NCT02401542 and NCT02052778) have been conducted, indicating the
potential of such therapies in other types of cancer.
Knowledge on the role of the FGFR protein family in
childhood cancer remains limited, and novel therapeutic targets
would be helpful. In a previous study, FGFR4 mutations were
detected in 7/94 (7.5%) cases of primary human rhabdomyosarcomas
(6). Another study on ependymomas
and pilocytic astrocytomas revealed an increased FGFR1 and
FGFR3 expression in aggressive ependymomas (7). RNA sequencing in glioblastomas has
revealed an overexpression of the tumorigenic FGFR3-TACC3
fusion gene, enhanced proliferation and tumor progression (8). Furthermore, the FGFR1 mutation
(N546K) and FGFR1 locus copy number gain has been reported
as a characteristic feature of Ewing sarcoma (9). Thus, an increasing number of studies
investigating the role of FGFR deregulation in different types of
cancer have revealed an association between receptor overexpression
and tumor progression, as well as the potency of a targeted therapy
against the FGFR receptor family (1-9).
Nonetheless, there is still a gap of information regarding the
status of FGFRs in childhood cancer.
There is somewhat more information on the role of
the PI3K pathway in childhood cancer. PIK3CA mutations have
been reported in pediatric high-grade gliomas, as well as in
pediatric diffuse intrinsic pontine gliomas and rhabdomyosar-comas,
while in neuroblastomas (NBs), specific constitutional
PIK3CA mutations are infrequent (10-14).
However, the activation of the PI3K/AKT/mammalian target of
rapamycin (mTOR) signaling axis has been reported to predict a poor
prognosis of patients with NB (15). Furthermore, responses to PI3K
inhibitors in NB have been examined, and a correlation between
MYCN proto-oncogene, BHLH transcription factor (MYCN)
amplification and sensitivity to mTOR kinase inhibitors has been
reported (16). More specifically,
PI3K/mTOR inhibitors have been shown to induce an enhanced MYCN
phosphorylation and proteasomal degradation (16-18).
Nevertheless, resistance to single treatment with PI3K inhibitors
has also been reported (19). It
could potentially be useful to obtain more information on the
sensitivity of different childhood tumors to FGFR and PI3K
inhibitors. The present study focused on NB, a childhood cancer of
the peripheral nervous system that is the most common and most
lethal tumor affecting infants (20,21).
A number of NB cell lines with different clinical characteristics,
including MYCN amplification and 11q deletion, were
therefore tested for their sensitivity to FGFR (AZD4547) and PI3K
(BEZ235 and BKM120) inhibitors alone, or AZD4547 and BEZ235 in
combination. In addition, a limited number of NBs were screened for
the presence of the most commonly occurring FGFR3 and
PIK3CA mutations.
Materials and methods
Patients and tumor characteristics
NBs from patients aged 0-11.5 years, diagnosed
between 1991 and 2008 at the Karolinska University Hospital
(Stockholm, Sweden) were analyzed for the most common FGFR3
and PIK3CA mutations (see below); the details of the patient
tumor characteristics have been previously described (22). The study was performed according to
approval no. 2009/1369-31/1, 2007/1253-31/3 and 2003/736 from the
Ethics Committee of the Karolinska Institutet. Informed consent for
the use of tumor samples in research was provided by the
parents/guardians. In accordance with the approval from the Ethics
Committee the informed consent was either written or verbal. When
verbal or written assent was not obtained the decision was
documented in the medical record. Kaplan-Meyer survival curves and
gene correlations were created using the R2: Microarray analysis
and visualization platform (http://r2.amc.nl).
The used cohort Kocak contains gene expression profiles from 649
neuroblastoma tumors generated using 44K oligonucleotide
microarrays (23).
Tumor cell lines and culture
conditions
For the in vitro experiments, the NB cell
lines, SK-N-AS, SK-N-BE(2)-C, SK-N-DZ, SK-N-FI and SK-N-SH, were
kindly provided by Professor Per Kogner of the Karolinska
Institutet and have been described in a number of previous studies
(24-28). All cell line identities were
verified by short tandem repeat genetic profiling using the
AmpFLSTR Identifiler PCR Amplification kit (Thermo Fisher
Scientific, Inc.) in 2016, and the cell lines were used at passages
<25 following thawing. Furthermore, according to the Cancer
Dependency Map (https://depmap.org/portal/), none of the included cell
lines had any FGFR3 mutations (Fig. S1), while SK-N-DZ had a frameshift
deletion of PIK3C2G, as well as an MYCN
amplification, as was also the case with SK-N-BE(2)-C. The
SK-N-BE(2)-C cell line was derived from a previously treated
relapsed patient and is known to be chemoresistant (i.e., to
doxorubicin) (28). Both the
SK-N-DZ and SK-N-AS cells contain an 11q deletion (29,30),
and SK-N-FI has a high MDR1 expression (31). The NB cell lines were cultured in
RPMI (Thermo Fisher Scientific, Inc.), with 10% FBS (Thermo Fisher
Scientific, Inc.), 1% L-glutamine, 100 U/ml penicillin and 100
µg/ml streptomycin (Thermo Fisher Scientific, Inc.).
UPCI-SCC-154, a squamous cell carcinoma of the tongue (provided by
Susan Gollin, University of Pittsburgh USA) and HPV- UT-SSC-60A, a
tonsillar squamous cell carcinoma (obtained from Reidar Grénman,
University of Turku, Finland) were cultured in Dulbecco's modified
Eagle's medium (Gibco, Thermo Fisher Scientific, Inc.), with 10%
FBS, 1% L-glutamine, 100 U/ml of penicillin, and 100 µg/ml
streptomycin and used as positive control in the western blots. All
cells were maintained at 37°C in a humidified incubator with 5%
CO2. The genetic dependency of FGFR3 was analyzed
in the Cancer Dependency Map with public data connecting tumor
features with tumor dependencies (https://depmap.org/portal).
Competitive allele-specific TaqMan PCR
(CAST-PCR)
FGFR3 and PIK3CA mutation analysis was
conducted by Competitive Allele-Specific TaqMan® PCR
technology (Thermo Fisher Scientific, Inc.), as previously
described (32). For FGFR3,
mutation detection assays were Hs00000811_mu, Hs00000812_mu and
Hs00001342_mu, disclosing FGFR3 variants p.R248C, p.S249C
and p.K650Q in the FGFR3 gene, respectively; reference assay
Hs00001015_rf was used to recognize wild-type FGFR3. For
PIK3CA, mutation detection assays were Hs00000822_mu,
Hs00000824_mu and Hs00000831_mu, disclosing variants p.E542K,
p.E545K and p.H1047R in the PIK3CA gene, respectively;
reference assay Hs00001025_rf was used to recognize wild-type
PIK3CA.
Treatment with FGFR and PI3K inhibitors
following cell seeding and experimental set up Cell seeding
In most cases and assays, 5,000 cells were seeded in
80-100 µl medium/well (without penicillin and streptomycin)
in 96-well plates, and the edges were filled with medium to avoid
edge effects.
Treatment with FGFR and PI3K
inhibitors
The cells were treated with inhibitors 24 h after
seeding. Dactolisib (BEZ235, NVP-BEZ235) and Buparlisib (BKM120,
NVP-BKM120) were used as PI3K inhibitors and AZD4547 as an FGFR
inhibitor (all were purchased from Selleck Chemicals). To prepare
the stocks, the drugs were diluted in DMSO, and the stocks were
later diluted further with PBS and then added to the cells to
obtain the final drug concentrations. For all cell lines, the
concentrations of AZD4547 used were 5-25 µM, and those of
BEZ235 and BKM120 0.25-5.0 µM. Subsequently, the cells were
incubated for 24, 48, 72 and, in some cases, 96 h, and different
assays were performed to investigate cell viability, cytotoxicity,
apoptosis and proliferation. For the experiments using a
combination of FGFR (AZD4547) and the PI3K (BEZ235) inhibitors, the
concentrations are summarized in Table SI. All experiments were repeated
at least 3 times. Representative images for Fig. S3 were taken by using
IncuCyte® S3 Live-Cell Analysis System (Essen
Bioscience).
WST-1 viability assay
Cells (5×10³ cells/well) were seeded in
96-well plates. Drug concentrations were tested in duplicates and
one plate was used per time point. After 24, 48 and 72 h, 10
µl cell proliferation WST-1 reagent (Roche Diagnostics,
Mannheim, Germany) were added to each well containing cells and
drugs, cells and PBS (positive control), or only medium (two blank
wells; background). The plates were incubated for 1 h in 37°C and
the absorbance was measured at 450 nm using the VersaMax microplate
reader (Molecular Devices, LLC). During the analysis, the mean
average of the duplicates was formed and the mean blank average was
subtracted from every value. The average values were normalized to
the average control treated with PBS. Furthermore, the
IC50 (inhibitory concentration 50%) of the drugs on the
cell lines was calculated from log concentration-effect curves in
GraphPad Prism Software version 8 (GraphPad Software, Inc.) using
non-linear regression analysis.
CellTox™ Green Cytotoxicity assay
The CellTox™ Cytotoxicity assay (Promega
Corp.) was performed 48 and 72 h after drug treatment, according to
the manufacturer's instructions. Cells (5×10³
cells/well) were seeded in Corning® 96 Well Black
Polystyrene Microplates matrix active group TC-treated with a clear
flat bottom and a sterile lid (Merck) in an end-volume of 80
µl. Duplicates were prepared for each drug concentration.
PBS was used as a base level control instead of drugs, and 2 empty
wells filled with medium were used as background. Cell lysis
solution (4 µl; Promega Corp.) was added as the positive
control and incubated for 30 min at 37°C. Thereafter, 20 µl
CellTox™ green dye solution (1:100 dye to buffer assay; Promega
Corp.) was added to all wells. To avoid light exposure, the plates
were covered in foil and then incubated in a shaker for 15 min at
room temperature. A SPARK™ 10 M multimode microplate plate reader
(Tecan Group, Ltd., Mannedorf, Switzerland) with a 485-nm
excitation and 520-nm emission used for the read-out.
Caspase-Glo® 3/7 assay
The Caspase-Glo® 3/7 Assay was performed
directly after the CellTox™ Assay using the same plates (for
further information see instructions from the manufacturer, Promega
Corp.); 100 µl reagent (Promega Corp.) was added to each
well, apart from the positive control of the CellTox™ Green
Cytotoxicity assay. The plates were incubated at room temperature
for 1 h on the shaker wrapped in tin foil. Luminescence was
measured using the Centro LB 960 Microplate Luminometer (Berthold
Technologies).
Proliferation assay
The proliferation assay was performed using E-plate
VIEW 16 plates (ACEA Biosciences, Inc.) in an xCELLigence RTCA DP
instrument. To measure the background, 50 µl medium were
added into each well. Thereafter, 5×10³ cells in 50
µl medium were seeded into the E-plates to a total of 100
µl. The plates were incubated in the hood for 30 min at room
temperature to allow the cells settle, and were then inserted into
the machine. The machine was programmed to take measurements every
2 h. After 24 h, the drugs and PBS (as a control) were added; the
measurements were then continued for 90 h. The resulting values
were expressed as a cell index, a dimensionless value, which
changes in response to cell number or morphological changes.
Western blot analysis
Protein extracts were lysed on ice with Pierce RIPA
buffer (Thermo Fisher Scientific, Inc.) containing Halt Protease
and Phosphatase Inhibitor Cocktail (100X) (Thermo Fisher
Scientific, Inc.). Protein concentrations were determined using
detergent compatible (DC)-Protein assay (Bio-Rad) following the
manufacturer's protocol. A total of 45 µg of protein was
diluted (1:3) in Blue Loading Buffer pack containing DTT according
to the manufacturer's protocol (New England Biolabs, through
BioNordika). Diluted samples were incubated 10 min at 95°C, loaded
on a MiniProtean TGX (Tris-Glycine eXtended) 10% gel (Bio-Rad), and
finally transferred onto a nitrocellulose membrane (GE Healthcare)
overnight at 22V. The membranes were blocked using non-fat dry milk
of 5% in 0,1% TBST (Tris-buffered saline, 0.1% Tween-20) and
incubated with primary antibodies overnight at 4 °C at a dilution
of 1:1,000 against PI3K (#4249S, Cell Signaling Technology, through
BioNordika,), 1:2,000 against FGFR3 (ab133644, Abcam) and 1:10,000
against GAPDH (ab8245, Abcam). HRP-conjugated anti-mouse (#7076,
Cell Signaling Technology, 1:5,000) or anti-rabbit (#7074, Cell
Signaling Technology, 1:2,000) diluted in blocking buffer were used
as secondary antibodies. Membranes were incubated with ECL
(Enhanced chemiluminescence) detection reagent SuperSignal West
Pico Plus (Thermo Fisher Scientific) and subsequently the membrane
was exposed to a chemiluminescent machine (GE Healthcare).
UPCI-SCC-154 and UT-SCC-60A cell lines were used as a positive
control, since they had been tested by us previously (unpublished
data). In addition, they did not express the most common
FGFR3 and PIK3CA mutations, and for further details
of the cell lines see Holzhauser et al, 2019 (33).
Statistical analysis
To determine the effects of single or combination
treatments, a multiple t-test accompanied by a correction for
multiple comparison of the means conferring to the Holm-Sidak
method was performed. More specifically, the combined effects were
analyzed using the effect-based approach 'Highest Single Agent' and
dose-effect-based approach 'median-effect method' (based on Loewe
Additivity) (34). The 'Highest
Single Agent' method determines whether the achieved effect of a
drug combination (EAB) is larger than the effect
obtained by any of the individual drugs (EA and
EB). A combination index (CI) was calculated using the
formula CI=max(EA, EB)/EAB. A CI
of <1 was considered a positive and a CI of >1 a negative
combined effect. In addition, the combined effects were analyzed
using the median-effect method of Chou (Chou-Talalay method)
(35) using ComboSyn software
(http://www.combosyn.com; ComboSyn, Inc.). The
dose-response curves were fitted to a linear model using the
median-effect equation, allowing for the calculation of a
median-effect value D (equivalent to IC50) and slope.
Goodness-of-fit was assessed with the linear correlation
coefficient, r; An r>0.85 was required for the analysis to be
approved. The degree of drug interaction was rated using the CI for
mutually exclusive drugs:
CI=d1/D1+d2/D2, where
D1 and D2 represent the concentration of drug
1 and 2 alone, respectively, that is required to produce a certain
effect, and d1 and d2 represent the
concentration of drugs 1 and 2 in combination that is required to
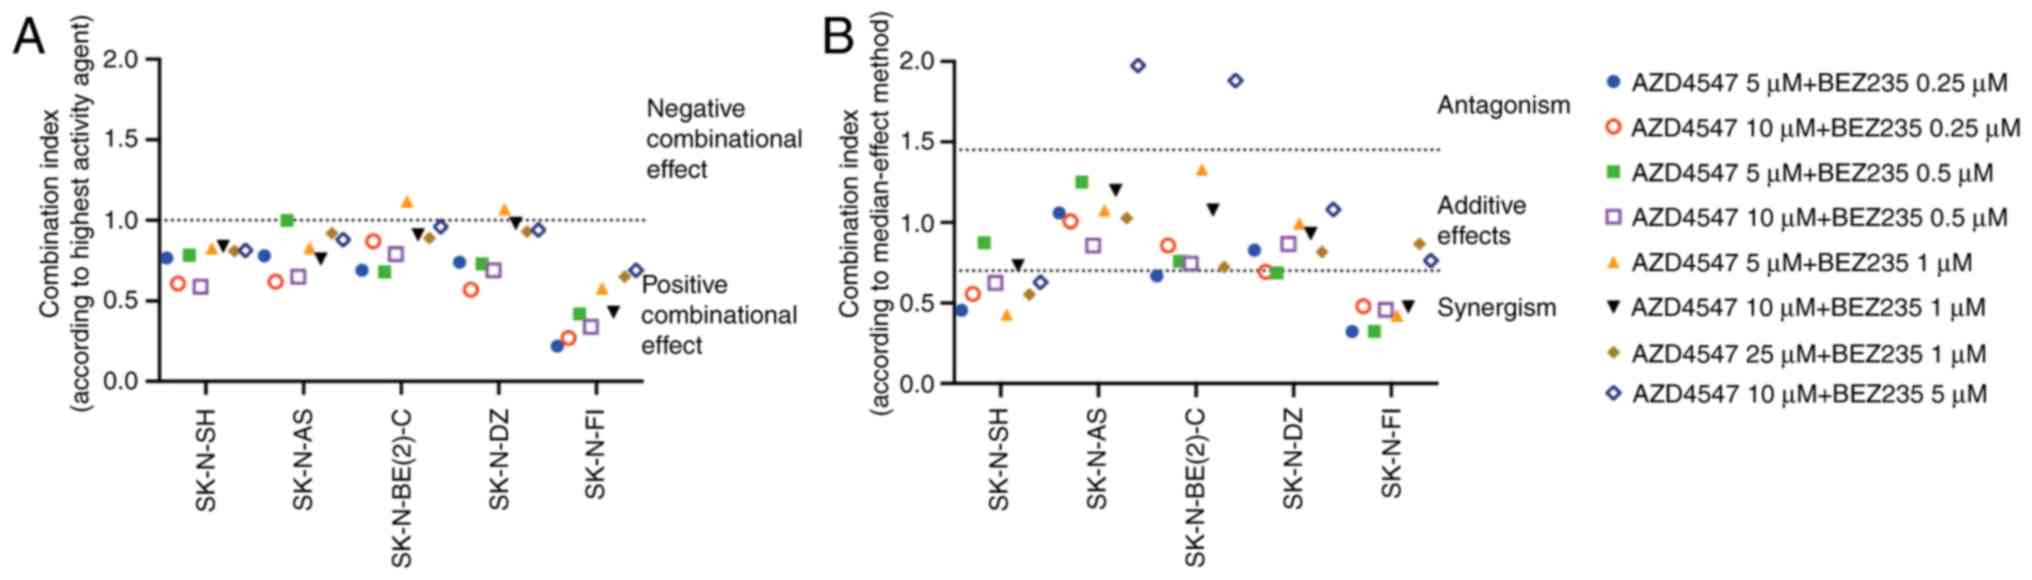
produce the same effect. Herein, CI<0.70 was defined as synergy
and CI<1.45 as antagonism, and values in between as additive
effects, according to the recommendations of the ComboSyn software.
One-way ANOVA with the Bonferroni post-hoc test was used to analyze
the difference in means between the two single drugs and the
combined treatment. A P<0.05 was considered to indicate a
statistically significant difference.
Results
Analysis of FGFR3 and PIK3CA mutations in
NB by CAST-PCR
A total of 29 NB samples were evaluated for
FGFR3 and PIK3CA mutations by CASR-PCR, and only one
of these tumors was found to have an FGFR3 mutation. This
mutation was FGFR3 K650Q (data not shown).
Analysis of FGFR3 mRNA expression with
regard to NB survival and genetic dependency, and FGFR3 protein
expression in NB cell lines
Since PI3K inhibitors have shown promising results
in NB (17,18), the importance of FGFR3 and
genetic inhibition of FGFR3 in NB was investigated in
publicly available data. First, the mRNA expression levels were
analyzed in a publicly available validated cohort of NB samples,
and it was found that a higher FGFR3 mRNA expression was
significantly associated with a worse event-free, as well as
overall, survival (Fig. S1A).
Secondly, the analysis of publicly available RNAi screening data
revealed a significant FGFR3 dependency in the investigated
NB cell lines, as compared to cell lines from other cancer
diagnoses (Fig. S1B). When
investigated by Western blot analysis, evident levels of FGFR3 and
PI3K protein expression in NB cell lines were demonstrated
(Fig. S2).
Treatment of SK-N-AS, SK-N-BE(2)-C,
SK-N-DZ, SK-N-FI and SK-N-SH NB cell lines with FGFR and PI3K
inhibitors independently
WST-1 viability analysis following
treatment of SK-N-AS, SK-N-BE(2)-C, SK-N-DZ, SK-N-FI and SK-N-SH NB
cell lines with FGFR and PI3K inhibitors independently
To examine the effects of the treatment on cell
viability, WST-1 viability assays were performed at 24, 48 and 72 h
following treatment of the SK-N-AS, SK-N-BE(2)-C, SK-N-DZ, SK-N-FI
and SK-N-SH cell lines with various concentrations of the FGFR
inhibitor, AZD4547, and the PI3K inhibitors, BEZ235 and BKM120. All
absorbance values were compared to those of the PBS control.
AZD4547
The FGFR3 inhibitor, AZD4547, induced a
dose-dependent effect on cell viability in all 5 investigated cell
lines. All 5 NB cell lines exhibited a ≥50% decrease in absorbance
(i.e., a decrease in the number of metabolically active cells)
following treatment with 25 µM AZD4547 at 24, 48 and 72 h
(at least P<0.01; Fig. 1A-E).
The SK-N-BE(2)-C, SK-N-DZ and SK-N-SH also exhibited a ≥50%
decrease in absorbance following treatment with 10 µM
AZD4547 for 72 h, which was also the case for the SK-N-BE(2)-C and
SK-N-SH cells already at 48 h (at least P<0.05), but not at all
the case for the SK-N-AS and SK-N-FI cells (Fig. 1A-E). Treatment with 5 µM
AZD4547 was less effective for all cell lines (Fig. 1A-E).
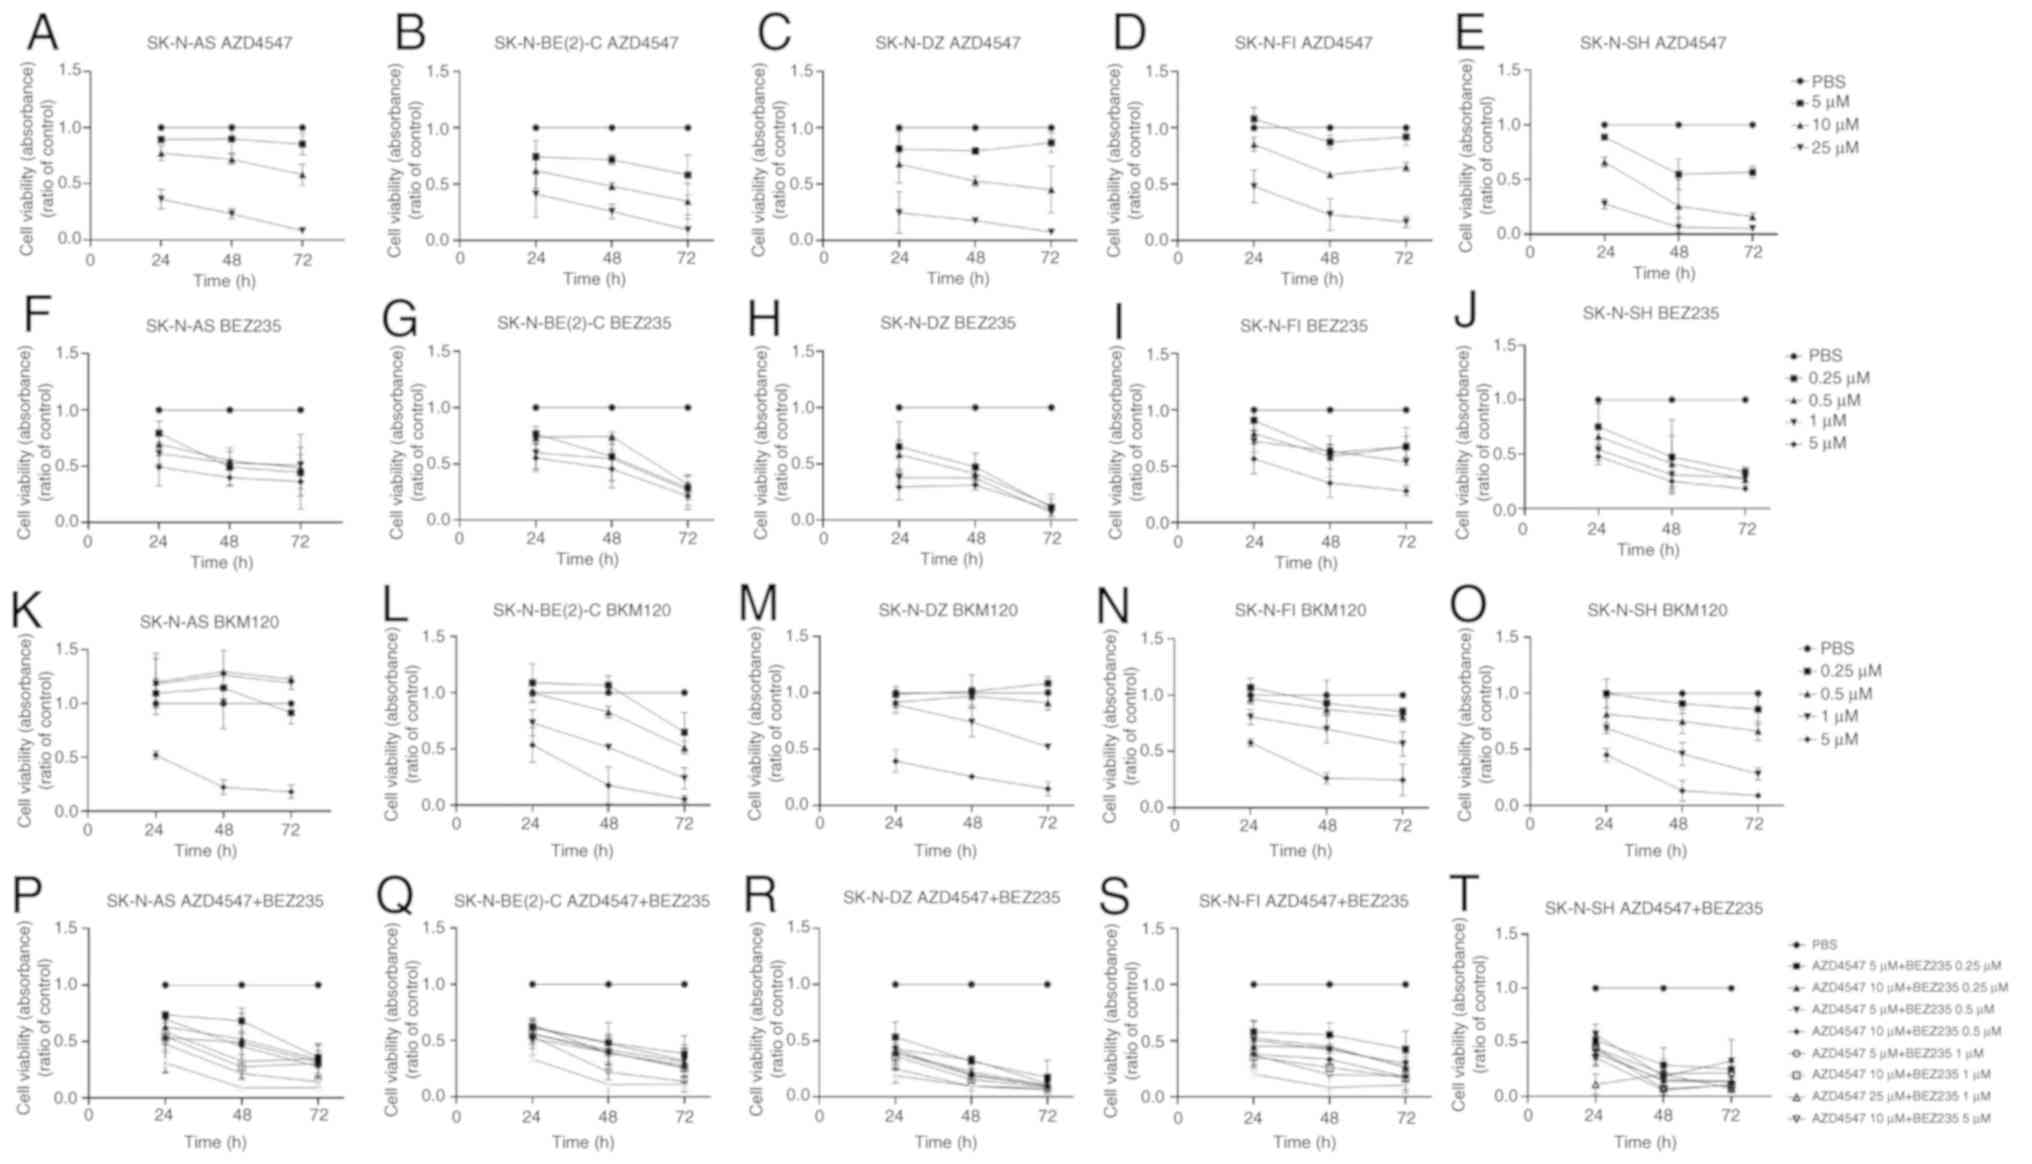 | Figure 1WST-1 viability assays on the
SK-N-AS, SK-N-BE(2)-C, SK-N-DZ, SK-N-FI and SK-N-SH cell lines.
WST-1 viability assay measured the absorbance following treatment
for 24, 48 and 72 h of the SK-N-AS, SK-N-BE(2)-C, SK-N-DZ, SK-N-FI
and SK-N-SH cells with (A-E) the FGFR inhibitor, AZD4547, and the
PI3K inhibitors (F-J) BEZ235 and (K-O) BKM120, respectively. (P-T)
Combined treatment of the SK-N-AS, SK-N-BE(2)-C, SK-N-DZ, SK-N-FI
and SK-N-SH cells with the FGFR inhibitor, AZD4547, and PI3K
inhibitor, BEZ235. The graphs represent 3 experimental runs per
cell line and results are presented as the means ± SD. FGFR,
fibroblast growth factor receptor; PI3K, phosphoinositide
3-kinase. |
BEZ235
The PI3K inhibitor, BEZ235, exerted a dose-dependent
effect on cell viability in the majority of the investigated cell
lines, and most evidently in the 2 MYCN-amplified cell
lines, SK-N-BE(2)-C and SK-N-DZ, but also in the SK-N-SH, SK-N-AS
and SK-N-FI cells. More specifically, as compared to the PBS
control, a ≥50% decrease in absorbance was observed in all 5 NB
cell lines following treatment with 5 µM BEZ235 after 48 and
72 h (at least P<0.01), with the SK-N-DZ and SK-N-SH also
exhibiting the decrease after 24 h (at least P<0.01; Fig. 1F-J). SK-N-DZ and SK-N-SH were the
cell lines most sensitive to BEZ235, exhibiting a ≥50% decrease in
absorbance with 0.25-1 µM BEZ235 at 48 and 72 h (at least
P<0.05), and SK-N-DZ with 1 µM BEZ235 at 24 h (P<0.01;
Fig. 1H and J). Finally, at 0.25-1
µM BEZ235, a ≥50% decrease in absorbance was also observed
at 72 h in the SK-N-AS and SK-N-BE(2)-C (at least P<0.01 for
all), but not in the SK-N-FI (Fig. 1F,
G and I, respectively) cells.
BKM120
The PI3K inhibitor, BKM120, also exerted a
dose-dependent effect in the majority of cell lines with a similar,
but slightly less sensitive, pattern than that of BEZ235. Treatment
with 5 µM BKM120 induced a ≥50% decrease in absorbance after
48 and 72 h in all NB lines (at least P<0.05 for all). This
decrease in absorbance was also observed in the SK-N-AS, SK-N-DZ
and SK-N-SH cells after 24 h, as compared to the PBS control (at
least P<0.05 for all; Fig.
1K-O). Following treatment with 1 µM BKM120, a ≥50%
decrease in absorbance was observed in the SK-N-BE(2)-C and SK-N-SH
cells after 72 h (Fig 1L and O; at
least P<0.001). The lower BKM120 concentrations did not exert
any notable effects (Fig.
1K-O).
IC50
To better evaluate the sensitivity of the different
cell lines, IC50 values for all cell lines were calculated and are
presented in Table I. The data
indicated that the SK-N-SH cells were the most sensitive and the
SK-N-FI cells the most insensitive to treatment with AZD4547, with
SK-N-AS being somewhat less insensitive, and the SK-N-BE(2)-C and
SK-N-DZ cells somewhere in between. For BEZ235 and BKM120, the IC50
values indicated that the SK-N-DZ and SK-N-SH cells and, to a
certain extent, the SK-N-BE(2)-C cells, were the cell lines most
sensitive to both these drugs, followed by the other cell lines
(Table I).
 | Table IWST-1 viability analysis following
treatment with the FGFR inhibitor, AZD4547, and PI3K inhibitors,
BEZ235 and BKM120 for 24, 48 and 72 h. |
Table I
WST-1 viability analysis following
treatment with the FGFR inhibitor, AZD4547, and PI3K inhibitors,
BEZ235 and BKM120 for 24, 48 and 72 h.
| Cell line | Drugs | IC50
(µM)
|
|---|
| 24 h | 48 h | 72 h |
|---|
| SK-N-AS | FGFR | AZD4547 | 18.4 | 14.7 | 11.0 |
| PI3K | BEZ235 | 3.02 | 0.743 | 0.318 |
| BKM120 | 8.53a | 5.08a | 2.82 |
| SK-N-BE(2)-C | FGFR | AZD4547 | 16.8 | 10.0 | 6.33 |
| PI3K | BEZ235 | >5.00b | 2.22 | <0.250b |
| BKM120 | 5.20a | 1.20 | 0.448 |
| SK-N-DZ | FGFR | AZD4547 | 13.9 | 10.6 | 9.43 |
| PI3K | BEZ235 | 0.711 | 0.123 | <0.250b |
| BKM120 | 3.75 | 2.36 | 1.04 |
| SK-N-FI | FGFR | AZD4547 | 23.9 | 12.6 | 12.9 |
| PI3K | BEZ235 | 7.39 | 1.54 | 1.20 |
| BKM120 | 6.37 | 2.11 | 1.55 |
| SK-N-SH | FGFR | AZD4547 | 1.15a | 0.741a | 0.735a |
| PI3K | BEZ235 | 2.99 | 0.168a | <0.250b |
| BKM120 | 3.57 | 0.996 | 0.665 |
CellTox™ Green Cytotoxicity assay
following treatment of the SK-N-AS, SK-N-BE(2)-C, SK-N-DZ, SK-N-FI
and SK-N-SH NB cell lines with the FGFR inhibitor, AZD4547, and
PI3K inhibitor, BEZ235, independently
General set up
The CellTox™ Green Cytotoxicity assays were
performed on the SK-N-AS, SK-N-BE(2)-C, SK-N-DZ, SK-N-FI and
SK-N-SH NB cell lines at 48, 72 and 96 h following treatment with
the FGFR and PI3K inhibitors. The cytotoxic effect of the positive
control was significantly higher than all other effects in all
cases. Only increases in fluorescence, as compared to the PBS
control, were observed and are described below.
AZD4547
Following treatment with 25 µM AZD4547 for 48
h, a significant increase in fluorescence was observed in all cell
lines (at least P<0.05) apart from the SK-N-BE(2)-C cells. After
72 h, this effect was observed in all cell lines (at least
P<0.05; Fig. 2A-E). After 48 h
of treatment with 10 µM AZD4547, a significant increase in
fluorescence was observed in the SK-N-AS, SK-N-FI and SK-N-SH cell
lines (at least P<0.01) (Fig.
2A-E).
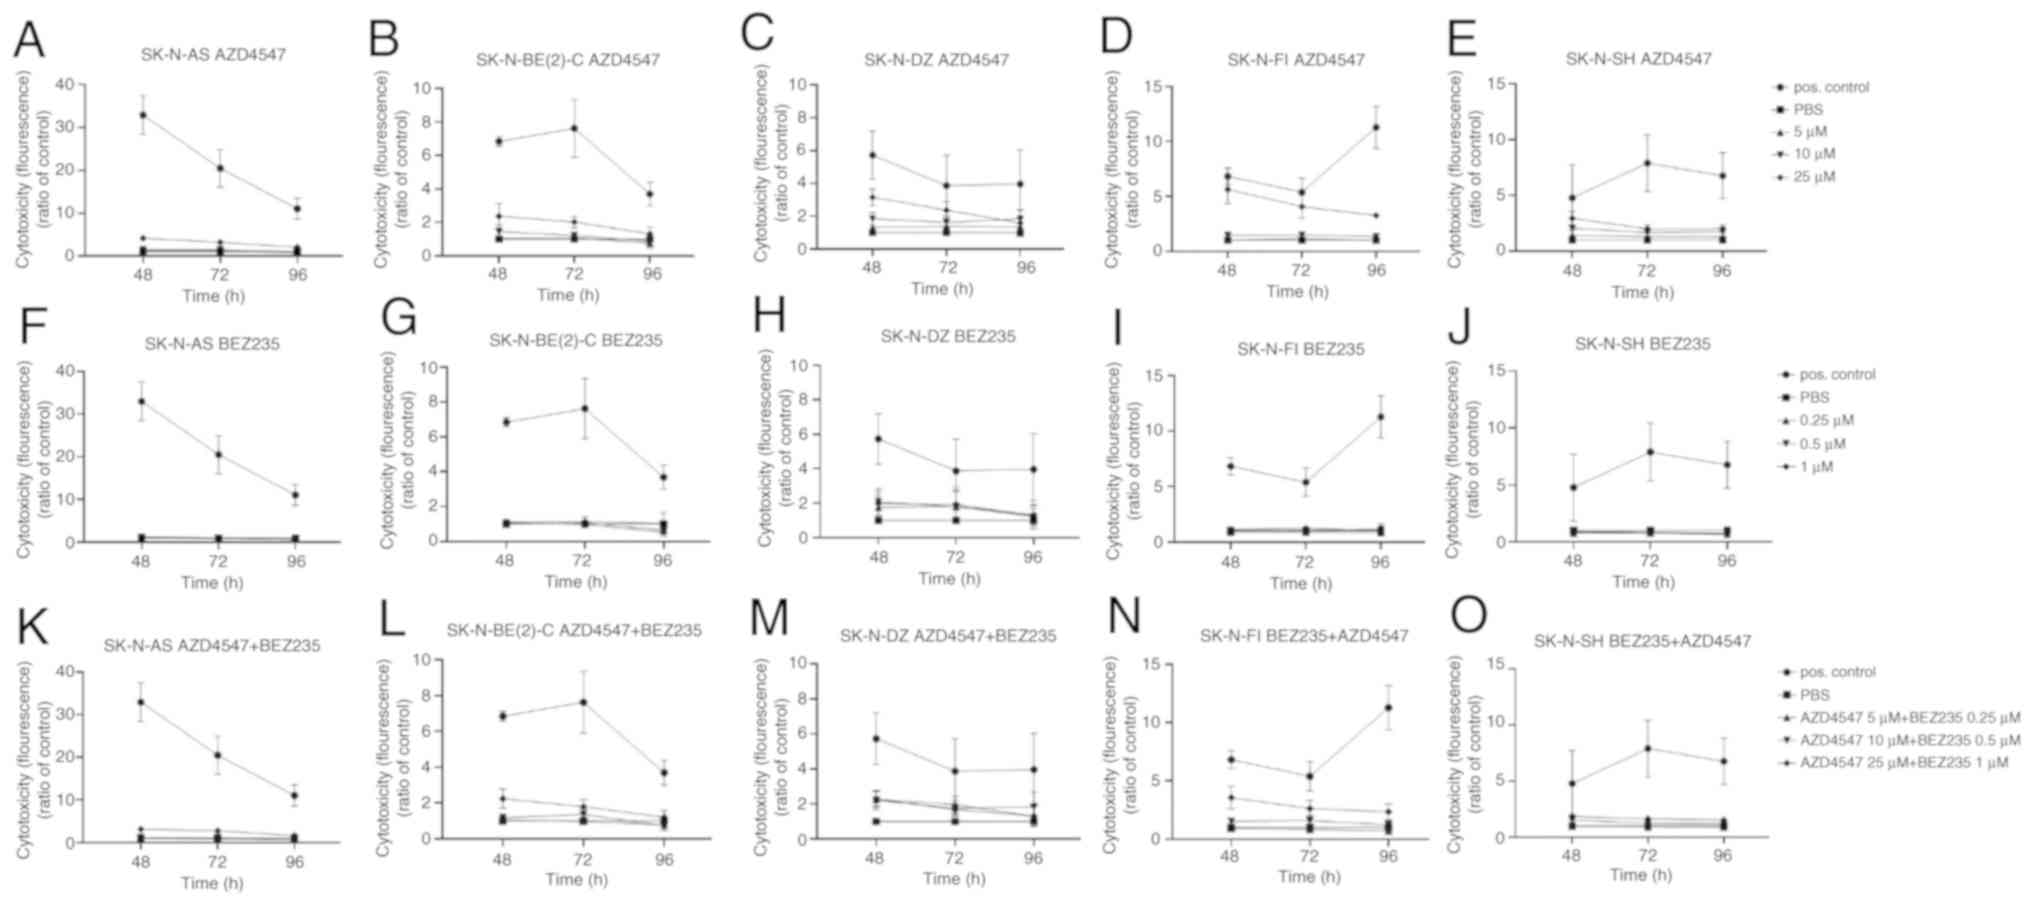 | Figure 2CellTox™ Green Cytotoxicity assay on
the SK-N-AS, SK-N-BE(2)-C, SK-N-DZ, SK-N-FI and SK-N-SH cell lines.
CellTox™ Green cytotoxicity assay was performed by measuring
fluorescence following treatment of the aforementioned NB cell
lines with (A-E) the FGFR inhibitor, AZD4547, and (F-J) PI3K
inhibitor, BEZ235 for 48, 72 and 96 h. (K-O) Combined treatment of
the aforementioned cell lines with the FGFR inhibitor, AZD4547, and
PI3K inhibitor, BEZ235. The graphs represent 3 experimental runs
per cell line and results are presented as the means ± SD. NB,
neuroblastoma; FGFR, fibroblast growth factor receptor; PI3K,
phosphoinositide 3-kinase. |
BEZ235
Only sporadically were minor significant increases
observed in the majority of cell lines (Fig. 2F, G, I and J).
Caspase-Glo 3/7 apoptosis assay following
treatment of the SK-N-AS, SK-N-BE(2)-C, SK-N-DZ, SK-N-FI and
SK-N-SH NB cell lines with the FGFR inhibitor, AZD4547, and PI3K
inhibitor, BEZ235 independently
General set up
The effect on apoptosis was evaluated by Caspase-Glo
3/7 apoptosis assay 48, 72 and 96 h following treatment of the
SK-N-AS, SK-N-BE(2)-C, SK-N-DZ, SK-N-FI and SK-N-SH cell lines with
the FGFR inhibitor, AZD4547, and the PI3K inhibitor, BEZ235, at
various concentrations normalized against PBS. Only increases in
luminescence, as compared to the PBS control, were observed and are
described below.
AZD4547
A significant increase in apoptosis (i.e., in
luminescence) was observed at 48 h in the SK-N-FI and SK-N-BE(2)-C
cells lines (at least P<0.01) and at 72 h in the SK-N-BE(2)-C,
SK-N-FI and SK-N-SH cells lines (at least P<0.05) following
treatment with 25 µM AZD4547, as compared to the PBS
control, but not in the SK-N-AS and SK-N-DZ cells lines, as shown
in Fig. 3A-E. A significant
increase in luminescence was also observed in the SK-N-SH cells at
48 and 72 h following treatment with 10 µM AZD4547 (at least
P<0.05; Fig. 3E). No
significant increases were observed in the cell lines at a
concentration of 5 µM AZD4547.
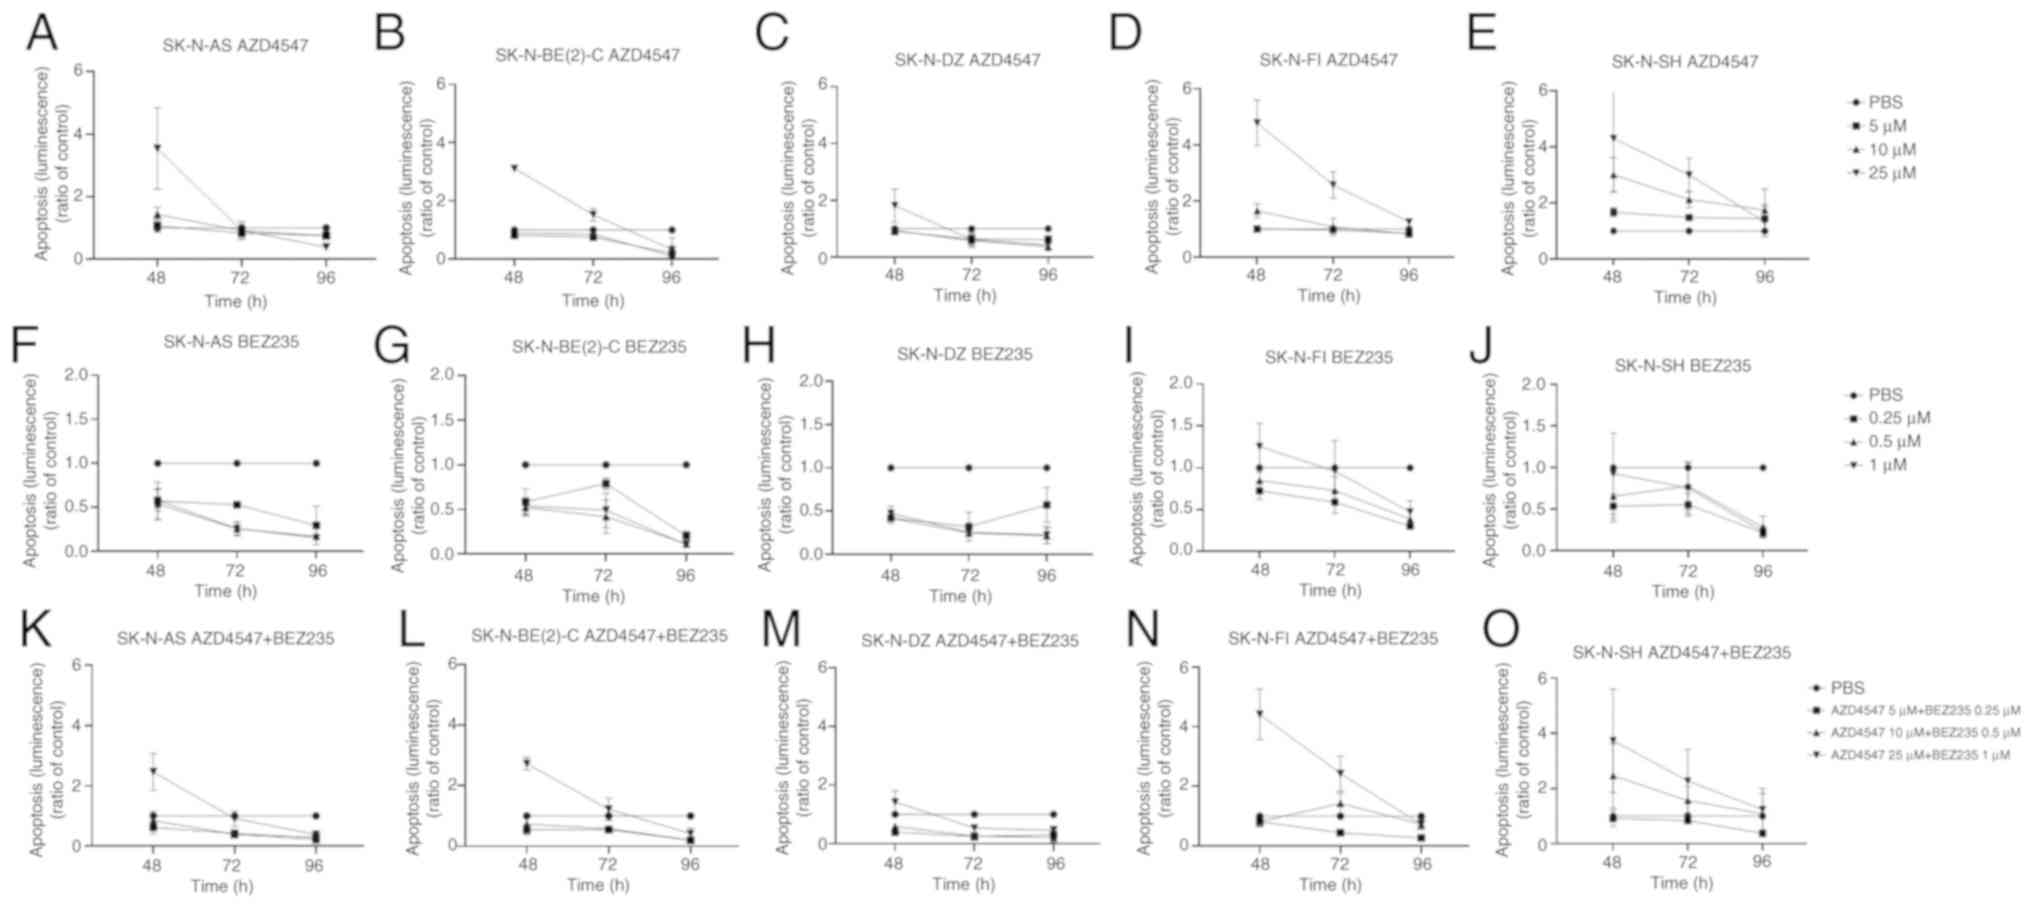 | Figure 3Caspase-Glo 3/7 apoptosis assay of
the SK-N-AS, SK-N-BE(2)-C, SK-N-DZ, SK-N-FI and SK-N-SH cell lines.
Caspase-Glo 3/7 apoptosis assay measured by luminescence following
treatment of the 5 neuroblastoma cell lines with (A-E) the FGFR
inhibitor, AZD4547, and (F-J) PI3K inhibitor, BEZ235, for 48, 72
and 96 h. (K-O) Combined treatment of the cells lines with the FGFR
inhibitor, AZD4547, and PI3K inhibitor, BEZ235. The graphs
represent 3 experimental runs per cell line and results are
presented as the means ± SD. FGFR, fibroblast growth
factorreceptor; PI3K, phosphoinositide 3-kinase. |
BEZ235
No significant increases in apoptosis (i.e.,
luminescence) were observed in any of the cell lines, as compared
to the PBS control (Fig. 3F-J),
although there was a tendency towards an increase in luminescence
in the SK-N-FI cell line following 48 h of treatment with 5.0
µM BEZ235 (Fig. 3I).
Proliferation assay using the xCELLigence
System following treatment of the SK-N-AS, SK-N-BE(2)-C, SK-N-DZ,
SK-N-FI and SK-N-SH NB cell lines with the FGFR inhibitor, AZD4547,
and PI3K inhibitor, BEZ235, independently
General set up
The xCELLigence System was used to follow
proliferation for 90 h following treatment of the SK-N-AS,
SK-N-BE(2)-C, SK-N-DZ, SK-N-FI and SK-N-SH NB cell lines with the
FGFR AZD4547 and PI3K BEZ235 inhibitors. PBS was used as a
control.
AZD4547
Complete or considerate inhibition was observed in
all cell lines with 25 µM, but not with 5 µM AZD4547
during the entire observation period (Fig. 4A-E).
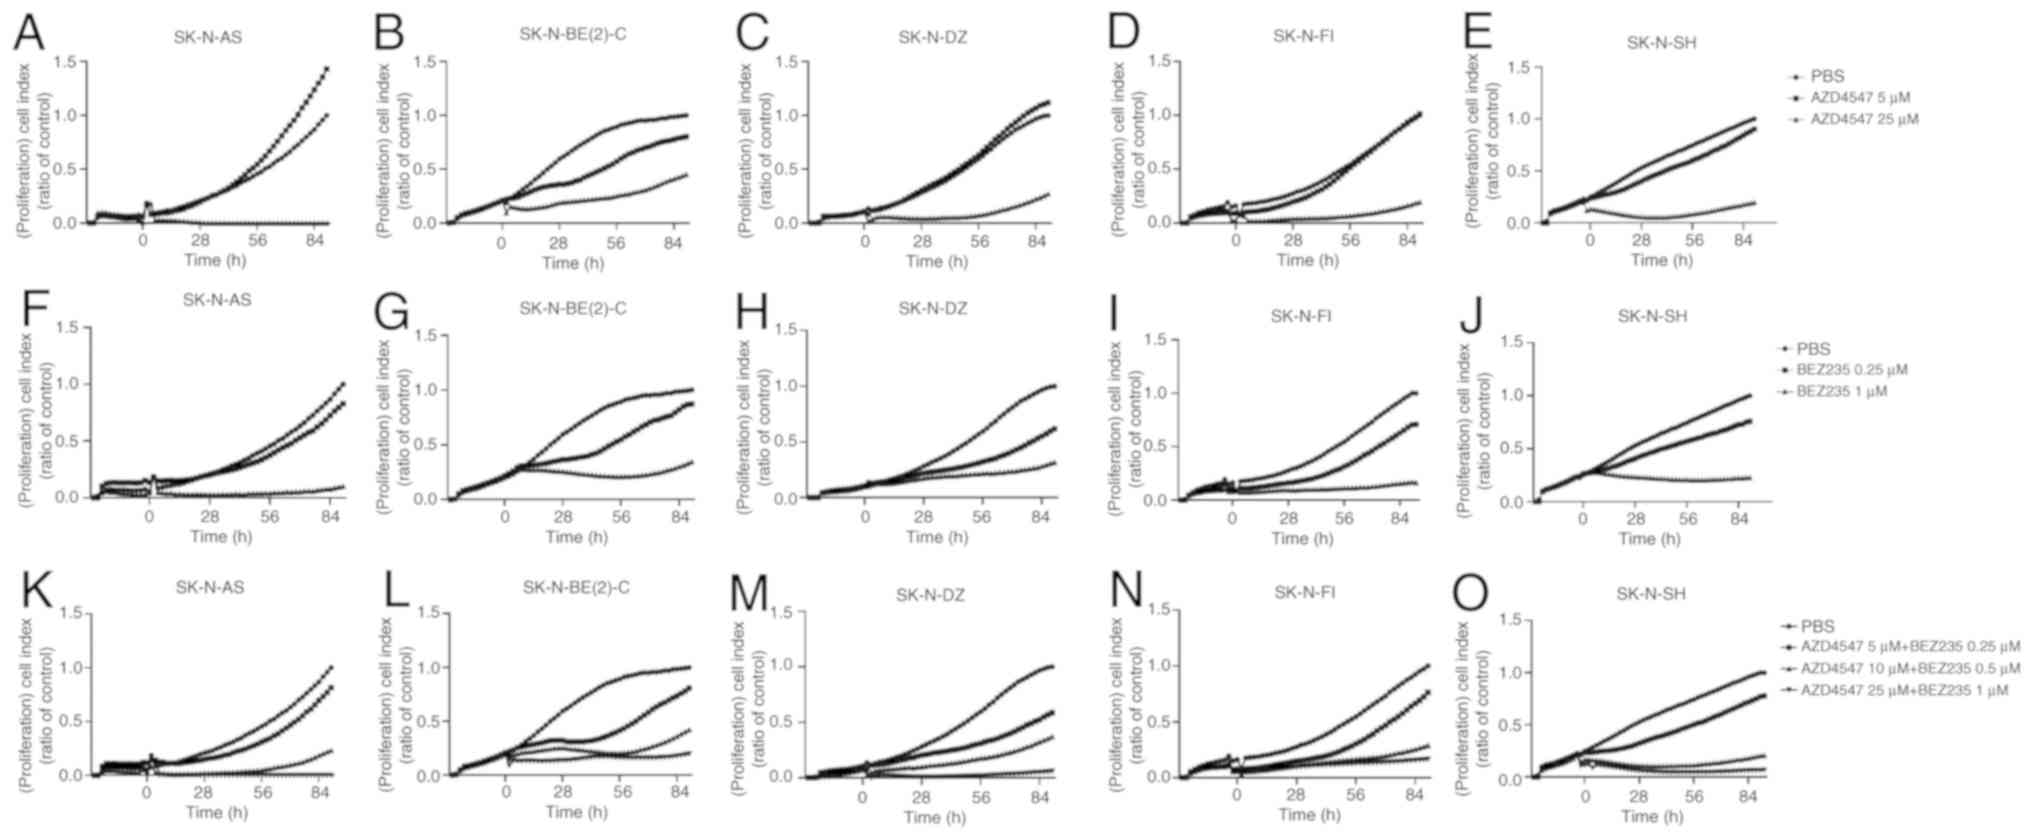 | Figure 4Proliferation assay performed on
SK-N-AS, SK-N-BE(2)-C, SK-N-DZ, SK-N-FI and SK-N-SH cell lines.
Proliferation assay results were expressed as cell index following
treatment with (A-E) the FGFR inhibitor, AZD4547, and (F-J) PI3K
inhibitor, BEZ235, on SK-N-AS, SK-N-BE(2)-C, SK-N-DZ, SK-N-FI and
SK-N-SH cell lines, respectively. (K-O) Combined treatment with the
FGFR inhibitor, AZD4547, and PI3K inhibitor, BEZ235, on these cell
lines. The graphs represent one typical experiment, and results are
presented as the mean of two wells. FGFR, fibroblast growth factor
receptor; PI3K, phosphoinositide 3-kinase. |
BEZ235
Complete or considerable inhibition of proliferation
was observed in all NB lines during the observation period
following treatment with 1 but not 0.25 µM BEZ235 (Fig. 4F-J).
Treatment of the SK-N-AS, SK-N-BE(2)-C,
SK-N-DZ, SK-N-FI and SK-N-SH NB cell lines with the FGFR inhibitor,
AZD4547, and the PI3K inhibitor, BEZ235, in combination. General
set up
The inhibitory effects on cell viability and
proliferation following treatment with the FGFR inhibitor, AZD4547,
and the PI3K inhibitors, BEZ235 and BKM120, are shown above. To
further examine the potential therapeutic role of these drugs and
explore whether lower drug concentrations could be used, two types
of drugs were combined and examined. For this purpose, cell
viability, cytotoxicity, apoptosis and proliferation were analyzed
in all 5 NB cell lines using the WST-1, CellTox™ Green Cytotoxicity
and Caspase-Glo 3/7 apoptosis assays, and the xCELLigence System,
respectively. The SK-N-SH, and possibly the SK-N-DZ cells, were
found above to be generally more sensitive cell lines, while the
SK-N-AS, SK-N-BE(2)-C and SK-N-FI more resistant/intermediately
sensitive cell lines.
WST-1 viability analysis following
treatment of SK-N-AS, SK-N-BE(2)-C, SK-N-DZ, SK-N-FI and SK-N-SH NB
cell lines with FGFR inhibitor AZD4547 and PI3K inhibitor BEZ235
combined
The highest concentration combinations, 25 µM
AZD4547 and 1 µM BEZ235, 10 µM AZD4547 and 5
µM BEZ235, as well as 10 µM AZD4547 and 1 µM
BEZ235, induced a ≥50% decrease in absorbance in all NB cell lines
during the entire observation period (at least P<0.05; Fig. 1P-T).
Lower concentration combinations of 10 µM
AZD4547 and 0.5 µM BEZ235, 10 µM AZD4547 and 0.25
µM BEZ235, 5 µM AZD4547 and 1 µM of BEZ235, as
well as 5 µM AZD4547 and 0.5 µM BEZ235, also induced
a ≥50% decrease in absorbance at 48-72 h in all NB lines (at least
P<0.05) (Fig. 1P-T).
The lowest concentration combination, 5 µM
AZD4547 and 0.25 µM BEZ235, resulted in a ≥50% decrease in
absorbance after 72 h for all cell lines, which was also observed
after 24 and 48 h in SK-N-BE(2)-C, SK-N-DZ and SK-N-SH cell lines
(at least P<0.01; Fig.
1P-T).
Combined effect analysis was also performed to
further evaluate possible positive synergism, the additive effects
or antagonism between the two drugs that were used. Two different
approaches were used: The effect-based highest single agent
approach and dose-effect-based median-effect principle. CIs from
both methods assessing the combinational effect in SK-N-AS,
SK-N-BE(2)-C, SK-N-DZ, SK-N-FI and SK-N-SH cell lines at 24 h are
displayed in Fig. 5. All tested
combinations, apart from two, were rated as positive by the highest
single agent approach (Fig. 5A)
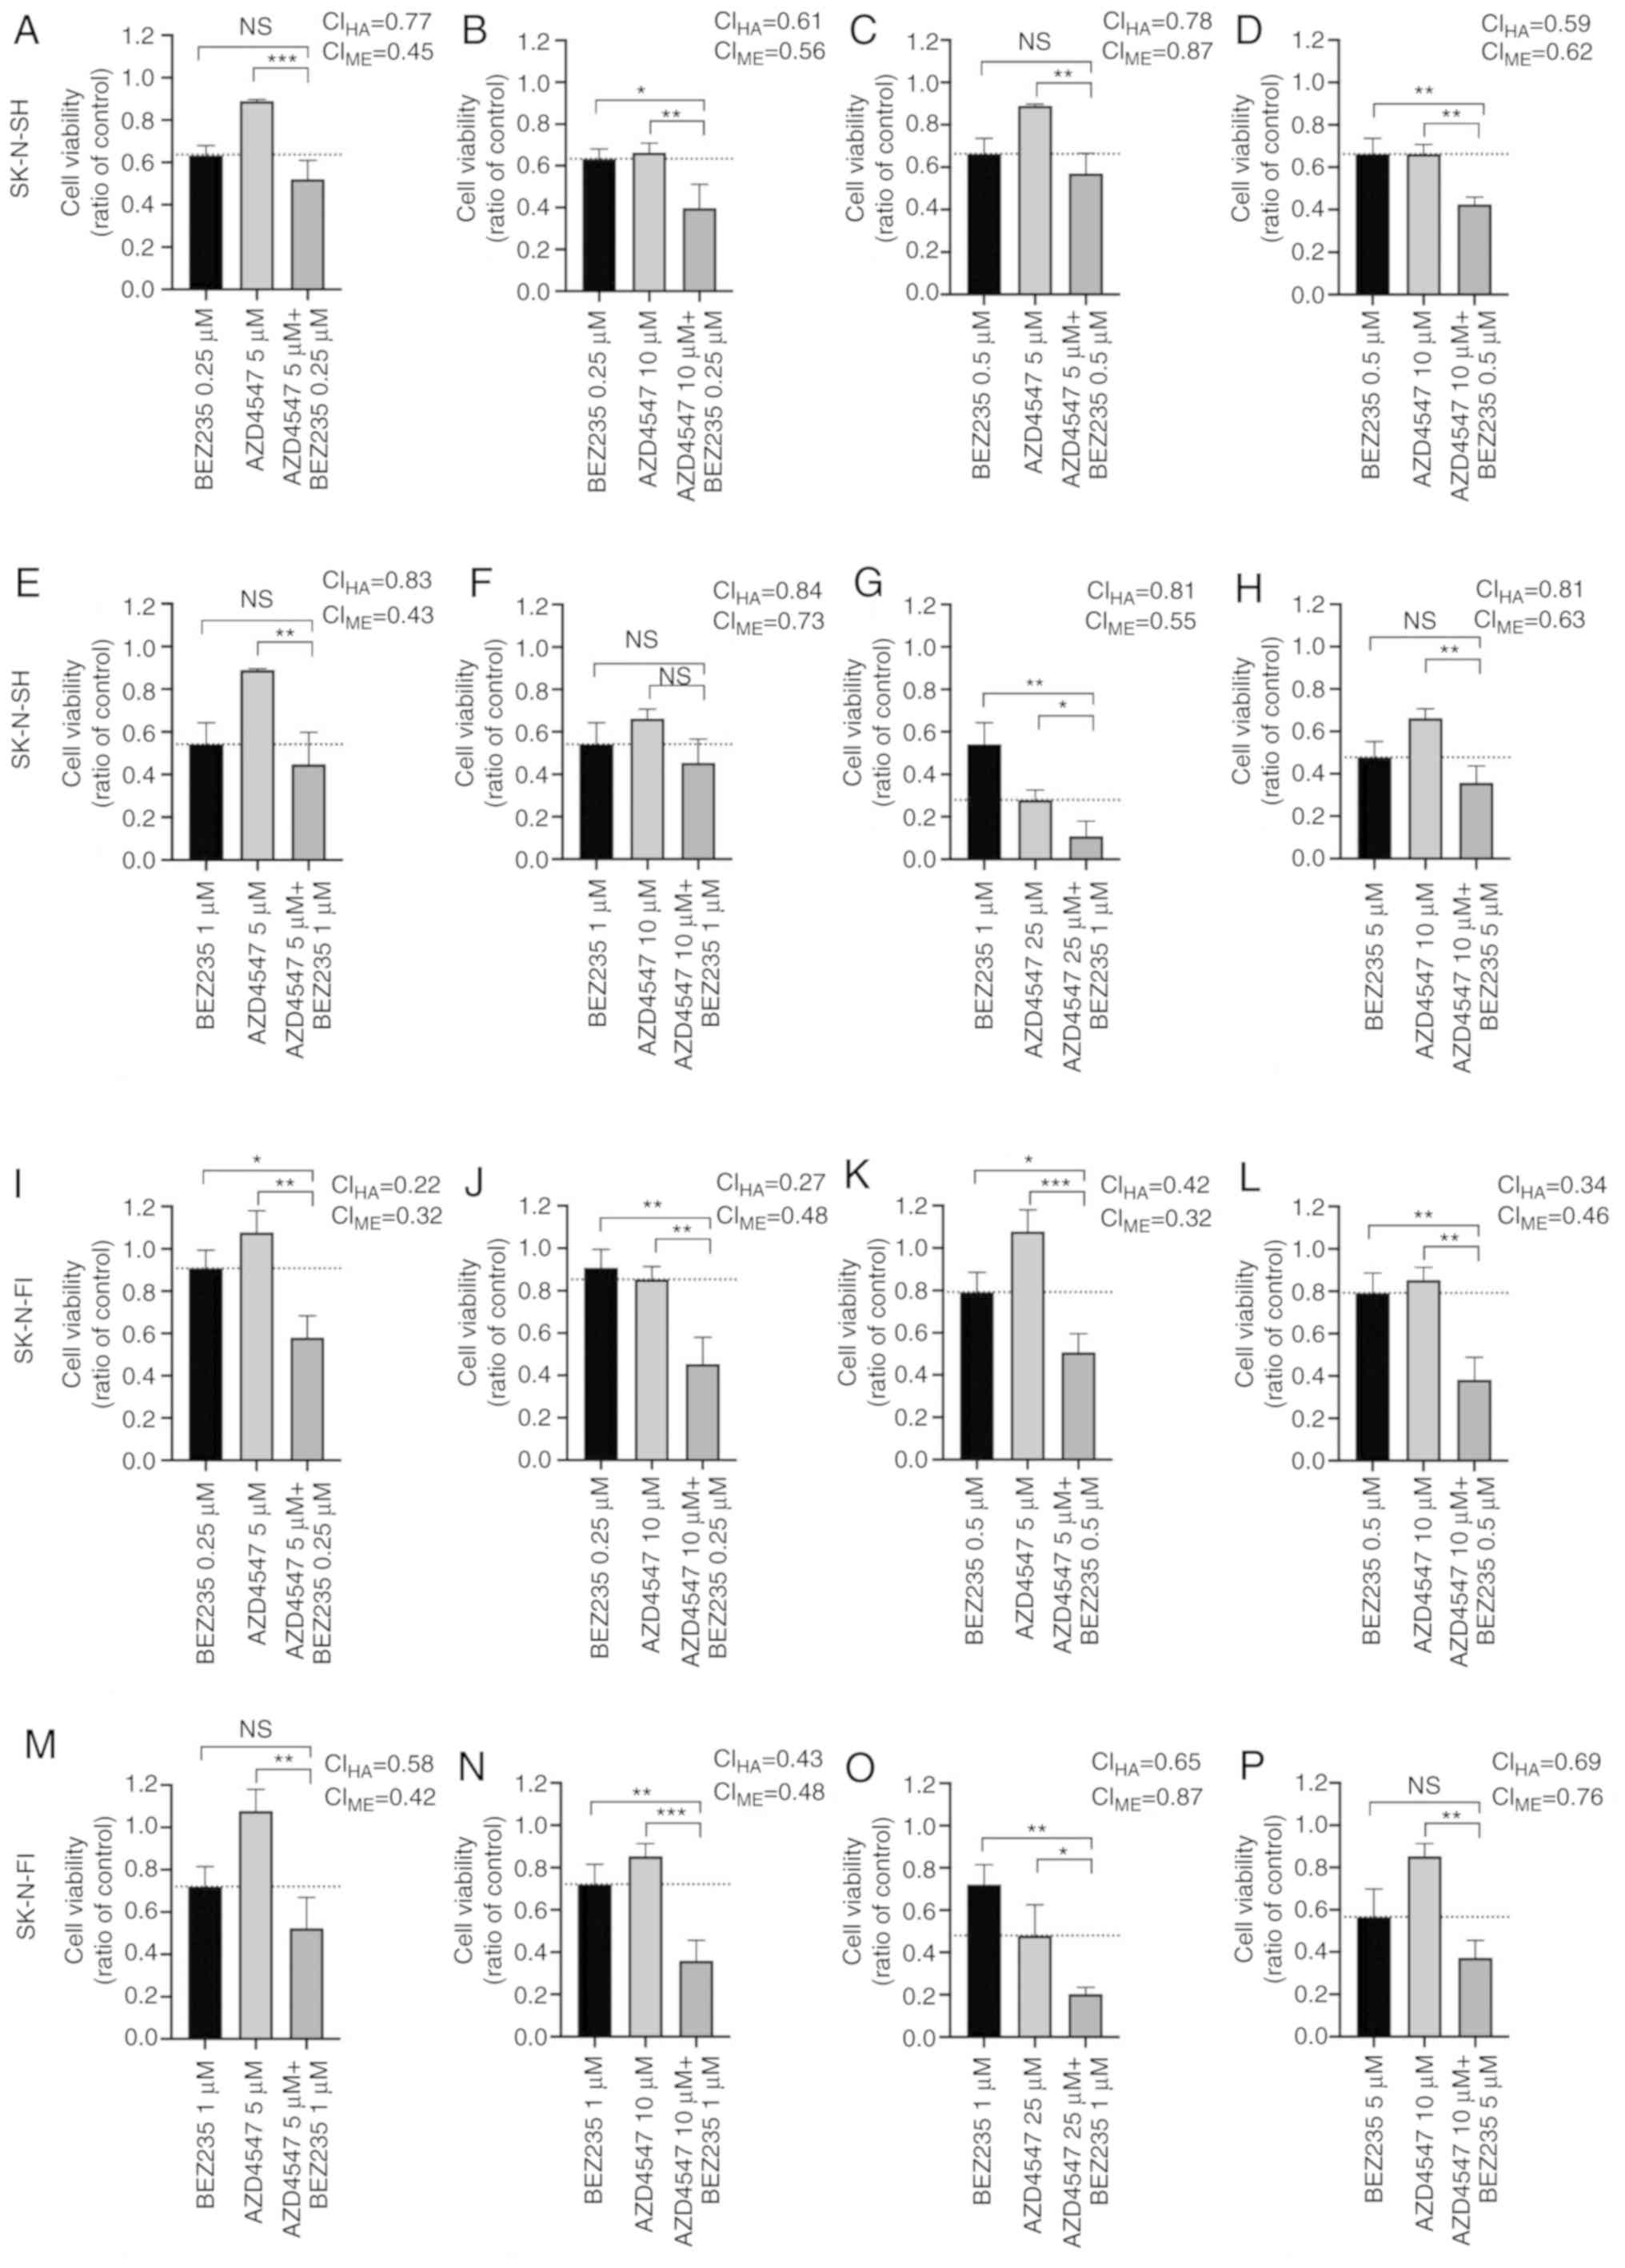
and additive/synergistic by the median-effect principle (Fig. 5B). Viability following treatment of
the cell lines with single doses of AZD4547 and BEZ235, as well as
dose combinations, was also illustrated in staple diagrams. These
diagrams are illustrated in Fig.
6, following 24 h of treatment of the sensitive SK-N-SH and
more resistant SK-N-FI cell lines with different drug combinations.
At 24 h, the decrease in viability was significant in the SK-N-SH
cell line in 3/8 tested combinations (Fig. 6B, D and G), and in the more
resistant SK-N-FI in 6/8 combinations (Fig. 6I-L, N and O), as compared to both
single drugs. Particularly in the SK-N-FI cell line, a potent
synergistic effect on cell viability was observed at the lower dose
combinations (5 or 10 µM AZD4547 and 0.25 µM or 0.5
µM BEZ235), whereas the single drugs had a minor or no
effect (Fig. 6I-L). No combination
in any of the 5 tested cell lines induced a significantly weaker
effect on viability than AZD4547 and BEZ235 alone (data not
shown).
CellTox™ Green Cytotoxicity assay
following combined treatment of the SK-N-AS, SK-N-BE(2)-C, SK-N-DZ,
SK-N-FI and SK-N-SH NB cell lines with the FGFR inhibitor, AZD4547,
and the PI3K inhibitor, BEZ235
CellTox™ Green Cytotoxicity assay was performed
with FGFR and PI3K inhibitors used in combination on the SK-N-AS,
SK-N-BE(2)-C, SK-N-DZ, SK-N-FI and SK-N-SH NB cell lines at 48, 72
and 96 h after treatment. The cytotoxic effect of the positive
control was significantly higher than all other effects in all
cases. Differences in fluorescence were calculated in comparison to
the PBS base line control.
The highest concentration combination, 25 µM
AZD4547 and 1 µM BEZ235, induced a significant increase in
fluorescence, as compared to PBS at 48 h following treatment in all
cell lines (at least P<0.05); after 72 h for the SK-N-AS,
SK-N-DZ, SK-N-FI and SK-N-SH cells (at least P<0.05), and after
96 h for the SK-N-AS, SK-N-FI and SK-N-SH (at least P<0.05)
(Fig. 2K-O).
The intermediate concentration combination, 10
µM AZD4547 and 0.5 µM BEZ235, induced a significant
increase in fluorescence at 48 h following treatment only of the
SK-N-BE(2)-C and SK-N-FI cells (at least P<0.05; Fig. 2K-O).
The lowest concentration combination, 5 µM
AZD4547 and 0.25 µM of BEZ235, induced a significant
increase in fluorescence after 48 h only in the SK-N-BE(2)-C and
SK-N-DZ (at least P<0.05; Fig.
2K-O).
Caspase-Glo 3/7 apoptosis assay following
combined treatment of the SK-N-AS, SK-N-BE(2)-C, SK-N-DZ, SK-N-FI
and SK-N-SH NB cell lines with the FGFR inhibitor, AZD4547, and
PI3K inhibitor, BEZ235
To evaluate the effects of treatment on apoptosis,
Caspase-Glo 3/7 apoptosis assay was performed 48, 72 and 96 h
following treatment of the SK-N-AS, SK-N-BE(2)-C, SK-N-DZ, SK-N-FI
and SK-N-SH cell lines with a combination of various concentrations
of the FGFR inhibitor, AZD4547, and PI3K inhibitor, BEZ235. Only
increases in luminescence, as compared to the PBS control, were
observed and are described below.
The highest concentration combination, 25 µM
AZD4547 and 1 µM BEZ235, induced a significant increase in
apoptosis (i.e., luminescence) in all cell lines apart from the
SK-N-DZ cells, as compared to PBS 48 h after treatment (at least
P<0.05; Fig. 3K-O).
Following the intermediate concentration
combination, 10 µM AZD4547 and 0.5 µM BEZ235, only a
tendency of an increase in luminescence was observed at 48 and 72 h
in the SK-N-SH cell line, which was not significant. No significant
increases were observed in the other cell lines either (Fig. 3K-O).
The lowest concentration combination, 5 µM
AZD4547 and 0.25 µM BEZ235, did not induce any significant
increases in luminescence in any of the cell lines (Fig. 3K-O).
Proliferation assay following treatment
with the FGFR inhibitor, AZD4547, and PI3K inhibitor, BEZ235, used
in combination on the SK-N-AS, SK-N-BE(2)-C, SK-N-DZ, SK-N-FI and
SK-N-SH cell lines
The highest concentration combination, 25 µM
AZD4547 and 1 µM BEZ235, induced an almost complete
inhibition of proliferation in all cell lines during the entire
observation period (Fig.
4K-O).
The intermediate concentration combination, 10
µM AZD4547 and 0.5 µM BEZ235, produced a considerate,
or almost complete, inhibition of the proliferation of all cell
lines (Fig. 4K-O).
The lowest concentration combination, 5 µM
AZD4547 and 0.25 µM BEZ235, was not as efficient for any of
the tested cell lines, inducing an intermediate (SK-N-DZ) or slight
(SK-N-AS, SK-N-BE(2)-C, SK-N-FI and SK-N-SH) inhibition of
proliferation (Fig. 4K-O).
Representative images of the NB cell lines treated with PI3K and
FGFR3 inhibitors alone and in combination are shown in Fig. S3.
Discussion
NB is a highly lethal disease and novel therapies
based on biological understanding are warranted. Herein, the
presence of common FGFR3 and PIK3CA mutations were
tested in 29 NB tumors. In addition, the ability of FGFR and PI3K
inhibitors, alone or in combination, to inhibit the growth of
SK-N-AS, SK-N-BE(2)-C, SK-N-DZ, SK-N-FI and SK-N-SH NB cell lines
was tested. An FGFR3 mutation was found in 1/29 NBs, and all
5 NB cell lines were found to be rather sensitive to both the FGFR
and PI3K inhibitors alone; the combination of the two drugs
considerably increased the inhibitory effect on viability and
proliferation.
One of the 29 NBs exhibited an FGFR3 K650Q
mutation, which is common, but not the most frequently occurring
mutation (36). This is
noteworthy, since mutations in childhood cancers are unusual, and
there are very few or no reports currently available on
FGFR3 mutations in childhood cancer, at least to the best of
our knowledge. Nevertheless, it has been reported that FGFR3
mutations in the germline are associated with hypochondroplasia or
other dysplasias in children (37,38).
Further knowledge on the subject is warranted; however, it is
possible that, in the rare cases of childhood cancer with
FGFR3 mutations, as well as childhood cancer cases without
FGFR3 or PIK3CA mutations, targeted FGFR therapy
could be of use. Directed therapy against FGFR, in patients and
in vitro, alone and in combination with other drugs (i.e.,
PI3K inhibitors), has been studied more extensively in other types
of cancer, particularly bladder cancer, and can also be effective
in cells without FGFR or PIK3CA mutations (39-43).
The synergistic effects of FGFR and mTOR kinase inhibitors have
been observed following in vitro testing of ovarian cancer
cell lines (44). This approach
could also help avoid the development of resistance that has been
reported following the use of a single drug (40,41).
In the present study, the use of FGFR and PI3K
inhibitors alone and in combination was investigated on 5 NB cell
lines, SK-N-AS, SK-N-BE(2)-C, SK-N-DZ, SK-N-FI and SK-N-SH. In the
growth inhibition assays, SK-N-SH was exceptionally sensitive to
AZD4547, but also somewhat sensitive to both PI3K inhibitors, while
the SK-N-BE(2)-C and SK-N-DZ cells were less sensitive to AZD4547,
but still sensitive to both PI3K inhibitors. The SK-N-FI and
SK-N-AS cells were generally less sensitive to both inhibitors than
the other 3 cell lines, but did in fact show some sensitivity to
BEZ235. All cell lines were considerably more sensitive to AZD4547
and BEZ235 combination treatments.
The overall sensitivity of SK-N-SH to both
inhibitors has no simple explanation, although it is noteworthy
that this cell line has a neuroblastoma ras viral oncogene
homolog missense mutation (https://depmap.org/portal/). Its sensitivity could
not be attributed to the presence of MYCN amplifications,
since SK-N-SH did not have such amplifications. Nevertheless, the
SK-N-SH cell line is generally less chemoresistant than the other
cell lines included in this study, possibly due to its higher
differentiation status. However, MYCN amplifications were
present in the SK-N-DZ and SK-N-BE(2)-C (https://depmap.org/portal/) cells, which may explain
their sensitivity to BEZ235, which also inhibits mTOR kinases. It
has namely, previously been reported that the inhibition of
mTOR-kinase destabilizes MYCN and could be used as a potential
treatment for MYCN-dependent tumors (16). This is important, particularly for
SK-N-BE(2)-C, which has been shown to have a marked insensitivity
to doxorubicin (28). However, the
development of resistance against targeted therapy that has been
reported when using one drug alone may be combated by using two
drugs in combination (44).
In the present study, the SK-N-FI and SK-N-AS cells
were markedly resistant to the FGFR inhibitor, AZD4547, and were
not particularly sensitive to the PI3K inhibitors, BEZ235 and
BKM120, either. However, similar to all other cell lines, they were
more sensitive to the combination of AZD4547 and BEZ235. The
combination of AZD4547 and BEZ235 induced additive or synergistic
effects in 38/40 tested dose combinations in the 5 tested NB cell
lines; no combination had a significantly weaker effect on
viability than the single drugs alone. The two antagonistic
combinations need to be further investigated in order to understand
their relevance; both involved a high concentration of BEZ235,
which induced a great effect on its own. The positive combinational
effects again emphasized the possible benefit of using the two
drugs simultaneously in severe cases of NB, where the use of one
drug alone is not sufficient to cause abrogation of tumor
growth.
To the best of our knowledge, this is the first
time that drugs against FGFR and PI3K were used in combination for
the treatment of NB cell lines, although the use of PI3K inhibitors
has been documented previously in NB cell lines with favorable
effects (16). When comparing the
concentrations of the PI3K and FGFR inhibitors used herein on the
NB cell lines to those previously used on urinary bladder cell
lines, the drug concentrations of the PI3K inhibitors were
relatively, but not completely, similar, but those of the FGFR
inhibitor AZD4547 were higher (42). It is possible that cell lines with
FGFR or PI3K mutations could require lower drug
concentrations, and such cell lines remain to be tested.
Nevertheless, it has been reported that the presence of PI3K
mutations does not always affect drug sensitivity (45). PI3K mutations have, however,
been reported to affect sensitivity to FGFR inhibitors used to
combat cervical tumors with FGFR3-TACC3-fusion genes, and
the authors therefore suggested the use of combination treatments
(46).
The present study had its limitations, since only
29 NBs and 5 NB cell lines were examined. However, one FGFR3
mutation was identified in 1/29 NBs, indicating that this is not a
frequent event, but still a viable possibility in a minority of NB
cases, and could be followed up in situations where the patient
does not respond to treatment. Furthermore, although only 5 NB
lines were used, they are representative of the types of cell lines
frequently used in the scientific community (24-28,47).
This also applies to the methodologies used herein. In addition,
the assays used in the present study resulted in concordant
findings and indicated that SK-N-SH was the most sensitive cell
line to all treatments, while SK-N-FI was the most resistant one.
The remaining cell lines showed variable responses, possibly due to
the genetic setting of these cell lines, i.e. the presence of
amplified MYCN. In the future, NB lines with FGFR
mutations may be of use to experimentally test it they are more
sensitive to FGFR and PI3K targeted therapy, which has been
indicated in some, but not all, conditions (45).
In conclusion, FGFR3 mutations are uncommon,
but present in NBs. Upon treatment of 5 NB cell lines with either
FGFR and PI3K inhibitors alone, a decrease in viability and
proliferation was observed in most cell lines. However, upon
combination treatment with both types of drugs (AZD4547 and BEZ235)
the sensitivity of all cell lines increased considerably, which may
provide a possible therapeutic strategy for chemotherapy-resistant
NBs.
Supplementary Data
Acknowledgments
The authors would like to thank Associate Professor
Bertha Brodin, Karolinska Institute, for her assistance and the
possibility to perform the proliferation assays by providing the
xCELLigence machine.
Funding
This study was supported by the Swedish Childhood
Cancer Foundation (PR2017-0042, PR2017-0052), the Swedish Cancer
Society (180440, 2017/658), the Stockholm Cancer Society (181053),
the Swedish Cancer and Allergy Foundation (190), the Royal Swedish
Academy of Sciences (2017-2018), the Stockholm City Council
(20180037), the Magnus Bergvall Foundation (2018-02683), the Märta
and Gunnar V Philipson Foundation (2018) and the Karolinska
Institutet of Sweden (2018:0007), Lindhés Advokatbyrå
(LA2019-0080).
Availability of data and materials
The datasets used and/or analyzed during the
current study are available from the corresponding author on
reasonable request.
Authors' contributions
ONK and SH, performed the majority of the
experiments, interpreted the data, calculated the statistics and
contributed to the writing of the manuscript. BKAL collaborated
with ONK and SH in performing some experiments and in the writing
of the manuscript. AO initiated the experiments, interpreted the
initial experiments and contributed to the writing of the Materials
and methods section, all under the supervision of CB, who also
planned the initial experiments and performed the CAST-PCR. TA
collaborated with SH and ONK, performed the western blot analysis
experiment and contributed with SH and ONK to the writing of the
manuscript. MW assisted the authors in planning some experiments,
performed combinational analyses, and assisted in the final
interpretation and presentation of the data and the writing and
statistics of the manuscript. TD made substantial contributions to
the conception and design, acquisition of the data, analysis and
interpretation of the data, and was involved in the drafting of the
manuscript and revising it critically for important intellectual
content. All authors have agreed to be accountable for all aspects
of the work in ensuring that questions related to the accuracy and
integrity of any part of the work are appropriately investigated
and resolved. All authors have critically read and approved the
manuscript.
Ethics approval and consent to
participate
With regard to patient information, the study was
approved by the Ethical Committee of the Karolinska Institutet
(Stockholm, Sweden; approval nos. 2009/1369-31/1, 2007/1253-31/3
and 2003/736). Informed consent for the use of tumor samples in
research was provided by the parents/guardians. In accordance with
the approval from the Ethics Committee the informed consent was
either written or verbal. When verbal or written assent was not
obtained the decision was documented in the medical record.
Patient consent for publication
Not applicable.
Competing interests
The authors declare that they have no competing
interests.
References
|
1
|
Wesche J, Haglund K and Haugsten EM:
Fibroblast growth factors and their receptors in cancer. Biochem J.
437:199–213. 2011. View Article : Google Scholar : PubMed/NCBI
|
|
2
|
Parker BC, Engels M, Annala M and Zhang W:
Emergence of FGFR family gene fusions as therapeutic targets in a
wide spectrum of solid tumours. J Pathol. 232:4–15. 2014.
View Article : Google Scholar : PubMed/NCBI
|
|
3
|
Testa U, Castelli G and Pelosi E: Lung
cancers: Molecular characterization, clonal heterogeneity and
evolution, and cancer stem cells. Cancers (Basel). 10:E2482018.
View Article : Google Scholar
|
|
4
|
Meric-Bernstam F, Frampton GM,
Ferrer-Lozano J, Yelensky R, Pérez-Fidalgo JA, Wang Y, Palmer GA,
Ross JS, Miller VA, Su X, et al: Concordance of genomic alterations
between primary and recurrent breast cancer. Mol Cancer Ther.
13:1382–1389. 2014. View Article : Google Scholar : PubMed/NCBI
|
|
5
|
Bersani C, Sivars L, Haeggblom L,
DiLorenzo S, Mints M, Ahrlund-Richter A, Tertipis N, Munck-Wikland
E, Näsman A, Ramqvist T and Dalianis T: Targeted sequencing of
tonsillar and base of tongue cancer and human papillomavirus
positive unknown primary of the head and neck reveals prognostic
effects of mutated FGFR3. Oncotarget. 8:35339–35350. 2017.
View Article : Google Scholar : PubMed/NCBI
|
|
6
|
Taylor JG VI, Cheuk AT, Tsang PS, Chung
JY, Song YK, Desai K, Yu Y, Chen QR, Shah K, Youngblood V, et al:
Identification of FGFR4-activating mutations in human
rhabdomyosarcomas that promote metastasis in xenotransplanted
models. J Clin Invest. 119:3395–3407. 2009.PubMed/NCBI
|
|
7
|
Lehtinen B, Raita A, Kesseli J, Annala M,
Nordfors K, Yli-Harja O, Zhang W, Visakorpi T, Nykter M, Haapasalo
H and Granberg KJ: Clinical association analysis of ependymomas and
pilocytic astrocytomas reveals elevated FGFR3 and FGFR1 expression
in aggressive ependymomas. BMC Cancer. 17:3102017. View Article : Google Scholar : PubMed/NCBI
|
|
8
|
Parker BC, Annala MJ, Cogdell DE, Granberg
KJ, Sun Y, Ji P, Li X, Gumin J, Zheng H, Hu L, et al: The
tumorigenic FGFR3-TACC3 gene fusion escapes miR-99a regulation in
glioblastoma. J Clin Invest. 123:855–865. 2013.PubMed/NCBI
|
|
9
|
Agelopoulos K, Richter GH, Schmidt E,
Dirksen U, von Heyking K, Moser B, Klein HU, Kontny U, Dugas M,
Poos K, et al: Deep sequencing in conjunction with expression and
functional analyses reveals activation of FGFR1 in ewing sarcoma.
Clin Cancer Res. 21:4935–4946. 2015. View Article : Google Scholar : PubMed/NCBI
|
|
10
|
Gallia GL, Rand V, Siu IM, Eberhart CG,
James CD, Marie SK, Oba-Shinjo SM, Carlotti CG, Caballero OL,
Simpson AJ, et al: PIK3CA gene mutations in pediatric and adult
glioblastoma multiforme. Mol Cancer Res. 4:709–714. 2006.
View Article : Google Scholar : PubMed/NCBI
|
|
11
|
Grill J, Puget S, Andreiuolo F, Philippe
C, MacConaill L and Kieran MW: Critical oncogenic mutations in
newly diagnosed pediatric diffuse intrinsic pontine glioma. Pediatr
Blood Cancer. 58:489–491. 2012. View Article : Google Scholar
|
|
12
|
Shukla N, Ameur N, Yilmaz I, Nafa K, Lau
CY, Marchetti A, Borsu L, Barr FG and Ladanyi M: Oncogene mutation
profiling of pediatric solid tumors reveals significant subsets of
embryonal rhabdomyosarcoma and neuroblastoma with mutated genes in
growth signaling pathways. Clin Cancer Res. 18:748–757. 2012.
View Article : Google Scholar :
|
|
13
|
Dam V, Morgan BT, Mazanek P and Hogarty
MD: Mutations in PIK3CA are infrequent in neuroblastoma. BMC
Cancer. 6:1772006. View Article : Google Scholar : PubMed/NCBI
|
|
14
|
Izycka-Swieszewska E, Brzeskwiniewicz M,
Wozniak A, Drozynska E, Grajkowska W, Perek D, Balcerska A,
Klepacka T and Limon J: EGFR, PIK3CA and PTEN gene status and their
protein product expression in neuroblastic tumours. Folia
Neuropathol. 48:238–245. 2010.
|
|
15
|
Opel D, Poremba C, Simon T, Debatin KM and
Fulda S: Activation of Akt predicts poor outcome in neuroblastoma.
Cancer Res. 67:735–745. 2007. View Article : Google Scholar : PubMed/NCBI
|
|
16
|
Vaughan L, Clarke PA, Barker K, Chanthery
Y, Gustafson CW, Tucker E, Renshaw J, Raynaud F, Li X, Burke R, et
al: Inhibition of mTOR-kinase destabilizes MYCN and is a potential
therapy for MYCN-dependent tumors. Oncotarget. 7:57525–57544. 2016.
View Article : Google Scholar : PubMed/NCBI
|
|
17
|
Chesler L, Schlieve C, Goldenberg DD,
Kenney A, Kim G, McMillan A, Matthay KK, Rowitch D and Weiss WA:
Inhibition of phosphatidylinositol 3-kinase destabilizes Mycn
protein and blocks malignant progression in neuroblastoma. Cancer
Res. 66:8139–8146. 2006. View Article : Google Scholar : PubMed/NCBI
|
|
18
|
Segerström L, Baryawno N, Sveinbjörnsson
B, Wickström M, Elfman L, Kogner P and Johnsen JI: Effects of small
molecule inhibitors of PI3K/Akt/mTOR signaling on neuro-blastoma
growth in vitro and in vivo. Int J Cancer. 129:2958–2965. 2011.
View Article : Google Scholar
|
|
19
|
Klempner SJ, Myers AP and Cantley LC: What
a tangled web we weave: Emerging resistance mechanisms to
inhibition of the phosphoinositide 3-kinase pathway. Cancer Discov.
3:1345–1354. 2013. View Article : Google Scholar : PubMed/NCBI
|
|
20
|
Maris JM: Recent advances in
neuroblastoma. N Engl J Med. 362:2202–2211. 2010. View Article : Google Scholar : PubMed/NCBI
|
|
21
|
Brodeur GM: Neuroblastoma: Biological
insights into a clinical enigma. Nat Rev Cancer. 3:203–216. 2003.
View Article : Google Scholar : PubMed/NCBI
|
|
22
|
Giraud G, Ramqvist T, Pastrana DV, Pavot
V, Lindau C, Kogner P, Orrego A, Buck CB, Allander T, Holm S, et
al: DNA from KI, WU and Merkel cell polyomaviruses is not detected
in childhood central nervous system tumours or neuroblastomas. PLoS
One. 4:e82392009. View Article : Google Scholar : PubMed/NCBI
|
|
23
|
Kocak H, Ackermann S, Hero B, Kahlert Y,
Oberthuer A, Juraeva D, Roels F, Theissen J, Westermann F, Deubzer
H, et al: Hox-C9 activates the intrinsic pathway of apoptosis and
is associated with spontaneous regression in neuroblastoma. Cell
Death Dis. 4:e5862013. View Article : Google Scholar : PubMed/NCBI
|
|
24
|
Biedler JL, Helson L and Spengler BA:
Morphology and growth, tumorigenicity, and cytogenetics of human
neuroblastoma cells in continuous culture. Cancer Res.
33:2643–2652. 1973.PubMed/NCBI
|
|
25
|
Biedler JL and Spengler BA: A novel
chromosome abnormality in human neuroblastoma and
antifolate-resistant Chines hamster cell lives in culture. J Natl
Cancer Inst. 57:683–695. 1976. View Article : Google Scholar : PubMed/NCBI
|
|
26
|
Sugimoto T, Tatsumi E, Kemshead JT, Helson
L, Green AA and Minowada J: Determination of cell surface membrane
antigens common to both human neuroblastoma and leukemia-lymphoma
cell lines by a panel of 38 monoclonal antibodies. J Natl Cancer
Inst. 73:51–57. 1984.PubMed/NCBI
|
|
27
|
Helson L and Helson C: Human neuroblastoma
cells and 13-cis-retinoic acid. J Neurooncol. 3:39–41.
1985.PubMed/NCBI
|
|
28
|
LaQuaglia MP, Kopp EB, Spengler BA, Meyers
MB and Biedler JL: Multidrug resistance in human neuroblastoma
cells. J Pediatr Surg. 26:1107–1112. 1991. View Article : Google Scholar : PubMed/NCBI
|
|
29
|
Carén H, Kryh H, Nethander M, Sjöberg RM,
Träger C, Nilsson S, Abrahamsson J, Kogner P and Martinsson T:
High-risk neuro-blastoma tumors with 11q-deletion display a poor
prognostic, chromosome instability phenotype with later onset. Proc
Natl Acad Sci USA. 107:4323–4328. 2010. View Article : Google Scholar
|
|
30
|
Kryh H, Carén H, Erichsen J, Sjöberg RM,
Abrahamsson J, Kogner P and Martinsson T: Comprehensive SNP array
study of frequently used neuroblastoma cell lines; copy neutral
loss of heterozygosity is common in the cell lines but uncommon in
primary tumors. BMC Genomics. 12:4432011. View Article : Google Scholar : PubMed/NCBI
|
|
31
|
Helson C, Zahn Z and Helson L: Reversion
of p-glycoprotein mediated multidrug-resistance to vincristine and
adriamycin by psc-833, a cyclosporine derivative in human
neuroblastoma cell-lines. Int J Oncol. 5:1037–1042. 1994.PubMed/NCBI
|
|
32
|
Bersani C, Haeggblom H, Ursu RG, Giusca
SE, Marklund L, Ramqvist T, Näsman A and Dalianis T: Overexpression
of FGFR3 in HPV-positive tonsillar and base of tongue cancer is
correlated to outcome. Anticancer Res. 38:4683–4690. 2018.
View Article : Google Scholar : PubMed/NCBI
|
|
33
|
Holzhauser S, Kostopoulou ON, Ohmayer A,
Lange BKA, Ramqvist T, Andonova T, Bersani C, Wickström M and
Dalianis T: Antitumor effects in vitro of FGFR and PI3K inhibitors
on human papillomavirus positive and negative tonsillar and base of
tongue cancer. Oncol Lett. In press.
|
|
34
|
Foucquier J and Guedj M: Analysis of drug
combinations: Current methodological landscape. Pharmacol Res
Perspect. 3:e001492015. View Article : Google Scholar : PubMed/NCBI
|
|
35
|
Chou TC: Drug combination studies and
their synergy quantification using the Chou-Talalay method. Cancer
Res. 70:440–446. 2010. View Article : Google Scholar : PubMed/NCBI
|
|
36
|
Patani H, Bunney TD, Thiyagarajan N,
Norman RA, Ogg D, Breed J, Ashford P, Potterton A, Edwards M,
Williams SV, et al: Landscape of activating cancer mutations in
FGFR kinases and their differential responses to inhibitors in
clinical use. Oncotarget. 7:24252–24268. 2016. View Article : Google Scholar : PubMed/NCBI
|
|
37
|
Arenas MA, Del Pino M and Fano V:
FGFR3-related hypochondroplasia: Longitudinal growth in 57 children
with the p. Asn540Lys mutation. J Pediatr Endocrinol Metab.
31:1279–1284. 2018.PubMed/NCBI
|
|
38
|
Chen J, Yang J, Zhao S, Ying H, Li G and
Xu C: Identification of a novel mutation in the FGFR3 gene in a
Chinese family with Hypochondroplasia. Gene. 641:355–360. 2018.
View Article : Google Scholar
|
|
39
|
Wang L, Šuštić T, Leite de Oliveira R,
Lieftink C, Halonen P, van de Ven M, Beijersbergen RL, van den
Heuvel MM, Bernards R and van der Heijden MS: A functional genetic
screen identifies the phosphinositide 3-kinase pathway as a
determinant of resistance to fibroblast grown factor receptor
inhibitors in FGFR mutant urothelial cell carcinoma. Eur Urol.
71:858–862. 2017. View Article : Google Scholar : PubMed/NCBI
|
|
40
|
Wang J, Mikse O, Liao RG, Li Y, Tan L,
Janne PA, Gray NS, Wong KK and Hammerman PS: Ligand-associated
ERBB2/3 activation confers acquired resistance to FGFR inhibition
in FGFR3-dependent cancer cells. Oncogene. 34:2167–2177. 2015.
View Article : Google Scholar
|
|
41
|
Herrera-Abreu MT, Pearson A, Campbell J,
Shnyder SD, Knowles MA, Ashworth A and Turner NC: Parallel RNA
interference screens identify EGFR activation as an escape
mechanism in FGFR3-mutant cancer. Cancer Discov. 3:1058–1071. 2013.
View Article : Google Scholar : PubMed/NCBI
|
|
42
|
Brands RC, Knierim LM, De Donno F,
Steinacker V, Hartmann S, Seher A, Kübler AC and Müller-Richter
UDA: Targeting VEGFR and FGFR in head and neck squamous cell
carcinoma in vitro. Oncol Rep. 38:1877–1885. 2017. View Article : Google Scholar : PubMed/NCBI
|
|
43
|
Singleton KR, Hinz TK, Kleczko EK, Marek
LA, Kwak J, Harp T, Kim J, Tan AC and Heasley LE: Kinome RNAi
screens reveal synergistic targeting of MTOR and FGFR1 pathways for
treatment of lung cancer and HNSCC. Cancer Res. 75:4398–4406. 2015.
View Article : Google Scholar : PubMed/NCBI
|
|
44
|
Cai W, Song B and Ai H: Combined
inhibition of FGFR and mTOR pathways is effective in suppressing
ovarian cancer. Am J Transl Res. 11:1616–1625. 2019.PubMed/NCBI
|
|
45
|
Munster P, Aggarwal R, Hong D, Schellens
JH, van der Noll R, Specht J, Witteveen PO, Werner TL, Dees EC,
Bergsland E, et al: First-in-human phase I study of GSK2126458, an
oral pan-class I phosphatidylinositol-3-kinase inhibitor, in
patients with advanced solid tumor malignancies. Clin Cancer Res.
22:1932–1939. 2016. View Article : Google Scholar
|
|
46
|
Tamura R, Yoshihara K, Saito T, Ishimura
R, Martínez-Ledesma JE, Xin H, Ishiguro T, Mori Y, Yamawaki K, Suda
K, et al: Novel therapeutic strategy for cervical cancer harboring
FGFR3-TACC3 fusions. Oncogenesis. 7:42018. View Article : Google Scholar : PubMed/NCBI
|
|
47
|
Zheng X, Naiditch J, Czurylo M, Jie C,
Lautz T, Clark S, Jafari N, Qiu Y, Chu F and Madonna MB:
Differential effect of long-term drug selection with doxorubicin
and vorinostat on neuroblastoma cells with cancer stem cell
characteristics. Cell Death Dis. 4:e7402013. View Article : Google Scholar : PubMed/NCBI
|