Introduction
Gastric cancer (GC) represents the most common
malignant tumors of the digestive tract (1). Despite significant improvements in
diagnostic and therapeutic strategies of GC over the past decades,
the incidence and mortality rates of GC are still increasing due to
lack of early diagnostic tactics and effective treatments (1). However, if GC patients are diagnosed
and treated early, either by endoscopy or surgery, the 5-year
survival rate could exceed 90% (2). Consequently, prompt diagnosis of GC
is significantly improving prognosis. Therefore, it is extremely
important to discover novel candidate genes, which play important
roles in the initiation and development of GC, and help to reduce
mortality rates and improve prognosis.
Thanks to the continuous innovation of technologies
on microarray and high-throughput sequencing, an increasing number
of biomarkers and therapeutic targets have been identified and
applied in clinic (3-6), particularly in the field of medical
oncology (7-9). The Cancer Genome Atlas (TCGA) is a
large database, which provides publicly available genomic and
clinical information for various cancer types (10). Using this database, researchers can
comprehensively and accurately study the biology and pathology of
each cancer (11). Additionally,
TCGA contributes to precise cancer diagnosis and individualized
treatment through the identification of novel candidate genes and
clinical information linked to cancer (12).
Co-expression analysis is a powerful strategy to
construct scale-free gene co-expression networks (13). The weighted gene co-expression
network analysis (WGCNA) is widely used to analyze large-scale data
sets and find modules of highly correlated genes (14). In addition, WGCNA has been
successfully utilized to investigate associations between gene sets
and clinical traits, and to identify potential candidate biomarkers
of various cancer types (15-18),
including prostate (15),
esophageal (17) and cervical
cancer (18). Thus, WGCNA provides
a functional interpretation tool for cancer biology and has brought
new insights into understanding the molecular pathogenesis and
prognostics of cancer.
In order to explore the underlying mechanisms and to
identify novel prognostic biomarkers and therapeutic targets of GC,
in the present study, WGCNA was performed using microarray data of
GC patients downloaded from the Gene Expression Omnibus (GEO)
database, and significant modules and genes were identified. These
genes were further confirmed using TCGA datasets and may act as
oncogenes. Taken together, SLC5A6 and microfibril-associated
protein 2 (MFAP2) were identified as novel diagnostic and
prognostic biomarkers, which may provide new insights into early
diagnosis and targeted therapy for patients with GC.
Materials and methods
Preparing gene expression profile data
and clinical information
The workflow of this study is presented in Fig. S1. The gene expression profile data
and clinical information for GC were downloaded from the GEO
database; GSE38749 (https://www.ncbi.nlm.nih.gov/geo/query/acc.cgi?acc=GSE38749)
is gene expression data based on the GPL570 platform (Affymetrix
Human Genome U133 plus 2.0 Array) (19). The GSE38749 dataset includes 15
gastric cancer samples. Tumor staging was conducted as per the
criteria detailed in the 8th edition of the TNM Staging Manual of
the American Joint Committee on Cancer (20). The gene expression levels
downloaded with the database were calculated as fragments per kilo
base of transcript per million mapped reads. Clinical data
contained age, gender, TNM stage and survival time. Clustering
analysis was performed by calculating the correlation coefficient
matrix, which indicated that the genes were qualified for
subsequent analyses and that variation was small. Data
standardization was performed using the robust multi-array average
algorithm in the affy package within Bioconductor (http://www.bioconductor.org) in R 3.5.2 (https://cran.rstudio.com/).
Screening for differentially expressed
genes (DEGs)
Limma package was used to screen the differentially
expressed genes with R 3.5.2 (https://cran.rstudio.com/). According to an
established statistical method (21), 21,648 genes were identified for
further studies. Based on the variance of each gene in each sample,
the genes with standard deviations >0 were selected as DEGs. The
top 50% of variant genes based on an analysis of variance (10,824
genes) were selected for WGCNA.
Constructing the co-expression
network
WGCNA is a systematic biological method for
constructing scale-free networks using gene expression data. All
analyses were performed using the WGCNA v1.68 package in R 3.5.2
(https://cran.rstudio.com/). Firstly, the
similarity matrix of gene expression was constructed by calculating
the Pearson's correlation coefficient between two genes. Then, the
gene expression similarity matrix was converted into the adjacency
matrix and the network type is assigned; β=12 was selected as soft
threshold. The purpose of this step was the strengthening of strong
and weakening of weak correlations at the expression level. Then,
the adjacency matrix was transformed into the topological matrix
(TOM); TOM was used to describe the degree of association between
genes. Based on TOM, which represented diverse degree of genes,
(1-TOM) was used for hierarchical clustering of genes. The dynamic
tree cut algorithm was used to module recognition and the most
representative gene in each module was called eigenvector gene or
module eigengene (ME), representing the overall level of gene
expression in this module and the first principal component in each
module.
Identifying clinically significant
modules
Two approaches were used to identify a correlation
between modules and clinical information obtained from patients
with GC. Analyses were performed using the WGCNA v1.68 and Cor
packages in R 3.5.2 (https://cran.rstudio.com/). The minimum number of
genes per module was 30, the correlation threshold of hub genes was
0.90 and the unsigned network edge threshold was 0.05. Firstly, the
expression profiles of a gene in all samples and of a vector gene
were calculated using Pearson's correlation as module membership
(MM). ME was defined as the first principal component of each gene
module and the expression of ME was considered representative of
all genes in a given module. Clinically significant modules were
identified by calculating the correlation between ME and clinical
traits, and the degree of the connection was measured. Gene
significance (GS) was used to measure this degree; a higher GS
indicated increased biological significance of genes. MS were
defined as the mean GS of all the genes involved in the module.
Enrichment analysis of Gene Ontology (GO)
and Kyoto Encyclopedia of Genes and Genomes (KEGG) pathways
DAVID 6.8 (https://david.ncifcrf.gov/) was used for GO and KEGG
enrichment analysis. GO and KEGG pathway enrichment analyses were
used to identify potentially involved biological processes,
molecular function and cellular component. GO contained three
categories: i) Biological processes (BPs); ii) cellular components
(CCs); and iii) molecular function (MF). The potential biological
features and pathways of genes in the modules were further explored
using DAVID (https://david.ncifcrf.gov/). To avoid missing
discoveries, the significance threshold was adjusted based on an
established statistical method (22); data were evaluated with the
adjusted cut-off value P<0.1. The associations between genes in
'black’ module were visualized with Cytoscape 3.5.1 (https://cytoscape.org/), as this module had the
highest correlation coefficient with clinical traits.
Identifying and validating hub genes
The correlation of genes was calculated using
absolute of Pearson's correlation values via Cor package in R 3.5.2
(https://cran.rstudio.com/). Genes that
had high correlation with a module were regarded as hub genes of
this module (cor. MM, >0.9). Furthermore, to validate the hub
genes, the data downloaded from TCGA (https://cancergenome.nih.gov/) contained clinical
information and RNA sequencing data. mRNA sequencing data were
normalized using edgeR package in R 3.5.2 (https://cran.rstudio.com/). GC data from TCGA
contained 406 samples, which included 375 tumor and 31
corresponding adjacent normal tissues. Hub genes were validated in
375 tumor tissue samples using WGCNA. Kaplan Meier-plotter 3.0.0
(www.kmplot.com) was used for the survival analysis of
hub genes.
Immunohistochemistry analysis. The Human
Protein Atlas (https://www.proteinatlas.org/) was used to validate
candidate hub genes via immunohistochemistry. Images were obtained
from the following sources: i) SLC5A6 in normal tissue (n=6;
https://www.proteinatlas.org/ENSG00000138074-SLC5A6/tissue/stomach);
ii) SLC5A6 in tumor tissue (n=12; https://www.proteinatlas.org/ENSG00000138074-SLC5A6/pathology/tissue/stomach+cancer#ihc);
iii) MFAP2 in normal tissue, (n=5; https://www.protein-atlas.org/ENSG00000117122-MFAP2/tissue/stomach);
and iv) MFAP2 in tumor tissue (n=12; https://www.proteinatlas.org/ENSG00000117122-MFAP2/pathology/stomach+cancer).
The immunohistochemical staining pattern of each tissue sample was
annotated manually. Images of sections were evaluated and scored by
two pathologists independently. The annotation was based on
staining intensity (negative, weak, moderate or strong) and
fraction of stained cells (<25%, 25~75%, >75%). The staining
quantity of each protein via IHC was determined as the percentage
of stained cells in 10 high power fields. All annotation data and
immunohistochemistry images from the standard tissue set of 44
tissues, together with data from extended tissue samples analyzed
in the present investigation and all antibody validation data are
publicly available at v18.proteinatlas.org.
Statistical analysis
Data are presented as the mean ± SEM and were
analyzed with SPSS (version 19.0; IBM Corp.). Significant
differences were calculated using one-way ANOVA with Dunnett's or
Newman-Keuls test, or by two-tailed Student's t-test. P<0.05 was
considered to indicate a statistically significant difference.
Results
WGCNA construction and identification of
clinically significant modules
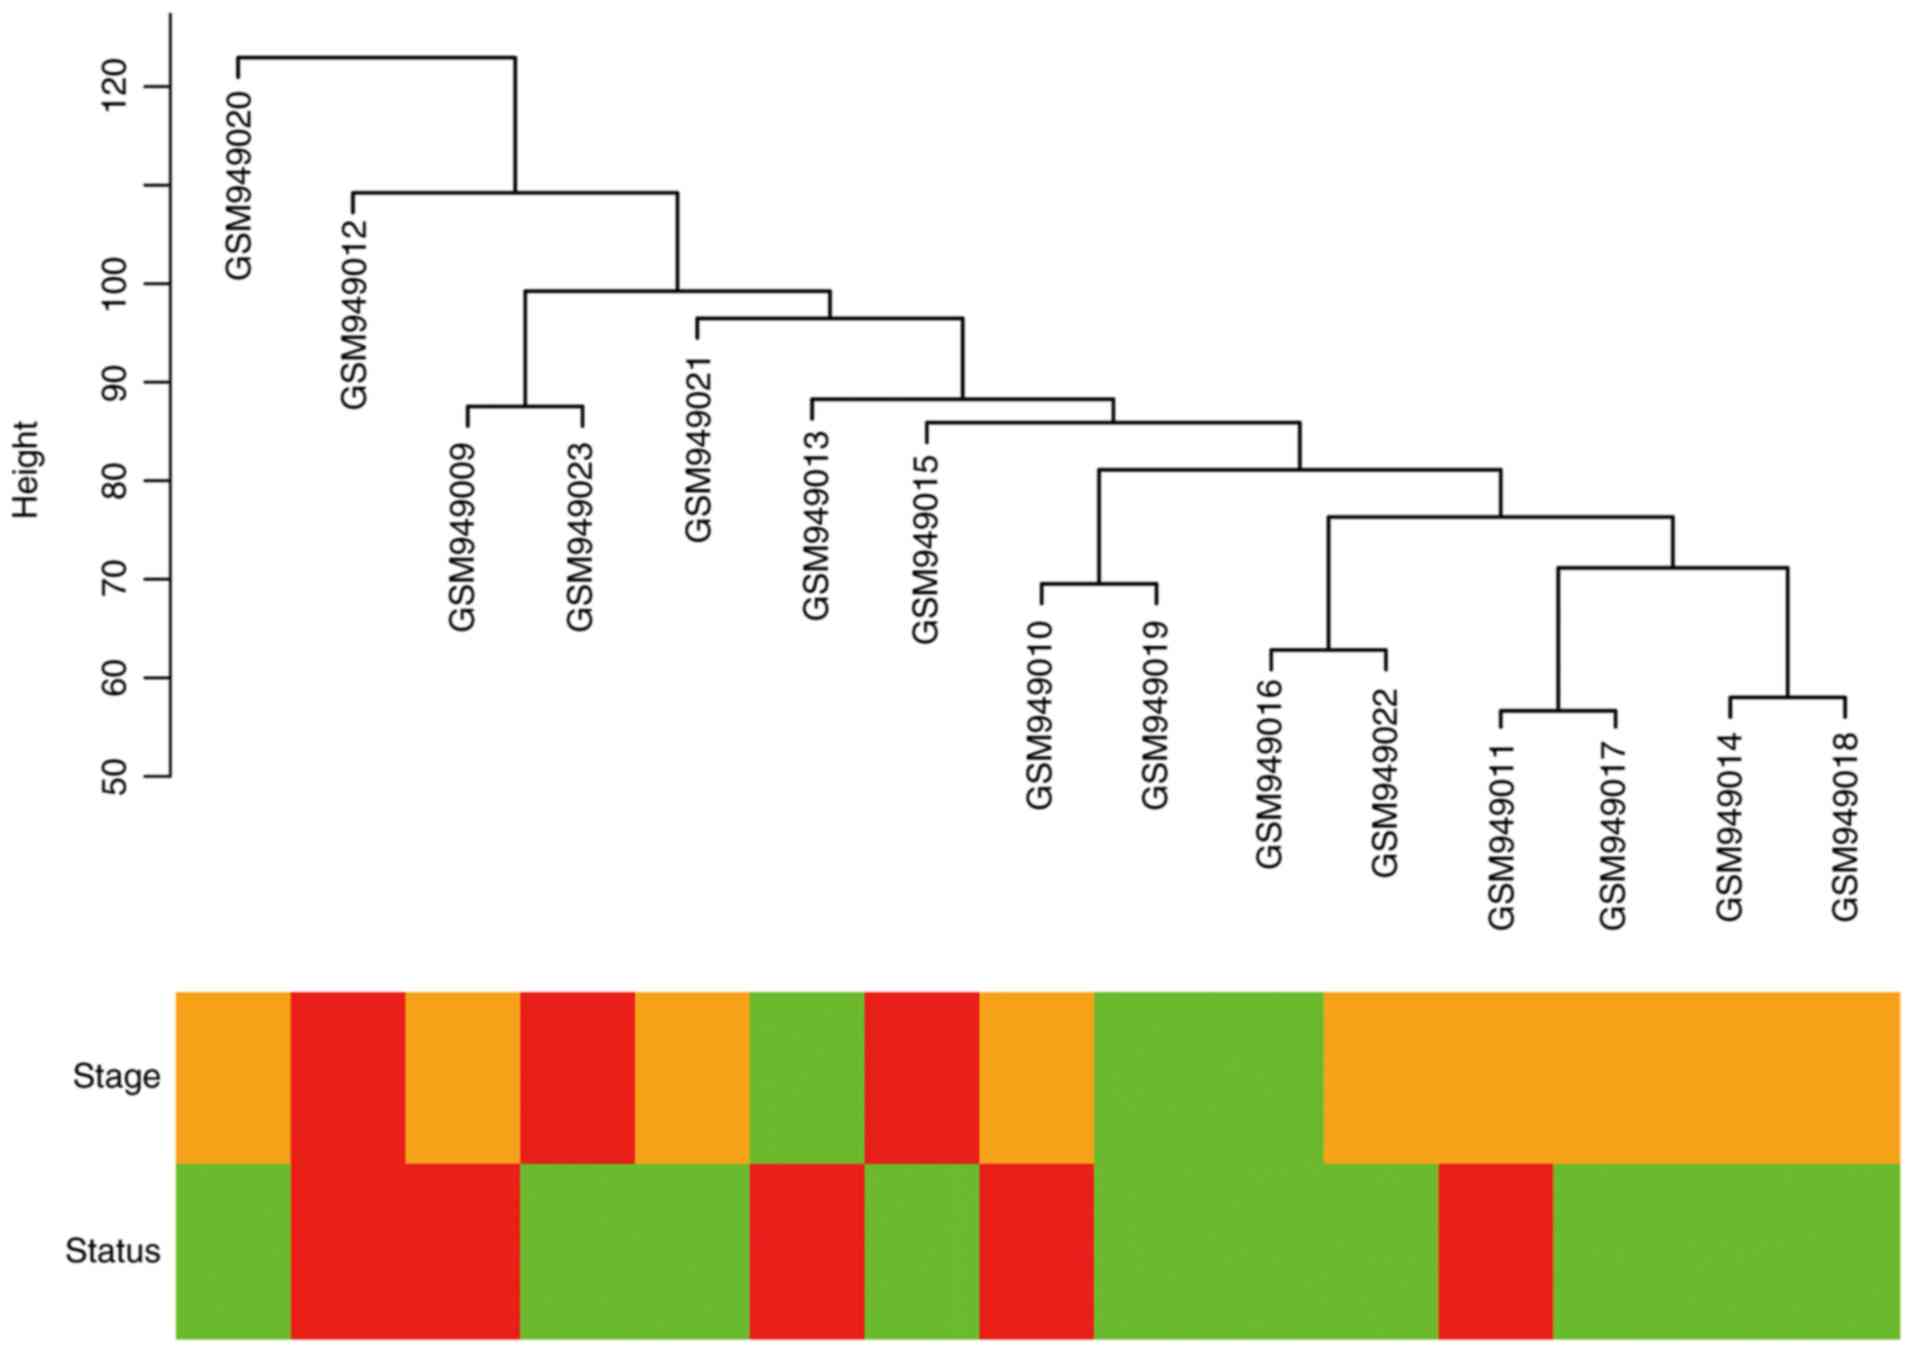
Cluster analysis was performed on the samples of
GSE38749 using average linkage and Pearson's correlation (Fig. 1). The co-expression network was
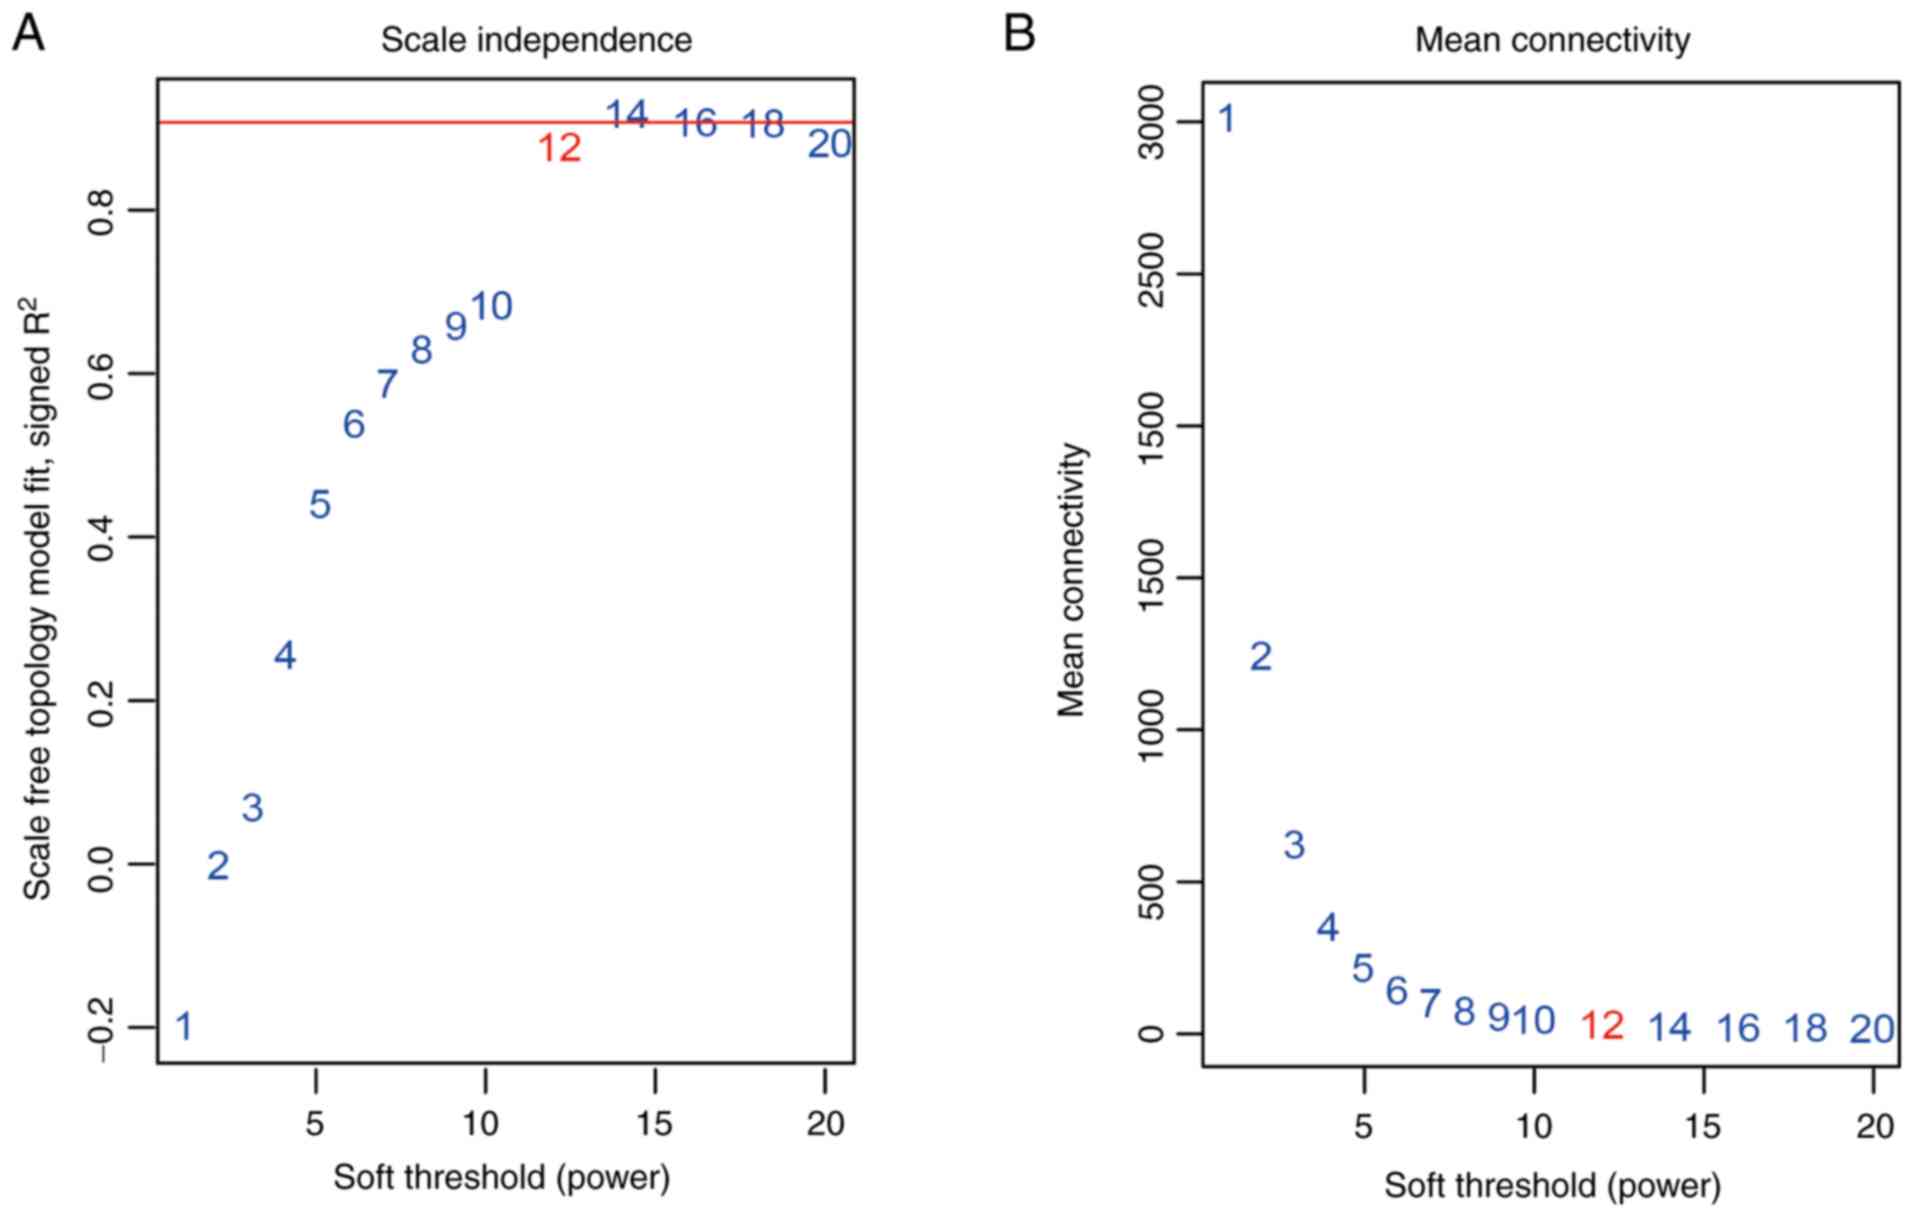
constructed using co-expression analysis. To ensure a scale-free
network, the power β=12 was identified as soft-threshold in the
present study (Fig. 2). A total of
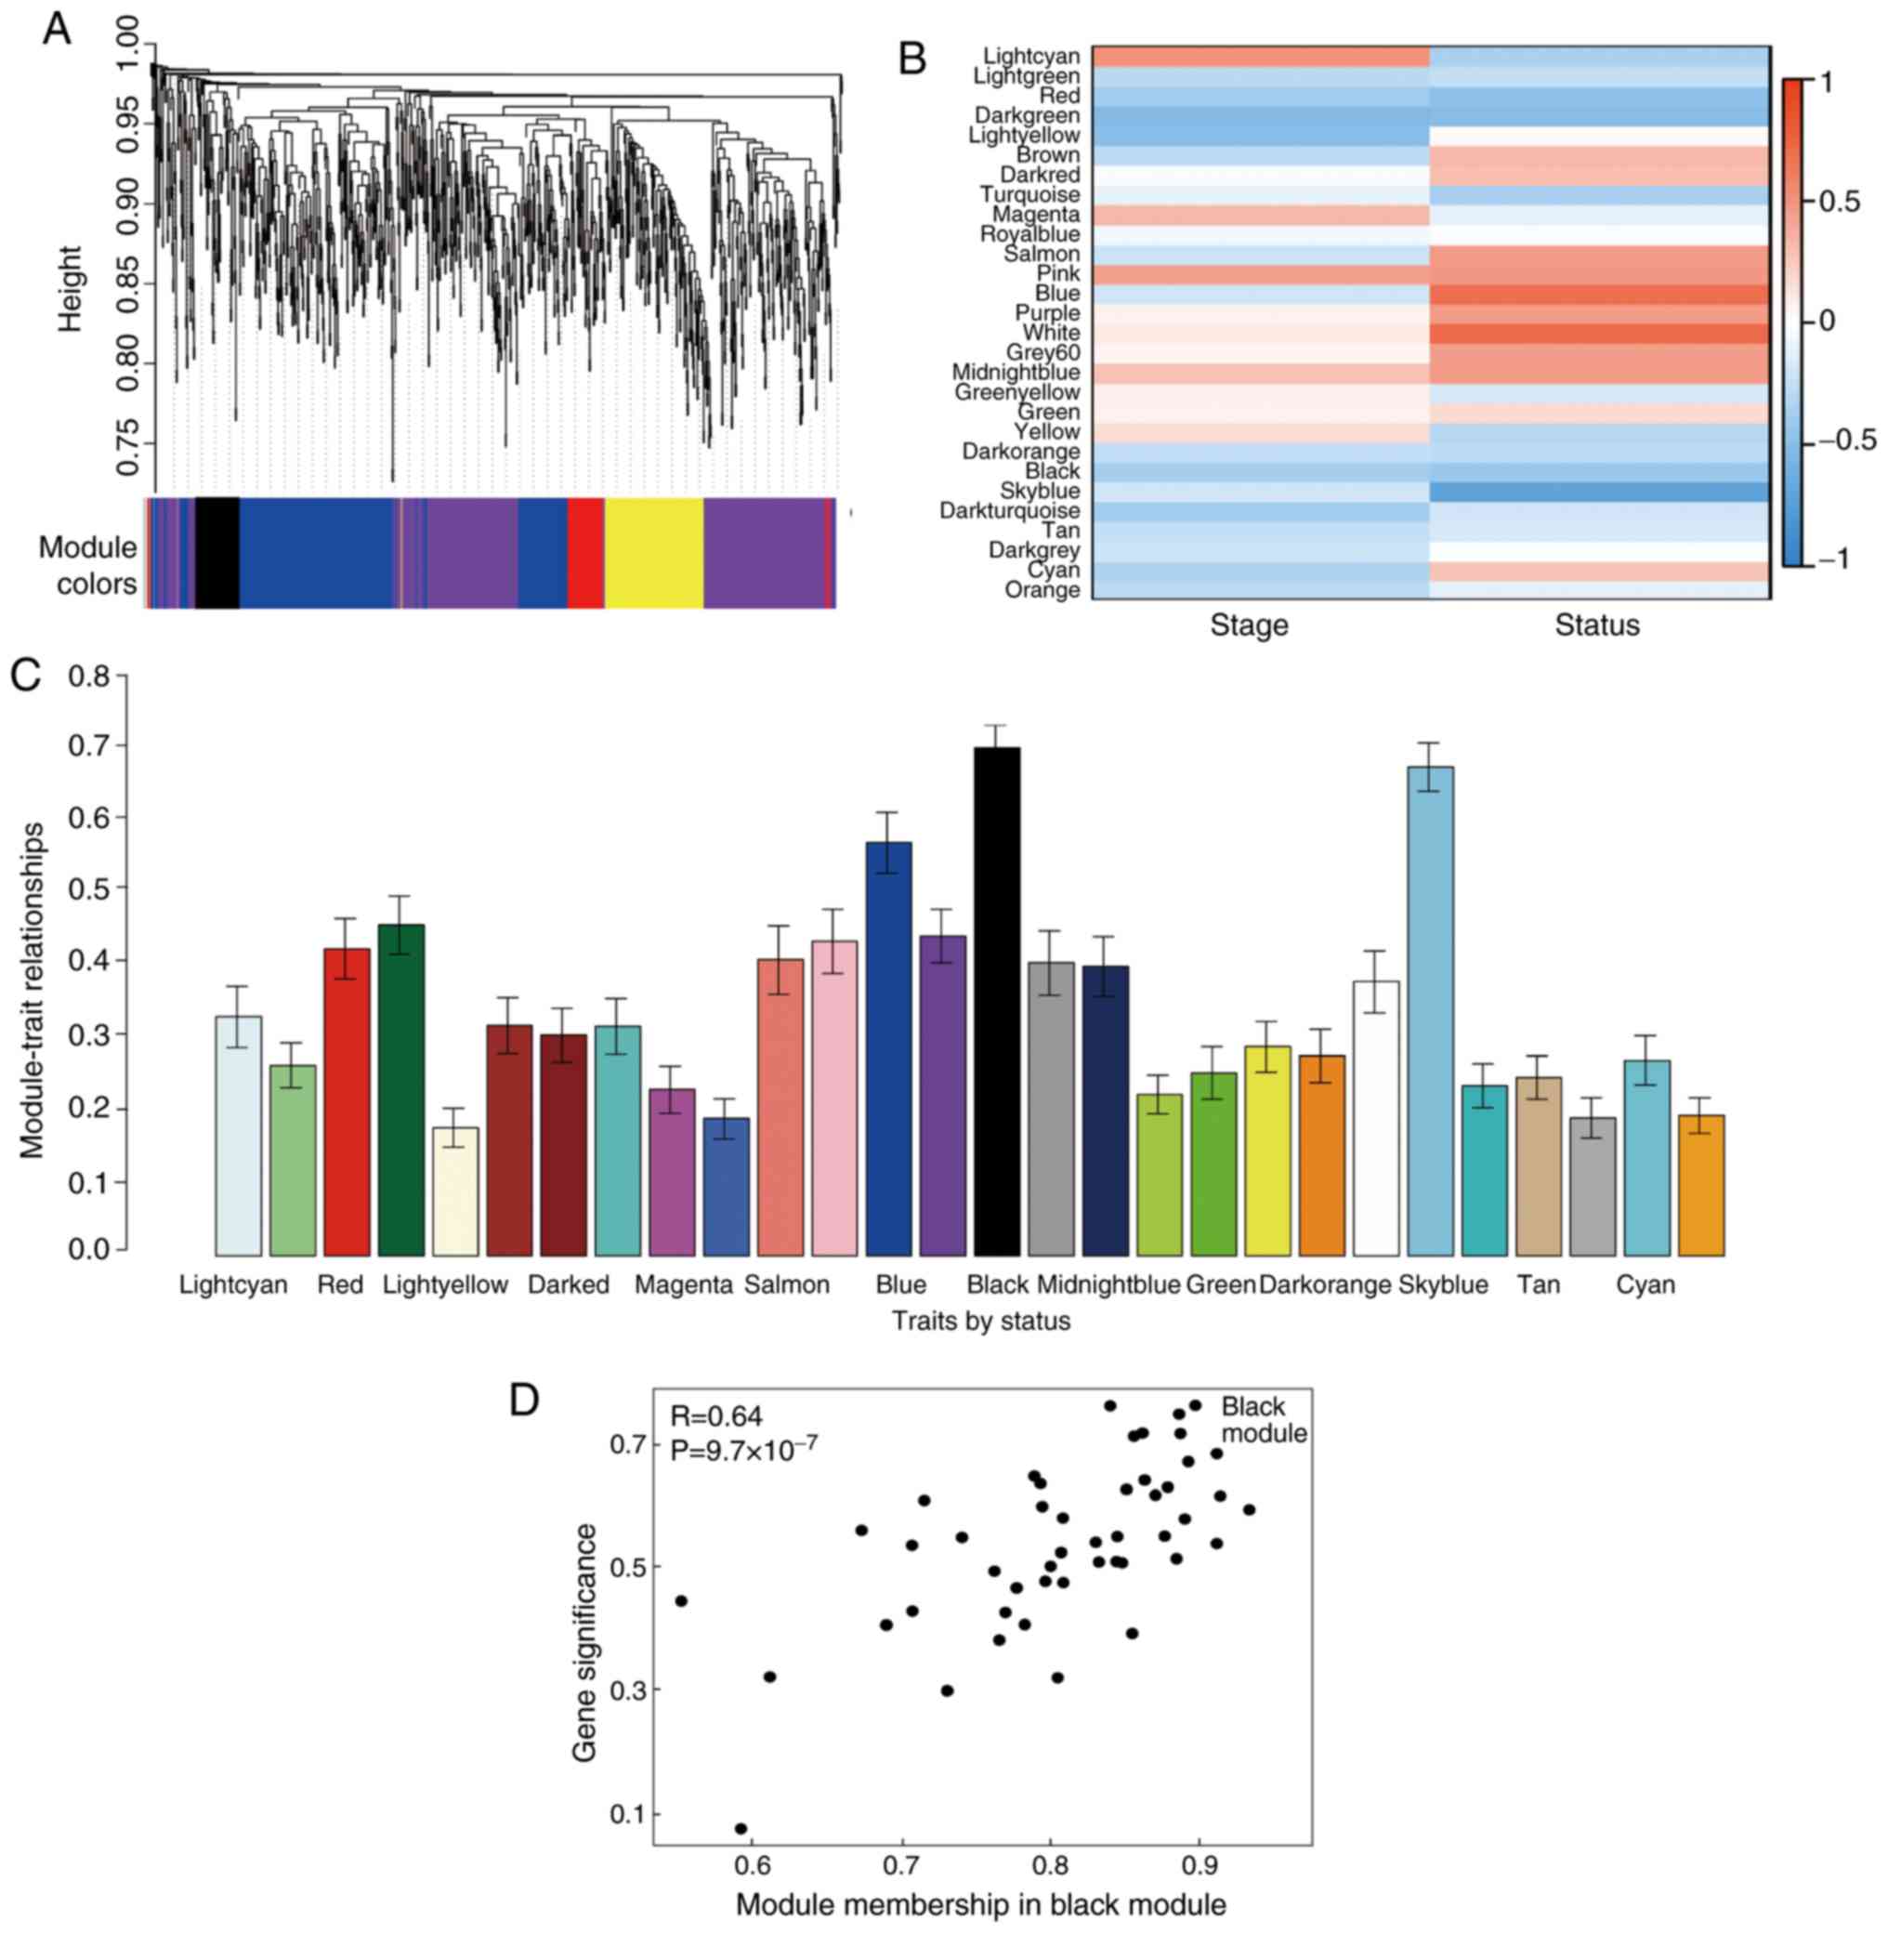
29 modules were identified via the average linkage hierarchical
clustering, calculating with MEs and combing adjacent modules with
the same module and height=0.25 (Fig.
3A). As shown in Fig. 3B and
C, the 'black’ module (r=0.73; P=0.002) was found to have the
highest association with cancer prognosis. Therefore, this module
was selected as the key clinically significant module for
subsequent analysis. The modules 'skyblue’ (R=0.70; P=0.0034) and
'blue’ (R=0.71; P=0.0031) also had high correlations with clinical
traits and further evaluation may focus on the correlation between
genes and the disease. The connectivity of integrated modules and
genes with clinical traits was calculated and the correlation was
significantly different (R=0.64; P=9.7x10⁻⁷; Fig. 3D). In addition, the correlation of
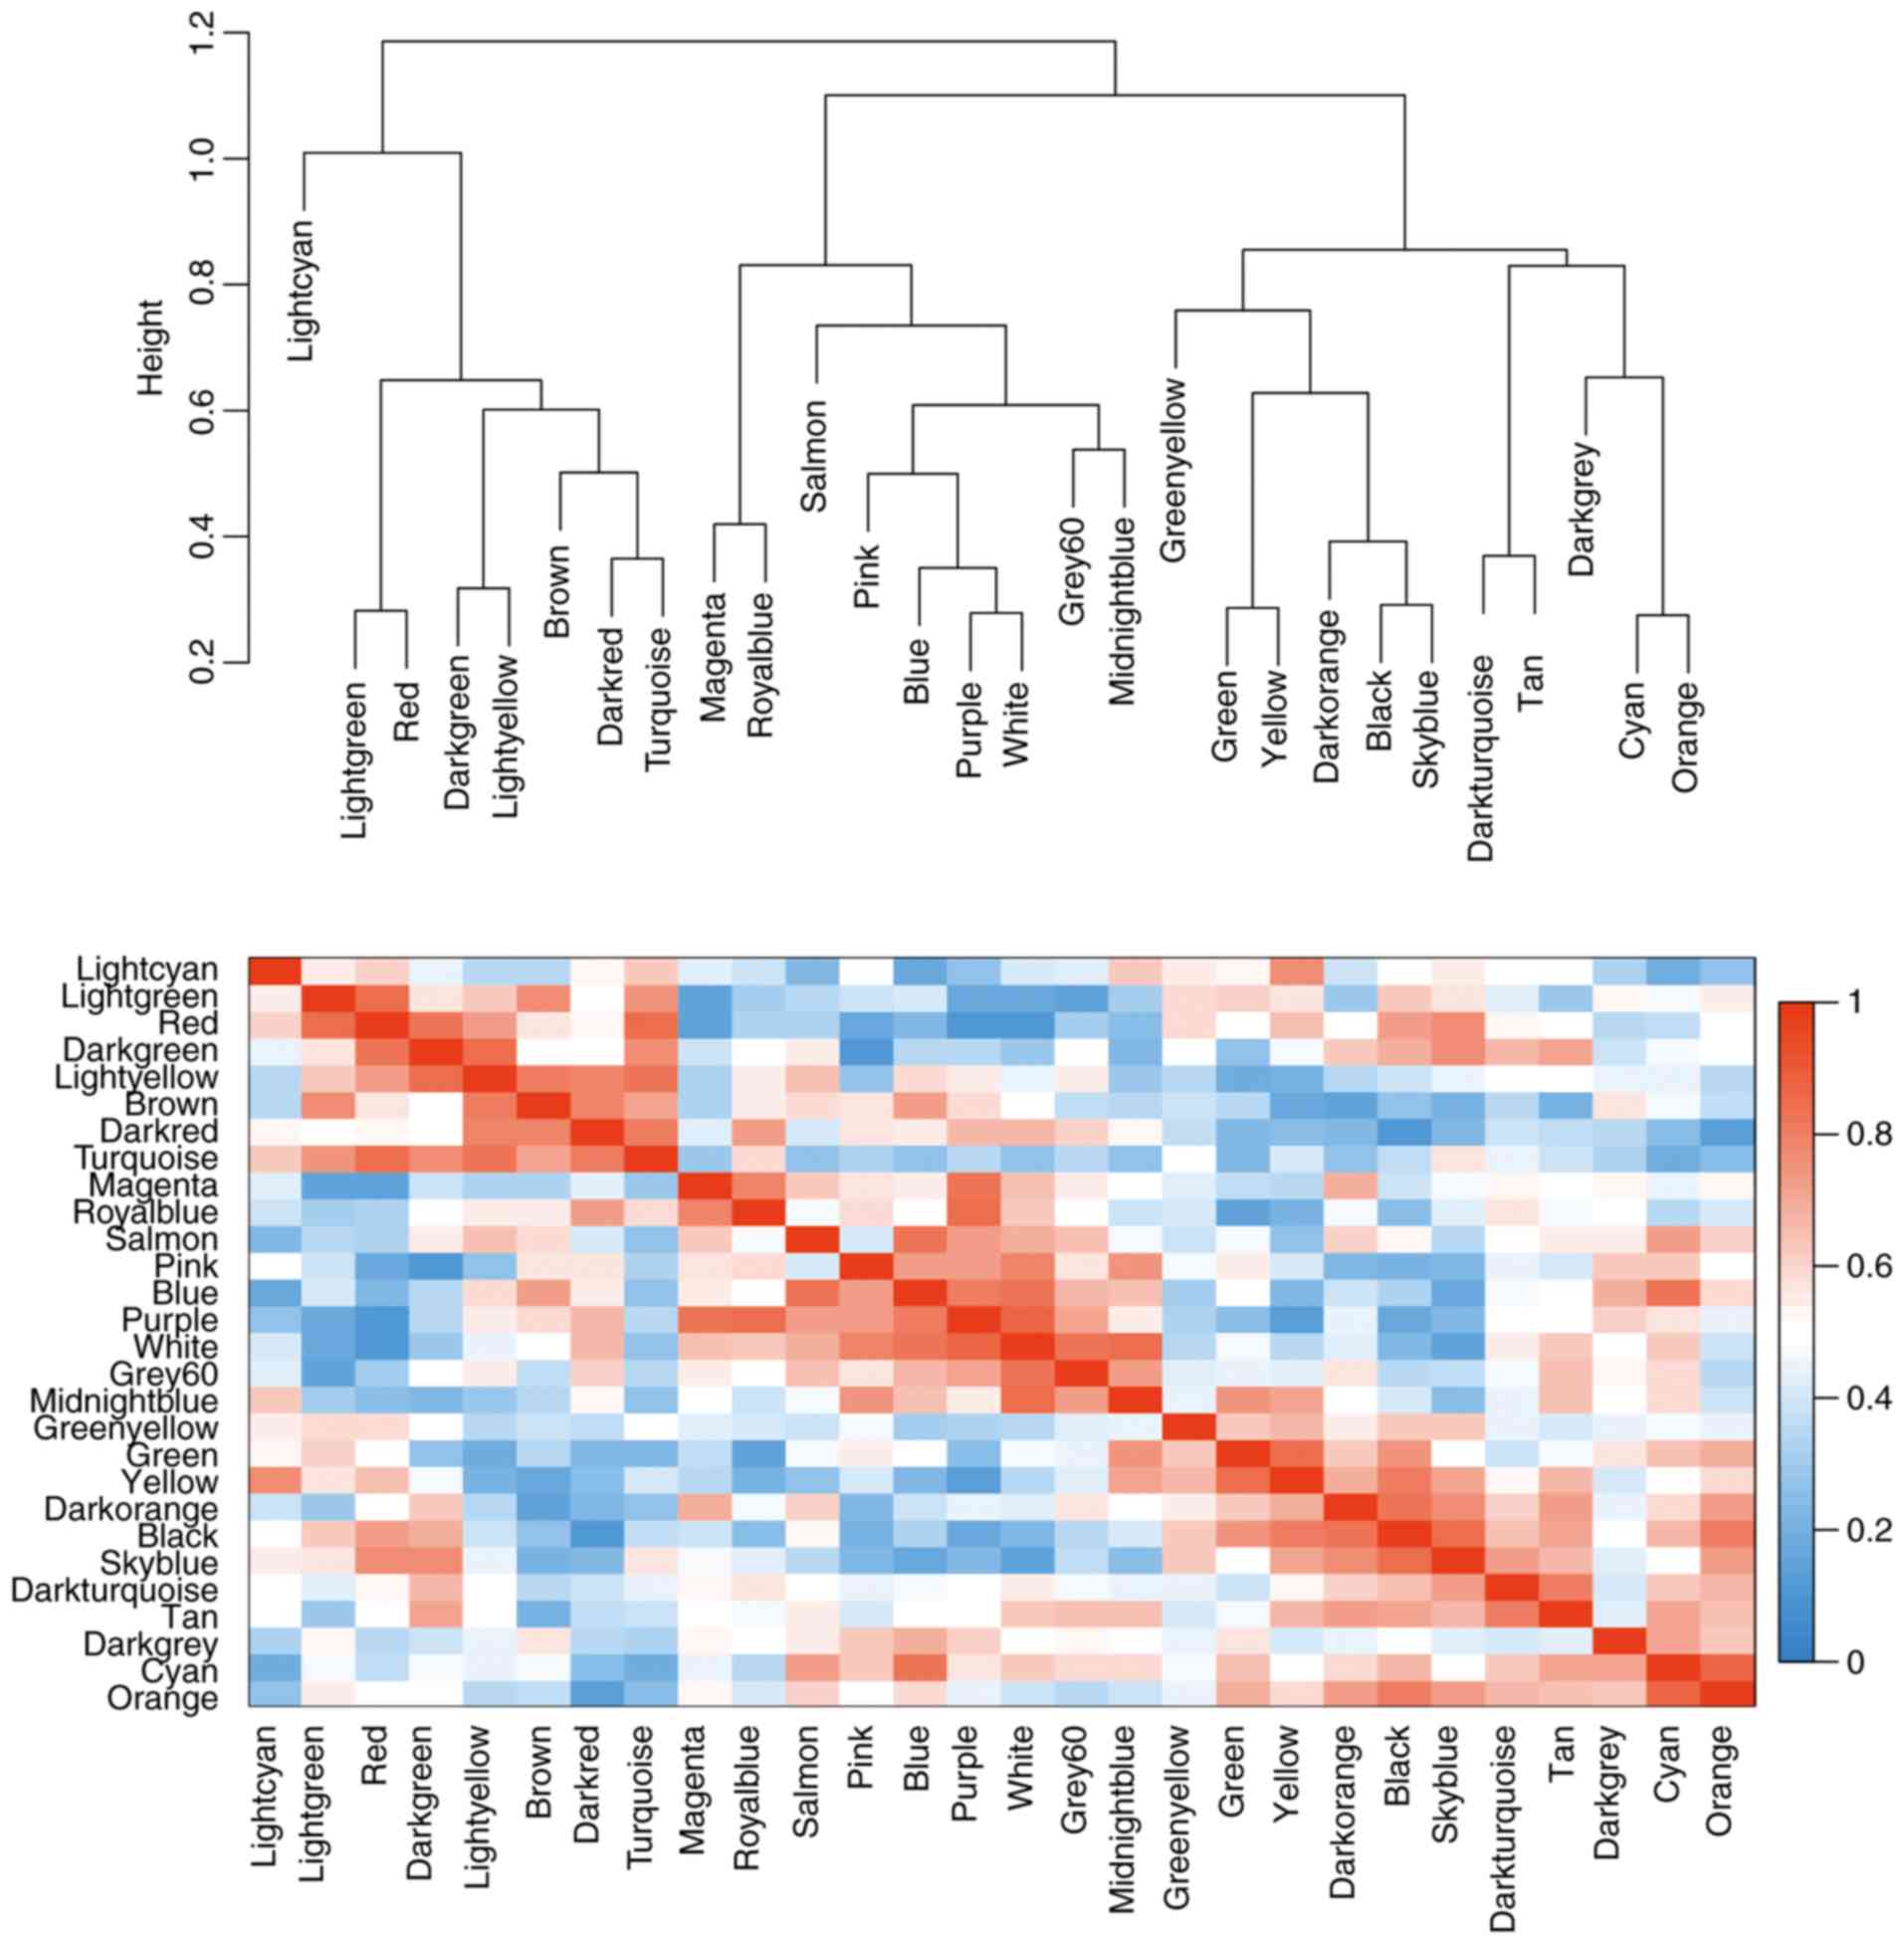
modules was calculated according to MEs (Fig. 4).
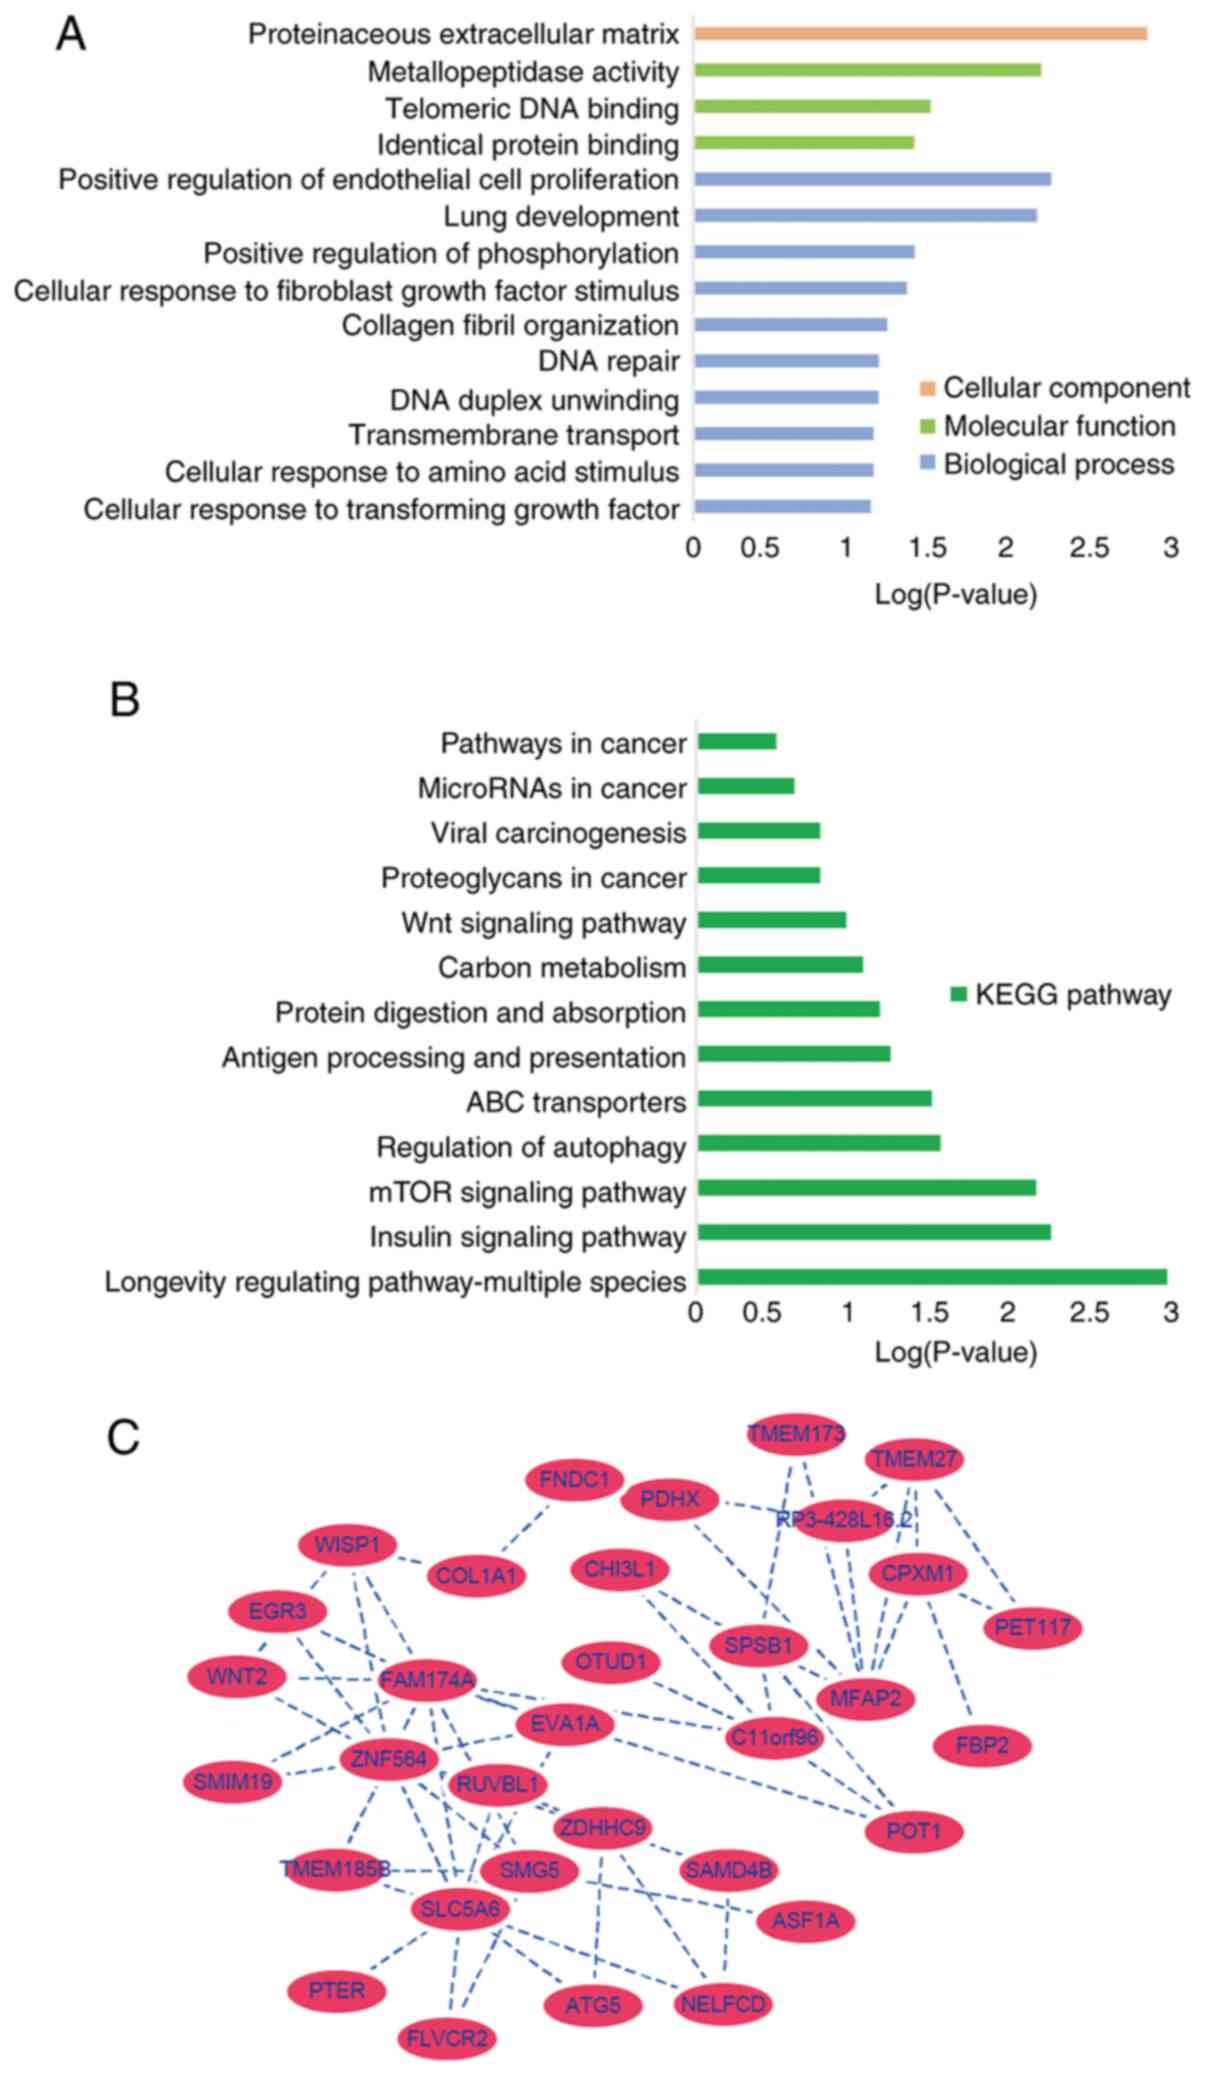
GO and enrichment analysis of the key
module
The genes in the key clinically significant module
were categorized into three functional groups, namely BP, CC and
MF. The key module genes in the BP group were associated with
positive regulation of endothelial cell proliferation, lung
development, positive regulation of peptidylthreonine
phosphorylation, cellular response to fibroblast growth factor
stimulus, collagen fibril organization, DNA repair, DNA duplex
unwinding, trans-membrane transport, cellular response to amino
acid stimulus and cellular response to transforming growth factor
β-stimulus (Fig. 5A). In the MF
groups in metallopeptidase activity, telomeric DNA binding and
identical protein binding associated genes were enriched and in the
CC group proteinaceous extracellular matrix genes were enriched
(Fig. 5A). KEGG pathway analysis
demonstrated that these genes were associated with positive
regulation of endothelial cell proliferation, proteinaceous
extracellular matrix and metallopeptidase activity (Fig. 5B). The gene co-expression network
was constructed including all genes from the 'black’ module using
Cytoscape, SLC5A6 and MFAP2 were most closely associated with the
prognosis of GC in the 'black’ module and were selected as hub
genes for further analysis (Fig.
5C).
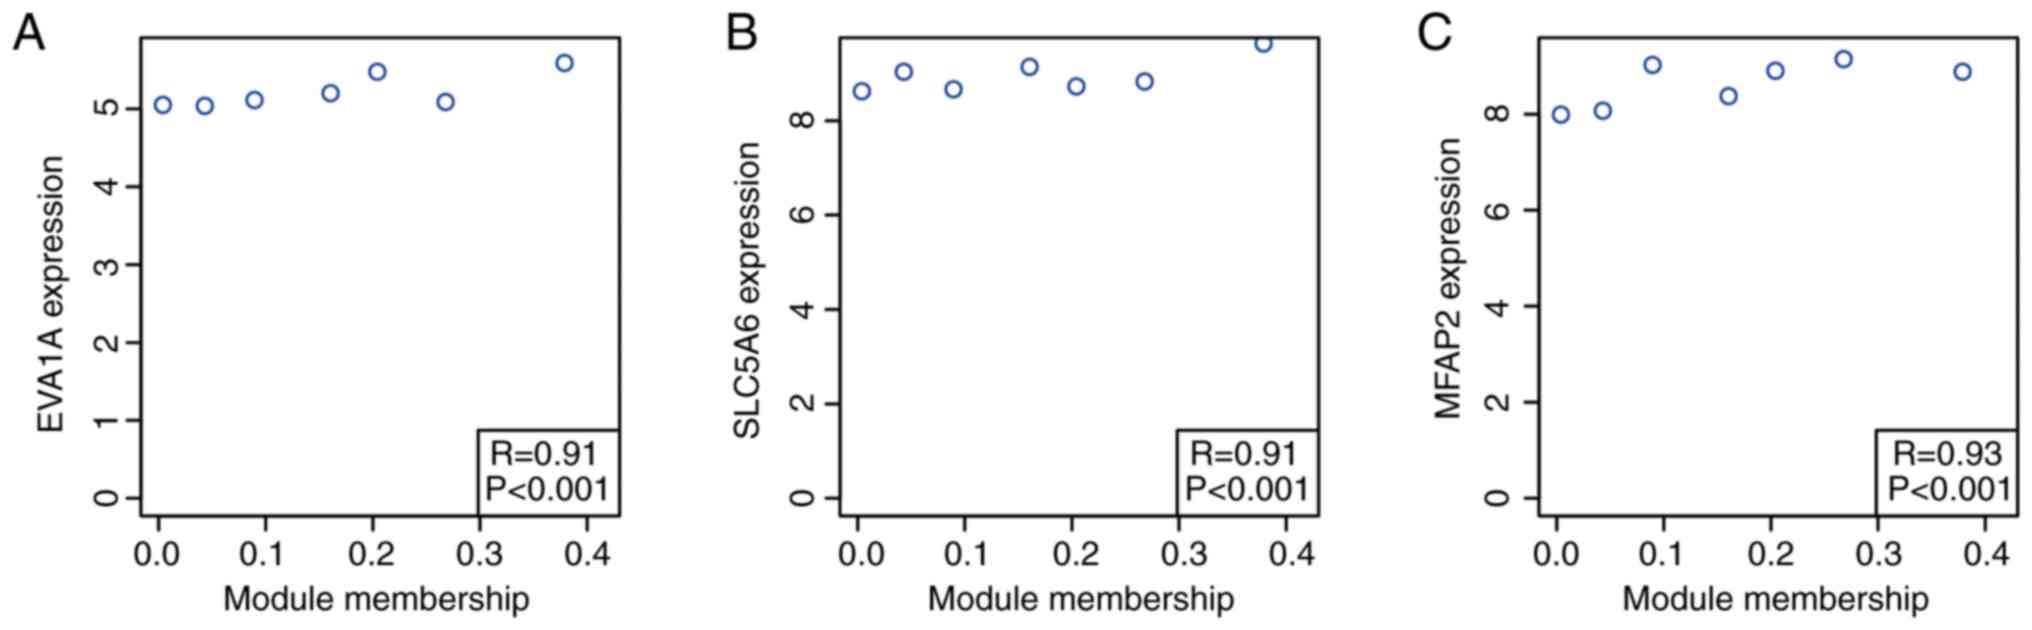
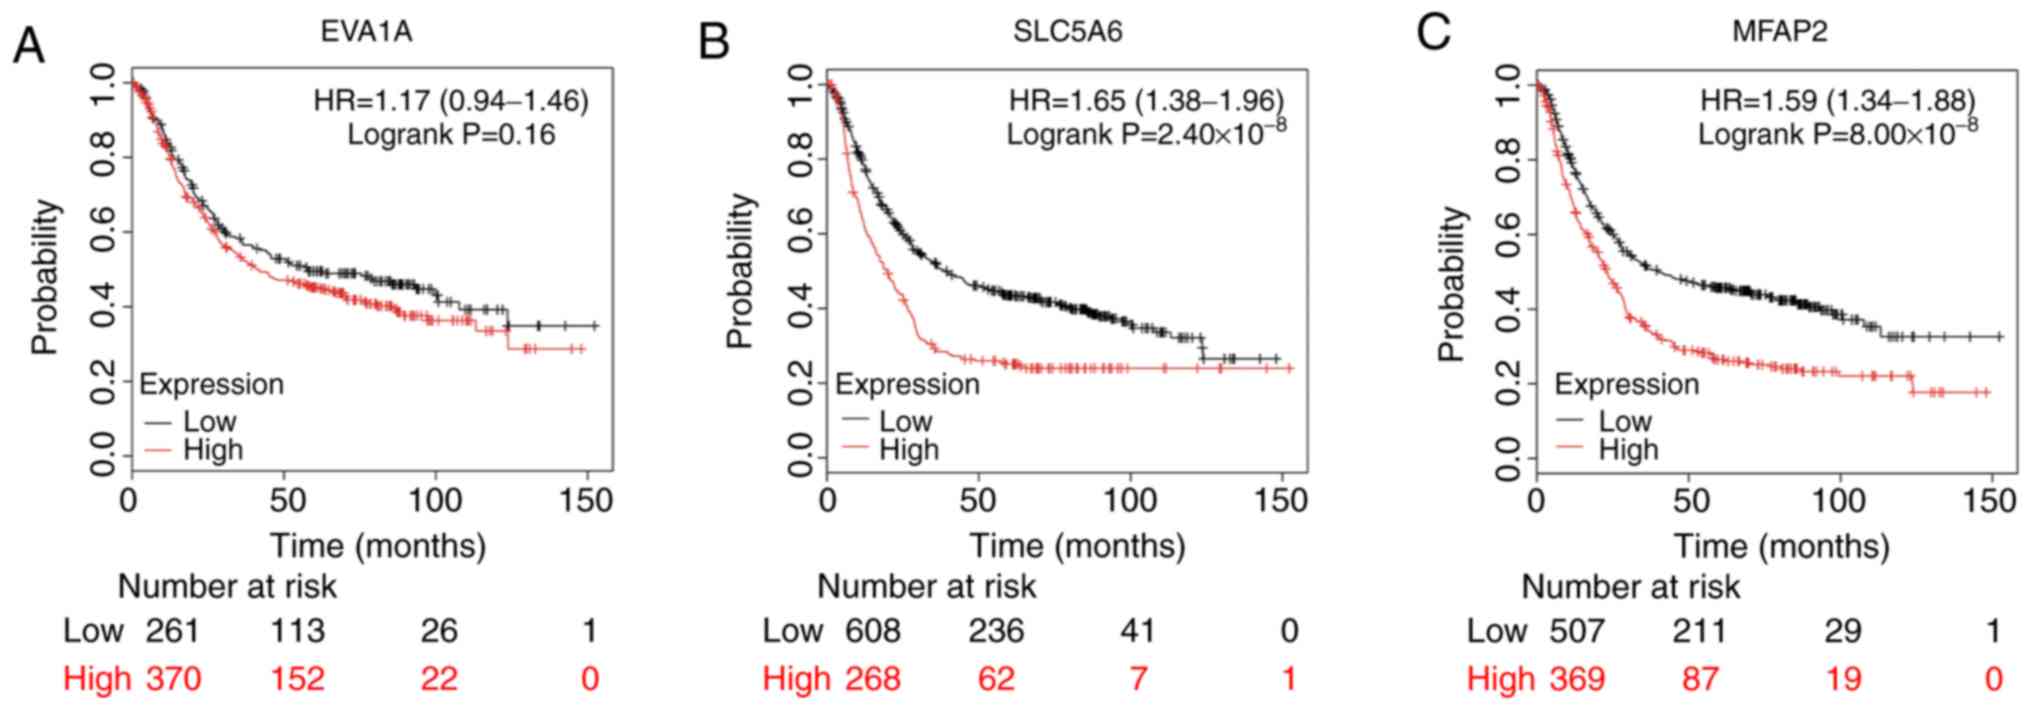
Identification of clinically significant
hub genes
Based on the cut-off criteria (cor. MM, >0.9),
three genes with high connectivity in the key module were
identified (P<0.001; Fig. 6).
SLC5A6 and MFAP2 were significantly negatively associated with the
overall survival (OS; SLC5A6, P=2.40×10⁻⁸; MFAP2,
P=8.00×10⁻⁸) and EVA1A showed a non-significant negative
association with OS (P=0.16; Fig.
7).
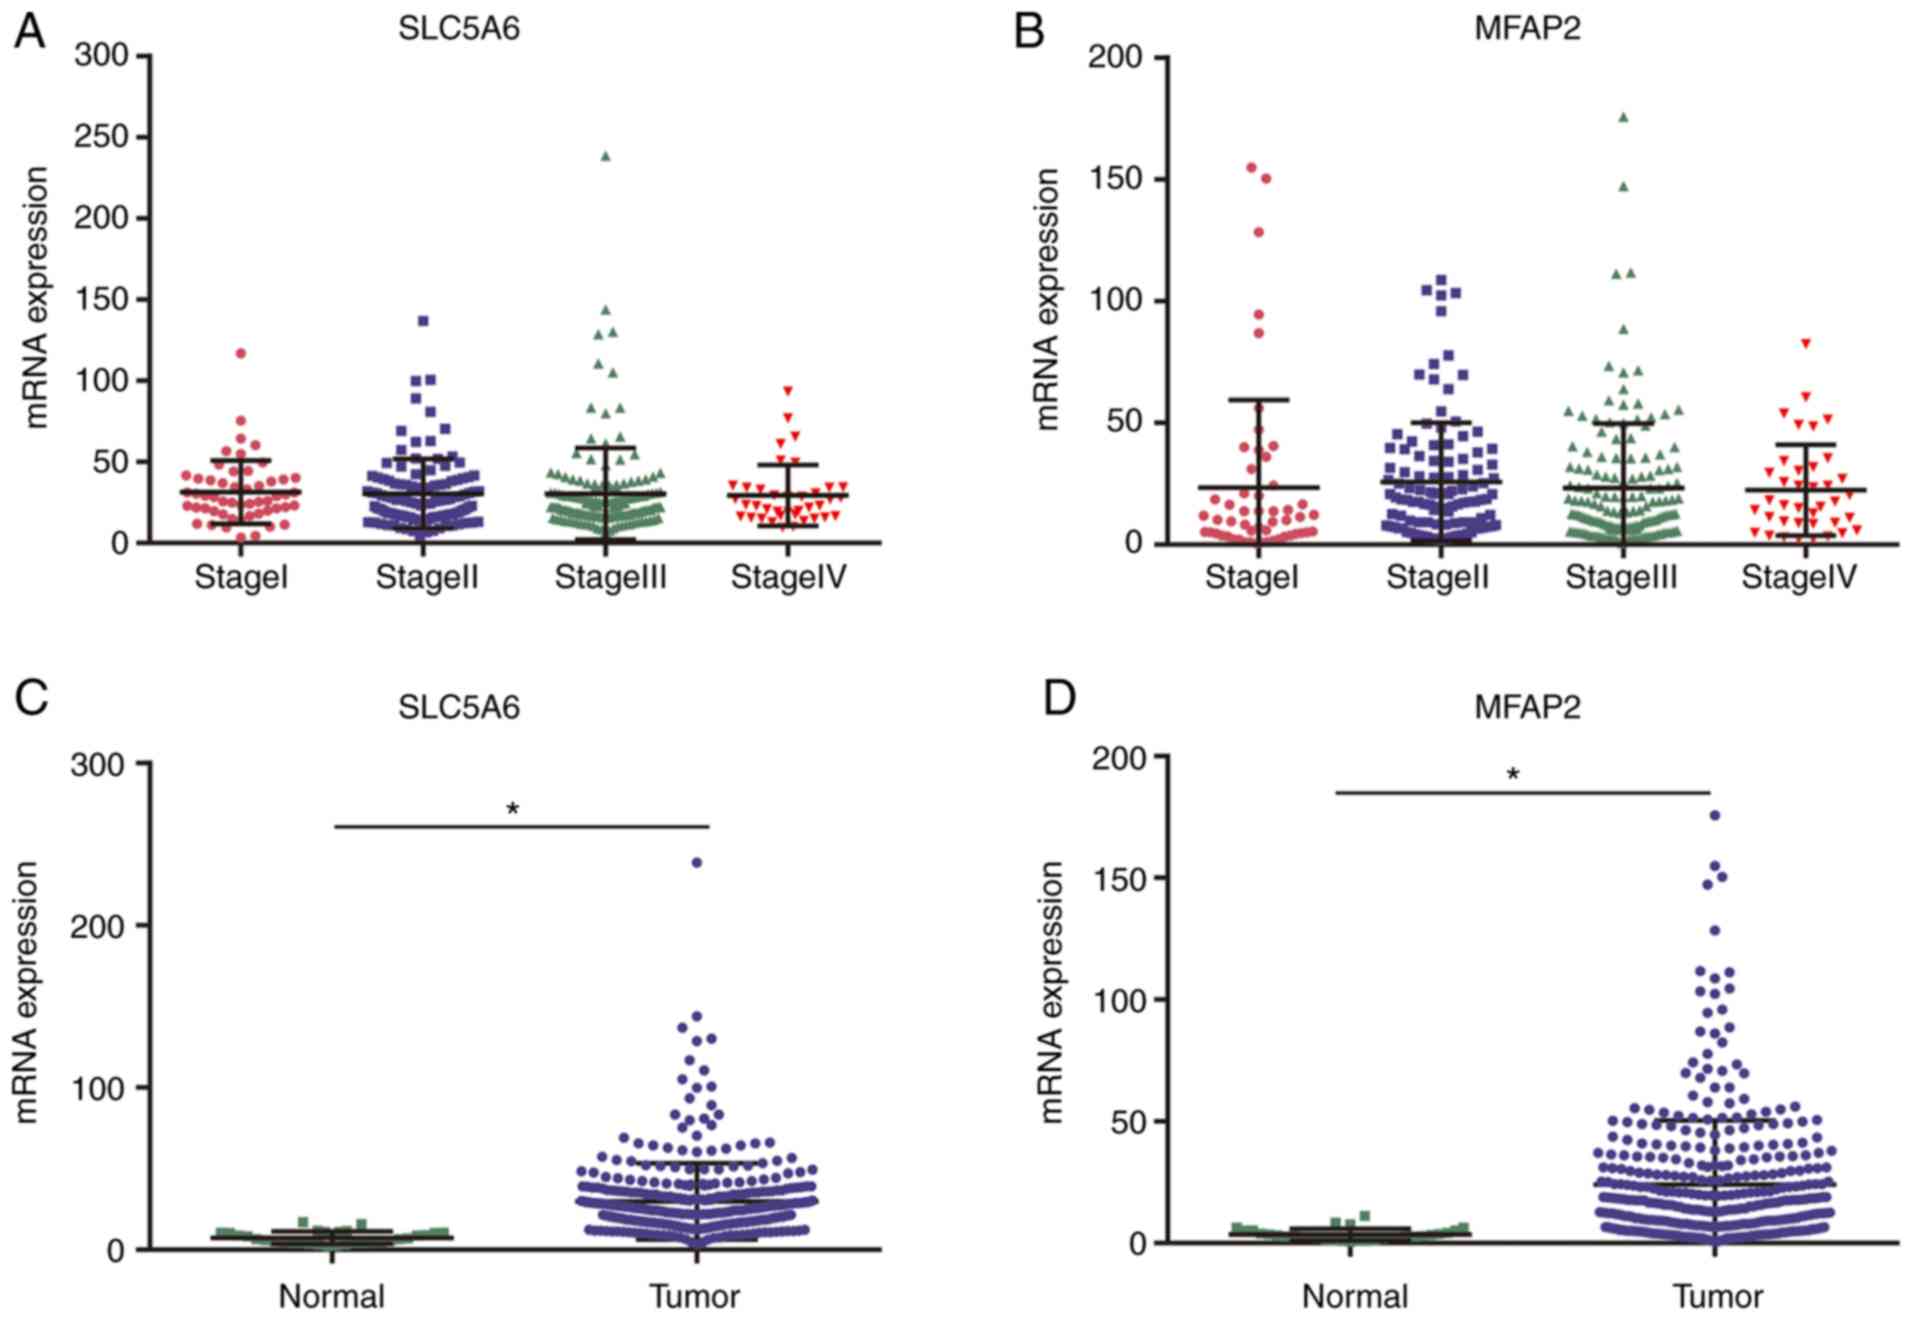
Validation of clinically significant hub
genes
Using TCGA data, no correlation between cancer stage
and SLC5A6 or MFAP2 was identified (Fig. 8A and B). RNA-sequencing expression
levels of SLC5A6 or MFAP2 were significantly increased in tumor
tissues compared with normal tissues (P<0.01; Fig. 8C and D).
SLC5A6 and MFAP2 may serve as novel
diagnostic markers for GC
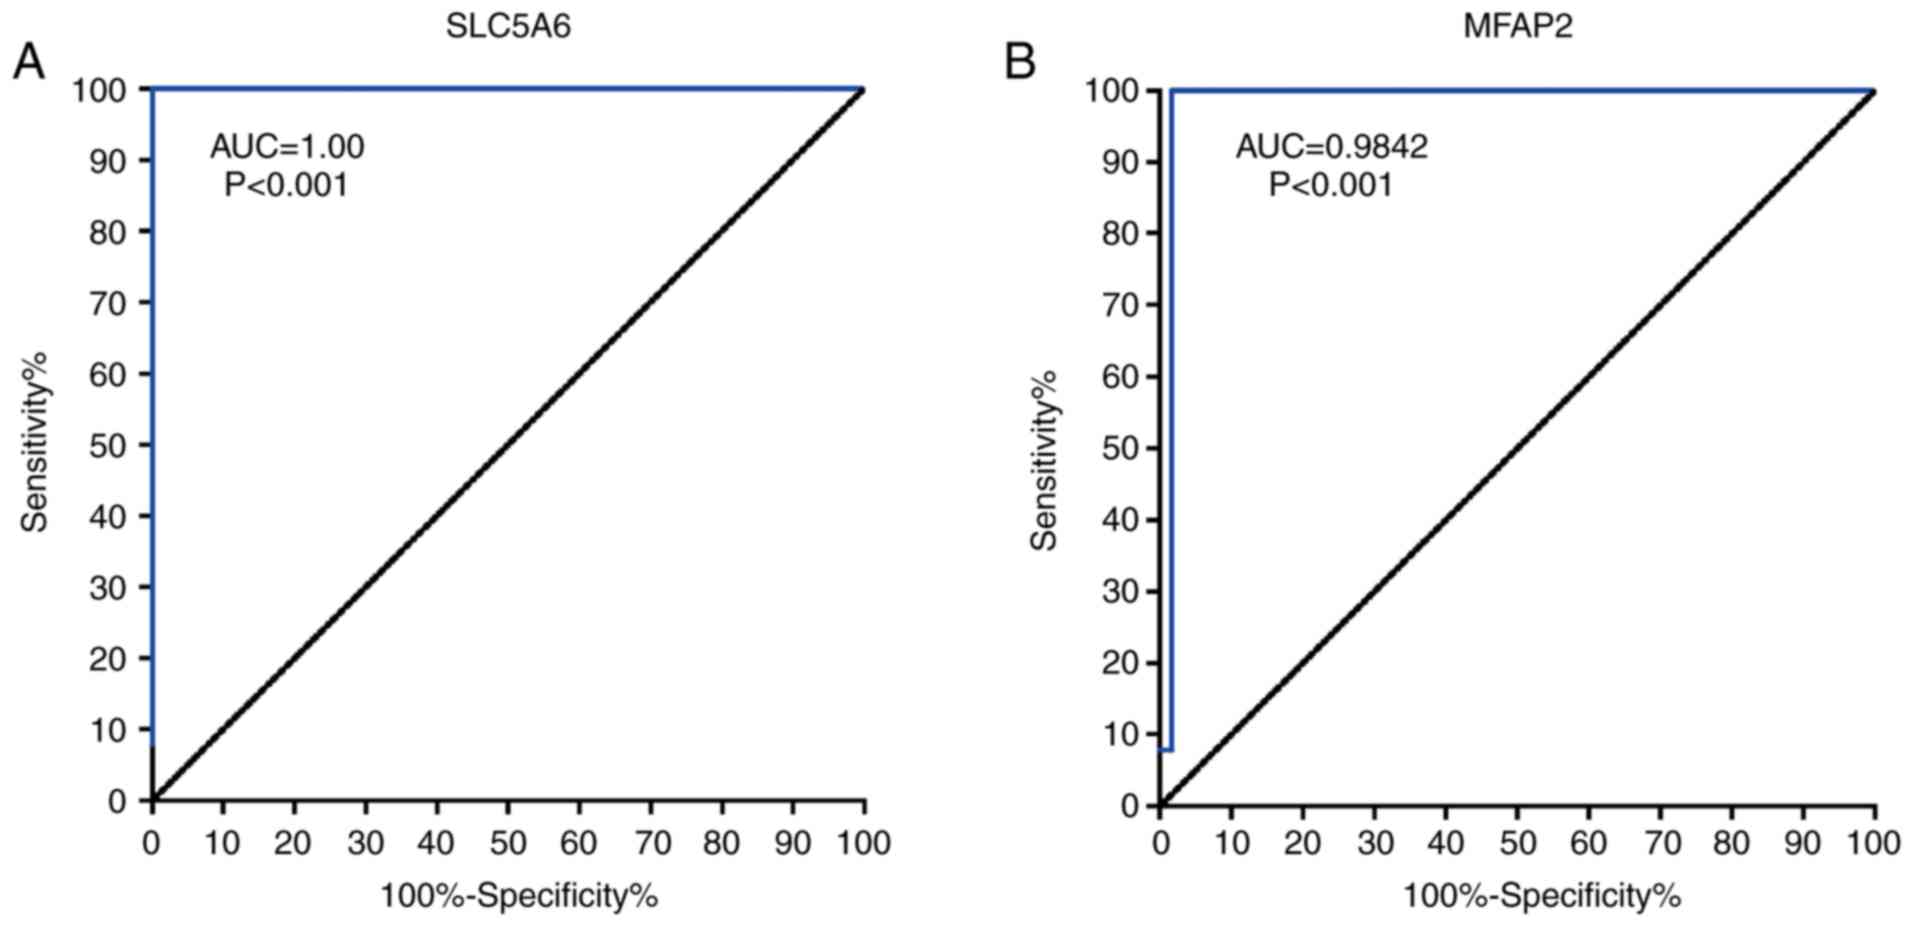
ROC curves showed that SLC5A6 and MFAP2 exhibited
excellent diagnostic efficiency for GC (P<0.001; Fig. 9). The area under the ROC curve was
calculated using 375 tumor and 32 normal samples; for SLC5A6 an
area under the curve of 1.000 and for MFAP2 0.9842 were determined.
These results indicated that SLC5A6 and MFAP2 may serve as novel
diagnostic marker for GC.
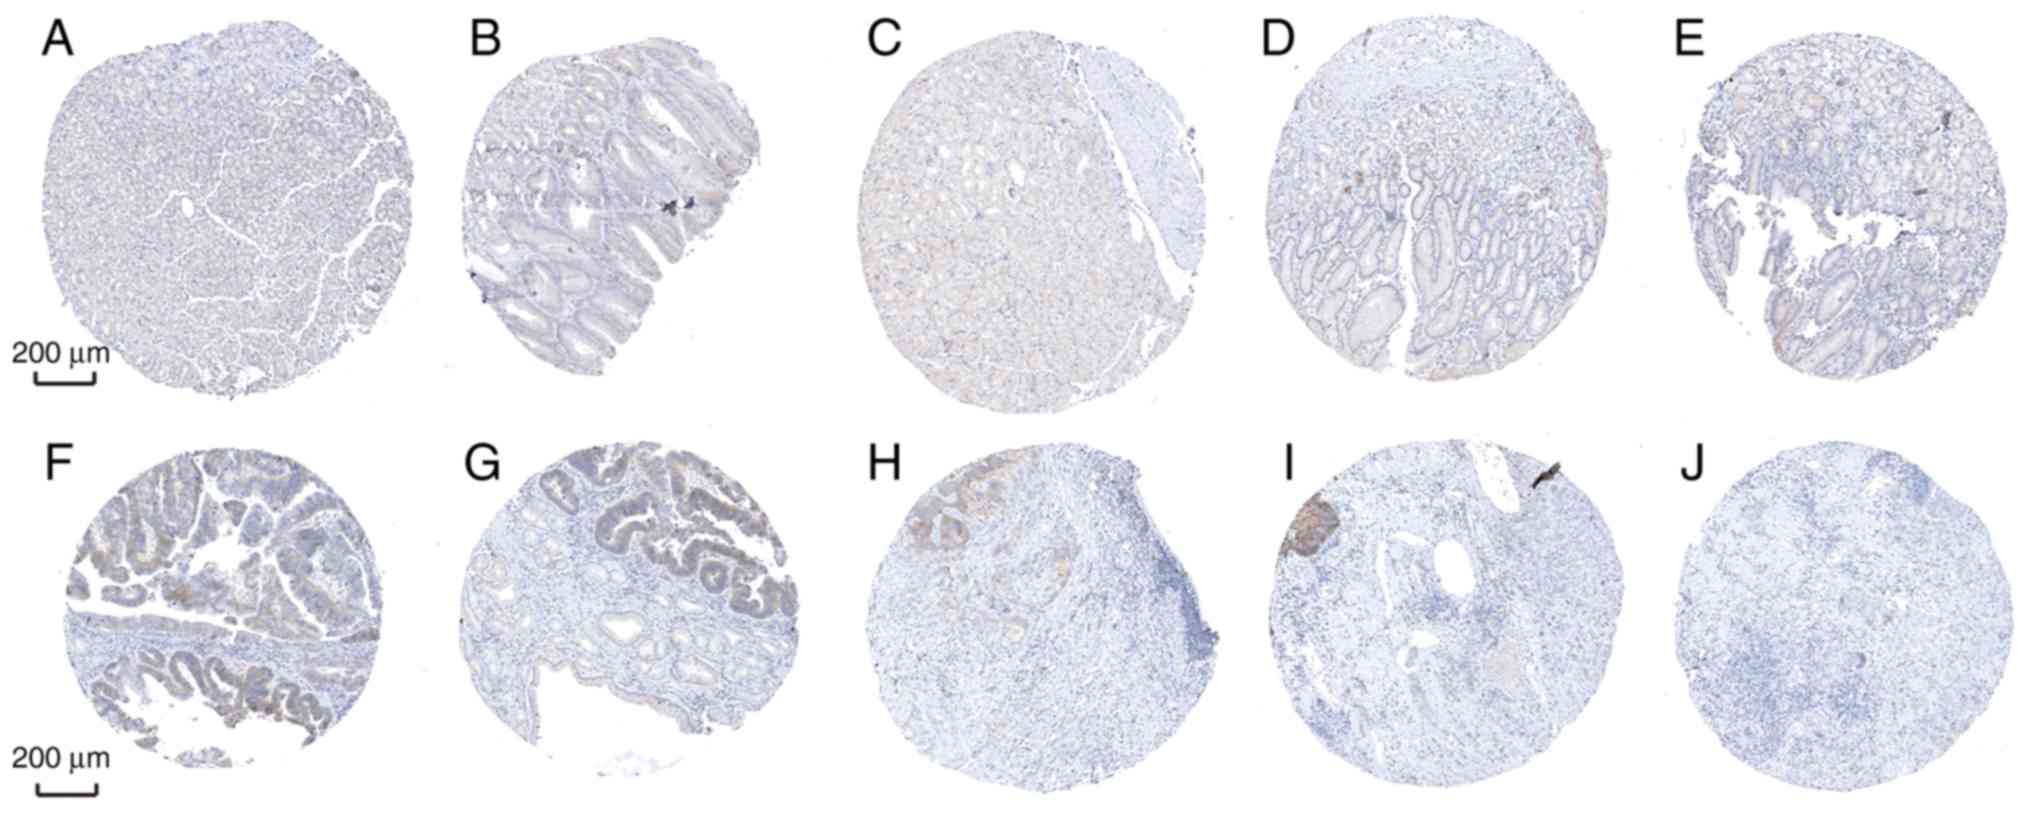
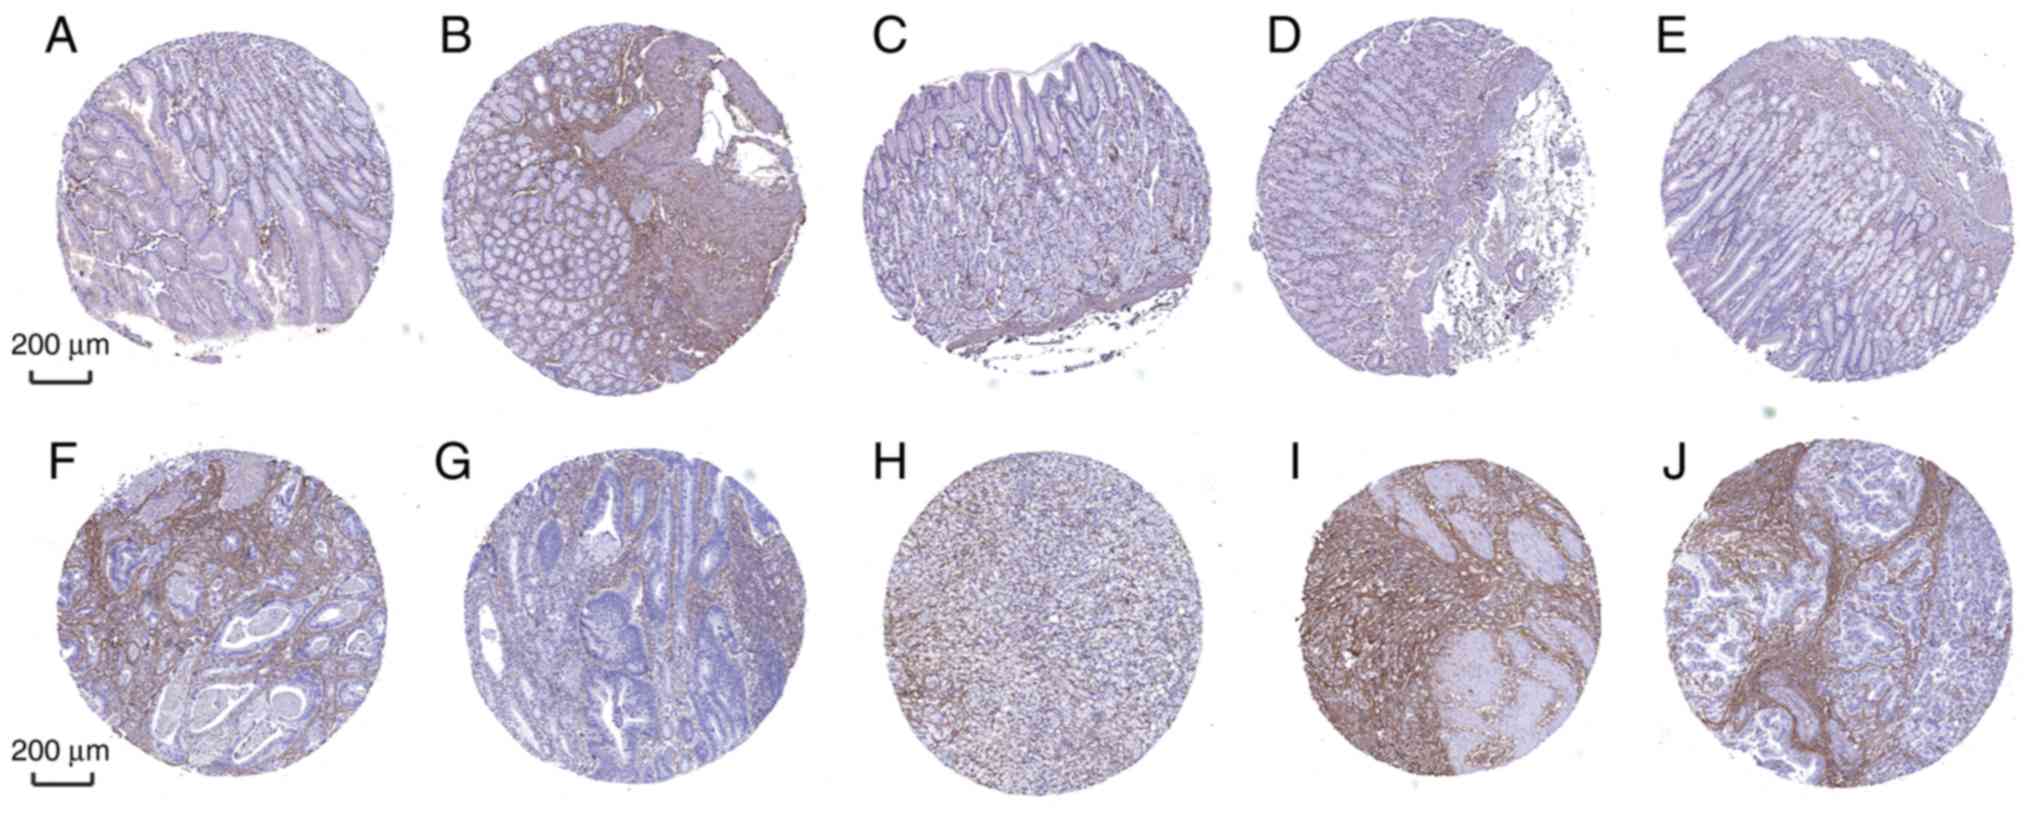
Furthermore, the diagnostic efficiency of SLC5A6 and
MFAP2 was verified via immunohistochemistry results using the Human
Protein Atlas database. Data for the two hub genes were obtained,
including antibody staining, intensity and quantity in
immunohistochemistry. Immunohistochemistry results indicated that
the protein expression of SLC5A6 in tumor tissues was increased
compared with normal tissues (Fig.
10). However, protein expression of MFAP2 in tumor and normal
tissues was not markedly different (Fig. 11). This was inconsistent with the
results of mRNA expression using the TCGA data.
Discussion
GC has high reoccurrence even after combined
treatments and it is a serious health thread (23). Multiple factors are involved in the
tumorigenesis and progression of GC, including tumor suppressor
gene inactivation, oncogene overexpression, tumor microenvironment
remodeling, lifestyle, environmental factors and others (1,24).
Due to the roles of genetic factors in GC occurrence, development,
progression and prognosis, microarray and high-throughput
sequencing can further help to study the function of genes at the
whole genome level (25). As a
systematic biology method to depict how clinical characteristics
associate with genes, in this study, WGCNA was applied to
investigate co-expression in GC and normal tissues.
In the present study, 21,648 DEGs were identified
and further processed and the top 50% of genes (10,824 genes) were
selected for WGCNA analysis. Using comprehensive analyses of GS, MS
and MM, it was inferred that SLC5A6, MFAP2 and EVA1A were the hub
genes of the 'black’ module. However, only SLC5A6 and MFAP2 were
identified as clinically significant hub genes, which were further
successfully validated using TCGA data. Additionally, SLC5A6 and
MFAP2 exhibited excellent diagnostic efficiency for GC tissues
compared with normal tissues.
According to the distribution of mean GS and errors
in the modules associated with prognosis of GC, the 'black’ module
was identified as the clinical significant module, and the majority
of enriched genes were associated with BP, including the positive
regulation of endothelial cell proliferation. KEGG pathway analysis
indicated that these genes were involved in longevity regulating
pathway-multiple species, insulin signaling pathway and mTOR
signaling pathway. These results implied that the cluster of genes
in this significant module may play an important role in promoting
tumor growth, increasing proteinaceous extracellular matrix
production and activating metallopeptidase. The abnormal
proliferation of endothelial cells is closely associated with
occurrence and development of GC (26,27).
In addition, metalloproteinases activation and tumor
microenvironment remodeling pave the way for cancer metastasis and
progress (28-30). Further studies may explore the
roles and functions of the hub genes identified in this study.
SLC5A6 and MFAP2 were negatively associated with OS
of GC patients. mRNA expression of these genes were significantly
increased in tumor tissues compared with normal tissues; however,
it did not significantly vary by tumor stage. This suggested that
these two genes have only a small impact on disease grading. The
protein expression of SLC5A6 was significantly increased in tumor
tissues, but protein expression of MFAP2 was observed in both in
normal and tumor tissues. According to these results, it was
suggested that SLC5A6 and MFAP2 were novel diagnostic and
prognostic biomarkers for GC, with SLC5A6 potentially being more
reliable than MFAP2.
MFAP2 is an abundant component of microfibrils
(31,32). The research of MFAP2 mainly focuses
on its role in regulating the deposition of proelastin on
microfibers to form elastic fibers (31), and few studies have been conducted
to investigate the function of MFAP2 in cancer. MFAP2 has been
identified to be co-expressed in association with the
NF-κB/Snail/YY1/RKIP signaling pathway in multiple myeloma
(33). In addition, MFAP2 has been
shown to be markedly elevated in head and neck squamous cell
carcinoma, particularly in lymph node metastasis (34). Recently, Wanget al (35) demonstrated that MFAP2 can promote
epithelial-mesenchymal transition via activating the TGF-β/SMAD2/3
signaling pathway in GC cells. Consistent with previous findings,
our results suggested that MFAP2 may play a crucial role in
progression of GC and that it may act as an oncogene. However, the
functions and underlying mechanisms of MFAP2 involved in the
development and progression of GC need to be further
investigated.
To the best of our knowledge, no studies have been
conducted evaluating the role of SLC5A6 in cancer to date. SLC5A6
encodes the Na+/multivitamin transporter (SMVT)
(36), a member of the SLC5 family
of Na+/solute symporters (37), and it mediates the
Na+-dependent uptake of structurally diverse
water-soluble vitamins, such as pantothenic acid and biotin
(38,39). Ghosalet al (40) generated an intestine-specific
(conditional) SMVT knockout (KO) mouse model using Cre/lox
technology. They found that the KO mice exhibited growth
retardation, decreased bone density, decreased bone length and
decreased biotin status, and about two-thirds of the KO mice died
prematurely between the age of 6 and 10 weeks (40). Our results indicated that SLC5A6
was a potential diagnostic and prognostic biomarker for GC, which
implied that SLC5A6 was likely to play a role in tumorigenesis and
progression. Details need to be clarified in further studies.
Other prognostic biomarkers for GC were previously
identified via WGCNA using different GEO datasets, including
sorting nexin 10 (41), elastin
microfibril interface 1 (42) and
follistatin like 1 (42). The
present study has various limitations. First, the expression levels
of SLC5A6 and MFAP2 were not further analyzed in clinical specimens
or GC cell lines. Second, the functions and molecular regulatory
mechanisms of SLC5A6 and MFAP2 in GC need to be further explored.
Third, in this study, the sample size for screening hub genes was
limited and further studies could include a lager sample pool to
validate the results and conclusions presented here.
In conclusion, WGCNA was utilized to identify hub
genes in GC that were further studied using RNA sequencing and
available clinical data from TCGA. SLC5A6 and MFAP2 were hub genes
associated oncogenesis and may act as independent prognostic
factors for OS in GC patients. SLC5A6 and MFAP2 further may have
the potential to be diagnostic and prognostic biomarkers in GC
patients contributing to personalized therapy. However, further
in-depth investigations are required to clarify the clinical and
biological functions of these candidates.
Supplementary Data
Funding
This study was supported by the National Natural
Science Foundation of China Youth Science Foundation Project (grant
no. 81802571), the National Natural Science Foundation of China
(grant no. 81271917), and the Zhejiang Medical, Health Science and
Technology Project (grant no. 2019RC039).
Availability of data and materials
All data generated or analyzed during this study are
included either in this article or in the supplementary
information.
Authors' contributions
WL, ZT and TS designed the study. WL, TS, DW, YS,
ZL, YW, YD, PY and XD analyzed the data and prepared figures and/or
tables. WL and ZT prepared the manuscript. All authors read and
approved the final version of the manuscript.
Ethics approval and consent to
participate
Not applicable.
Patient consent for publication
Not applicable.
Competing interests
The authors declare that they have no competing
interests.
Abbreviations:
|
BP
|
biological process
|
|
CC
|
cellular component
|
|
DEG
|
differentially expressed gene
|
|
GC
|
gastric cancer
|
|
GEO
|
Gene Expression Omnibus
|
|
GO
|
Gene Ontology
|
|
GS
|
gene significance
|
|
KEGG
|
Kyoto Encyclopedia of Genes and
Genomes
|
|
MFAP2
|
microfibril-associated protein 2
|
|
ME
|
module eigengene
|
|
MF
|
molecular function
|
|
MM
|
module membership
|
|
OS
|
overall survival
|
|
WGCNA
|
weighted genes co-expression network
analysis
|
|
TCGA
|
The Cancer Genome Atlas
|
|
TOM
|
topological overlap measure
|
|
ROC
|
receiver operating characteristic
|
Acknowledgments
We would like to thank Dr Xiuzhi Duan (The Second
Affiliated Hospital of Zhejiang University School of Medicine) for
constructive suggestions and supporting this study.
References
|
1
|
Van Cutsem E, Sagaert X, Topal B,
Haustermans K and Prenen H: Gastric cancer. Lancet. 388:2654–2664.
2016. View Article : Google Scholar : PubMed/NCBI
|
|
2
|
Chmiela M, Karwowska Z, Gonciarz W,
Allushi B and Stączek P: Host pathogen interactions in helicobacter
pylori related gastric cancer. World J Gastroenterol. 23:1521–1540.
2017. View Article : Google Scholar : PubMed/NCBI
|
|
3
|
Zhu Q, Wong AK, Krishnan A, Aure MR,
Tadych A, Zhang R, Corney DC, Greene CS, Bongo LA, Kristensen VN,
et al: Targeted exploration and analysis of large cross-platform
human transcriptomic compendia. Nat Methods. 12:211–214. 2015.
View Article : Google Scholar : PubMed/NCBI
|
|
4
|
Alberti C, Manzenreither RA, Sowemimo I,
Burkard TR, Wang J, Mahofsky K, Ameres SL and Cochella L: Cell-type
specific sequencing of microRNAs from complex animal tissues. Nat
Methods. 15:283–289. 2018. View Article : Google Scholar : PubMed/NCBI
|
|
5
|
Wu J, Xu J, Liu B, Yao G, Wang P, Lin Z,
Huang B, Wang X, Li T, Shi S, et al: Chromatin analysis in human
early development reveals epigenetic transition during ZGA. Nature.
557:256–260. 2018. View Article : Google Scholar : PubMed/NCBI
|
|
6
|
Rodriguez R and Miller KM: Unravelling the
genomic targets of small molecules using high-throughput
sequencing. Nat Rev Genet. 15:783–796. 2014. View Article : Google Scholar : PubMed/NCBI
|
|
7
|
Schwartz R and Schäffer AA: The evolution
of tumour phyloge-netics: Principles and practice. Nat Rev Genet.
18:213–229. 2017. View Article : Google Scholar : PubMed/NCBI
|
|
8
|
Simon R and Roychowdhury S: Implementing
personalized cancer genomics in clinical trials. Nat Rev Drug
Discov. 12:358–369. 2013. View
Article : Google Scholar : PubMed/NCBI
|
|
9
|
Cancer Genome Atlas Research Network;
Analysis Working Group; Asan University; BC Cancer Agency; Brigham
and Women's Hospital; Broad Institute; Brown University; Case
Western Reserve University; Dana-Farber Cancer Institute; Duke
University; et al: Integrated genomic characterization of
oesophageal carcinoma. Nature. 541:169–175. 2017. View Article : Google Scholar : PubMed/NCBI
|
|
10
|
Cancer Genome Atlas Research Network;
Weinstein JN, Collisson EA, Mills GB, Shaw KR, Ozenberger BA,
Ellrott K, Shmulevich I, Sander C and Stuart JM: The cancer genome
atlas pan-cancer analysis project. Nat Genet. 45:1113–1120. 2013.
View Article : Google Scholar : PubMed/NCBI
|
|
11
|
Zhu Y, Qiu P and Ji Y: TCGA-assembler:
Open-source software for retrieving and processing TCGA data. Nat
Methods. 11:599–600. 2014. View Article : Google Scholar : PubMed/NCBI
|
|
12
|
Uhlen M, Zhang C, Lee S, Sjöstedt E,
Fagerberg L, Bidkhori G, Benfeitas R, Arif M, Liu Z, Edfors F, et
al: A pathology atlas of the human cancer transcriptome. Science.
357:eaan25072017. View Article : Google Scholar : PubMed/NCBI
|
|
13
|
Baughman JM, Perocchi F, Girgis HS,
Plovanich M, Belcher-Timme CA, Sancak Y, Bao XR, Strittmatter L,
Goldberger O, Bogorad RL, et al: Integrative genomics identifies
MCU as an essential component of the mitochondrial calcium
uniporter. Nature. 476:341–345. 2011. View Article : Google Scholar : PubMed/NCBI
|
|
14
|
Radulescu E, Jaffe AE, Straub RE, Chen Q,
Shin JH, Hyde TM, Kleinman JE and Weinberger DR: Identification and
prioritization of gene sets associated with schizophrenia risk by
co-expression network analysis in human brain. Mol Psychiatry.
2018.Epub ahead of print. View Article : Google Scholar : PubMed/NCBI
|
|
15
|
Magani F, Bray ER, Martinez MJ, Zhao N,
Copello VA, Heidman L, Peacock SO, Wiley DJ, D'Urso G and Burnstein
KL: Identification of an oncogenic network with prognostic and
therapeutic value in prostate cancer. Mol Syst Biol. 14:e82022018.
View Article : Google Scholar : PubMed/NCBI
|
|
16
|
Liu W, Li L and Li W: Gene co-expression
analysis identifies common modules related to prognosis and drug
resistance in cancer cell lines. Int J Cancer. 135:2795–2803. 2014.
View Article : Google Scholar : PubMed/NCBI
|
|
17
|
Wu H, Chen S, Yu J, Li Y, Zhang XY, Yang
L, Zhang H, Hou Q, Jiang M, Brunicardi FC, et al: Single-cell
transcriptome analyses reveal molecular signals to intrinsic and
acquired paclitaxel resistance in esophageal squamous cancer cells.
Cancer Lett. 420:156–167. 2018. View Article : Google Scholar : PubMed/NCBI
|
|
18
|
Punt S, Houwing-Duistermaat JJ, Schulkens
IA, Thijssen VL, Osse EM, de Kroon CD, Griffioen AW, Fleuren GJ,
Gorter A and Jordanova ES: Correlations between immune response and
vascularization qRT-PCR gene expression clusters in squamous
cervical cancer. Mol Cancer. 14:712015. View Article : Google Scholar : PubMed/NCBI
|
|
19
|
Pasini FS, Zilberstein B, Snitcovsky I,
Roela RA, Mangone FR, Ribeiro U Jr, Nonogaki S, Brito GC, Callegari
GD, Cecconello I, et al: A gene expression profile related to
immune dampening in the tumor microenvironment is associated with
poor prognosis in gastric adenocarcinoma. J Gastroenterol.
49:1453–1466. 2014. View Article : Google Scholar :
|
|
20
|
American Joint Committee on Cancer: AJCC
Cancer Staging Manual. 7th edition. Springer; New York, NY:
2017
|
|
21
|
Tang J, Kong D, Cui Q, Wang K, Zhang D,
Gong Y and Wu G: Prognostic genes of breast cancer identified by
gene co-expression network analysis. Front Oncol. 8:3742018.
View Article : Google Scholar : PubMed/NCBI
|
|
22
|
Xiao J and Yiqing Q: Bioinformatics
analysis of the gene expression profile in bladder carcinoma. Genet
Mol Biol. 36:287–291. 2013. View Article : Google Scholar : PubMed/NCBI
|
|
23
|
Zhang X, Li M, Chen S, Hu J, Guo Q, Liu R,
Zheng H, Jin Z, Yuan Y, Xi Y and Hua B: Endoscopic screening in
Asian countries is associated with reduced gastric cancer
mortality: A meta-analysis and systematic review. Gastroenterology.
155:347–354.e9. 2018. View Article : Google Scholar : PubMed/NCBI
|
|
24
|
Tan P and Yeoh KG: Genetics and molecular
pathogenesis of gastric adenocarcinoma. Gastroenterology.
149:1153–1162.e3. 2015. View Article : Google Scholar : PubMed/NCBI
|
|
25
|
Byron SA, Van Keuren-Jensen KR,
Engelthaler DM, Carpten JD and Craig DW: Translating RNA sequencing
into clinical diagnostics: Opportunities and challenges. Nat Rev
Genet. 17:257–271. 2016. View Article : Google Scholar : PubMed/NCBI
|
|
26
|
Lei Z, Chai N, Tian M, Zhang Y, Wang G,
Liu J, Tian Z, Yi X, Chen D, Li X, et al: Novel peptide GX1
inhibits angiogenesis by specifically binding to transglutaminase-2
in the tumorous endothelial cells of gastric cancer. Cell Death
Dis. 9:5792018. View Article : Google Scholar : PubMed/NCBI
|
|
27
|
Tokumoto MW, Tanaka H, Tauchi Y, Kasashima
H, Kurata K, Yashiro M, Sakurai K, Toyokawa T, Kubo N, Amano R, et
al: Identification of tumour-reactive lymphatic endothelial cells
capable of inducing progression of gastric cancer. Br J Cancer.
113:1046–1054. 2015. View Article : Google Scholar : PubMed/NCBI
|
|
28
|
Bae IH, Park MJ, Yoon SH, Kang SW, Lee SS,
Choi KM and Um HD: Bcl-w promotes gastric cancer cell invasion by
inducing matrix metalloproteinase-2 expression via phosphoinositide
3-kinase, Akt, and Sp1. Cancer Res. 66:4991–4995. 2006. View Article : Google Scholar : PubMed/NCBI
|
|
29
|
Kim LC, Cook RS and Chen J: mTORC1 and
mTORC2 in cancer and the tumor microenvironment. Oncogene.
36:2191–2201. 2017. View Article : Google Scholar :
|
|
30
|
Varn FS, Wang Y, Mullins DW, Fiering S and
Cheng C: Systematic pan-cancer analysis reveals immune cell
interactions in the tumor microenvironment. Cancer Res.
77:1271–1282. 2017. View Article : Google Scholar : PubMed/NCBI
|
|
31
|
Clarke AW and Weiss AS:
Microfibril-associated glycoprotein-1 binding to tropoelastin:
Multiple binding sites and the role of divalent cations. Eur J
Biochem. 271:3085–3090. 2004. View Article : Google Scholar : PubMed/NCBI
|
|
32
|
Tatano Y, Takahashi T, Tsuji D, Takeuchi
N, Tsuta K, Takada G, Ohsawa M, Sakuraba H and Itoh K: Significant
decrease in tropo-elastin gene expression in fibroblasts from a
Japanese costello syndrome patient with impaired elastogenesis and
enhanced proliferation. J Biochem. 140:193–200. 2006. View Article : Google Scholar : PubMed/NCBI
|
|
33
|
Zaravinos A, Kanellou P, Lambrou GI and
Spandidos DA: Gene set enrichment analysis of the
NF-κB/Snail/YY1/RKIP circuitry in multiple myeloma. Tumour Biol.
35:4987–5005. 2014. View Article : Google Scholar : PubMed/NCBI
|
|
34
|
Silveira NJ, Varuzza L, Machado-Lima A,
Lauretto MS, Pinheiro DG, Rodrigues RV, Severino P, Nobrega FG;
Head and Neck Genome Project GENCAPO; Silva WA Jr, et al: Searching
for molecular markers in head and neck squamous cell carcinomas
(HNSCC) by statistical and bioinformatic analysis of larynx-derived
SAGE libraries. BMC Med Genomics. 1:562008. View Article : Google Scholar : PubMed/NCBI
|
|
35
|
Wang JK, Wang WJ, Cai HY, Du BB, Mai P,
Zhang LJ, Ma W, Hu YG, Feng SF and Miao GY: MFAP2 promotes
epithelial-mesenchymal transition in gastric cancer cells by
activating TGF-β/SMAD2/3 signaling pathway. Onco Targets Ther.
11:4001–4017. 2018. View Article : Google Scholar :
|
|
36
|
Hediger MA, Romero MF, Peng JB, Rolfs A,
Takanaga H and Bruford EA: The ABCs of solute carriers:
Physiological, pathological and therapeutic implications of human
membrane transport proteins introduction. Pflugers Arch.
447:465–468. 2004. View Article : Google Scholar
|
|
37
|
Saier MH Jr: A functional-phylogenetic
classification system for transmembrane solute transporters.
Microbiol Mol Biol Rev. 64:354–411. 2000. View Article : Google Scholar : PubMed/NCBI
|
|
38
|
Subramanian VS, Constantinescu AR, Benke
PJ and Said HM: Mutations in SLC5A6 associated with brain, immune,
bone, and intestinal dysfunction in a young child. Hum Genet.
136:253–261. 2017. View Article : Google Scholar
|
|
39
|
Vadlapudi AD, Vadlapatla RK and Mitra AK:
Sodium dependent multivitamin transporter (SMVT): A potential
target for drug delivery. Curr Drug Targets. 13:994–1003. 2012.
View Article : Google Scholar : PubMed/NCBI
|
|
40
|
Ghosal A, Lambrecht N, Subramanya SB,
Kapadia R and Said HM: Conditional knockout of the Slc5a6 gene in
mouse intestine impairs biotin absorption. Am J Physiol
Gastrointest Liver Physiol. 304:G64–G71. 2013. View Article : Google Scholar :
|
|
41
|
Zhang J, Wu Y, Jin HY, Guo S, Dong Z,
Zheng ZC, Wang Y and Zhao Y: Prognostic value of sorting nexin 10
weak expression in stomach adenocarcinoma revealed by weighted gene
co-expression network analysis. World J Gastroenterol.
24:4906–4919. 2018. View Article : Google Scholar : PubMed/NCBI
|
|
42
|
Chen J, Wang X, Hu B, He Y, Qian X and
Wang W: Candidate genes in gastric cancer identified by
constructing a weighted gene co-expression network. PeerJ.
6:e46922018. View Article : Google Scholar : PubMed/NCBI
|