Introduction
Ovarian cancer is the fifth leading cause of
cancer-related mortality among women, as well as the most lethal
gynecological malignancy (1). The
transcription factor, paired box 2 (PAX2) is expressed in a subset
of ovarian carcinomas and ovarian cancer cell lines (2,3). The
role of PAX2 in ovarian cancer has been described as both that of
an oncogene and a tumor suppressor, depending on the context
(4,5). PAX2 is normally expressed in
Müllerian-derived tissues such as the fallopian tube epithelium
(FTE), whereas it is not expressed in the ovarian surface
epithelium (OSE). The ectopic expression of Pax2 has been
shown to lead to the transformation of rat fibroblasts (6); thus, PAX2 may also contribute to
carcinogenesis.
PAX2 belongs to the paired homeobox domain family
and is frequently expressed in breast and ovarian cancers and is
required for cancer cell survival (7). Although PAX2 expression in ovarian
cancer has been reported (2,7), few
studies have focused on its role in ovarian carcinogenesis
(4,5,8).
Furthermore, the effects of PAX2 expression on patient prognosis
have not yet been systematically analyzed, at least to the best of
our knowledge. Previous studies have demonstrated a role for PAX2
in promoting cell proliferation and chemoresistance in cancer
(7,9). PAX2 has been shown to enhance tumor
progression or chemoresistance in xenograft models of endometrial,
colon and renal cancers (10-12).
In a previous study, PAX2 overexpression in a murine ovarian tumor
model led to cisplatin resistance and reduced survival, at least in
part by the inhibition of p53 and the induction of p-extracellular
regulated kinase (ERK)1/2 and cyclooxygenase 2 (COX2), resulting in
decreased apoptosis in tumors arising from these cells (5). Resistance to chemotherapy is a common
cause of progression or recurrence in ovarian cancer.
In this study, to clarify the potential effects of
PAX2 on ovarian cancer recurrence, the association between PAX2
expression and progression-free survival time was examined. In
addition, mass spectrometry-based iTRAQ proteomic profiles were
employed to illuminate the underlying mechanisms of action of
PAX2.
Materials and methods
Cells and cell culture
RM cells were derived from immortalized mouse
ovarian surface epithelial cells transduced with retroviral
constructs to achieve ectopic expression of mutant K-Ras
(KRASG12D) and Myc as previously described (5).
Construction of cell lines
The construction of the RM-PAX2 and RM-pWPI cell
lines has been described in detail previously (5). Briefly, the murine Pax2 cDNA
(pax2-b variant) was cloned from murine oviduct and inserted into
the Not I site of pWPI (Addgene plasmid 12254) to generate a
lentivirus expression vector (WPI-Pax2-IRES-eGFP, hereafter
pWPI-Pax2). The empty pWPI vector was used as a control. The vector
plasmids (pWPI or pWPI-Pax2), packaging plasmid pCMVR8.74 (Addgene
plasmid 22036), and the ecotropic envelope expression plasmid,
pCAG-Eco (Addgene plasmid 35617) were co-transfected into 293T
cells (ATCC® CRL-3216™) to generate lentivirus. RM cells
were infected with lentivirus and then passaged at least 3 times
prior to sorting for GFP expression by fluorescence-activated cell
sorting (Beckman Coulter, Inc.).
Cell proliferation assay
The RM, RM-WPI or RM-PAX2 cells (5×10⁴)
were plated in 6-well plates for 72-h growth assays. Cell numbers
were counted using a Vi-Cell™ XR cell viability analyzer (Beckman
Coulter, Inc.).
In vivo tumorigenesis experiment
Animal experiments were performed in accordance with
the Canadian Council on Animal Care's Guidelines for the Care and
Use of Animals under a protocol approved by the University of
Ottawa's Animal Care Committee. Mice were maintained in a dedicated
room for immune-compromised mice (21̊C, 40-60% humidity, 12/12 h
light/dark cycle). A commercial rodent diet (2018 Teklad Global 18%
Protein Rodent Diet, Harlan Laboratories, Indianapolis, ID, USA)
along with acidified water was available ad libitum.
Housing, food and water were autoclaved, and all animal
manipulations were carried out in a certified ESCO-type A2 BSC
hood, following a two-person dirty/clean protocol. Mice were
allowed a 1-week acclimation period prior to the initiation of any
experimental manipulations.
The RM-WPI or RM-PAX2 cells (1×10⁷ in 500
µl PBS) were injected into the peritoneal cavity of eight
8-week-old SCID mice (The Jackson Laboratory), separately. The mice
injected with RM-PAX2 cells intraperitoneally had an average weight
of 17.7 g at the time of purchase, and the average weight of RM-WPI
group was 18.8 g. No analgesics or anesthetics were administered to
the mice for the i.p. injection of cells, as i.p. injections are
considered routine procedures, are performed quickly and do not
appear to be very painful to the mice. Eight mice were assigned to
each group. Disease progression was monitored and the mice were
euthanized via CO2 asphyxiation once a humane endpoint
was reached (rapid changes in weight, loss or gain of >5 g
compared to the average body weight of control mice of the same
age, presence of respiratory distress, a palpable mass or abdominal
distention that impairs mobility). For euthanasia, the flow rate of
medical-grade CO2 was 1.5 litres/min to deliver a 30%
change in the chamber volume/min. The mice were kept in the
CO2 chamber for 3-5 min until they did not respond to
pain stimuli (pinching tails and paws). Tumors were then excised,
imaged by fluorescent microscopy (EVOS Imaging Systems, Thermo
Fisher Scientific), fixed in 10% buffered formalin for 24 h,
paraffin-embedded and sectioned at a thickness of 5 µm for
histological analysis. Alternatively, tumor samples were
snap-frozen in liquid nitrogen for protein analysis.
Patient samples
The tissue microarrays (TMA) consisted of specimens
from 152 patients who were diagnosed with epithelial ovarian cancer
and treated from 2005 to 2013. Among these, 131 specimens were
generous gifts from the Affiliated Qilu Hospital of Shandong
University and the remaining were from the Guangxi Medical
University Cancer Hospital. The pathological diagnosis of specimens
in the TMAs was reviewed by senior pathologists of that same
institution. Three tissue samples used for western blot analysis
were from patients who were diagnosed with high-grade serous
ovarian cancer and followed by radical hysterectomy at the Guangxi
Medical University Cancer Hospital, and no malignant lesions in
ampulla of oviduct was proved by pathology. Patient informed
consents were obtained prior to the experiments and the protocols
were approved by the Ethics Review Committees of both the
Affiliated Qilu Hospital of Shangdong University and the Guangxi
Medical University Cancer Hospital.
The ages of the 152 patients with ovarian serous
carcinoma were 33 to 79 years, with an average age of 54.9±9.9
years. The median time of overall survival (OS) and
progression-free survival (PFS) was 52.0 and 28.0 months,
respectively. The patient clinical information is presented in
Table I.
 | Table IPathological features of the 152
patients with epithelial ovarian cancer. |
Table I
Pathological features of the 152
patients with epithelial ovarian cancer.
| Features | Classification of
cases | Case (n) |
|---|
| Vital state | Living | 68 |
| Deceased | 84 |
| FIGOa | Stage I-II | 34 |
| Stage III-IV | 118 |
| Pathological
grade | G0-1 | 5 |
| G2-3 | 147 |
| Serum CA125 level
(U/ml) | ≤500 | 61 |
| >500 | 91 |
| TP53
expression | Negative | 45 |
| Weakly
positive | 23 |
| Strongly
positive | 84 |
| RAS expression | Negative | 20 |
| Positive | 132 |
| PAX2
expression | Negative | 48 |
| Positive | 104 |
| ACAA2
expression | Low | 60 |
| High | 92 |
| PNLIP | Low | 126 |
| High | 26 |
All patients were followed-up eacg month in the
first year following surgery, every 3 months in the second year,
every 6 months in the third year, and once every 3 years
thereafter. The endpoint was the appearance of tumor progression
(including recurrence not controlled with treatment, or death). The
follow-up time ranged from 5 to 129 months (average, 43±25 months).
PFS was determined as the period from the day of surgery to the
time of disease recurrence. Those who did not recur and survived
beyond April 1, 2016 were recorded as censored data.
Immunohistochemical analysis
The expression of PAX2, RAS, acetyl-CoA
acyltransferase 2 (ACAA2) and pancreatic lipase (PNLIP) was
determined by immunohisto-chemistry using the Immunohistochemistry
Envision HRP kit (cat. no. KIT-5004, Maixin Biotechnologies),
rabbit-anti-PAX2 antibody (cat. no. ab150391, Abcam), rabbit-anti
RAS antibody [Ras (D2C1), rabbit mAb, cat. no. #8955, Cell
Signaling Technology], rabbit-anti ACAA2 antibody (cat. no.
PAS78709, Invitrogen; Thermo Fisher Scientific) and rabbit-anti
PNLIP (cat. no. PA5-80956, Invitrogen; Thermo Fisher Scientific).
Optimal dilution ratio of primary antibodies was 1:100.
The percentage of positive cells in each specimen
and the staining intensity were independently evaluated and scored
by two senior pathologists. When scored for the percentage of
positive cells, '0' stands for no positive cells, '1' for 1-25, '2'
for 26-50, '3' for 51-75 and '4' for 76-100%. When scored for
staining intensity, '0' stands for no coloring, '1' for pale
yellow, '2' for brown and '3' for deep brown. The final scores were
the multiple of these two scores. For PAX2, the total score 0 was
defined as negative, ≤6 was weak expression and >6 was strong
expression. For RAS, 0 was defined as negative, >0 was positive;
for ACAA2, 0 was defined as negative, <5 was low expression, and
≥5 was high expression; for PNLIP, 0 was defined as negative, <5
was low expression, and ≥6 was high expression.
iTRAQ proteomics profiling
Tumor tissues from the murine RM model expressing
either PAX2 or not were ground under liquid nitrogen and the
protein was extracted using the ProteoExtract® Complete
Mammalian Proteome Extraction kit (cat. no. 539779, Merck
Millipore) and quantified using the Pierce BCA Protein Assay kit
(cat. no. 23227, Pierce; Thermo Fisher Scientific). Protein samples
were then reduced, alkylated, digested and labeled with iTRAQ
reagents according to the recommended protocol (iTraq Reagent 8
plex buffer kit, cat. no. P/N4381664; iTraq Reagent 8 plex
Multiplex kit, cat. no. P/N4381663; Applied Biosystems). The
samples were labeled as follows: RM-PAX2, iTraq reagents 117 and
118; RM-WPI iTraq reagents 119 and 121. Following iTRAQ labeling,
samples were fractionated by HPLC and analyzed by high-resolution
LC-MS/MS. Quantitative global proteome analysis was performed in
the PTM Biolabs (https://www.ptmbiolabs.com/). Bioinformatics analysis
was carried out to annotate quantifiable targets by protein
annotation, functional classification, functional enrichment,
functional enrichment-based cluster analysis, etc.
Gene Ontology (GO) annotation proteome was derived
from the UniProt-GOA database (http://www.ebi.ac.uk/GOA/). Identified protein IDs
were first converted to UniProt ID and then mapped to GO IDs by
protein ID. If some identified proteins were not annotated by the
UniProt-GOA database, InterProScan software (http://www.ebi.ac.uk/interpro/) was used to determine
the GO function based on a protein sequence alignment method.
Proteins were then classified by the GO annotation based on 3
categories: Biological process, cellular component and molecular
function.
Western blot analysis
Protein extracts were prepared by cell lysis using
RIPA Buffer. Protein concentrations were quantified using the Quick
Start Bradford Protein assay kit (Bio-Rad). Proteins (40 µg)
were separated on 4-12% Bis-Tris gels (Invitrogen; Thermo Fisher
Scientific) and transferred to PVDF membranes. Western blot
analysis was performed using primary antibodies from Abcam as
follows: Rabbit anti-PAX2 (ab150391), fatty acid binding protein 4
(FABP4; ab92501), LIPA (ab219113), PNLIP (ab198181), ACAA2
(ab237540) at a 1:1,000 dilution and the secondary antibody
reagent, anti-rabbit DAKO EnVision-system-HRP solution (cat. no.
K4002, Dako Cytomation). Immuno-reactive bands were visualized
using an ECL western blotting detection reagent (GE Healthcare) and
the Syngene Bio-Imaging System program (PerkinElmer).
Kaplan-Meier plotter
The online meta-analysis tool 'The Kaplan Meier
plotter' (http://kmplot.com/analysis/, accessed
22 December 2018) was used to assess the effects of gene expression
on survival using data for 1,001 patients with stage III-IV serous
ovarian cancer. The cut-off value for high or low expression was
automatically determined by the Kaplan Meier plotter. The follow-up
threshold was set at 60 months. The GEO datasets and TCGA datasets,
as well as the bioinformatics processing used by this online tool
were previously described (13,14).
Biased assays and assays with a false discovery rate (FDR) of
>20% were excluded.
Statistical analyses
On the basis of the number of conditions tested,
statistical significance was determined by the t-test, ANOVA
(Tukey's post-test), or log-rank test (Kaplan-Meier), performed
using GraphPad Prism software (GraphPad Software, Inc.) or SPSS20.0
(IBM).
Results
PAX2 promotes cell proliferation in
vitro
Previously, the expression of PAX2 in the RM model
of ovarian cancer was shown to enhance cell proliferation (5). The expression of PAX2 in the RM-PAX2
cell line was shown in a previous study [please see Fig. 4A in the study by Alhujaily et
al (5)]. In this study, the
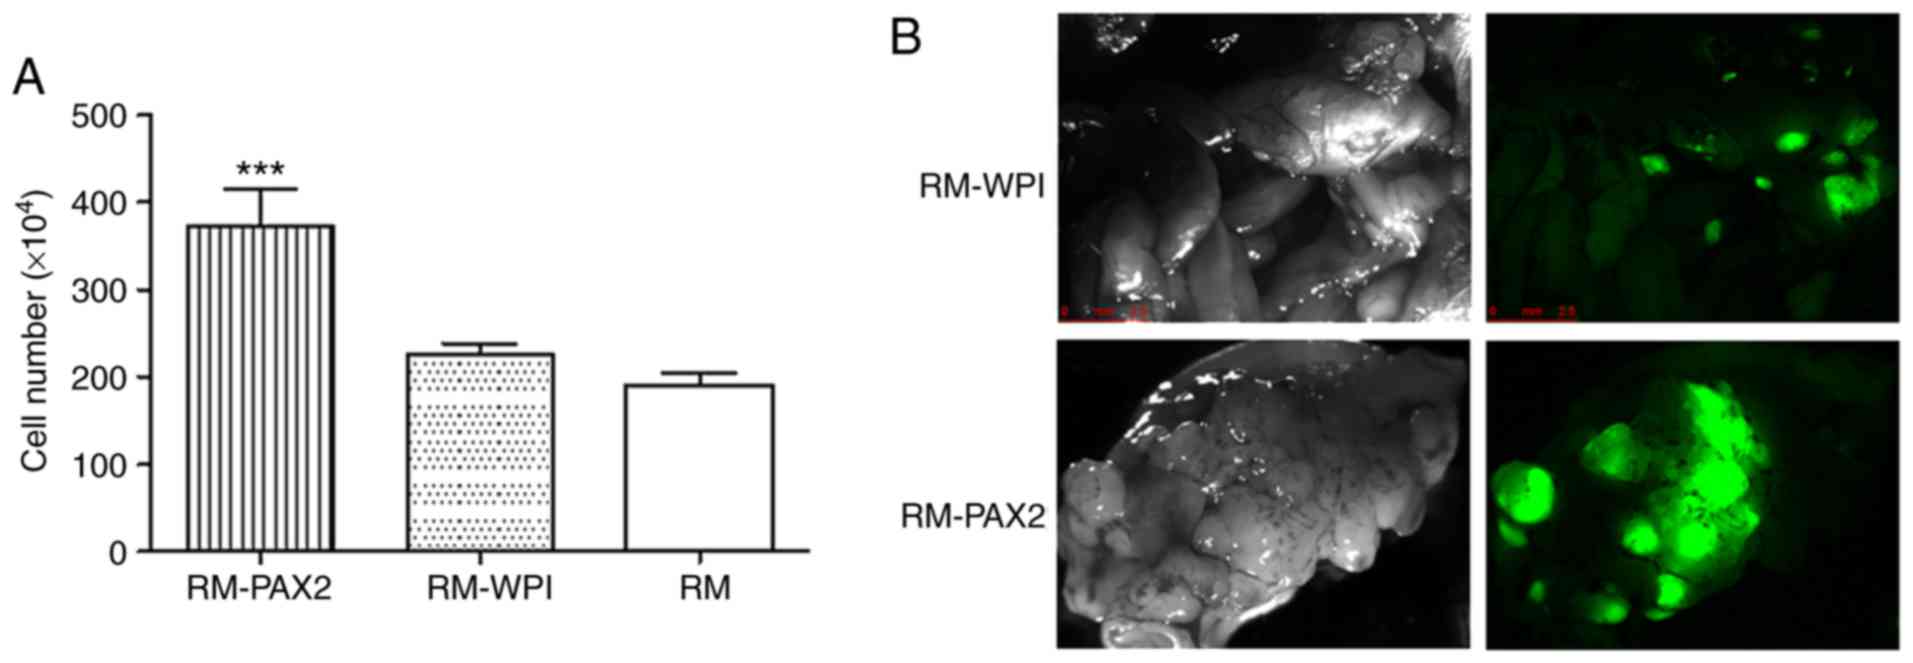
cell proliferation assay confirmed that PAX2 expression led to an
enhanced proliferation (Fig.
1A).
PAX2 enhances tumorigenesis in vivo
To confirm the effects of PAX2 on tumorigenesis
in vivo, the RM-WPI and RM-PAX2 cells were injected
intraperitoneally into SCID mice. As observed under a fluorescence
microscope, both RM-WPI and RM-PAX2 cells formed tumors. Compared
to the RM-WPI cells, the RM-PAX2 cells seemed to form larger tumors
and spread throughout the peritoneum, to the pancreas, liver,
intestine, diaphragm, uterus and ovaries (Fig. 1B). As has been previously
demonstrated (5), the survival
time was markedly decreased in SCID mice injected with RM-PAX2
cells compared to those injected with RM-WPI cells [median
survival, 11 vs. 16 days; please see Fig. 4E in the study by Alhujaily et
al (5)].
PAX2 overexpression is associated with a
poor prognosis of patients with ovarian cancer
Although the role of PAX2 in tumorigenesis remains
undetermined, its expression was found to increase the tumor burden
and shorten the survival of mice injected with RM cells. This
result led us to investigate its role in ovarian cancer
progression. First, a cohort of 152 epithelial ovarian cancer cases
was identified. The patients were separated into the PAX2-positive
(PAX2+, including both weak and strong expression) and
PAX2-negative (PAX2-) groups according to the expression
of PAX2 examined by immunohistochemistry (Fig. 2A). In agreement with the findings
of this study on the RM model, the PFS of the PAX2+
patients was significantly reduced compared to that of the
PAX2- patients (median survival of 24.0 vs. 75.0 months;
Fig. 2B). Using the online
meta-analysis tool, The Kaplan Meier plotter revealed that a high
expression of PAX2 were associated with the shortened PFS of
patients with stage III-IV serous ovarian cancer (Total: 16.1 vs.
19.0 months; TP53 mutant subgroup: 17.3 vs. 19.0 months; TP53
wild-type subgroup: 14.8 vs. 33.3 months, all P<0.05, Fig. 2C).
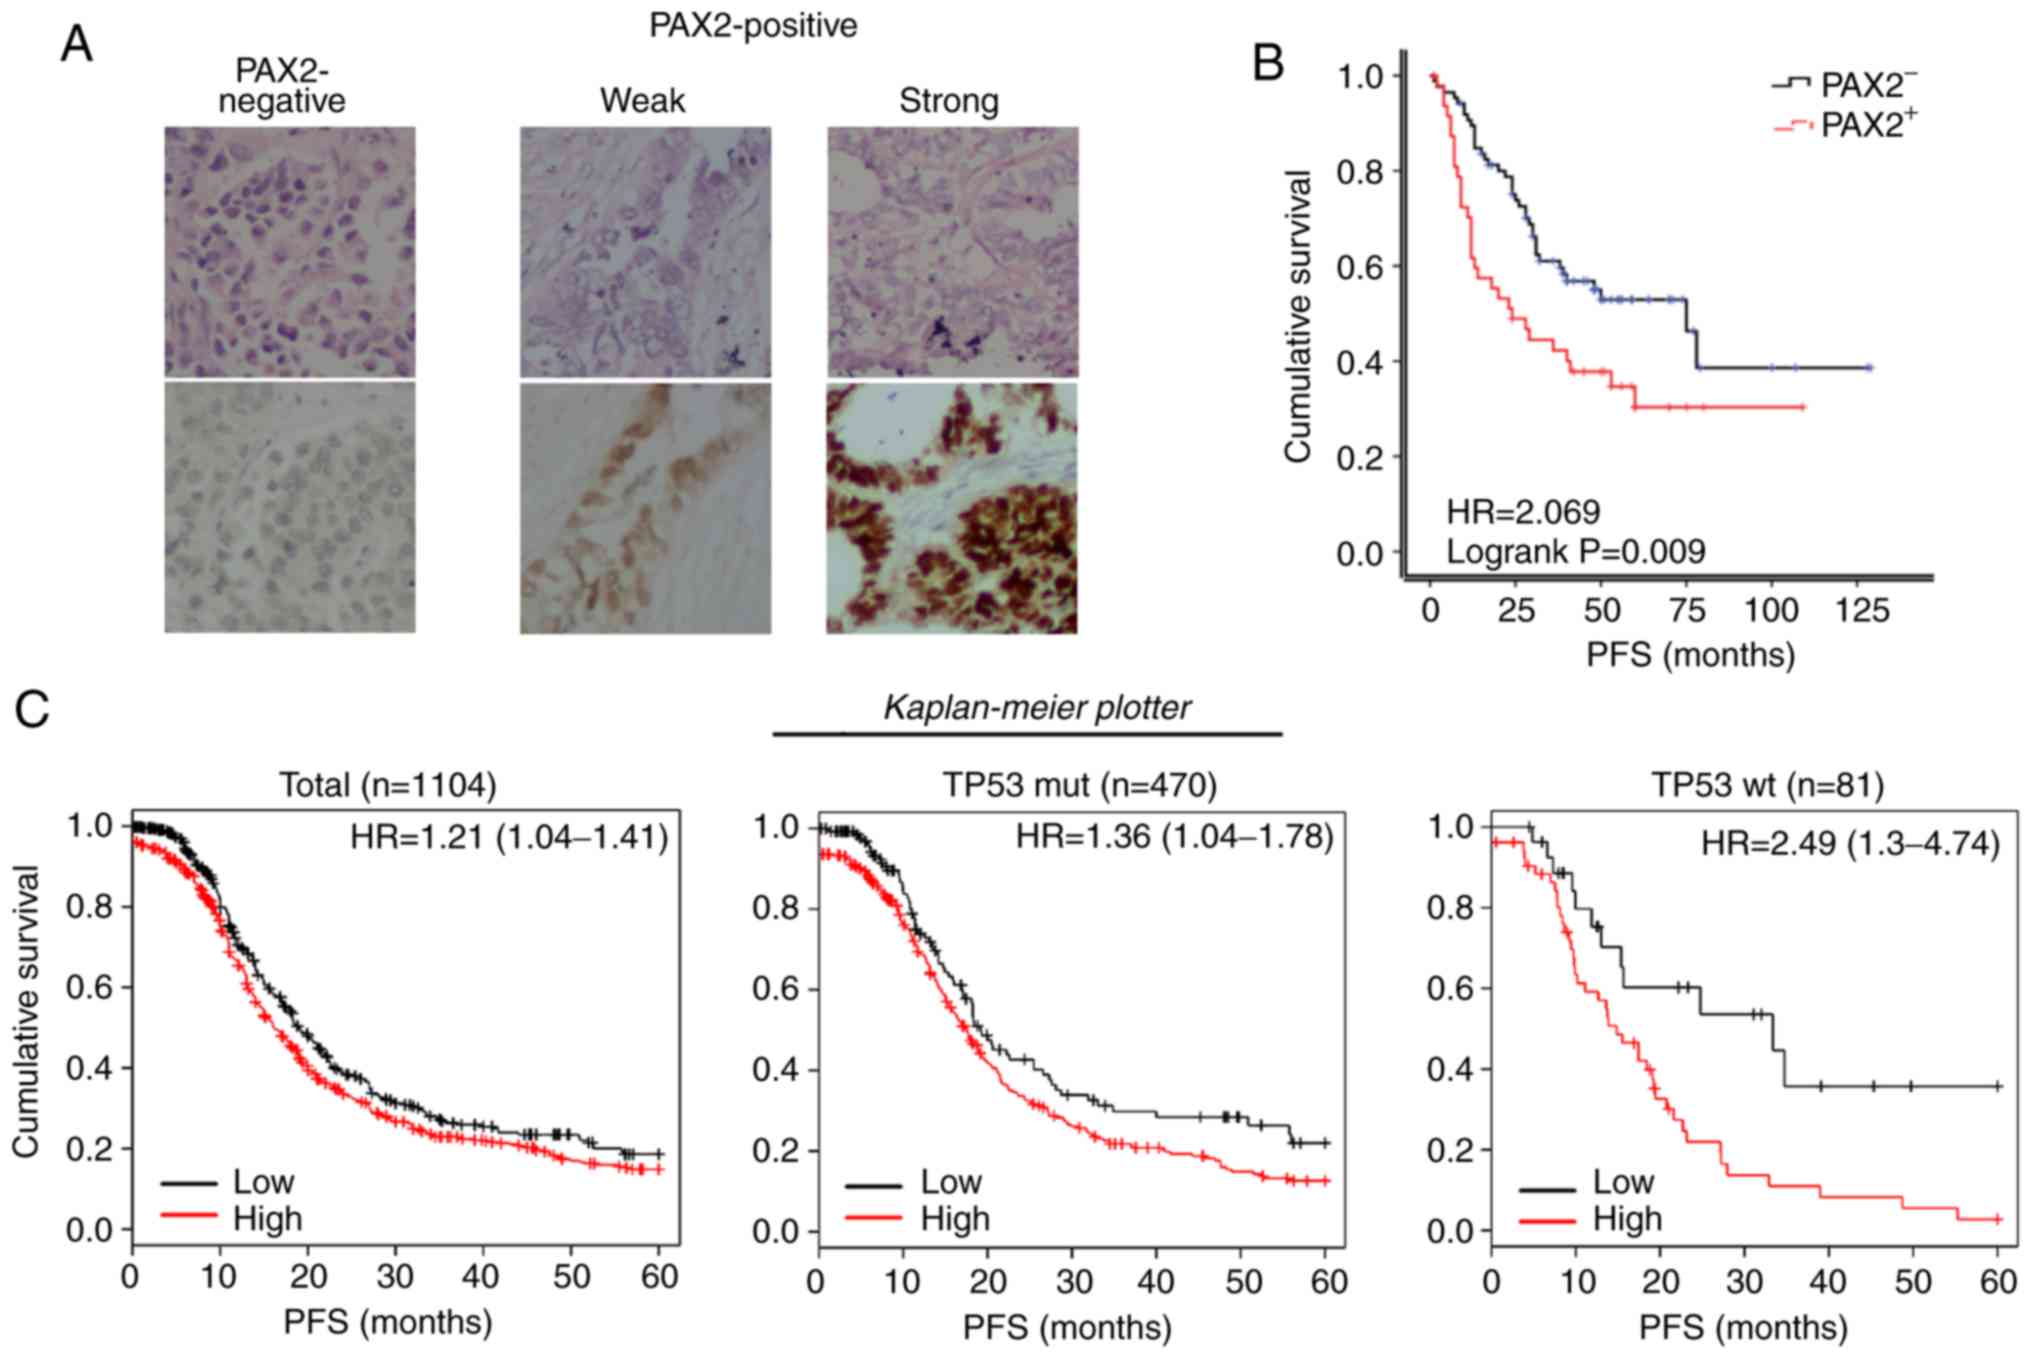 | Figure 2PAX2 overexpression is associated
with a poor prognosis of patients with ovarian cancer. (A) Typical
TMA samples of negative, weak and strong PAX2 expressions, examined
by immunohistochemistry. Top panels, H&E staining; bottom
panels, immunohistochemical staining of PAX2. (B) Kaplan-Meier
progression-free survival curves for patients with negative PAX2
expression (PAX2-) or positive PAX2 expression
(PAX2+) according to the results as shown in (A).
(PAX2-, n=48; PAX2+, n=105). (C) Kaplan-Meier
progression-free survival curves for 1,001 patients with stage
III-IV serous ovarian cancer with a high PAX2 expression
(PAX2+) or low PAX2 expression (PAX2−) using
'The Kaplan Meier plotter' (http://kmplot.com/analysis/, accessed December 22,
2018). Left panel, total; middle panel, TP53 mutant subgroup; right
panel, TP53 wild-type subgroup. PAX2, paired box 2. |
iTRAQ proteomics profiling of PAX2
overexpressing tumor tissues
To further elucidate the mechanisms through which
PAX2 affects ovarian cancer progression, iTRAQ proteomic technology
was exploited to identify differentially expressed proteins between
RM-PAX2 and RM-WPI tumors (Fig.
3A). The expression of PAX2 in these tissue samples was
confirmed by immunohistochemistry (Fig. 3B). In total 2,964 proteins were
identified from the mouse tumors, of which 2,016 proteins were
quantified. When setting quantification ratio thresholds of >1.2
as upregulated and <0.83 as downregulated, in a comparison of
protein expression in RM-PAX2 vs. RM tumors, 252 proteins were
upregulated and 122 proteins were downregulated (Fig. 3C and D).
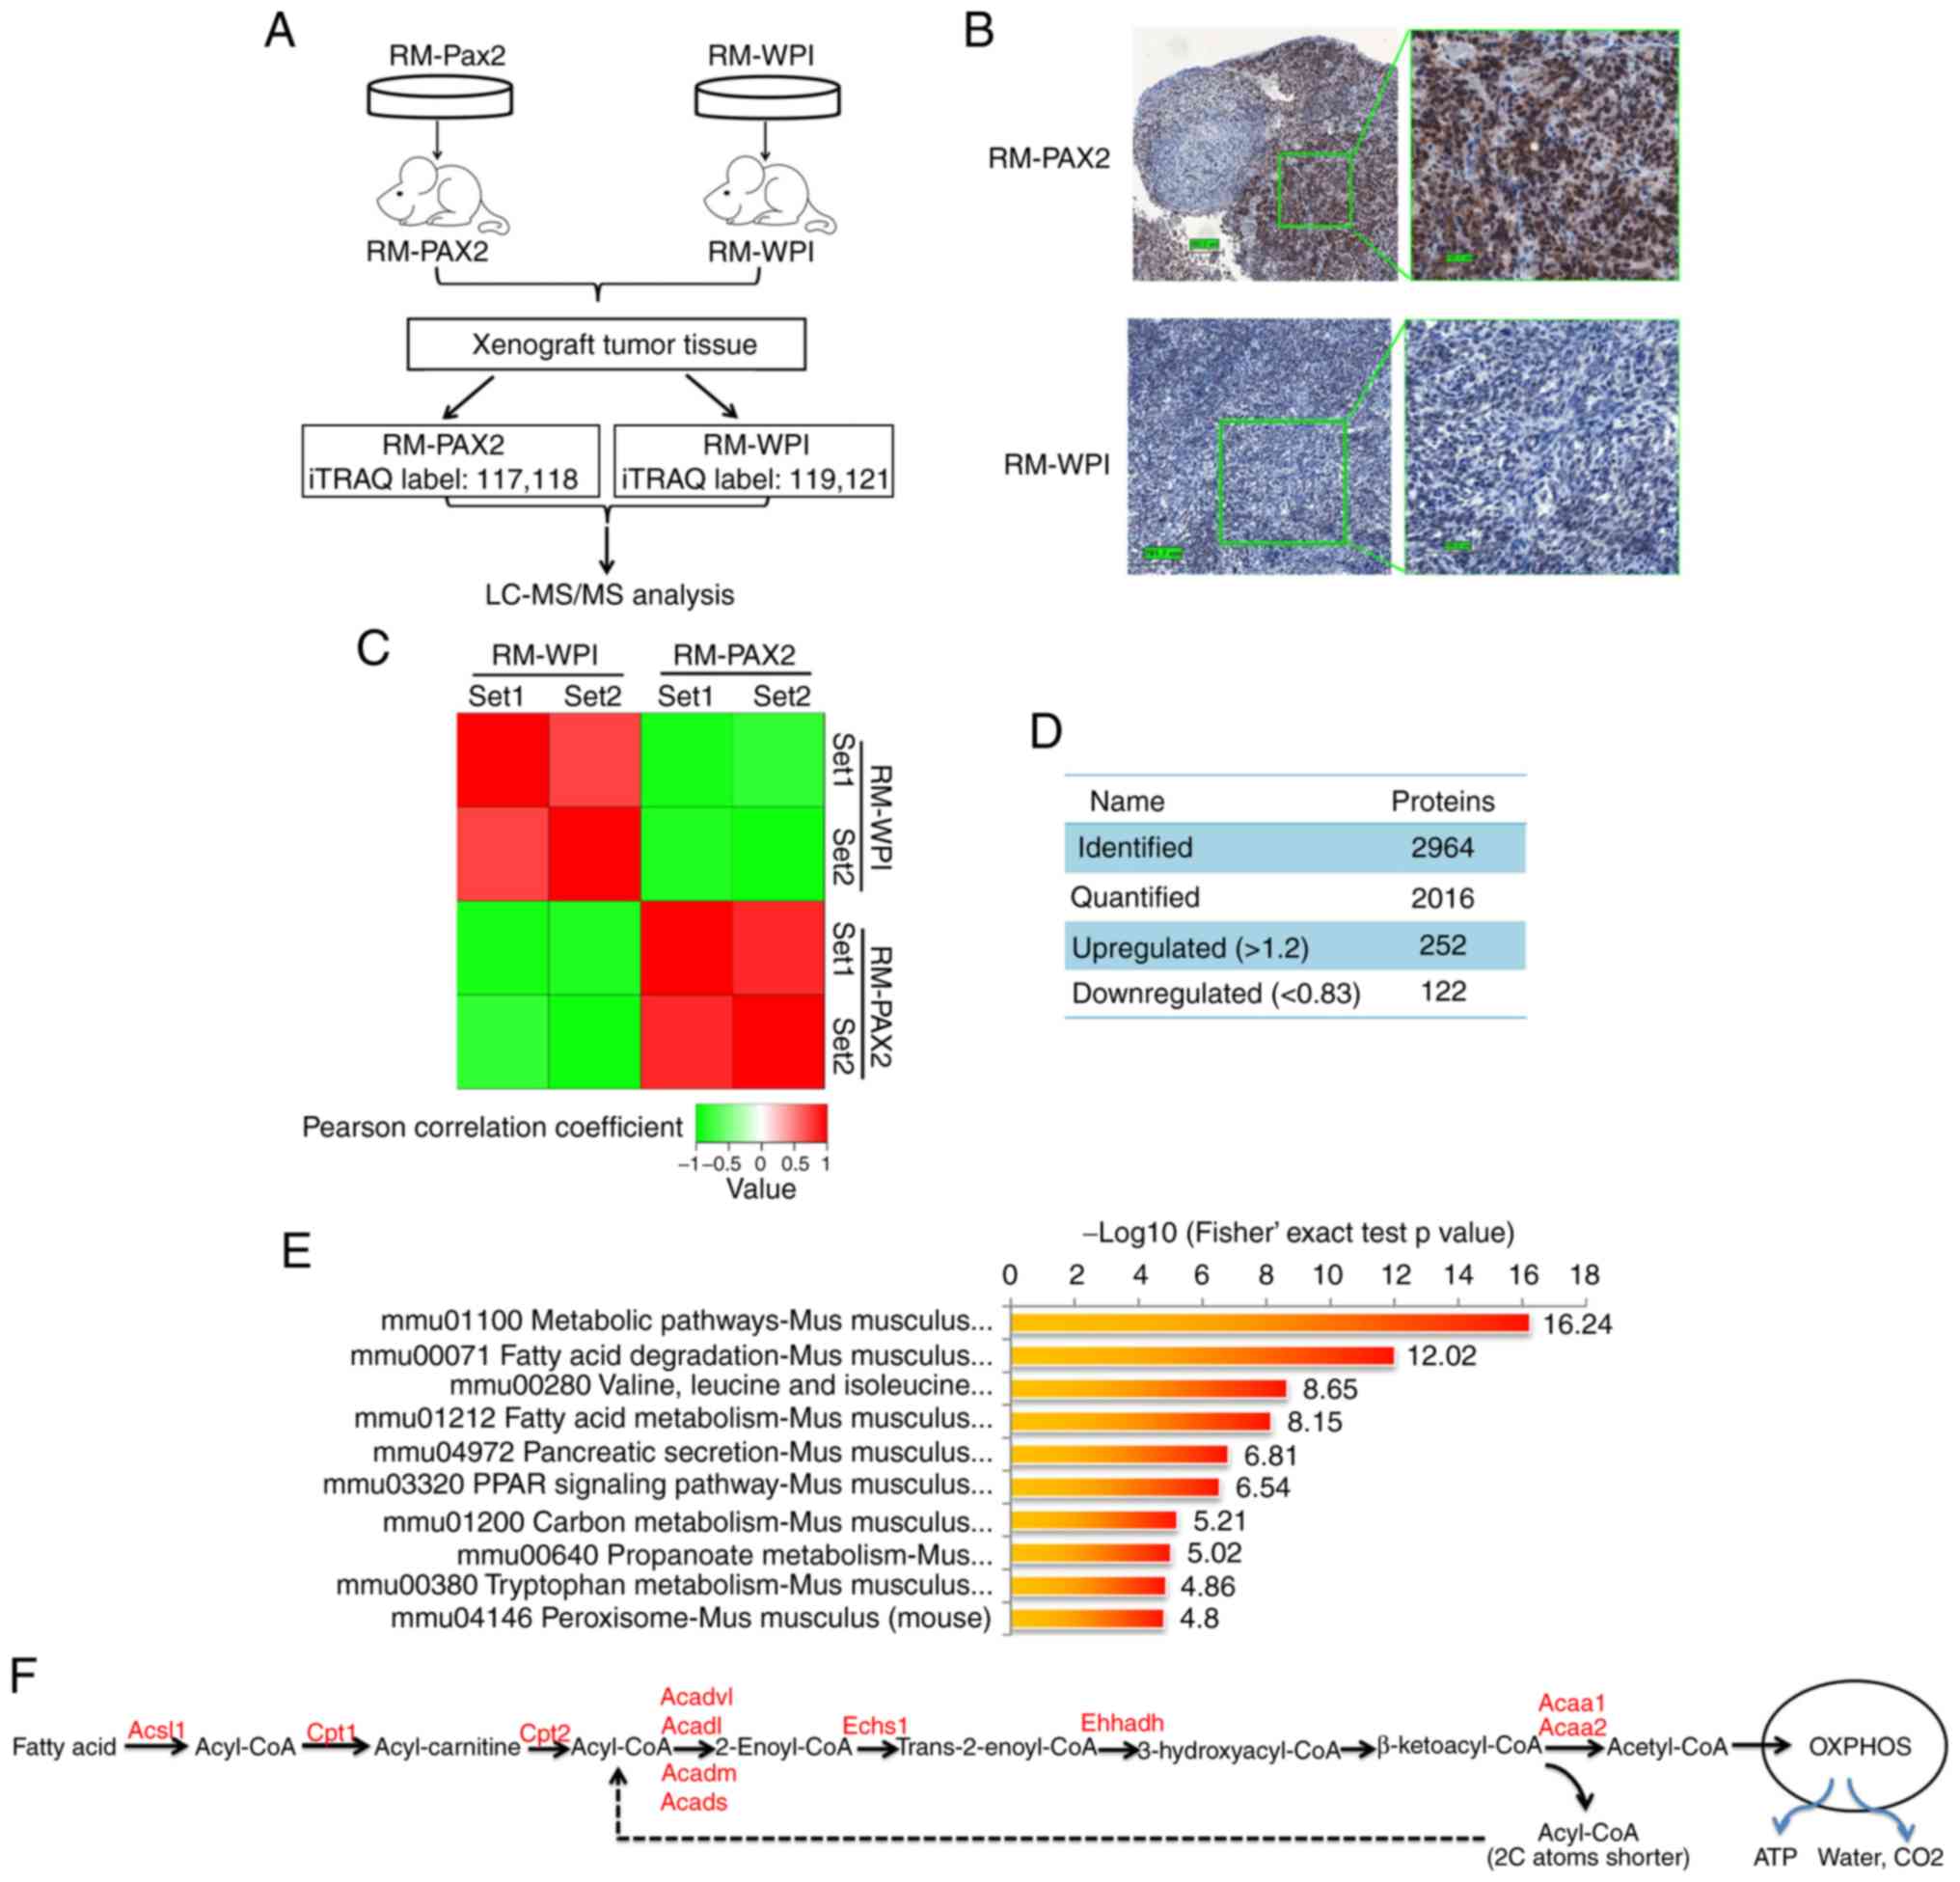 | Figure 3iTRAQ proteomics profiling of RM
tumors overexpressing PAX2. (A) An overview of the workflow
employed in this study. Two iTRAQ replicates were carried out to
ensure the consistency and reliability of the results. (B)
Expression of PAX2 in allograft RM tumors was confirmed by
immunohisto-chemistry. (C) Reproducibility analysis of 2 repeated
trials by Pearson's correlation coefficient. (D) Summary of
identified and quantified proteins. (E) KEGG pathway-based
enrichment analysis of up-regulated proteins (RM-PAX2 vs. RM-WPI).
(F) Fatty acid metabolism. Enzymes upregulated by PAX2
overex-pression are indicated in red color. PAX2, paired box 2;
Acsl, long-chain-fatty-acid-CoA ligase 1; Cpt1, carnitine
O-palmitoyltransferase 1; Cpt2, Carnitine O-palmitoyltransferase 2;
Acadl, long-chain specific acyl-CoA dehydrogenase, mitochondrial;
Acadvl, very long-chain specific acyl-CoA dehydrogenase,
mitochondrial; Acads, short-chain specific acyl-CoA dehydrogenase,
mitochondria; Acadm, medium-chain specific acyl-CoA dehydrogenase,
mitochondrial; Echs1, Enoyl-CoA hydratase; Ehhadh, peroxisomal
bifunctional enzyme; Acaa1, 3-ketoacyl-CoA thiolase A; Acaa2,
3-ketoacyl-CoA thiolase, mitochondrial. |
KEGG signaling pathway enrichment analysis revealed
that the top upregulated signaling pathways in RM-PAX2 xenograft
tumors were those that regulate cell metabolism, particularly fatty
acid metabolism (Fig. 3E and F).
The most downregulated signaling pathways were those that regulate
cell cycle, extracellular matrix receptor interaction and cell
junctions (data not shown).
PAX2 promotes fatty acid metabolic
reprogramming in RM cells and ovarian cancer tissues
The marked upregulation of cell metabolic pathways
suggests that PAX2 may promote the reprogramming of tumor cell
metabolism to support cell survival. Fatty acid catabolism involves
fatty acid activation, translocation to the mitochondria and
β-oxidation. In the cytoplasm, fatty acid is activated by Acyl-CoA
synthetase (Acsl), which catalyzes fatty acid into fatty
acyl-CoA (15). Subsequently,
fatty acyl-CoA is transferred into the mitochondria by carnitine
acyltransferase I (Cpt1) and carnitine acyltransferase II
(Cpt2). Cpt1 is the rate-limiting enzyme of fatty acid
metabolism. After fatty acyl-CoA enters the mitochondrial matrix,
it decomposes into acetyl-CoA catalyzed by a series of fatty acid
β-oxidases, including Echs1, Acads, Acadm, Acadl, Acadvl,
Acaa1 and Acaa2 (Fig.
3F). The acetyl-CoA finally enters the tricarboxylic acid cycle
and is completely degraded to water, CO2 and ATP through
oxidative phosphorylation by the mitochondrial respiratory chain
(Fig. 3F). In the
PAX2-overexpressing allograft tumor tissue, almost all enzymes
involved in fatty acid metabolism were significantly increased, as
shown in Fig. 3F and Table II (all P<0.05).
| Table IIDifferentially expressed proteins in
the fatty acid metabolism pathway identified by iTRAQ. |
Table II
Differentially expressed proteins in
the fatty acid metabolism pathway identified by iTRAQ.
| Process | Protein accession
no. | Gene | Protein
description | RM-PAX2/RM-WPI
ratio | Regulated type | P-value |
|---|
| Fatty acid
oxidation (FAO) | P32114 | Pax2 | Paired box protein
Pax-2 | 2.83 | Up | 0.024 |
| Q8BWT1 | Acaa2 | 3-ketoacyl-CoA
thiolase, mitochondrial | 2.06 | Up | 0.0101 |
| O35459 | Ech1 | Delta(3,5)-Delta(2,4)-dienoyl-CoA isomerase,
mitochondrial | 1.74 | Up | 0.0036 |
| Q9DBM2 | Ehhadh | Peroxisomal
bifunctional enzyme | 1.71 | Up | 0.0032 |
| Q61425 | Hadh |
Hydroxyacyl-coenzyme A dehydrogenase,
mitochondrial | 1.69 | Up | 0.0012 |
| Q8BH95 | Echs1 | Enoyl-CoA
hydratase, mitochondrial | 1.69 | Up | 0.0418 |
| P51174 | Acadl | Long-chain specific
acyl-CoA dehydrogenase, mitochondrial | 1.64 | Up | 0.0386 |
| Q921H8 | Acaa1a | 3-ketoacyl-CoA
thiolase A, peroxisomal | 1.57 | Up | 0.0249 |
| Q9R0H0 | Acox1 | Peroxisomal
acyl-coenzyme A oxidase 1 | 1.48 | Up | 0.0436 |
| P50544 | Acadvl | Very long-chain
specific acyl-CoA dehydrogenase, mitochondrial | 1.48 | Up | 0.0435 |
| Q07417 | Acads | Short-chain
specific acyl-CoA dehydrogenase, mitochondrial | 1.44 | Up | 0.0039 |
| P45952 | Acadm | Medium-chain
specific acyl-CoA dehydrogenase, mitochondrial | 1.35 | Up | 0.0346 |
| O08756 |
Hsd17b10 | 3-hydroxyacyl-CoA
dehydrogenase type-2 | 1.27 | Up | 0.0096 |
| Fatty acid
activation | P41216 | Acsl1 |
Long-chain-fatty-acid-CoA ligase 1 | 2.25 | Up | 0.0093 |
| Q8JZR0 | Acsl5 |
Long-chain-fatty-acid-CoA ligase 5 | 1.39 | Up | 0.0496 |
| P97742 | Cpt1a | Carnitine
O-palmitoyltransferase 1, liver isoform | 1.59 | Up | 0.0006 |
| P52825 | Cpt2 | Carnitine
O-palmitoyltransferase 2, mitochondrial | 1.31 | Up | 0.0469 |
| Fatty acid
absorption | Q6P8U6 | Pnlip | Pancreatic
triacylglycerol lipase | 2.35 | Up | 0.0272 |
| Q5BKQ4 |
Pnliprp1 | Inactive pancreatic
lipase-related protein 1 | 5.25 | Up | 0.0058 |
| P17892 |
Pnliprp2 | Pancreatic
lipase-related protein 2 | 2.47 | Up | 0.0419 |
| P12710 | Fabp1 | Fatty acid-binding
protein, liver | 2.91 | Up | 0.0393 |
| P04117 | Fabp4 | Fatty acid-binding
protein, adipocyte | 2.31 | Up | 0.0157 |
| Fatty acid
synthesis | P19096 | Fasn | Fatty acid
synthase | 0.98 | - | 0.4045 |
The above-mentioned results suggested that PAX2
promoted fatty acid metabolism in RM tumors; however, it is unclear
whether fatty acid substrates arose through de novo
synthesis or by uptake from surrounding adipocytes. Lipases and
fatty acid-binding proteins (FABPs) are required for transferring
lipids from adipocytes to cancer cells (16). In RM-PAX2 tumors, Pnlip,
inactive pancreatic lipase-related protein 1 (Pnliprp1) and
pancreatic lipase-related protein 2 (Pnliprp2) were elevated
2.35, 5.45 and 2.47-fold. Murine homologues of FABPs, Fabp1
and Fabp4 were also increased by 2.31- and 2.91-fold,
respectively (Table II).
Moreover, the expression of fatty acid synthase (Fasn), a
key enzyme for fatty acid synthesis, was not altered (Table II).
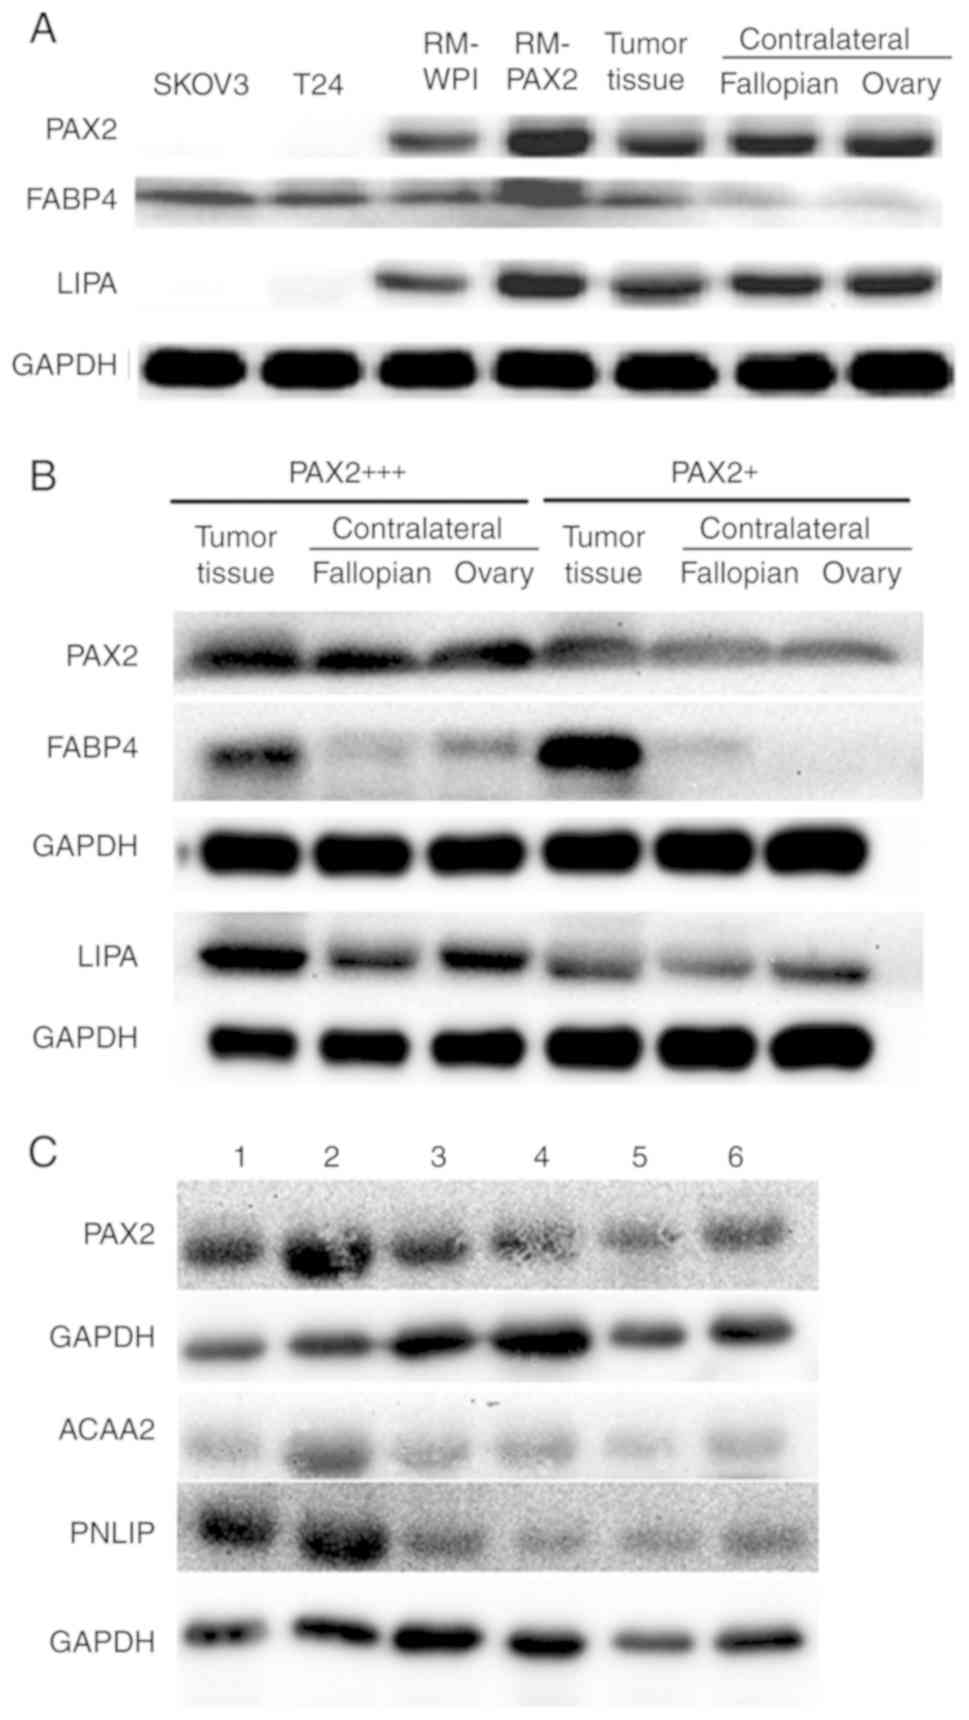
To confirm the fatty acid metabolic reprogramming
discovered by iTRAQ analysis, the expression of FABP4 and a lipase
(LIPA) was analyzed in tumor tissue from both the murine RM-PAX2
model and patients with ovarian cancer. The FABP4 and LIPA
expression levels were upregulated in the RM-PAX2 tumor tissue
compared to the RM-WPI tissue (Fig.
4A). In accordance with the murine model, the expression of
FABP4 and LIPA was higher in the ovarian tumors exhibiting a strong
PAX2 expression (PAX2+++) when compared to the tumors
with a weak PAX2 expression (PAX2+) (Fig. 4B). While FABP4 was expressed at
higher levels in tumors expressing high levels of PAX2, FABP4 was
also upregulated in the PAX2-low expressing tumors when compared to
the normal contralateral fallopian and ovary tissues (Fig. 4A and B). This indicates that even
low levels of PAX2 may be sufficient to induce the expression of
FABP4, or perhaps other factors in the tumor, in addition to PAX2,
leads to the upregulation of FABP4.
The expression of PNLIP and ACAA2 was further
examined in tumor tissues of 6 patients with serous ovarian cancer
with varying levels of PAX2. The expression of PNLIP and ACAA
seemed to increase along with that of PAX2 (Fig. 4C). However, when assessing the
potential correlation of PAX2, PNLIP and ACAA2 expression in the
TMA cohort in this study, Spearman's correlation coefficients among
PAX2, PNLIP and ACAA2 were not found to be significant (data not
shown). The expression levels of PAX2, PNLIP and ACAA2 in the TMA
cohort were determined by immunohistochemistry, as indicated in the
Material and methods section.
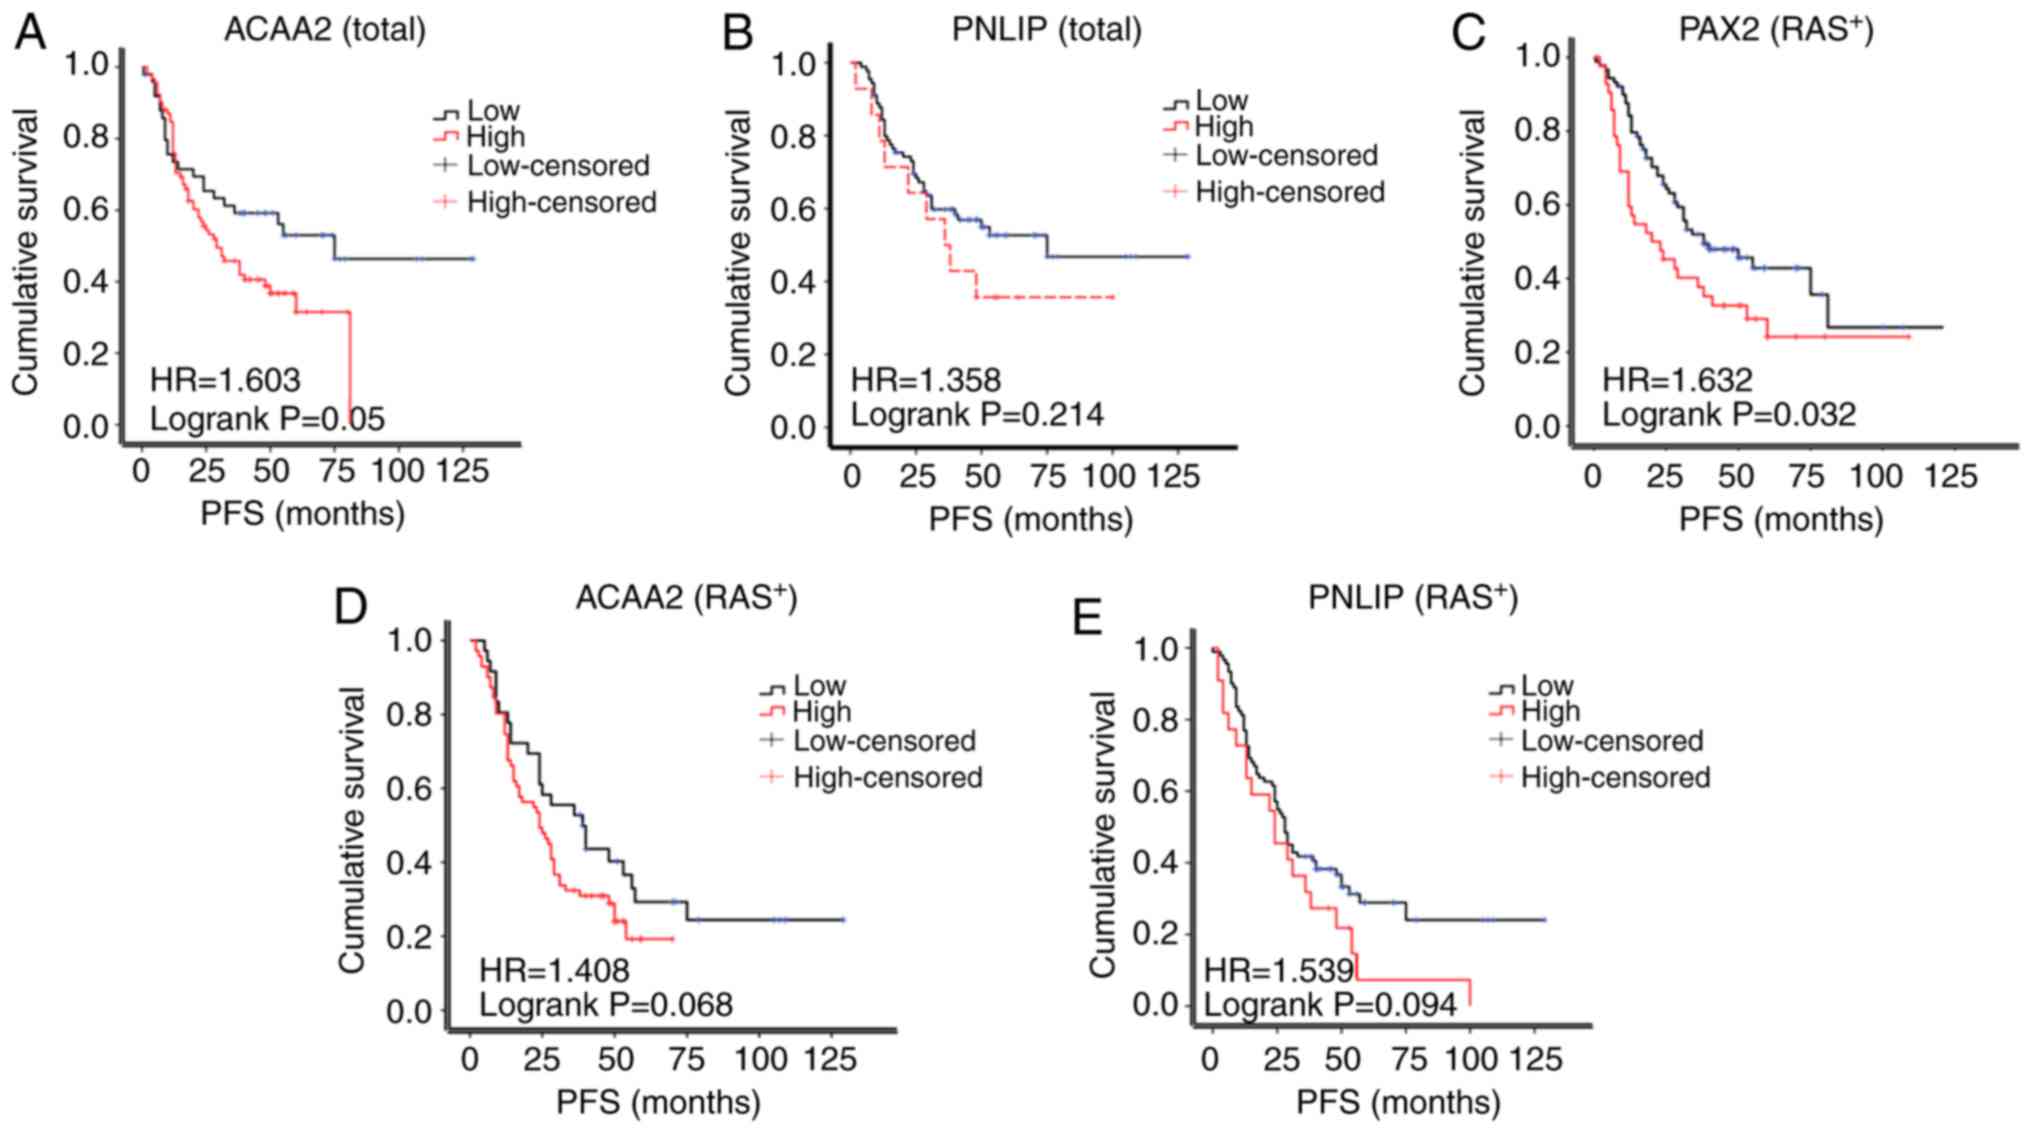
Based on the results of IHC, the patients were
separated into the high or low expression subgroups. The PFS of
ACAA2 in patients with a high expression was reduced compared to
those with a low ACAA2 expression patients (median survival of 29.0
vs. 75.0 months; Fig. 5A). The PFS
of patients with a high PNLIP expression also exhibited a trend of
a reduced PFS compared to those with a low PNLIP expression (median
survival of 38.0 vs. 48.0 months, Fig.
5B), although the differences were not statistically
significant.
The amplification of RAS signaling was common in
epithelial ovarian cancer, but not the KRAS mutation which was used
in the RM model in this study. Thus, the expression of RAS was
further assessed in the TMA cohort in this study. As a result, 132
cases were RAS-positive, while only 20 was RAS-negative (Table I). In the RAS-positive subgroup,
the PAX2+ patients exhibited a significantly shorter PFS
compared with the PAX2- patients (median survival of
20.0 vs. 38.0 months, Fig. 5C). A
high expression of ACAA2 or PNLIP in patients was also associated
with a reduced PFS, although this was not statistically significant
(29.0 vs. 56.0 months, 36.0 vs. 53.0 months, respectively, Fig. 5D and E). The RAS-negative subgroup
was not analyzed due to the small sample size (n=20).
PAX2 upregulates OXPHOS but not
glycolysis in RM cells
The dependency of cancer cells on glycolysis, also
known as the Warburg effect, was once recognized as the most
outstanding feature of tumor cell metabolism (17) and was considered an essential
property of most tumor cells, including ovarian cancer (18). It has been shown more recently that
enhanced mitochondrial oxidative phosphorylation (OXPHOS) also
plays an important role in ovarian cancer (19). In this study, proteomics analysis
revealed that a key enzyme for glycolysis, pyruvate kinase
(Pkm) was downregulated by PAX2. Other enzymes involved in
glycolysis and Glut1, the enzyme responsible for glucose uptake,
were not significantly altered (Table III). By contrast, proteins
participating in the OXPHOS pathway and components of mitochondrial
electron transport chain were all significantly upregulated
(Table III) in PAX2-expressing
tumor tissues.
| Table IIIDifferentially expressed proteins in
glycolysis and mitochondrial oxidative phosphorylation identified
by iTRAQ. |
Table III
Differentially expressed proteins in
glycolysis and mitochondrial oxidative phosphorylation identified
by iTRAQ.
| Process | Protein accession
no. | Gene | Protein
description | RM-PAX2 RM-WPI
ratio | Regulated type | P-value |
|---|
| Glycolysis | P17809 | Slc2a1, Glut-1,
Glut1 | Solute carrier
family 2, facilitated glucose transporter member 1 | 0.86 | - | 0.3308 |
| P17710 | Hk1 | Hexokinase-1 | 0.91 | - | 0.1620 |
| O08528 | Hk2 | Hexokinase-2 | 0.83 | - | 0.2196 |
| Q3TRM8 | Hk3 | Hexokinase-3 | NA | NA | NA |
| Q8VDL4 | Adpgk | ADP-dependent
glucokinase | 0.87 | - | 0.2782 |
| P06745 | Gpi | Glucose-6-phosphate
isomerase | 1.05 | - | 0.2221 |
| P12382 | Pfkl | ATP-dependent
6-phosphofructokinase, liver type | 0.77 | - | 0.2985 |
| P47857 | Pfkm | ATP-dependent
6-phosphofructokinase, muscle type | 0.73 | - | 0.1779 |
| Q9WUA3 | Pfkp | ATP-dependent
6-phosphofructokinase, platelet type | 1.15 | - | 0.1916 |
| P05063 | Aldoc |
Fructose-bisphosphate aldolase C | 0.71 | - | 0.0788 |
| P05064 | Aldoa |
Fructose-bisphosphate aldolase A | 0.85 | - | 0.2419 |
| P17751 | Tpi1 | Triosephosphate
isomerase | 0.83 | - | 0.0141 |
| P17182 | Eno1 | α-enolase | 0.79 | - | 0.1339 |
| P21550 | Eno3 | β-enolase | 0.95 | - | 0.4925 |
| P09411 | Pgk1 | Phosphoglycerate
kinase 1 | 0.97 | - | 0.8095 |
| P09041 | Pgk2 | Phosphoglycerate
kinase 2 | 0.99 | - | 0.9302 |
| Q9DBJ1 | Pgam1 | Phosphoglycerate
mutase 1 | 0.87 | - | 0.0648 |
| P52480 | Pkm | Pyruvate kinase
PKM | 0.77 | Down | 0.0236 |
| Mitochondrial
electron transport chain | Q8CIM7 | Cyp2d26 | Cytochrome P450
2D26 | 2.44 | Up | 0.0004 |
| Q64459 | Cyp3a11 | Cytochrome P450
3A11 | 2.20 | Up | 0.0498 |
| P56395 | Cyb5a | Cytochrome b5 | 1.93 | Up | 0.0278 |
| P48771 | Cox7a2 | Cytochrome c
oxidase subunit 7A2, mitochondrial | 1.31 | Up | 0.0175 |
| Q91VR2 | Atp5f1c | ATP synthase
subunit gamma, mitochondrial | 1.29 | Up | 0.0224 |
| Q61941 | Nnt | NAD(P)
transhydrogenase, mitochondrial | 1.26 | Up | 0.0099 |
| Q99LC3 | Ndufa10 | NADH dehydrogenase
[ubiquinone] 1 alpha subcomplex subunit 10, mitochondrial | 1.26 | Up | 0.0453 |
| Q9D855 | Uqcrb | Cytochrome b-c1
complex subunit 7 | 1.25 | Up | 0.0130 |
| P19783 | Cox4i1 | Cytochrome c
oxidase subunit 4 isoform 1, mitochondrial | 1.23 | Up | 0.0107 |
| Q9Z1P6 | Ndufa7 | NADH dehydrogenase
[ubiquinone] 1α subcomplex subunit 7 | 1.25 | Up | 0.0396 |
| Tricarboxylic acid
cycle | Q9CZU6 | Cs | Citrate synthase,
mitochondrial | 1.14 | - | 0.1691 |
| Q9WUM5 | Suclg1 | Succinyl-CoA ligase
[ADP/GDP-forming] subunit α, mitochondrial | 1.55 | Up | 0.0112 |
| Q8K2B3 | Sdha | Succinate
dehydrogenase [ubiquinone] flavoprotein subunit, mitochondrial | 1.23 | Up | 0.0374 |
| P97807 | Fh, Fh1 | Fumarate hydratase,
mitochondrial | 1.21 | - | 0.0524 |
Glutamate is also an important energy source for
OXPHOS (20). Glutamate is
transferred into cells primarily through the amino acid transporter
(Slc1a5), but its expression was not affected by PAX2
(Table IV). Glutamate can also be
generated through the degradation of amino acids. Given that the
valine, leucine and isoleucine degeneration pathway was found to be
significantly upregulated (Fig.
3E) and enzymes responsible for glutamate synthesis [alanine
aminotransferase (Gpt), glutamate dehydrogenase
(Glud1) and glutaryl-CoA dehydrogenase (Gcdh)] were
increased (Table IV), it is
possible that PAX2 also altered cellular glutamate metabolism.
| Table IVDifferentially expressed proteins in
glutamate metabolism identified by iTRAQ. |
Table IV
Differentially expressed proteins in
glutamate metabolism identified by iTRAQ.
| Protein accession
no. | Gene | Protein
description | RM-PAX2/RM-WPI
ratio | Regulated type | P-value |
|---|
| Q60759 | Gcdh | Glutaryl-CoA
dehydrogenase, mitochondrial | 1.96 | Up | 0.0477 |
| P26443 | Glud1 | Glutamate
dehydrogenase 1, mitochondrial | 1.91 | Up | 0.0376 |
| Q8QZR5 | Gpt | Alanine
aminotransferase 1 | 1.91 | Up | 0.0204 |
| P51912 | Slc1a5 Aaat,
Asct2, Slc1a7 | Neutral amino acid
transporter B(0) | 1.00 | - | 0.8484 |
Enhanced fatty acid catabolism pathway is
associated with a poor prognosis of patients with ovarian
cancer
As the high expression of PAX2 and ACAA2 shortened
the PFS of patients with ovarian cancer (Figs. 2B and 5C), whether the upregulation of fatty
acid metabolism is also associated with a shorter PFS was then
determined. All genes listed in Table
II were analyzed. The results of the Kaplan-Meier plotter
analysis clearly revealed that a high expression of FABP4 and ACAA2
were associated with the shortened PFS of patients with serous
ovarian cancer (Table V); this was
observed in all patients regardless of the TP53 status.
| Table VAssociation of enzymes of fatty acid
catabolism with the duration of the progression-free survival of
patients with serous ovarian cancer. |
Table V
Association of enzymes of fatty acid
catabolism with the duration of the progression-free survival of
patients with serous ovarian cancer.
| Gene | Probe | Expression | Number | PFS (months) | P-value | FDR (%) |
|---|
| FABP4 | 203980_at | Low | 568 | 19 | 2.40E-06 | 1 |
| High | 433 | 13.17 | | |
| ACAA2 | 202003_s_at | Low | 617 | 18.07 | 0.0011 | 20 |
| High | 384 | 14 | | |
| ACADVL | 200710_at | Low | 739 | 17.6 | 0.00045 | 20 |
| High | 262 | 14 | | |
Discussion
In this study and as previously demonstrated
(8), it was found that Pax2
gene expression enhanced the growth of tumors in a model of murine
ovarian cancer both in vitro and in vivo. PAX2
expression in RM tumors reduced the length of survival of SCID
mice. Proteomics analysis was then performed to define the possible
mechanisms through which PAX2 accelerates ovarian tumor
progression. The analysis of the proteome in RM-PAX2 tumors
indicated that PAX2 promoted fatty acid metabolism in this murine
model and this finding was extended to human ovarian carcinomas.
Upregulated fatty acid metabolism may contribute to the shortened
PFS of patients with serous ovarian cancer (Fig. 5 and Table V). These results highlight a novel
mechanism through which PAX2 expression may promote ovarian cancer
progression.
PAX2 is a specific Müllerian marker for ovarian
serous carcinomas (21). In
vivo, PAX2 has been shown to exhibit an oncogenic behavior, as
the silencing PAX2 of has been shown to result in decreased tumor
volume or enhanced cisplatin-induced tumor regression in xenograft
models of human endometrioid, colon and renal carcinoma cells
(10-12). However, the effects of PAX2
expression on ovarian cancer prognosis remain unclear. A previous
study reported that PAX2 overexpression decreased the survival of
SCID mice (5). In this study, a
shortened PFS was associated with higher levels of PAX2 expression
(Fig. 2) in a cohort of patients
with serous ovarian cancer.
Previous research has suggested that glycolysis is
an important driver of ovarian cancer and inhibitors of glycolysis,
such as 2-deoxy-glucose would benefit ovarian cancer patients
(22). However, there is
accumulating evidence to indicate that ovarian cancer cells exhibit
an altered metabolic phenotype during progression (23). Metabolome studies have revealed
that metabolites involved in fatty acid metabolism are increased in
both primary ovarian tumors and their metastases (24). Abnormal phospholipid metabolism,
altered l-tryptophan catabolism, aggressive fatty acid β-oxidation
and the aberrant metabolism of piperidine derivatives have also
been reported in patients with epithelial ovarian cancer (25). In this study, it was found that the
expression of PAX2 significantly upregulated the expression of
enzymes involved in fatty acid metabolism, the mitochondrial OXPHOS
pathway and components of the mitochondrial electron transfer
chains (Figs. 3 and 4, and Table
II). This would be predicted to promote the use of fatty acid
as an energy source, depending on mitochondrial OXPHOS to produce
ATP.
In addition to accelerating tumor growth, thereby
shortening PFS, remodeled fatty acid metabolism and enhanced OXPHOS
may contribute to resistance to platinum-based chemotherapy. For
example, higher basal content of intracellular mobile lipids and
higher lipid accumulation within cytoplasmic droplets have been
observed in a cisplatin-resistant ovarian cell line (26). Furthermore, the inhibition of fatty
acid synthase has been found to render ovarian cancer cells more
sensitive to cisplatin (27). The
metabolic profile of cancer stem cells isolated from patients with
epithelial ovarian cancer has been shown to be dominated by OXPHOS,
and the overexpression of genes associated with glucose uptake,
OXPHOS and fatty acid beta-oxidation. This OXPHOS profile was
maintained in models of glucose deprivation both in vitro
and in vivo and may be responsible for the resistance to
anti-angiogenic therapies (28). A
previous study found that PAX2 enhanced resistance to cisplatin and
increased prostaglandin G/H synthase 2 (PTGS2 and COX2) in RM cells
(5). The association between COX2
expression and fatty acid metabolism in ovarian cancers is unclear,
although COX2 has been implicated in chemoresistance in ovarian
cancers (29,30). Thus, fatty acid metabolic
reprogramming induced by PAX2 may partly explain the enhanced
resistance to platinum-based therapy and may lead to the more rapid
recurrence of disease in patients with high levels of PAX2
expression.
Ovarian cancer has a clear predilection for
metastasis to the omentum. Previous studies have revealed that
primary human omental adipocytes promote the homing, migration and
invasion of ovarian cancer cells. The co-culture of omental
adipocytes and ovarian cancer cells may induce lipolysis in
adipocytes followed by uptake and beta-oxidation of the fatty acids
in the cancer cells (16). In this
manner, adipocytes may provide an energy source for the cancer
cells. FABP4 expression has been detected in ovarian cancer cells
at the adipocyte-tumor cell interface and may facilitate the
transfer of lipids from adipocytes to ovarian cancer cells
(16). RM-PAX2 cells formed larger
tumors in the omentum and mesenteric adipose tissue, tissues that
are rich of adipocytes (31). This
study demonstrated a marked increase in the expression of several
lipases and FABP4 in the RM-PAX2 tumors (Table II and Fig. 4A). In addition, FABP4 expression
was associated with increased PAX2 expression in tissues from
serous ovarian cancer patients (Fig.
4A and B). As RM-PAX2 cells formed larger tumors in the omentum
and mesenteric adipose tissue, and those tissues were composed
mostly of adipocytes, it is suggested that PAX2 enhances pathways
that facilitate the uptake of fatty acids from surrounding
adipocytes to promote their proliferation in the omentum. Further
in vitro and in vivo research is required to confirm
this mechanism.
Glutamate is another important substrate for
oxidative phosphorylation in tumor cells with OXPHOS activity. A
higher expression of glutamine synthetase in ovarian cancer
patients has been shown to be associated with a worse disease-free
and overall survival (32).
Glutamate metabolic programming has been reported to play a role in
the metastasis of many tumors (17). In this study, while enzymes
responsible for glutamate uptake did not increase with the
increased expression of PAX2 (Table
IV), some enzymes in glutamate metabolism were up-regulated by
PAX2 (Table IV). One function of
glutamate metabolism is to maintain the redox status by regulating
the intracellular glutathione (GSH) level in cells (33,34).
The increased expression of the catalytic subunit of
γ-glutamylcysteine ligase and the total GSH content has previously
been implicated in doxorubicin resistance in ovarian cancer
(33). In addition, glutamine,
which serves as the precursor of glutamate, has been shown to
increase the activity of glutaminase and glutamate dehydrogenase
and to promote the proliferation of several ovarian cancer cell
lines (34). This evidence
suggests that PAX2-induced changes in the glutamate metabolism
pathway can also influence cell proliferation or chemoresistance by
affecting the intracellular redox status.
Based on the results of this study, PAX2 may be a
marker which can be used to identify individuals who will benefit
from treatment targeting fatty acid metabolism or OXPHOS.
Currently, certain drugs have exhibited potential. For example,
orlistat decreases tumor fatty acid metabolism by inhibiting fatty
acid synthase, and combined treatment with orlistat and cisplatin
enhances apoptotic and necrotic cell death in cisplatin-resistant
ovarian cancer cells (35).
Statins, a drug widely used to prevent and treat
hypercholesterolemia, which blocks cholesterol synthesis, can
prevent the development of ovarian cancer (36). Metformin inhibits mitochondrial
OXPHOS and can also reverse cisplatin resistance in ovarian cancer
cells (37). In addition,
therapeutic siRNA delivery targeting mouse endothelial FABP4 has
been shown to markedly inhibit the angiogenesis, growth and
metastasis if ovarian tumor xenografts (38).
In conclusion, the findings of this study
demonstrated that PAX2 expression promoted the growth of the RM
murine model of ovarian cancer in vitro and in vivo,
and reduced the length of survival of allografted SCID mice. A high
expression of PAX2 also shortened the PFS of patients with serous
ovarian cancer. PAX2 may promote fatty acid metabolism in serous
ovarian cancer, which may be responsible for the shortened PFS.
Funding
This study was funded in part by grants from the
National Natural Science Foundation of China (nos. 81360341,
81560428 and 81860459), the National High-Tech Research and
Development Program (863 Program) (no. 2014AA020605) and the
Natural Science Foundation of Guangxi Zhuang Autonomous Region
(nos. 2018GXNBSFBA138033 and 2018GXNSFAA138060).
Availability of data and materials
The datasets used and/or analyzed during the current
study are available from the corresponding author upon request.
Authors' contributions
QW, KG and BCV were responsible for the conception
and design of the experiments. YF, YT, YM, YL, DY, LY contributed
to the acquisition, analysis and interpretation of the data. YF
drafted the manuscript. KG, BCV and QW revised the manuscript. All
authors have read and approved the final manuscript.
Ethics approval and consent to
participate
Written informed consent for this research was
obtained from the patients prior to surgery. The Ethics Review
Committee of Guangxi Medical University Cancer Hospital approved
the present study. Animal experiments were performed in accordance
with the Canadian Council on Animal Care's Guidelines for the Care
and Use of Animals under a protocol approved by the University of
Ottawa's Animal Care Committee.
Patient consent for publication
Not applicable.
Competing interests
The authors declare that they have no competing
interests.
Acknowledgments
The authors are grateful to Dr Didier Trono for
providing plasmids pPWI (Addgene plasmid #12254) and pCMVR8.74
(Addgene plasmid #22036) and Dr Arthur Nienhuis for providing
plasmid pCAGEco (Addgene plasmid #35617). The authors would also
like to thank Professor Beihua Kong of Affiliated Qilu Hospital of
Shandong University for providing tissue arrays of ovarian
cancer.
References
|
1
|
Siegel RL, Miller KD and Jemal A: Cancer
Statistics, 2017. CA Cancer J Clin. 67:7–30. 2017. View Article : Google Scholar : PubMed/NCBI
|
|
2
|
Perets R, Wyant GA, Muto KW, Bijron JG,
Poole BB, Chin KT, Chen JY, Ohman AW, Stepule CD, Kwak S, et al:
Transformation of the fallopian tube secretory epithelium leads to
high-grade serous ovarian cancer in brca; tp53; pten models. Cancer
Cell. 24:751–765. 2013. View Article : Google Scholar : PubMed/NCBI
|
|
3
|
Wang M, Ma H, Pan Y, Xiao W, Li J, Yu J
and He J: PAX2 and PAX8 reliably distinguishes ovarian serous
tumors from mucinous tumors. Appl Immunohistochem Mol Morphol.
23:280–287. 2015. View Article : Google Scholar
|
|
4
|
Song H, Kwan SY, Izaguirre DI, Zu Z, Tsang
YT, Tung CS, King ER, Mok SC, Gershenson DM and Wong KK: PAX2
expression in ovarian cancer. Int J Mol Sci. 14:6090–6105. 2013.
View Article : Google Scholar : PubMed/NCBI
|
|
5
|
Alhujaily EM, Tang Y, Yao D, Carmona E,
Garson K and Vanderhyden BC: Divergent roles of PAX2 in the
Etiology and Progression of Ovarian Cancer. Cancer Prev Res.
8:1163–1173. 2015. View Article : Google Scholar
|
|
6
|
Maulbecker CC and Gruss P: The oncogenic
potential of Pax genes. EMBO J. 12:2361–2367. 1993. View Article : Google Scholar : PubMed/NCBI
|
|
7
|
Muratovska A, Zhou C, He S, Goodyer P and
Eccles MR: Paired-Box genes are frequently expressed in cancer and
often required for cancer cell survival. Oncogene. 22:7989–7997.
2003. View Article : Google Scholar : PubMed/NCBI
|
|
8
|
Chen EY, Mehra K, Mehrad M, Ning G, Miron
A, Mutter GL, Monte N, Quade BJ, McKeon FD, Yassin Y, et al:
Secretory cell outgrowth, PAX2 and serous carcinogenesis in the
Fallopian tube. J Pathol. 222:110–116. 2010.PubMed/NCBI
|
|
9
|
Robson EJ, He SJ and Eccles MR: A PANorama
of PAX genes in cancer and development. Nat Rev Cancer. 6:52–62.
2006. View
Article : Google Scholar : PubMed/NCBI
|
|
10
|
Zhang HS, Yan XB, Li XB, Fan L, Zhang YF,
Wu GH, Li M and Fang J: PAX2 Protein induces expression of cyclin
D1 through activating AP-1 protein and promotes proliferation of
colon cancer Cells. J Biol Chem. 287:44164–44172. 2012. View Article : Google Scholar : PubMed/NCBI
|
|
11
|
Zhang LP, Shi XY, Zhao CY, Liu YZ and
Cheng P: RNA interference of pax2 inhibits growth of transplanted
human endometrial cancer cells in nude mice. Chin J Cancer.
30:400–406. 2011. View Article : Google Scholar : PubMed/NCBI
|
|
12
|
Hueber PA, Iglesias D, Chu LL, Eccles M
and Goodyer P: In vivo validation of PAX2 as a target for renal
cancer therapy. Cancer Lett. 265:148–155. 2008. View Article : Google Scholar : PubMed/NCBI
|
|
13
|
Penzvalto Z, Lanczky A, Lenart J,
Meggyesházi N, Krenács T, Szoboszlai N, Denkert C, Pete I and
Győrffy B: MEK1 is associated with carboplatin resistance and is a
prognostic biomarker in epithelial ovarian cancer. BMC Cancer.
14:837. 2014. View Article : Google Scholar : PubMed/NCBI
|
|
14
|
Gyorffy B, Lanczky A and Szallasi Z:
Implementing an online tool for genome-wide validation of
survival-associated biomarkers in ovarian-cancer using microarray
data from 1287 patients. Endocr-Relat Cancer. 19:197–208. 2012.
View Article : Google Scholar : PubMed/NCBI
|
|
15
|
Marín-García J: Mechanisms of bioenergy
production in mitochondria. Springer; Boston, MA: pp. 99–121.
2013
|
|
16
|
Nieman KM, Kenny HA, Penicka CV, Ladanyi
A, Buell-Gutbrod R, Zillhardt MR, Romero IL, Carey MS, Mills GB,
Hotamisligil GS, et al: Adipocytes promote ovarian cancer
metastasis and provide energy for rapid tumor growth. Nat Med.
17:1498–1503. 2011. View Article : Google Scholar : PubMed/NCBI
|
|
17
|
Pavlova NN and Thompson CB: The emerging
hallmarks of cancer metabolism. Cell Metab. 23:27–47. 2016.
View Article : Google Scholar : PubMed/NCBI
|
|
18
|
Kellenberger LD, Bruin JE, Greenaway J,
Campbell NE, Moorehead RA, Holloway AC and Petrik J: The role of
dysregulated glucose metabolism in epithelial ovarian cancer. J
Oncol. 2010:5143102010. View Article : Google Scholar : PubMed/NCBI
|
|
19
|
Lim HY, Ho QS, Low J, Choolani M and Wong
KP: Respiratory competent mitochondria in human ovarian and
peritoneal cancer. Mitochondrion. 11:437–443. 2011. View Article : Google Scholar : PubMed/NCBI
|
|
20
|
Hanahan D and Weinberg RA: Hallmarks of
cancer: The next generation. Cell. 144:646–674. 2011. View Article : Google Scholar : PubMed/NCBI
|
|
21
|
Chivukula M, Dabbs DJ, O'Connor S and
Bhargava R: PAX 2: A novel Mullerian marker for serous papillary
carcinomas to differentiate from micropapillary breast carcinoma.
Int J Gynecol Pathol. 28:570–578. 2009. View Article : Google Scholar : PubMed/NCBI
|
|
22
|
Priebe A, Tan L, Wahl H, Kueck A, He G,
Kwok R, Opipari A and Liu JR: Glucose deprivation activates AMPK
and induces cell death through modulation of Akt in ovarian cancer
cells. Gynecol Oncol. 122:389–395. 2011. View Article : Google Scholar : PubMed/NCBI
|
|
23
|
Anderson AS, Roberts PC, Frisard MI,
McMillan RP, Brown TJ, Lawless MH, Hulver MW and Schmelz EM:
Metabolic changes during ovarian cancer progression as targets for
sphingosine treatment. Exp Cell Res. 319:1431–1442. 2013.
View Article : Google Scholar : PubMed/NCBI
|
|
24
|
Fong MY, McDunn J and Kakar SS:
Identification of metabolites in the normal ovary and their
transformation in primary and metastatic ovarian cancer. PLoS One.
6:e199632011. View Article : Google Scholar : PubMed/NCBI
|
|
25
|
Ke C, Hou Y, Zhang H, Fan L, Ge T, Guo B,
Zhang F, Yang K, Wang J, Lou G and Li K: Large-scale profiling of
metabolic dysregulation in ovarian cancer. Int J Cancer.
136:516–526. 2015.
|
|
26
|
Montopoli M, Bellanda M, Lonardoni F,
Ragazzi E, Dorigo P, Froldi G, Mammi S and Caparrotta L: 'Metabolic
reprogramming' in ovarian cancer cells resistant to cisplatin. Curr
Cancer Drug Targets. 11:226–235. 2011. View Article : Google Scholar
|
|
27
|
Bauerschlag DO, Maass N, Leonhardt P,
Verburg FA, Pecks U, Zeppernick F, Morgenroth A, Mottaghy FM, Tolba
R, Meinhold-Heerlein I and Bräutigam K: Fatty acid synthase
over-expression: Target for therapy and reversal of chemoresistance
in ovarian cancer. J Transl Med. 13:146. 2015. View Article : Google Scholar
|
|
28
|
Pasto A, Bellio C, Pilotto G, Ciminale V,
Silic-Benussi M, Guzzo G, Rasola A, Frasson C, Nardo G, Zulato E,
et al: Cancer stem cells from epithelial ovarian cancer patients
privilege oxidative phosphorylation, and resist glucose
deprivation. Oncotarget. 5:4305–4319. 2014. View Article : Google Scholar : PubMed/NCBI
|
|
29
|
Raspollini MR, Amunni G, Villanucci A,
Boddi V and Taddei GL: Increased cyclooxygenase-2 (COX-2) and
P-glycoprotein-170 (MDR1) expression is associated with
chemotherapy resistance and poor prognosis. Analysis in ovarian
carcinoma patients with low and high survival. Int J Gynecol
Cancer. 15:255–260. 2005. View Article : Google Scholar : PubMed/NCBI
|
|
30
|
Ferrandina G, Lauriola L, Zannoni GF,
Fagotti A, Fanfani F, Legge F, Maggiano N, Gessi M, Mancuso S,
Ranelletti FO and Scambia G: Increased cyclooxygenase-2 (COX-2)
expression is associated with chemotherapy resistance and outcome
in ovarian cancer patients. Ann Oncol. 13:1205–1211. 2002.
View Article : Google Scholar : PubMed/NCBI
|
|
31
|
Chkourko Gusky H, Macdougald OA and
Podgorski I: Omentum and bone marrow: How adipocyte-rich organs
create tumour microenvironments conducive for metastatic
progression. Obes Rev. 17:1015–1029. 2016. View Article : Google Scholar : PubMed/NCBI
|
|
32
|
Fan S, Wang Y, Zhang Z, Lu J, Wu Z, Shan
Q, Sun C, Wu D, Li M, Sheng N, et al: High expression of
glutamate-ammonia ligase is associated with unfavorable prognosis
in patients with ovarian cancer. J Cell Biochem. 119:6008–6015.
2018. View Article : Google Scholar : PubMed/NCBI
|
|
33
|
Shim GS, Manandhar S, Shin DH, Kim TH and
Kwak MK: Acquisition of doxorubicin resistance in ovarian carcinoma
cells accompanies activation of the NRF2 pathway. Free radical
biology & medicine. 47:1619–1631. 2009. View Article : Google Scholar
|
|
34
|
Yuan L, Sheng X, Willson AK, Roque DR,
Stine JE, Guo H, Jones HM, Zhou C and Bae-Jump VL: Glutamine
promotes ovarian cancer cell proliferation through the mTOR/S6
pathway. Endocr Relat Cancer. 22:577–591. 2015. View Article : Google Scholar : PubMed/NCBI
|
|
35
|
Papaevangelou E, Almeida GS, Box C,
deSouza NM and Chung YL: The effect of FASN inhibition on the
growth and metabolism of a cisplatin-resistant ovarian carcinoma
model. Int J Cancer. 143:992–1002. 2018. View Article : Google Scholar : PubMed/NCBI
|
|
36
|
Kobayashi Y, Kashima H, Wu RC, Jung JG,
Kuan JC, Gu J, Xuan J, Sokoll L, Visvanathan K, Shih IeM and Wang
TL: Mevalonate pathway antagonist suppresses formation of serous
tubal intraepithelial carcinoma and ovarian carcinoma in mouse
models. Clin Cancer Res. 21:4652–4662. 2015. View Article : Google Scholar : PubMed/NCBI
|
|
37
|
Matassa DS, Amoroso MR, Lu H, Avolio R,
Arzeni D, Procaccini C, Faicchia D, Maddalena F, Simeon V,
Agliarulo I, et al: Oxidative metabolism drives
inflammation-induced platinum resistance in human ovarian cancer.
Cell Death Differ. 23:1542–1554. 2016. View Article : Google Scholar : PubMed/NCBI
|
|
38
|
Harjes U, Bridges E, Gharpure KM, Roxanis
I, Sheldon H, Miranda F, Mangala LS, Pradeep S, Lopez-Berestein G,
Ahmed A, et al: Antiangiogenic and tumour inhibitory effects of
downregulating tumour endothelial FABP4. Oncogene. 36:912–921.
2017. View Article : Google Scholar :
|