Introduction
Melanoma is the most lethal skin cancer; it is
responsible for the vast majority of cutaneous cancer deaths
globally, even though it only accounts for ≤5% of all cutaneous
carcinomas (1). In the early
stages, melanoma can be treated with surgical resection; however,
once metastasis occurs, it is resistant to conventional radio- and
chemotherapy, and is extremely difficult to treat (2). Therefore, it is urgent to acquire an
improved understanding of the properties of melanoma in order to
develop effective treatment regimens.
Alterations in cellular metabolism have been
recognized as hallmarks of malignant tumors (3,4).
Aerobic glycolysis, also termed the Warburg effect, is one of the
most important hallmarks in the reprogramming of cancer metabolism
via upregulated glycolytic enzymes and activated regulatory
factors, including oncogenes (p53, c-Myc and K-Ras), essential
signaling pathways [PI3K/Akt, liver kinase B1/AMP kinase and
hypoxia-inducible factor 1 (HIF1) signaling pathways] and
epigenetic regulators such as sirtuins (SIRTs) (5-8).
Importantly, aerobic glycolysis has been demonstrated to provide a
specific microenvironment to promote unconstrained proliferation
and invasion (9). Therefore,
controlling cellular metabolism may be a potential targeted
therapeutic strategy to treat malignant tumors such as
melanoma.
Forkhead box O (FOXO) transcription factors,
including FOXO1, FOXO3a, FOXO4 and FOXO6, which are conserved from
Caenorhabditis elegans to mammals, serve pivotal roles in
multiple cellular processes, such as cell cycle progression,
apoptotic cell death, DNA repair, oxidative stress,
epithelial-mesenchymal transition and cellular metabolism (10-13).
FOXO3a, an important member of the FOXO family, participates into
the modulation of cell growth in multiple tumors, including
glioblastoma (14), prostate
cancer (15), lung adeno-carcinoma
(16), ovarian cancer (17), colorectal cancer (18) and Hodgkin's lymphoma (19). It was reported that FOXO3a is also
an important regulator of cellular metabolism in tumors; for
example, FOXO3a regulates reactive oxygen metabolism by inhibiting
mitochondrial gene expression in colon cancer (20). Additionally, FOXO3a has been shown
to regulate multiple cellular process, including cell survival,
apoptosis (21-23), migration and invasion (24) in melanoma. However, the role of
FOXO3a in the regulation of cellular metabolism in melanoma has
never been explored.
The present study aimed to elucidate the role of the
FOXO3a-SIRT6 axis in the interplay between cellular metabolism and
tumor progression, thereby providing novel insight into potential
melanoma treatment strategies. In the present study, it was
observed that FOXO3a inhibited aerobic glycolysis by targeting the
promoter of SIRT6 and promoting its transcription, thereby
inhibiting the expression of a cluster of glycolysis-associated
genes.
Materials and methods
Cell lines and reagents
The MV3 melanoma cell line was obtained from the
Third Military Medical University, and cultured in RPMI-1640
(Thermo Fisher Scientific, Inc.) supplemented with 10% fetal bovine
serum (FBS; Thermo Fisher Scientific, Inc.) and 1%
penicillin-streptomycin (P/S; Invitrogen; Thermo Fisher Scientific,
Inc.). PIG1 normal melanocytes, and SK-MEL-28 and A375 melanoma
cell lines were purchased from the American Type Culture Collection
(ATCC) and cultured in Dulbecco's Modified Eagle's minimum
essential medium (DMEM, Thermo Fisher Scientific, Inc.)
supplemented with 10% FBS and 1% P/S. All cells were cultured at
37°C in a 5% CO2 incubator (Sanyo).
2-Deoxy-2-[(7-nitro-2,1,3-benzoxadiazol-4-yl) amino]-D-glucose
(2-NBDG; cat. no. N13195) was purchased from BD Biosciences. MTT
(cat. no. M2128) and DMSO (cat. no. D2650) were purchased from
Sigma-Aldrich (Merck KGaA).
Reverse transcription-quantitative PCR
(RT-qPCR)
RNA was extracted from cells following specific
treatments using RNAiso Plus (Takara Bio, Inc.), trichloromethane
(Sigma-Aldrich; Merck KGaA), isopropanol (Shanghai Dingguo
Biological Technology Co., Ltd.) and 75% ethanol (Shanghai Dingguo
Biological Technology Co., Ltd.) according to the manufacturer's
protocol. cDNA was obtained from 2 µg RNA/sample using a
GoScript™ Reverse Transcriptase kit (cat. no. A5001; Promega
Corporation) according to the manufacturer's protocols. Then,
RT-qPCR was performed to analyze the mRNA expression of genes using
a LightCycler® 96 Instrument (Roche Diagnostics).
Promega GoTaq® qPCR Master Mix (cat. no. A6001; Promega
Corporation) was used. The PCR reaction conditions were as follows:
95°C pre- denaturation for 10 min; then, 45 cycles of 95°C for 15
sec, 60°C for 30 sec and 72°C for 30 sec; then, 95°C for 10 sec,
60°C for 1 min, 97°C for 1 sec and 37°C for 30 sec. Results were
calculated via the 2-∆∆Cq method (25) with ACTB expression used as
the internal control (Cq value was used instead of Ct value in this
study). The primers, which were also used in a previous study
(14), were presented in Table I.
 | Table IPrimers used for reverse
transcription-quantitative PCR. |
Table I
Primers used for reverse
transcription-quantitative PCR.
| Gene | Sequence
(5′-3′) |
|---|
| FOXO3A | F:
ACGTCTTCAGGTCCTCCTGTT |
| R:
GGGGAAGCACCAAAGAAGAGAG |
| SIRT6 | F:
CTCGAAGTGGAGCTGGACC |
| R:
TCCTCGGGGATCATGGAGTC |
| GLUT1 | F:
TGTGTATGCCACCATTGGCT |
| R:
CTAGCGCGATGGTCATGAGT |
| GLUT4 | F:
GGACAGCCAGCCTACGCCACCATA |
| R:
GGACAGCCAGCCTACGCCACCATA |
| HK1 | F:
GCACGTTTGCACCATTGTCT |
| R:
TTGTGGAAACGCCGGGAATA |
| HK2 | F:
GAATGGGAAGTGGGGTGGAG |
| R:
GAGGAGGATGCTCTCGTCCA |
| HK3 | F:
TTCCCATGTAGGCAGCTTGG |
| R:
ATGAGGCCTATCTCGCAACG |
| GAPDH | F:
CTCTGCTCCTCCTGTTCGAC |
| R:
GCGCCCAATACGACCAAATC |
| PFK1 | F:
CTGCCCCTCATGGAATGTGT |
| R:
ATACCGGGGGTCTGACATGA |
| PKM2 | F:
AATGCAGTCCTGGATGGAGC |
| R:
ACTGCAGCACTTGAAGGAGG |
| LDHA1 | F:
GGTCCTTGGGGAACATGGAG |
| R:
TAGCCCAGGATGTGTAGCCT |
| LDHA2 | F:
AGCTGTTCCACTTAAGGCCC |
| R:
AGGAATCGGGAATGCACGTC |
| ACTB | F:
CGTCTTCCCCTCCATCGTG |
| R:
TCGATGGGGTACTTCAGGGT |
Vector construction and stable
transfection
Short hairpin RNA (shRNA) sequences were designed
using siRNAext (http://sirna.wi.mit.edu/), and then synthesized by BGI
and cloned into a lentiviral pLKO.1 vector (cat. no. 10878;
Addgene, Inc.). The sequences in FOXO3a and SIRT6
targeted by the shRNAs were presented in Table II. Human full-length SIRT6
(GenBank no. CR457200.1) cDNA was from MV3 cells via PCR;
PrimeSTAR® Max DNA Polymerase (Takara Bio, Inc.) was
used. Thermocycling conditions were as follows: 98°C
pre-denaturation for 5 min; then, 28 cycles of 98°C for 30 sec,
60°C for 30 sec and 72°C for 20 sec; then, 72°C for 10 sec. The
products were constructed into a lentiviral pCDH-CMV-MCS-EF1-Puro
vector (cat. no. CD510B; System Biosciences, LLC). The primers were
listed in Table II. HA-FOXO3a WT
plasmid (cat. no. 1787; Addgene, Inc.) was obtained from Addgene
and then cloned into the pCDH-CMV-MCS-EF1-Puro vector. Plasmids
were packaged into lentivirus as previously described (26). Briefly, 293FT cells (ATCC) were
cultured in DMEM (Thermo Fisher Scientific, Inc.) with 10% FBS, 1%
P/S and 0.5 mg/ml gene-ticin (Thermo Fisher Scientific, Inc.),
which was replaced with lentiviral culture medium prior to
transfection with plasmids, which was comprised of DMEM, 10% FBS, 2
mM L-glutamine (Invitrogen; Thermo Fisher Scientific, Inc.), 0.1 mM
non-essential amino acid (Invitrogen; Thermo Fisher Scientific,
Inc.) and 1 mM sodium pyruvate (Invitrogen; Thermo Fisher
Scientific, Inc.). 293FT cells at 100% confluence were transfected
with 0.625 µg of the plasmid of interest, plus the packaging
plasmids pLP1, pLP2 and pLP/VSVG (Nova Lifetech, Inc.), using
Opti-MEM™ medium (Gibco; Thermo Fisher Scientific, Inc.) and
Lipofectamine™ 2000 (Thermo Fisher Scientific, Inc.). At 3 days
later, the viral supernatant was aspirated with a syringe, filtered
through a 0.45-µm filter membrane and collected in a 1.5-ml
centrifuge tube. Fresh lentivirus culture medium was added to the
293FT cell culture wells, which were cultured for a further 48 h
before collecting the second viral supernatant. Then, 40,000 MV3
cells in a 60-mm dish were infected with 2 ml lentivirus containing
>107 TU/ml using 4 µg/ml polybrene
(Sigma-Aldrich; Merck KGaA) and incubated at 37°C with 5%
CO2 for 48 h. Then, the cells were re-seeded into a
100-mm petri dish and cultured in standard medium. After 3 days, 2
µg/ml puromycin was used to continuously screen the cells
for ≥72 h. RT-qPCR or western blotting was performed to verify the
expression of the target genes.
| Table IIPrimers or targeted sequences for
vector construction. |
Table II
Primers or targeted sequences for
vector construction.
| Primer/target
site | Sequence
(5′-3′) |
|---|
| shFOXO3a#1 |
AATGTGACATGGAGTCCATTAT |
| shFOXO3a#2 |
GGACAATAGCAACAAGTATACC |
| shSIRT6 |
AAGAATGTGCCAAGTGTAAGA |
| Scramble |
ATCCGTCCGAACGTAAGTCAA |
| SIRT6 | Forward
(EcoRI): CCGGAATTCATGTCGGTGAATTACGCGGCGGC
Reverse (BamHI): CGCGGATCCTT
AACTGGGGACCGCCTTGG |
Western blot assay
Western blotting was conducted to analyze the
expression of proteins. Briefly, cells at 80% confluence were
trypsinized and collected in 5-ml tubes. Then, cells were
centrifuged at 600 x g for 5 min at 4°C, the supernatant was
removed, and the cell pellet was washed three times with PBS.
Protein was extracted from the cell pellet using RIPA lysis buffer
(cat. no. P0013B; Beyotime Institute of Biotechnology), and the
mixture was allowed to stand on ice for 30 min. The mixture was
centrifuged at 12,000 x g at 4°C for 15 min, and the protein
concentration was determined by using an Enhanced BCA Protein Assay
Kit (cat. no. P0009; Beyotime Institute of Biotechnology). Protein
(100 µg/lane) was separated via 10% SDS-PAGE. Then, protein
was transferred to PVDF membranes (cat. no. IPVH00010; Merck KGaA).
Membranes were blocked with 5% BSA (Fraction V; cat. no. ST023;
Beyotime Institute of Biotechnology) at room temperature for 2 h.
Primary antibodies, including rabbit anti-FOXO3a (1:1,000; cat. no.
2497; Cell Signaling Technology, Inc.), rabbit anti-SIRT6 (1:800;
cat. no. 12486; Cell Signaling Technology, Inc.) and anti-α-Tubulin
Antibody (1:200; cat. no. 2144; Cell Signaling Technology, Inc.)
were incubated at 4°C overnight. Then, horseradish
peroxidase-conjugated goat anti-mouse (1:20,000; cat. no. ab205719;
Abcam) or goat anti-rabbit IgG (1:20,000; cat. no. ab205718; Abcam)
was incubated at room temperature for 2 h. ChemiSignal™ Plus ECL
(Clinx Science Instruments Co., Ltd.) was used to visualize bands,
which were imaged using a GenoSens 2000 Touch gel imaging system
(Clinx Science Instruments Co., Ltd.).
MTT assay
Cells (1,000/well) were cultured in 96-well plates
at 37°C in a CO2 incubator, and MTT assays were
performed as previously described (27) at indicated times (0, 2, 4 and 6
days).
Glucose uptake assay
Cells (2×10⁵/well) were cultured at 37°C
in a CO2 incubator in glucose-free RPMI-1640 (Procell
Life Science & Technology Co., Ltd.) with FBS and P/S in 6-well
plates for 120 min, and the medium was removed. A fluorescent
glucose analogue, 2-NBDG (100 µM), was dissolved in
Kerbs-Ringer bicarbonate (KRB) buffer (129 mM NaCl, 4.8 mM KCl, 5
mM NaHCO3, 1.2 mM MgSO4, 2 mM
CaCl2 and 10 mM HEPES) and added to the plates prior to
incubation at 37°C for a further 120 min. The cells were collected
using trypsin and washed with KRB buffer, and the fluorescence of
2-NBDG in the cells was detected via flow cytometry (Acurri C6; BD
Biosciences) and analyzed by using FlowJo 7.6.1 (FlowJo LLC).
Glucose consumption, lactate and lactate
dehydrogenase (LDH) assays
Cells (2×10⁵/well) were cultured in
6-well plates at 37°C for 48 h. The glucose content in the medium
was detected using a Glucose Assay kit (cat. no. GAGO20;
Sigma-Aldrich; Merck KGaA), the lactate content in the medium was
detected using a Lactate Assay kit (cat. no. MAK064; Sigma-Aldrich;
Merck KGaA) and the lactate dehydrogenase activity of cells was
detected using a lactate dehydrogenase assay kit (cat. no. MAK066;
Sigma-Aldrich; Merck KGaA), all according to the manufacturer's
protocols. Samples were analyzed using a SYNERGY HTX multi-mode
reader (Biotek Instruments, Inc.). The rates of glucose
consumption, lactate production and relative LDH activity were
calculated according to the standard curve line and OD value of
each sample. Then, these values were also normalized by cell
numbers determined by using a blood cell counting chamber.
Glucose stress flux test
A glucose stress flux test was conducted as
previously reported (14). In
brief, 40,000 cells were seeded into XF96 cell culture microplates
and cultured at 37°C for 24 h. The medium was then replaced with
Seahorse XF DMEM (Agilent Technologies, Inc.) containing 2
µM glutamine, and the microplates were maintained in a
non-CO2 incubator at 37°C for 60 min. Then, a Seahorse
XF glycolytic stress test was performed using a Seahorse XFp
analyzer (Agilent Technologies, Inc.). In this test, a final
concentration of 10 µM glucose (Sangon Biotech Co., Ltd.), 1
µg/ml oligomycin (cat. no. 495455; Sigma-Aldrich; Merck
KGaA) and 50 µM 2-deoxyglucose (Sangon Biotech Co., Ltd.)
were used.
Chromatin immunoprecipitation (ChIP)
assay
ChIP assays were performed in MV3 cells by using the
EZ CHIP™ kit (cat. no. 17-371; Merck KGaA) according to the
manufacturer's protocol. 293FT cells were cultivated in a 100-mm
dish; when the cells reached 80% confluence, 1% fresh formaldehyde
(Sangon Biotech Co., Ltd.) was added and the cells were cultured in
a 37°C incubator for 10 min to crosslink protein and DNA. The cells
were washed with PBS buffer containing 1 mM
phenylmethylsulfonylfluoride (PMSF; cat. no. ST505; Beyotime
Institute of Biotechnology), and then collected in a 1.5-ml tube
for centrifugation at 1,000 x g for 2 min at 4°C. The centrifuged
cell pellet was resuspended in 200 µl SDS lysis buffer (cat.
no. P0013G; Beyotime Institute of Biotechnology) containing 1 mM
PMSF on ice for 10 min, following which it was subjected to
ultrasonic vibration with 15 sec ON, 30 sec OFF for 8 cycles on ice
to break the genomic DNA into <1,000-bp fragments. The sample
was then resuspended in sodium chloride, incubated at 65°C for 4 h,
and then mixed with Tris-balanced phenol and centrifuged at 12,000
x g at 4°C for 5 min. Finally, 200 µl chloroform was added
to the pellet, which was then centrifugated at 4°C at 12,000 x g
for 5 min.
The resulting supernatant was moved into an ice-cold
centrifuge tube, and ChIP dilution buffer containing 1 mM PMSF was
added to a final volume of 2 ml, of which 20 µl was
collected to use as the input control. Then, 70 µl of
Protein A + G Agarose (containing salmon sperm DNA) was added to
the remaining sample, which was incubated slowly at 4°C on a shaker
for 30 min. The solution was then centrifuged at 1,000 x g for 1
min at 4°C. and the supernatant was collected. Then, 2 µg
FOXO3a primary antibody (cat. no. ab12162; Abcam) or rabbit IgG
(cat. no. A7016, Beyotime Institute of Biotechnology) as a blank
control was added, along with 60 µl Protein A + G Agarose
containing salmon sperm DNA; the mixture was incubated slowly at
4°C on a shaker for 60 min and subsequently centrifuged at 1,000 x
g for 1 min at 4°C. The supernatant was removed, and the pellet was
centrifuged once at 1,000 x g for 1 min at 4°C with 1 ml Low Salt
Immune Complex Wash Buffer, High Salt Immune Complex Wash Buffer
and LiCl Immune Complex Wash Buffer, followed by centrifugation
under the same conditions with 1 ml TE Buffer twice. Elution Buffer
was subsequently added prior to centrifugation at 1,000 x g for 1
min at 4°C, following which this step was repeated. The resulting
supernatant was collected, the sample was recovered and
concentrated using a AxyPrep DNA Gel Extraction kit (Axygen
Bioscience, Inc.), and then subjected to qPCR analysis using the
primers in Table III.
| Table IIISIRT6 primers used for
chromatin immunoprecipitation and luciferase assays. |
Table III
SIRT6 primers used for
chromatin immunoprecipitation and luciferase assays.
| Primer | Sequence
(5′-3′) |
|---|
| SIRT6-p | F1:
AAGACAATCCGTGGGCTTGG |
| R1:
GAGCTACCCAGGTACCCTG F2: TGGCTAGGACTCAGCACG R2: |
|
TAGGGGAGGAAGGAGGTGG |
|
SIRT6-p-0.1k | F (NheI):
CCGGCTAGCGCCCGGCTCACTCACTTTTTAG |
|
SIRT6-p-0.2k | F (NheI):
CCGGCTAGCCTGCCTTGGCCTCCCAAAGT |
|
SIRT6-p-0.6k | F (NheI):
CCGGCTAGCCTATCATCACTGGACTGATTTCAGTTTC |
|
SIRT6-p-1.2k | F (NheI):
CCGGCTAGCGGGTAATAAGACACCCAACAGAGG |
| SIRT6-p-
(all) | R (XhoI):
CCGCTCGAGGTAATGGTGACATGGTGTGGTTG |
|
SIRT6-p-N0.9k | F (NheI):
CCGGCTAGCCTGGTCACATGTTTGTGTCCAC |
|
SIRT6-p-N0.9k | R (XhoI):
CCGCTCGAGAAAGTTTCCCTTGTTGAGGCCG |
Dual-luciferase assay and promoter
analysis
To analyze the similarity of the promotor region of
human and mouse SIRT6, the promoter region (-2,500 to 0 bp)
of mouse SIRT6 and the promoter region (−2,500 to 0 bp) of
human SIRT6 were compared using the online Bl2seq tool in
the SilkDB (http://www.silkdb.org/silkdb/). The sequences in the
promoter regions, which were termed 0.1 k (−1,100 to −939 bp), 0.2
k (−1,147 to −939 bp), 0.6 k (−1,538 to −939 bp), 1.2 k (−2,152 to
−939 bp) and N0.9 k (−938 to −25 bp), were obtained from genomic
DNA extracted from MV3 cells via PCR by using primers in Table III. The mutant (Mut) sequence of
SIRT6 promoter region was synthesized by Sangon Biotech Co., Ltd.
These sequences were cloned into pGL3-basic luciferase reporter
vectors (cat. no. E1751; Promega Corporation). Then, 1 µg
pGL3 vector and 1 µg pRL-TK expressing Renilla
luciferase (Youbio, Inc.) were co-transfected into 20,000 MV3
cells/well in a 24-well plate with X-tremeGENE™ HP DNA Transfection
reagent (cat. no. 6366546001; Roche Diagnostics), and the
luciferase assay was performed as previously described using a
Dual-Lumi™ Luciferase Reporter Gene assay kit (cat. no. RG088S;
Beyotime Institute of Biotechnology) (28). The promotor activity was normalized
to Renilla luciferase activity.
The profile of FOXO3a in Mus musculus and
Homo sapiens was downloaded from the JASPER database
(version 5.0_ ALPHA; http://jaspar.binf.ku.dk/) and then compared with the
promoter region of human SIRT6 to find the potential binding
site of FOXO3a.
Tumor xenografts
The animal experiments in the current study were
approved and supervised by the Institutional Animal Care and Use
Committees of the Southwest University (permit no.
IACUC-20190402-02) and the Experimental Animal Care and Use
Committees of the Institute of Sericulture and Systems Biology. The
study was performed according to the Laboratory Animal Management
Regulations and the Measures of Chongqing Municipality on the
Management of Experimental Animals. A total of nine 4-week-old
female mice (weight, 18-20 g; BALB/c-nu; Beijing Huafukang
Bioscience Co. Ltd.) were purchased and housed in a specific
pathogen-free room to acclimate for ~1 week. The animals were house
at 22°C with 40-60% humidity under a 12:12-h light/dark cycle. Mice
were provided ad libitum access to food and water. Then, MV3
cells (1×10⁶) in 100 µl PBS were subcutaneously
injected into the left flank of mice. Every group contained ≥3
mice. Then, 10 days later, the first measurements of the length and
width of tumors were made by caliper, and tumor growth was measured
for 25 days after this point. The tumor volume was calculated with
the following formula: Volume = tumor length x width2 x
π/6. At the end of the experiment, animals was sacrificed with
CO2 in a 10-l volume chamber with a flow rate of 2 l/min
and a displacement rate of 20% volume/min, and then tumors were
removed and weighed. The maximum tumor diameter observed was 1.37
cm.
Bioinformatics analysis
The Cancer Genome Atlas (TCGA) Ocular melanoma
(project no. TCGA-UVM) dataset was downloaded from University of
California Santa Cruz Xena (http://xena.ucsc.edu/). Other clinical databases,
including Tumor Melanoma Metastatic Bhardwaj-44-MAS5.0-u133p2,
Mixed Melanoma Briggs-70-MAS5.0-u133a, Mixed Melanoma (Metastasis)
Hynes-83-MAS5.0-u133a, Exp Cellline Melanoma-Exosome
McMasters-8-MAS5.0-u133p2, Exp Melanoma Augustine-50-MAS5.0-u133p2,
Tumor Melanoma Jönsson-214-custom-ilmnht12v4 and Tumor Melanoma
(Metastatic) Matta-87-MAS5.0-u133p2 were downloaded from the public
R2 platform (https://hgserver1.amc.nl/). Genes in certain datasets
were further analyzed by using alternative probes provided by the
databases. All data were analyzed by using the software GraphPad
Prism 6 (GraphPad Software, Inc.).
Statistical analysis
All the experiments were repeated 3 times and the
data collected were analyzed by using GraphPad Prism 6. Data were
presented as the mean ± SD. Unpaired two-tailed Student's t-test
was applied to determine significant differences between two
groups. The scan cutoff modus was used to separate high- and
low-expression groups for Kaplan-Meier analysis, with the exception
of the analysis of data from the Cancer Genome Atlas (TCGA) Ocular
melanoma (project no. TCGA-UVM) dataset, for which the median
cutoff modus was used. Log-rank (Mentel-Cox) tests were conducted
to determine significance for survival analysis. A Bonferroni
correction was applied after the log-rank test to control for
multiple comparisons [P<0.00833 (0.05/6) was considered to
indicate a statistically significant different for this analysis].
Pearson correlation coefficient was used to analyze the correlation
of the expression levels of 2 genes. One-way ANOVA followed by
Dunnett's test was performed to compare the mean of each experiment
group with the control group in datasets containing multiple
comparisons. One-way ANOVA followed by Tukey's test was performed
to compare the mean of each group with the mean of every other
group when performing multiple comparisons. P<0.05 was
considered to indicate a statistically significant difference.
Results
High FOXO3A expression predicts improved
prognosis of patients with melanoma
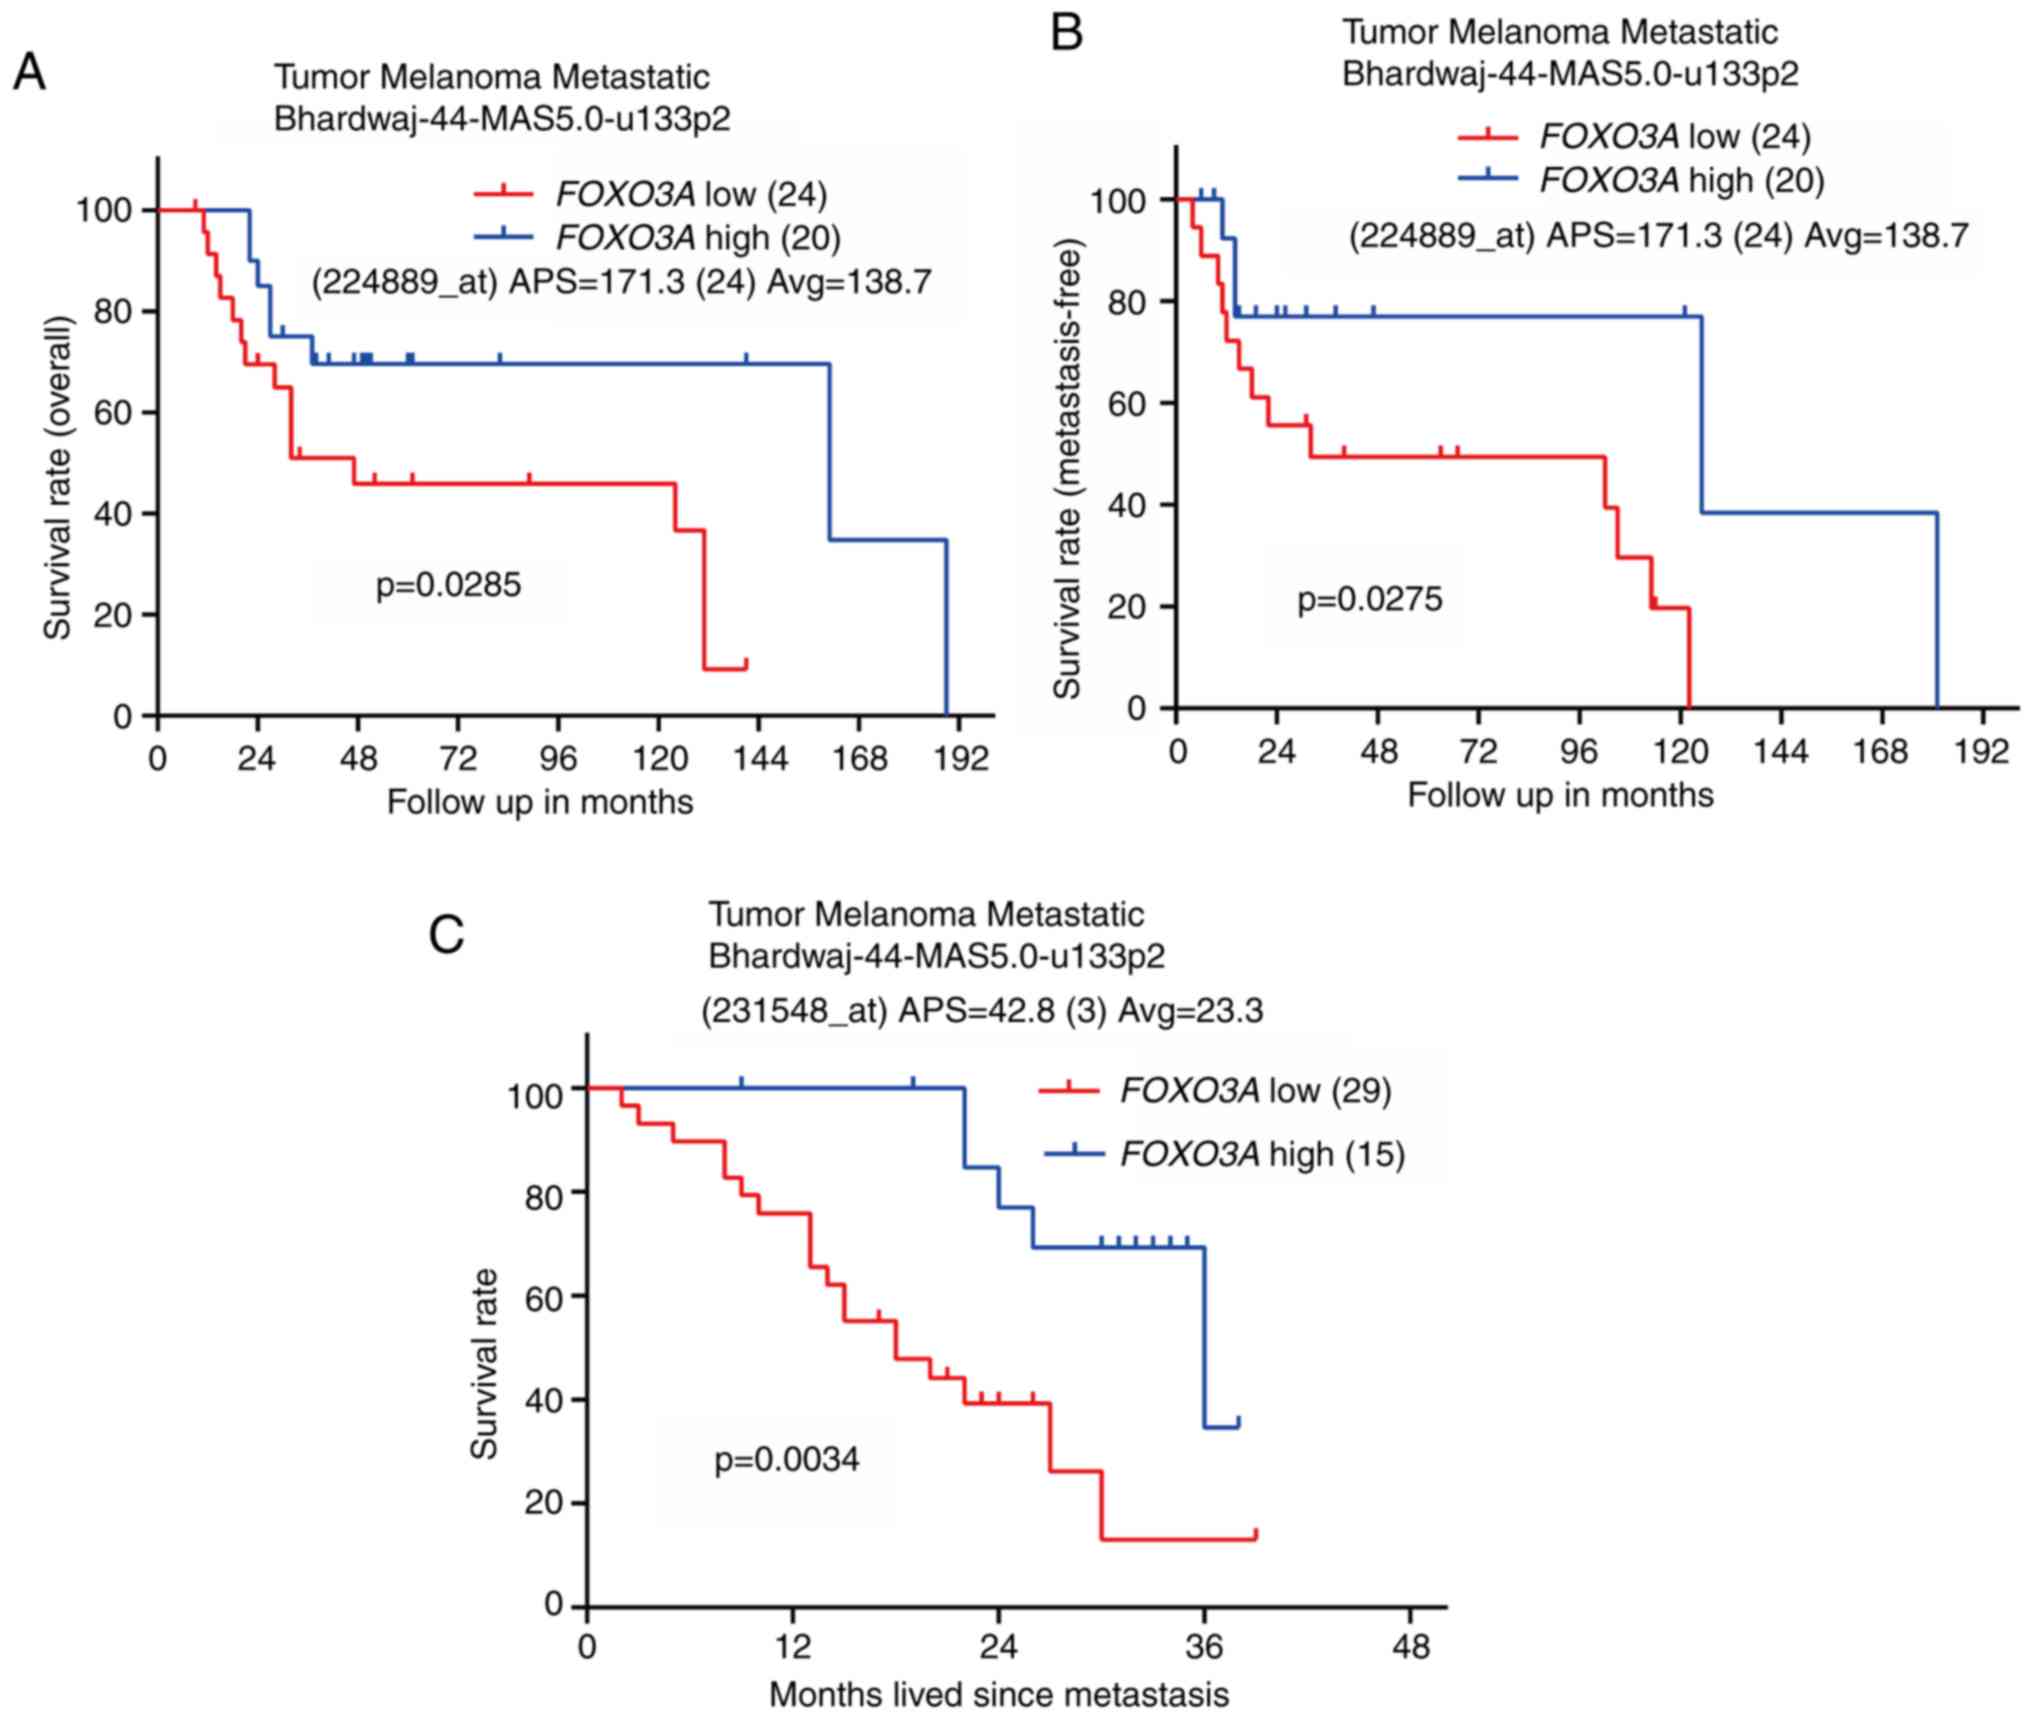
To elucidate the relationship between FOXO3A
mRNA expression and the prognosis of patients with melanoma, its
expression was analyzed in the database termed Tumor Melanoma
Metastatic Bhardwaj-44-MAS5.0-u133p2 from the R2 platform. The
results showed that high FOXO3A expression predicted
improved overall survival and metastasis-free survival in this
cohort (Fig. 1A and B).
Furthermore, FOXO3A expression was negatively associated
with the survival rate of patients with metastatic melanoma
(Figs. 1C and S1A-D). Additionally, FOXO3A
expression was lower in patients with stage IV melanoma than those
with stage III melanoma (Figs. 1D,
and S1E and F). Importantly,
FOXO3A expression was lower in nevus compared to normal
tissues, and FOXO3A expression was further decreased in
melanoma compared with nevus (Fig.
1E). Next, in the database termed Mixed Melanoma (Metastasis)
Hynes-83-MAS5.0-u133a, it was found that FOXO3A expression
was lower in melanoma metastasis compared with the primary tumors
(Fig. 1F). In an experimental
database termed Exp Cellline Melanoma-Exosome
McMasters-8-MAS5.0-u133p2, it was demonstrated that FOXO3A
expression was lower in the exosomes of A375 melanoma cells
compared to those of HeMa-LP normal melanocytes (Fig. 1G). N-Ras mutations arise in 15-20%
of all melanomas, and have been shown to be associated with
aggressive clinical behavior and poor prognosis (29). Of note, FOXO3A expression
was lower in N-Ras mutant melanoma cells compared with wild-type
cells (Fig. 1H). These results
implied that FOXO3a may act as a tumor suppressor in melanoma.
FOXO3A transcriptionally promotes the
expression of SIRT6 in melanoma
It was previously shown that the FOXO3a genotype was
strongly associated with human longevity (30). As a deacetylase, SIRT6 also was
shown to be related to human longevity (31). Additionally, FOXO3a and SIRT6 are
both regulators of hepatic sterol regulatory element-binding
protein 2 and cholesterol biosynthesis, as well as low-density
lipoprotein-cholesterol homeostasis (32,33).
These findings suggested that FOXO3a and SIRT6 are highly
associated; however, their relationship had not been elucidated. In
the present study, it was found that FOXO3A mRNA expression
was positively correlated with SIRT6 mRNA expression
(detected by probe 219613_s_at or 233179_x_at) in a melanoma cohort
(Fig. 2A and B). Additionally,
mRNA expression levels of FOXO3A and SIRT6 were
correlated with each other in PIG1 melanocytes and 3 melanoma cell
lines (Fig. 2C-E). Furthermore,
FOXO3a expression was silenced in MV3 melanoma cells via
virus-mediated transfection, and the results showed that both the
mRNA and protein levels of SIRT6 were downregulated after FOXO3a
silencing (Fig. 2F and G).
Consistently, FOXO3a overexpression also induced upregulation of
SIRT6 expression in MV3 cells (Fig. 2H
and I).
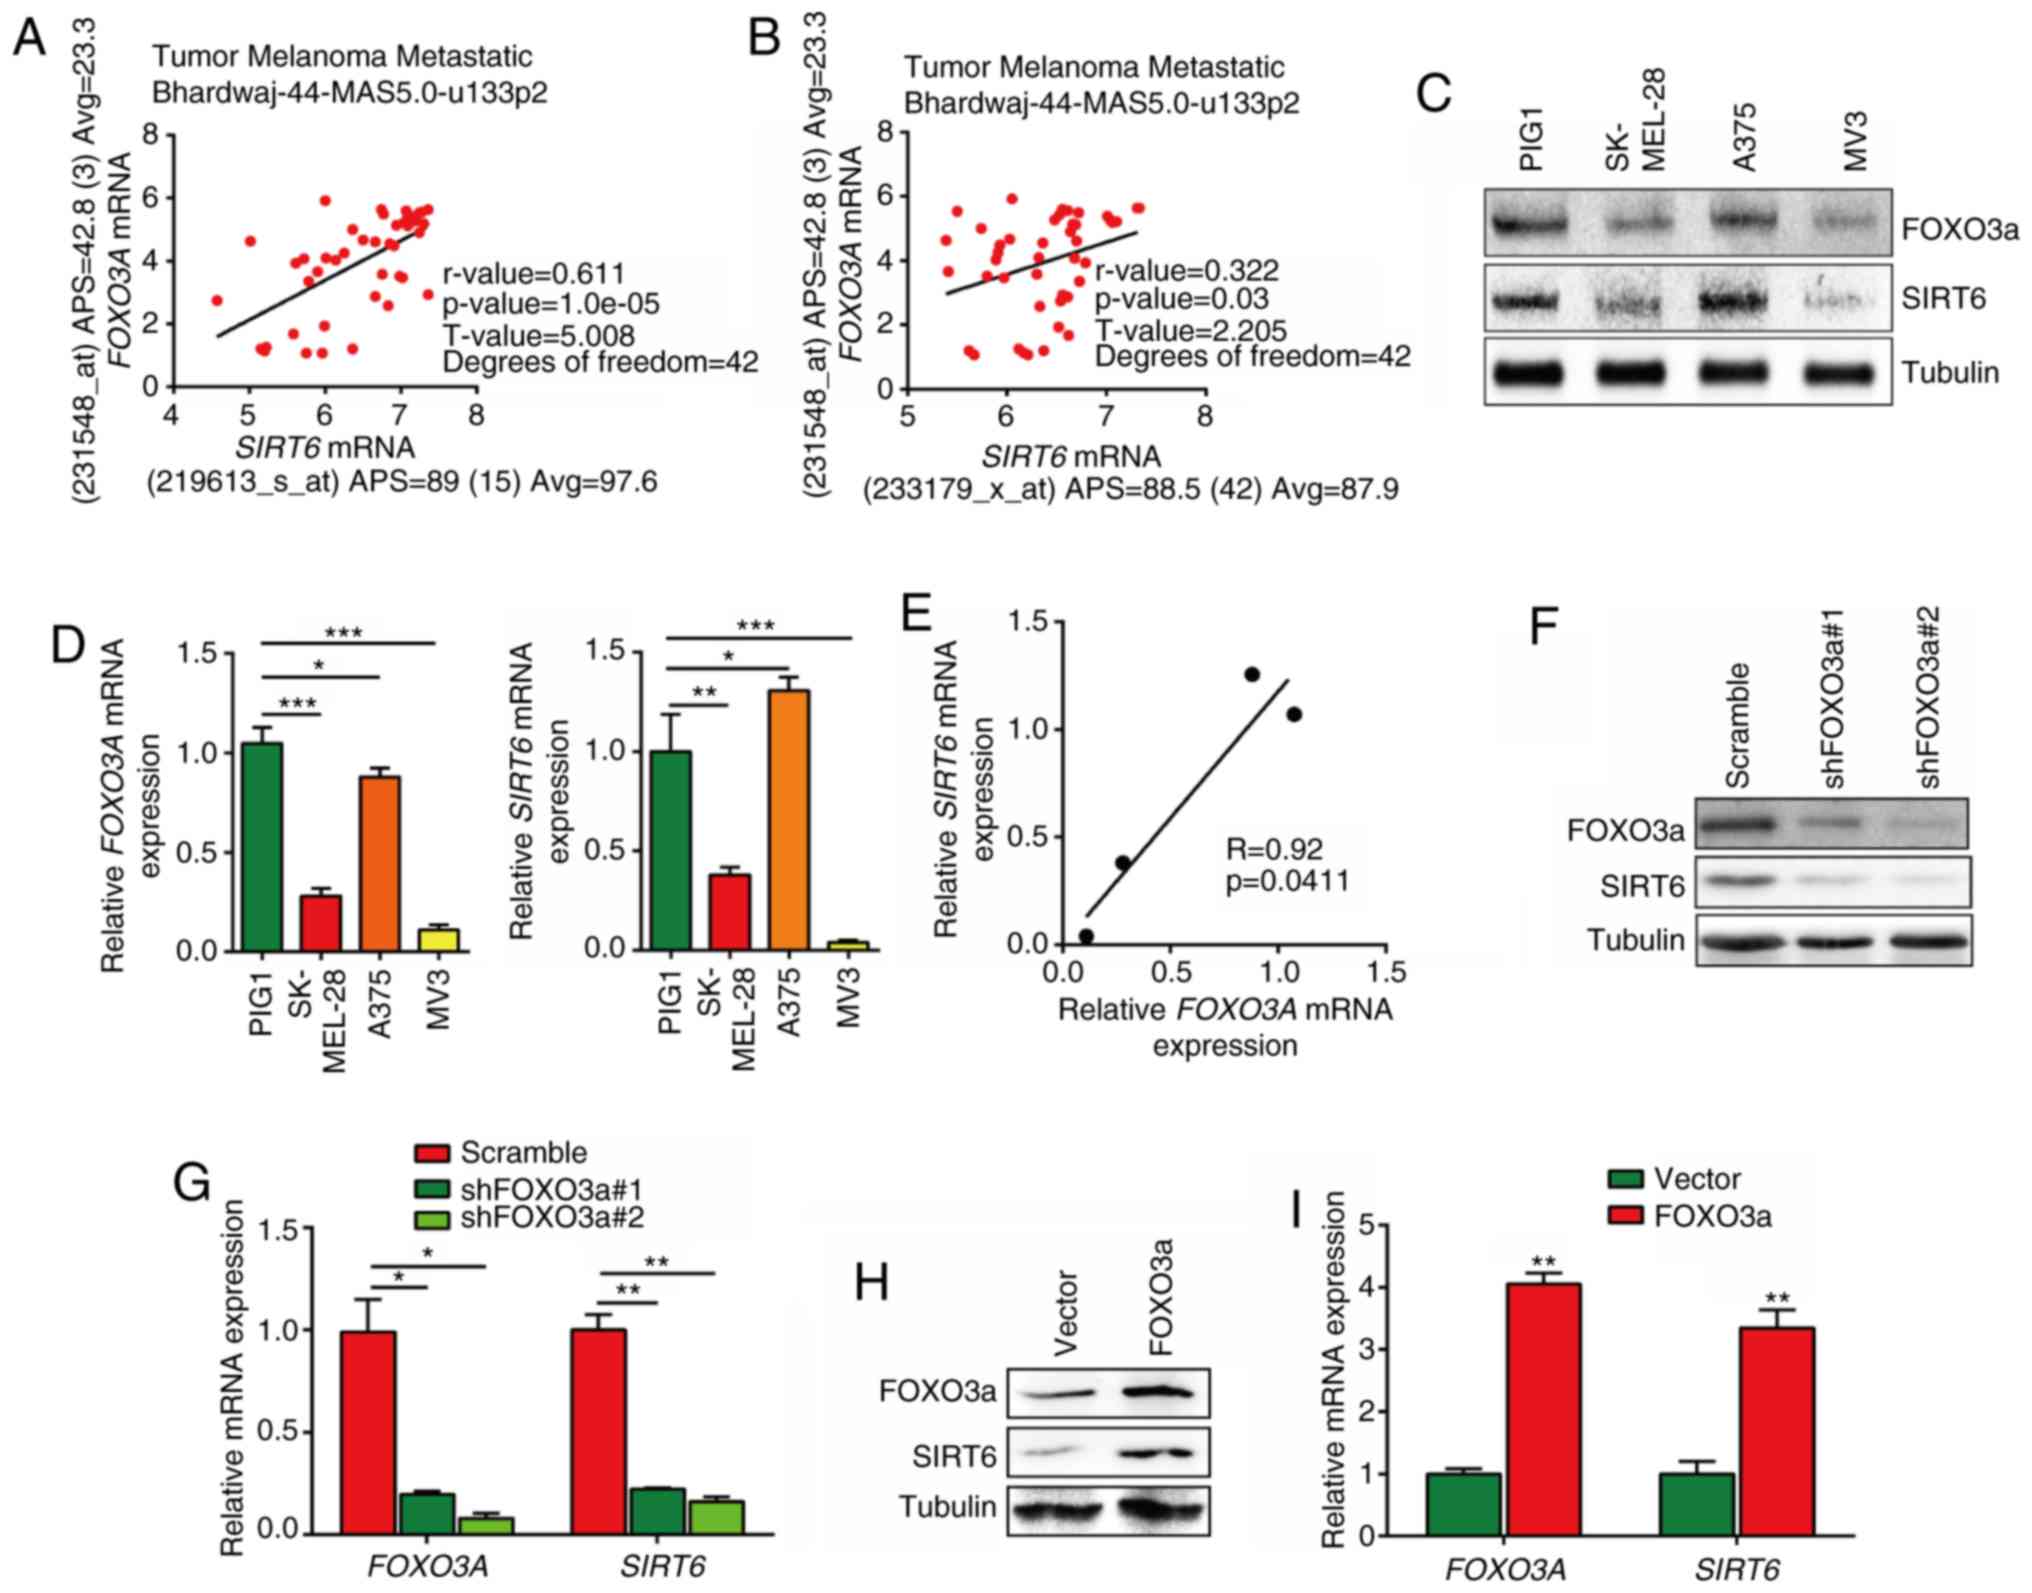 | Figure 2FOXO3a transcriptionally regulates
the expression of SIRT6 in melanoma. (A and B) Correlation
of FOXO3A expression and SIRT6 expression in a
melanoma cohort detected using different SIRT6 probes. (C)
Western blotting was performed to detect the protein expression of
FOXO3a and SIRT6 in PIG1 normal melanocytes and 3 different
melanoma cell lines. (D) RT-qPCR was used to detect the mRNA
expression of FOXO3A and SIRT6 in 4 different cell
lines. One-way ANOVA followed by Dunnett's test was performed to
compare the mean of melanoma cell group with PIG1 melanocytes.
*P<0.05, **P<0.01, ***P<0.001 vs.
PIG1. (E) Correlation of FOXO3A mRNA expression and SIRT6
expression in 4 different cell lines. (F) Expression of FOXO3a and
SIRT6 as detected via western blotting in MV3 cells after FOXO3a
silencing. (G) Relative expression of FOXO3A and
SIRT6 detected via RT-qPCR in MV3 cells after FOXO3a
silencing. *P<0.05, **P<0.01 vs.
Scramble. (H) Expression of FOXO3a and SIRT6 detected via western
blotting in MV3 cells after FOXO3a overexpression. (I) Relative
expression of FOXO3A and SIRT6 detected via RT-qPCR
in MV3 cells after FOXO3a overexpression. **P<0.01
vs. Vector. (J) Overview of insert fragments in pGL3 vectors used
in dual-luciferase assays and ChIP primers designed based on the
promoter of the human SIRT6 gene. Firefly luciferase/Renilla
luciferase (F-luc/R-luc) was shown. SIRT6 promoter
(different regions) activity was detected by dual-luciferase assays
in MV3 cells. One-way ANOVA followed by Tukey's test was performed
to compare groups. ***P<0.001. (K and L) CHIP RT-qPCR
assay was used to detect the enrichment of FOXO3a in the promoter
region of SIRT6 in MV3 cells. **P<0.01 vs.
IgG. n.s., not significant. (M) Logo for FOXO3a in Mus
musculus and Homo sapiens was downloaded from the JASPER
website. (N) Prediction of FOXO3a binding site in the −2,083 to
−1,859 bp region of the SIRT6 promoter. Then, WT and Mut
versions of this sequence were inserted into luciferase vectors.
(O) SIRT6 promoter (−2,128 to −914, −2,083 to −1,859 WT and
−2,083 to −1,859 Mut) activity was detected by dual-luciferase
assay in MV3 cells. ***P<0.001 vs. −2128 to −914.
FOXO3a, forkhead box O3; SIRT6, sirtuin 6; RT-qPCR, reverse
transcription-quantitative PCR; ChIP, chromatin
immunoprecipitation; F-luc, firefly luciferase; R-luc,
Renilla luciferase; sh, short hairpin (RNA); WT, wild-type;
Mut, mutant |
A previous study reported that FOXO3a regulated the
transcription of SIRT6 by binding and activating nuclear
respiratory factor 1 (NRF1) in the mouse (34). However, the promoter of human
SIRT6 was not similar with the promoter in mouse
SIRT6. No NRF1-binding sites (5′AGG GCG CAT GCG CCC TC3′)
were identified in the promoter regions (−2,500 to 0 bp) of human
SIRT6, implying that FOXO3a may regulate the transcription
of SIRT6 through another mode of action (data not shown).
The promoter region (−2,500 to 0 bp) of mouse SIRT6 and the
promoter region (−2,500 to 0 bp) of human SIRT6 were
analyzed by using the online Bl2seq tool in the SilkDB. The results
showed that there were several similar DNA sequences in both
promoters (Fig. 2J). It was
hypothesized that the binding sites of FOXO3a in the promoter
region of SIRT6 may be conserved in mammals. Therefore, these DNA
sequences may be candidate binding sites. Therefore, several
regions (0.1, 0.2, 0.6, 1.2 and N0.9 k) were cloned from the
promoter of human SIRT6 and constructed into pGL3 vectors
(Fig. 2J). A dual-luciferase assay
showed that only the −2,128 to −1,514 bp region exhibited
significant activity compared with other regions (Fig. 2J). As there were four candidate
binding sites for FOXO3a in this region, ChIP RT-qPCR assays were
used to detect the precise binding site. The results showed that
FOXO3a exhibited significant enrichment in the −2,083 to −1,859 bp
region, with no enrichment in the −1,852 to −1,746 bp region
(Fig. 2K and L). Then, the −2,083
to −1,859 bp region was analyzed in the JASPER website. The profile
of FOXO3a in Mus musculus and Homo sapiens (Fig. 2M) was used to find the specific
binding site in the −2,083 to −1,859 bp region of the SIRT6
promoter. It was shown that there was a predicted site sequence
(5′GGTAAATA3′) that was highly similar to the FOXO3a binding
profile (Fig. 2N). Then, wild-type
(WT) and Mut sequences of this region were synthesized and cloned
into a pGL3 vector (Fig. 2N). A
luciferase activity assay revealed that −2,083 to −1,859 WT showed
a similar level of promoter activity as the −2,128 to −914 bp
region, whereas −2,083 to −1,859 Mut significantly decreased
promoter activity (Fig. 2O). These
results indicated that FOXO3a regulated SIRT6 expression in
human melanoma cells via a transcriptional manner that is distinct
from that in the mouse.
FOXO3a is negatively correlated with
aerobic glycolytic genes in melanoma cohorts
SIRT6 is a major regulator of aerobic glycolysis
(26), which is an important cause
of tumor progression. Whether FOXO3a also contributed to the
aerobic glycolysis in melanoma was explored. By analyzing data from
clinical databases, the results showed that FOXO3A mRNA
expression was negatively correlated with the expression of a
cluster of genes that participate in aerobic glycolysis, such as
hexokinase 1 (HK1), HK3, phosphofructokinase (PFK)
muscle, PFK fructobiphosphatase 3, pyruvate kinase isozyme
(PKM) and LDHA (Figs.
3A-F and S2A-O). Notably, the
majority of these genes are also targets of SIRT6 (35). These results implied that
FOXO3a-SIRT6 may be a major regulator controlling the expression of
these glycolytic genes in melanoma.
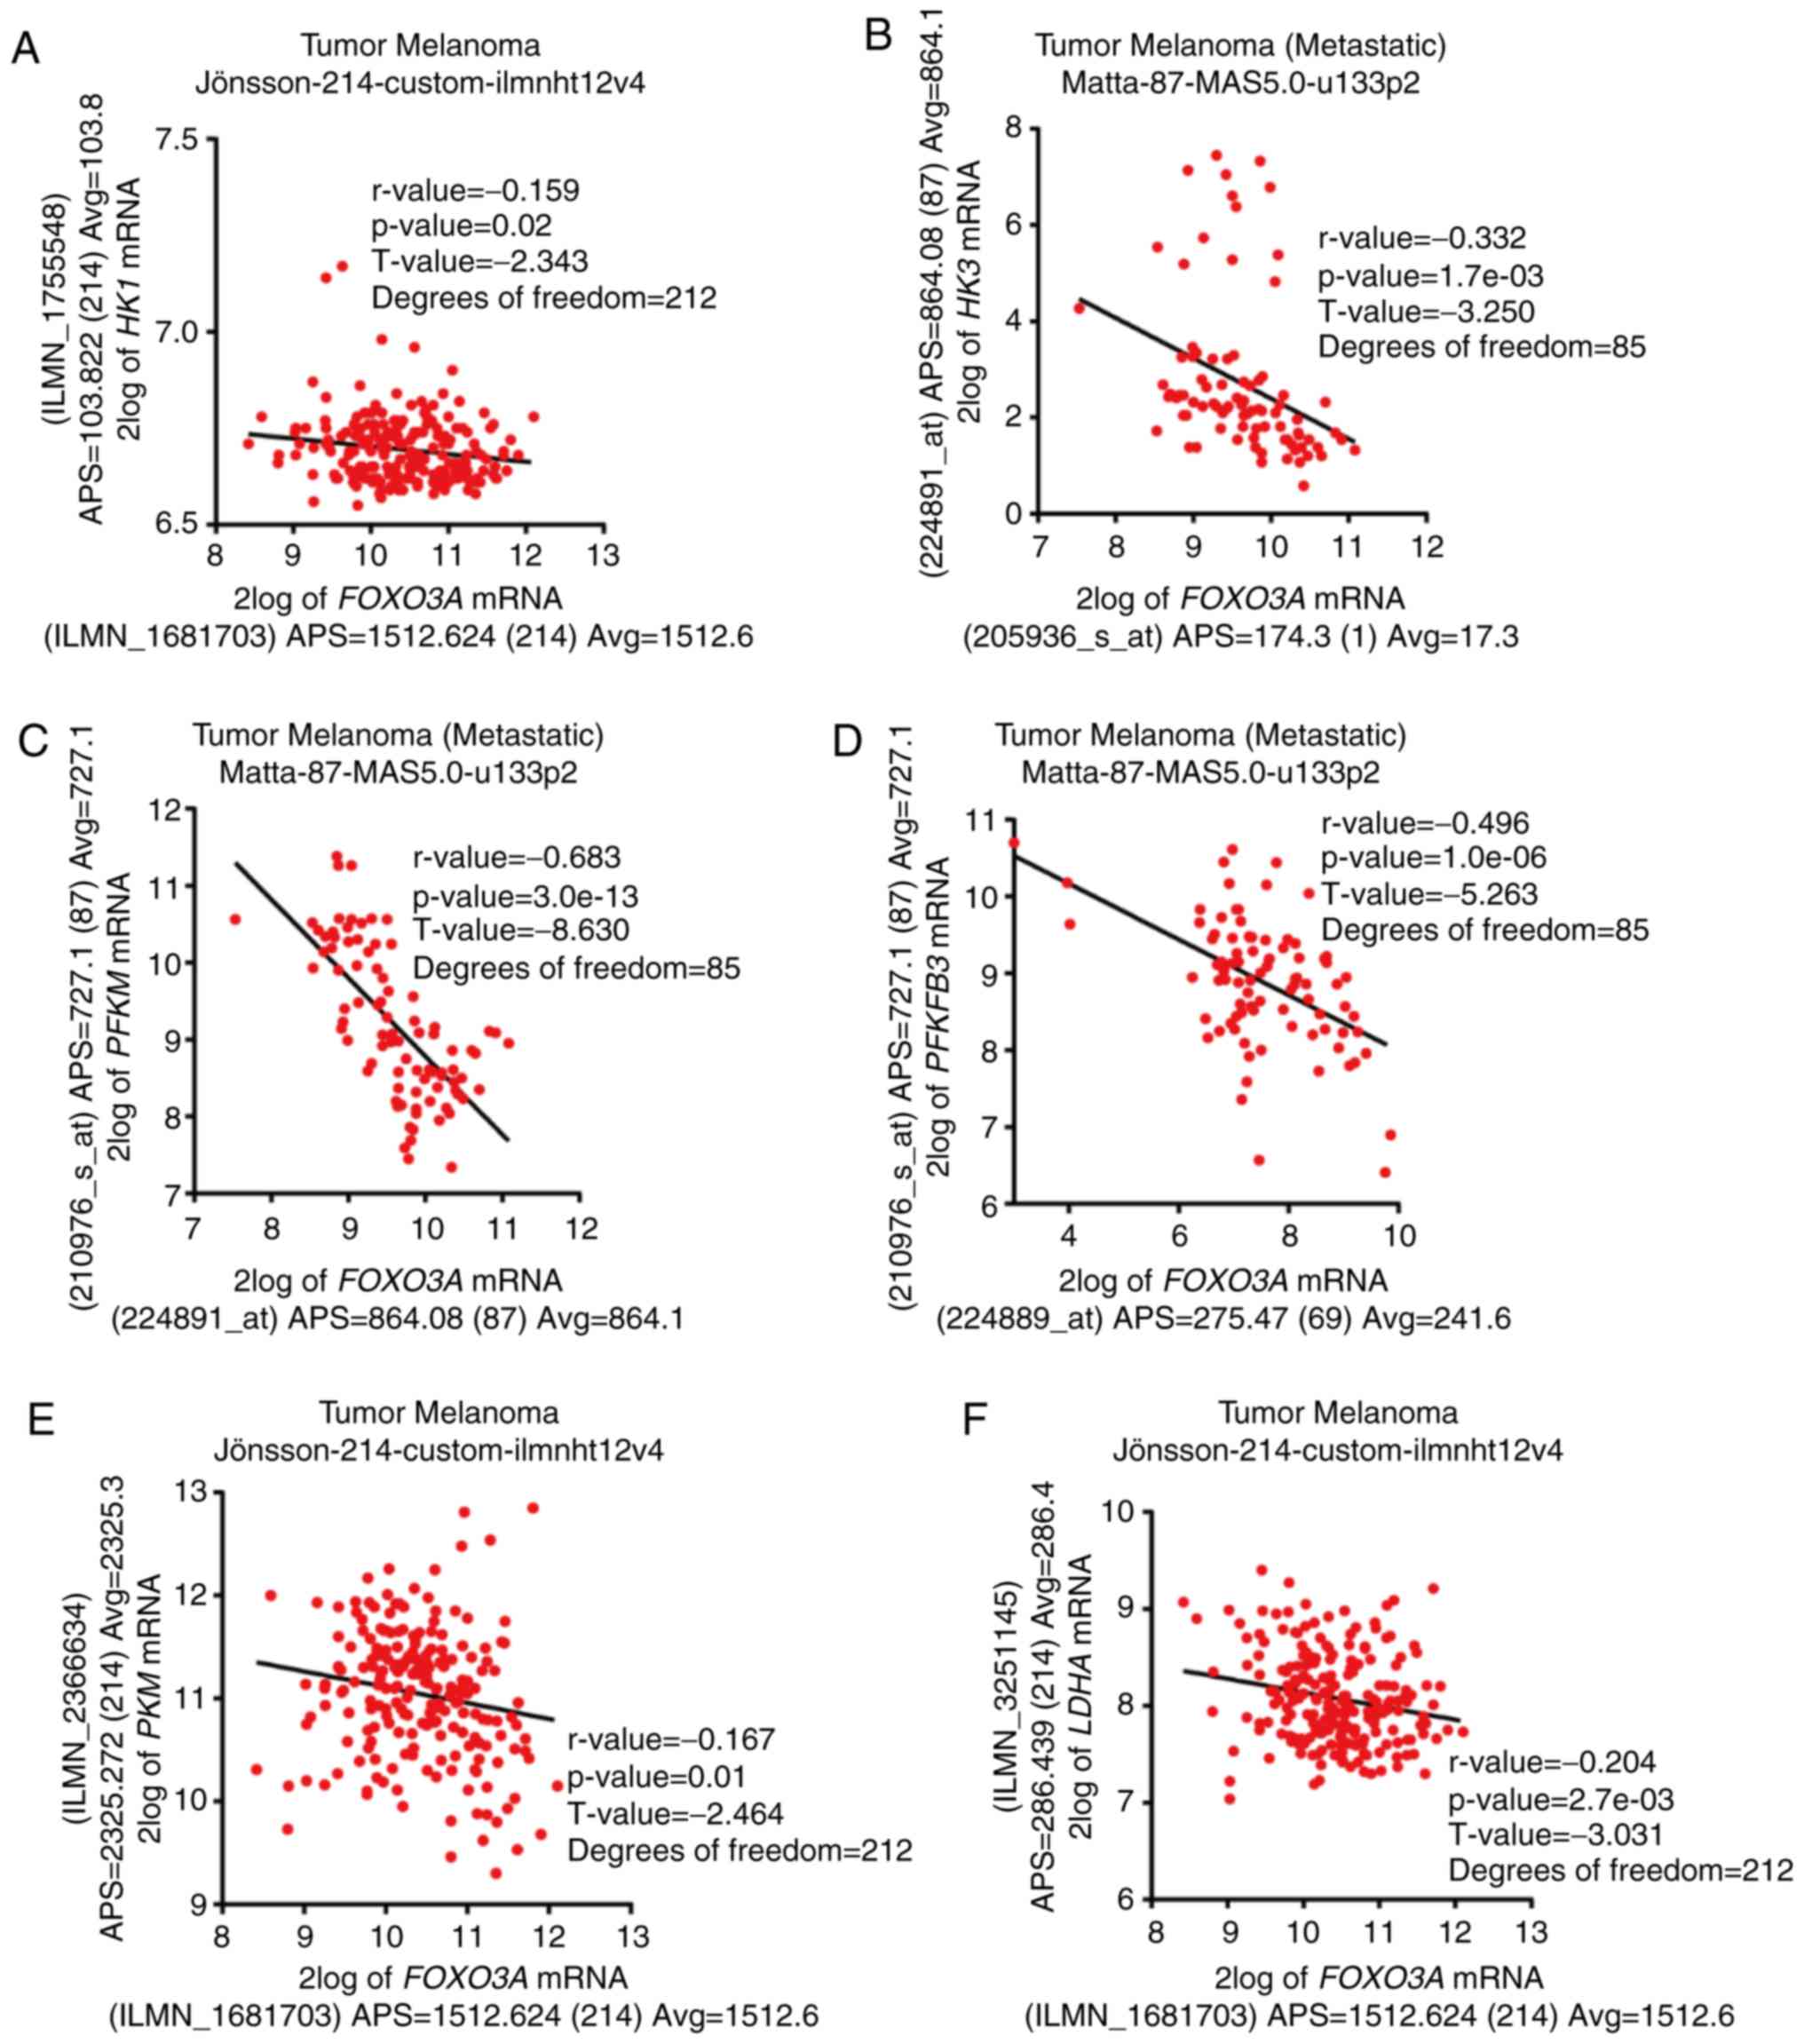 | Figure 3FOXO3a is negatively
correlated with aerobic glycolysis-associated genes in melanoma
cohorts. Correlation of FOXO3A expression and the expression
of glycolysis genes, including (A) HK1, (B) HK3, (C)
PFKM, (D) PFKFB3, (E) PKM and (F) LDHA
in melanoma cohorts. HK, hexokinase; PFK,
phosphofructokinase; PFKM, PFK muscle; PFKFB3, PFK
fructobiphosphatase 3; PKM, pyruvate kinase isozyme;
LDHA, lactate dehydrogenase A. |
SIRT6 overexpression rescues FOXO3a
deficiency-induced upregulation of aerobic glycolysis
To validate the hypothesis that FOXO3a-SIRT may
regulate glycolysis in melanoma cells, SIRT6 was overexpressed
using a SIRT6 overexpression vector (Fig. 4A and B) in FOXO3a-silenced MV3
cells (Fig. 4C and D). The results
revealed that FOXO3a silencing induced upregulation of a cluster of
glycolytic genes, including glucose transporter 4
(GLUT4), GLUT1, HK1, HK2, HK3, GAPDH, PFK1, PKM2,
lactate dehydrogenase A1 (LDHA1) and LDHA2 (Fig. 4D). However, this effect was rescued
by overexpression of SIRT6 (Fig.
4D). Additionally, FOXO3a silencing markedly promoted glucose
uptake in MV3 cells (Fig. 4E).
Consistently, FOXO3a-induced glucose uptake was also recovered by
SIRT6 overexpression (Fig. 4E).
Then, the glucose consumption, lactate production and LDH activity
of MV3 cells were detected. The results showed that FOXO3a
silencing upregulated aerobic glycolysis, whereas SIRT6
overexpression rescued this effect (Fig. 4F-H). The glycolytic flux test was
performed using a Seahorse XFp analyzer in FOXO3a-silenced MV3
cells after SIRT6 restoration, with the results showing that
glycolytic flux was notably increased after FOXO3a silencing,
whereas SIRT6 overexpression returned glycolytic flux to the levels
of the control group (Fig. 4I).
These results indicated that the FOXO3a-SIRT6 axis serves an
important role in controlling the aerobic glycolysis of melanoma
cells.
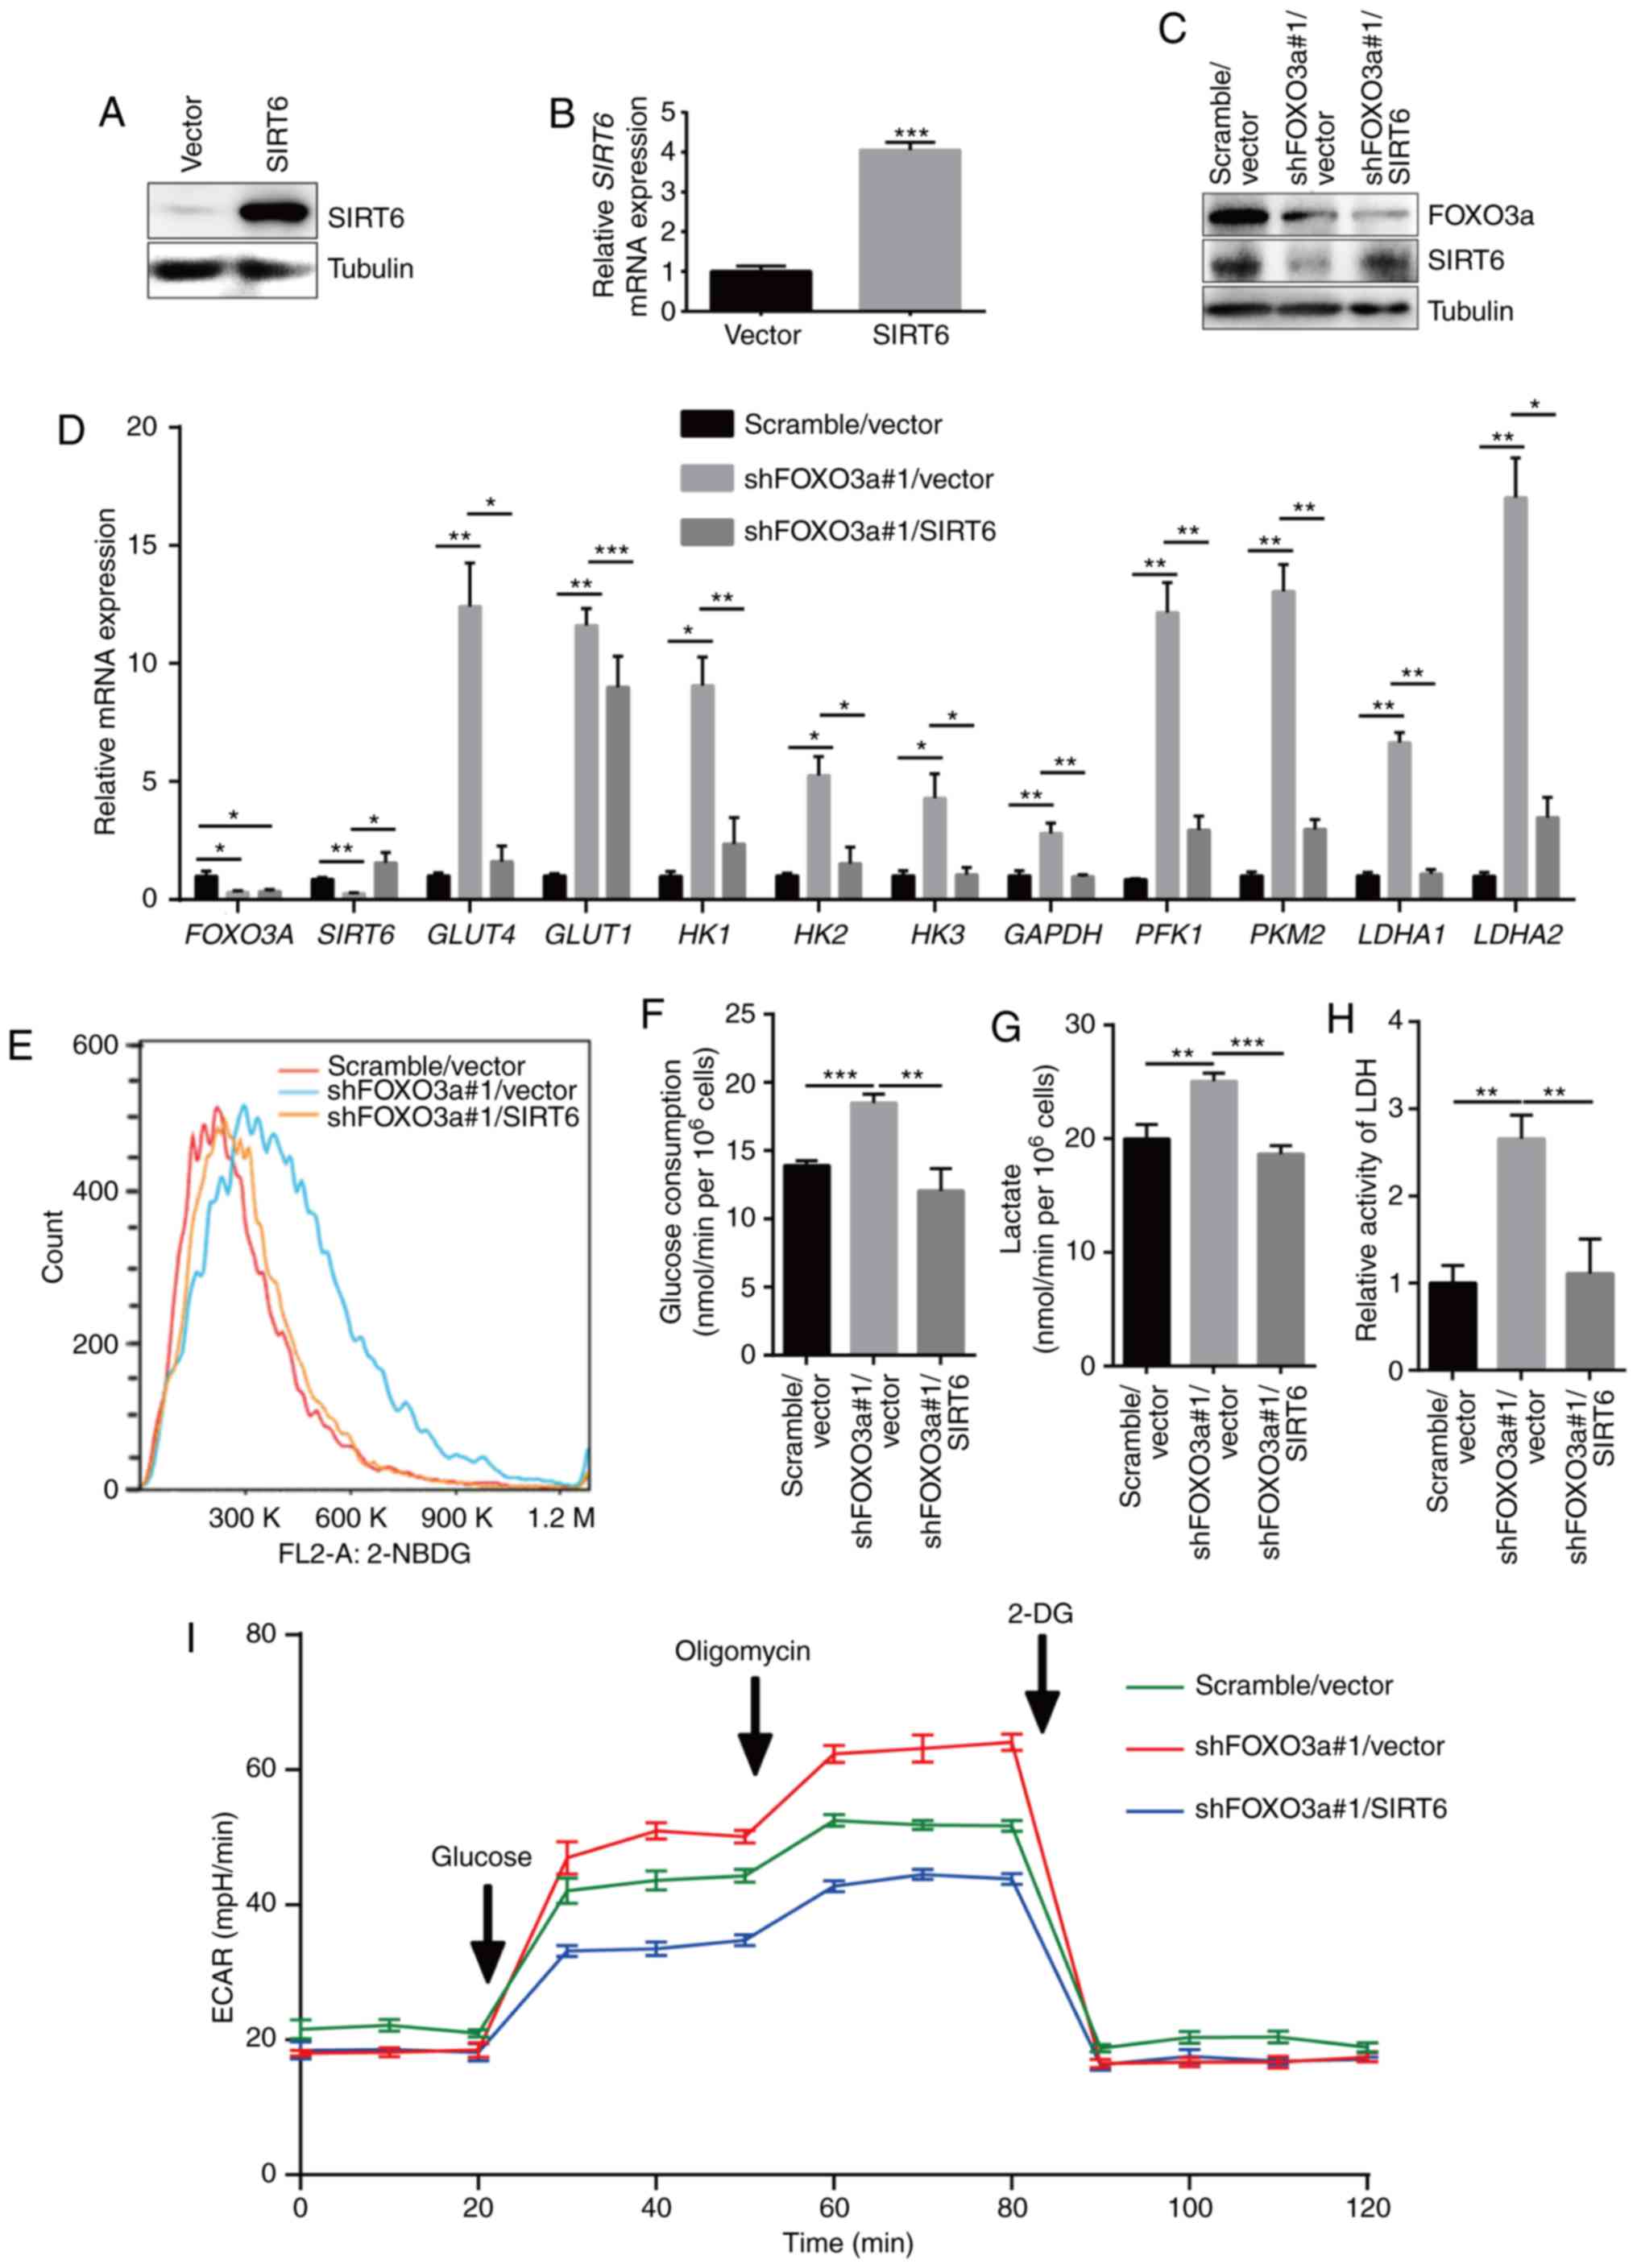 | Figure 4SIRT6 overexpression rescues FOXO3a
deficiency-induced upregulation of aerobic glycolysis. SIRT6
overexpression was confirmed via (A) western blot and (B) RT-qPCR
analyses in MV3 cells infected with SIRT6 overexpression vector.
(C) Western blotting was used to detect the protein expression of
FOXO3a and SIRT6 in FOXO3a-silenced MV3 cells after SIRT6
restoration. (D) Relative expression of SIRT6 target
glycolysis-associated genes as determined via RT-qPCR in
FOXO3a-silenced MV3 cells following SIRT6 restoration. (E) Glucose
uptake detected by flow cytometry in FOXO3a-silenced MV3 cells
after SIRT6 restoration. (F) Glucose consumption detected in
FOXO3a-silenced MV3 cells after SIRT6 restoration. (G) Lactate
production detected using a lactate assay kit in FOXO3a-silenced
MV3 cells after SIRT6 restoration. (H) LDH activity detected using
an LDH assay kit in FOXO3a-silenced MV3 cells after SIRT6
restoration. (I) Glycolytic stress flux test was conducted by using
a Seahorse XF analyzer in FOXO3a-silenced MV3 cells after SIRT6
restoration. *P<0.05, **P<0.01,
***P<0.001. FOXO3a, forkhead box O3; SIRT6, sirtuin
6; RT-qPCR, reverse transcription-quantitative PCR; HK,
hexokinase; GLUT, glucose transporter; PFK1,
phosphofructokinase 1; PKM2, pyruvate kinase isozyme 2;
LDHA, lactate dehydrogenase A; LDH, lactate dehydrogenase;
sh, short hairpin (RNA); 2-NBDG,
2-Deoxy-2-[(7-nitro-2,1,3-benzoxadiazol-4-yl)amino]-D-glucose;
ECAR, extracellular acidification rate; 2-DG,
2-deoxy-D-glucose. |
SIRT6 downregulation retrieves FOXO3a
overexpression-induced decrease of aerobic glycolysis
To further validate these results, SIRT6 was knocked
down using a SIRT6 shRNA (Fig. 5A and
B) in FOXO3a-overexpressing MV3 cells (Fig 5C and D). The results showed that
SIRT6 silencing rescued the FOXO3a overexpression-induced
downregulation of glycolytic genes, decrease in glucose uptake,
decline in glucose consumption, reduction of lactate production,
attenuation of LDH activity and upregulation of glycolytic flux
(Fig. 5E-I). These results further
indicated that the FOXO3a-SIRT6 axis was a major regulator of
cellular metabolism in melanoma cells.
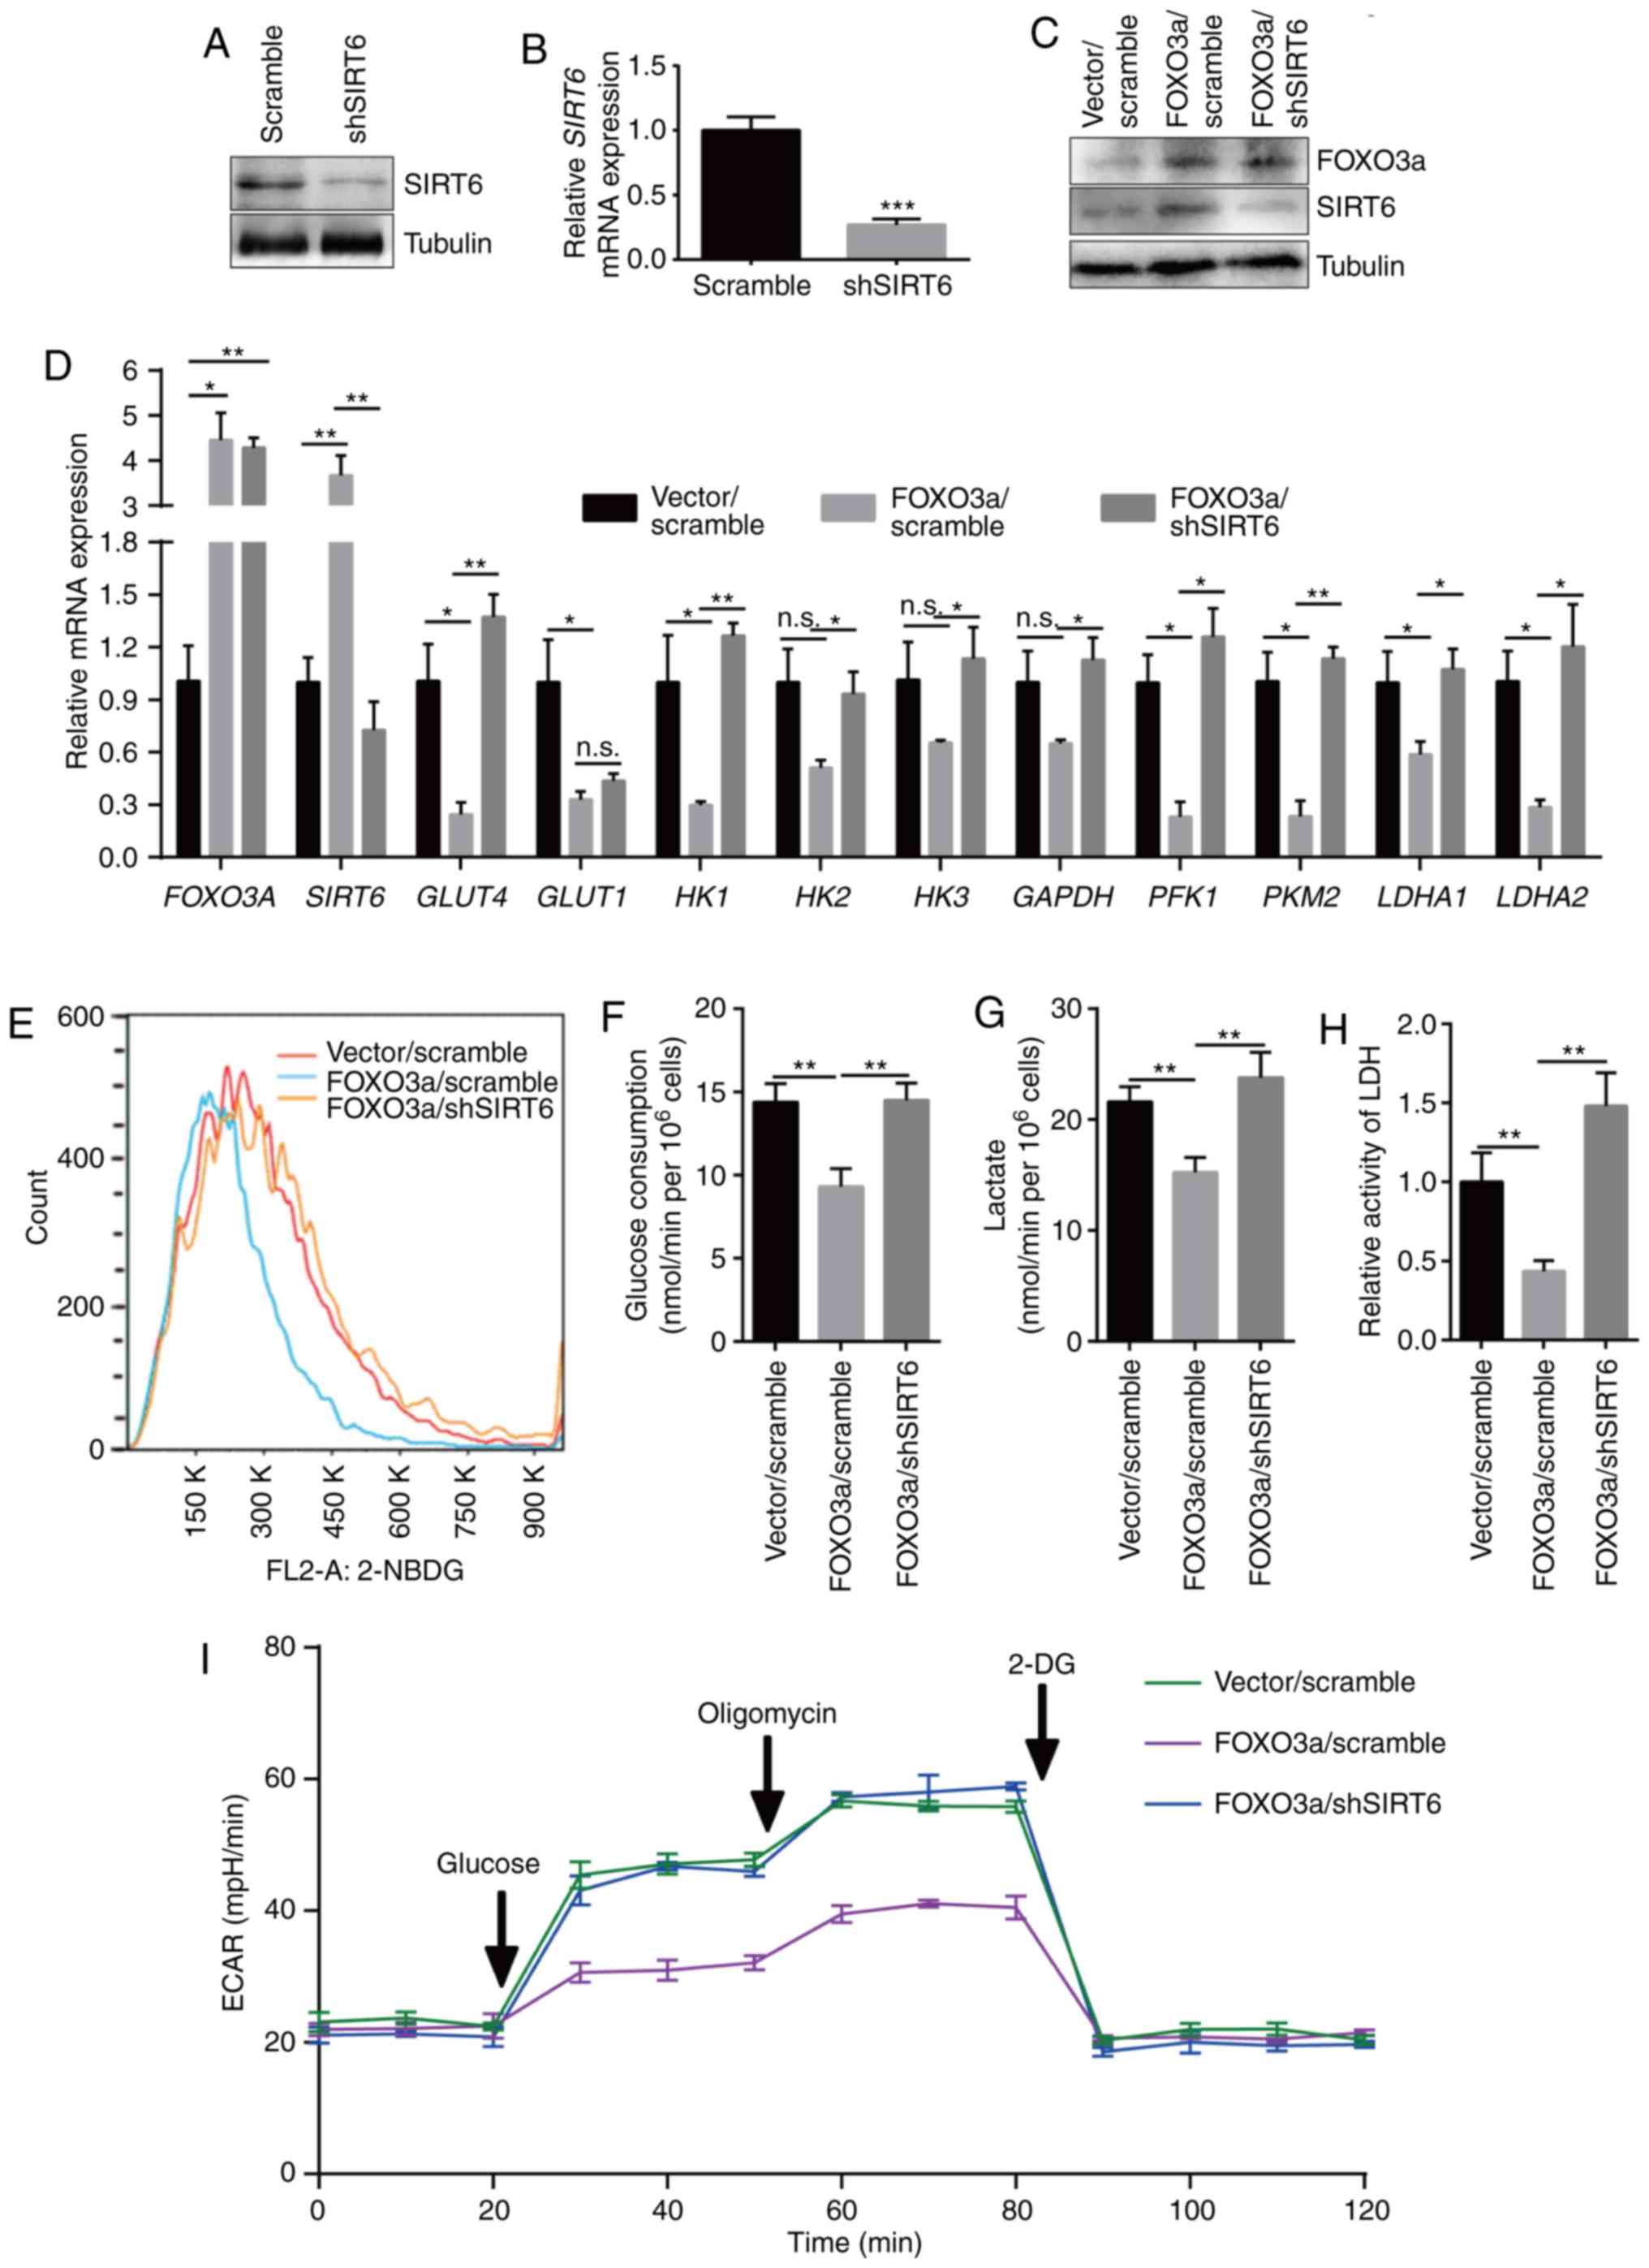 | Figure 5SIRT6 downregulation rescues FOXO3a
overexpression-induced downregulation of aerobic glycolysis. SIRT6
knockdown was confirmed via (A) western blotting and (B) RT-qPCR in
MV3 cells infected with shSIRT6. (C) Western blotting was used to
detect the protein expression of FOXO3a and SIRT6 in
FOXO3a-overexpressing MV3 cells after SIRT6 silencing. (D) Relative
expression of SIRT6 target glycolysis-associated genes detected by
RT-qPCR in FOXO3a-overexpressing MV3 cells after SIRT6 silencing.
(E) Glucose uptake detected by flow cytometry in the 2-NBDG-treated
FOXO3a-overexpressing MV3 cells after SIRT6 silencing. (F) Glucose
consumption detected in FOXO3a-overexpressing MV3 cells after SIRT6
silencing. (G) Lactate production detected using a lactate assay
kit in FOXO3a-overexpressing MV3 cells after SIRT6 silencing. (H)
LDH activity detected using an LDH assay kit in
FOXO3a-overexpressing MV3 cells after SIRT6 silencing. (I)
Glycolytic stress flux test was conducted by using a Seahorse XF
analyzer in FOXO3a-overexpressing MV3 cells after SIRT6 silencing.
*P<0.05, **P<0.01,
***P<0.001. n.s., not significant. FOXO3a, forkhead
box O3; SIRT6, sirtuin 6; RT-qPCR, reverse
transcription-quantitative PCR; HK, hexokinase; GLUT,
glucose transporter; PFK1, phosphofructokinase 1;
PKM2, pyruvate kinase isozyme 2; LDHA, lactate
dehydrogenase A; LDH, lactate dehydrogenase; sh, short hairpin
(RNA); 2-NBDG, 2-Deoxy-2-[(7-nitro-2,1,3-benzoxadiazol-4-yl)
amino]-D-glucose; ECAR, extracellular acidification rate; 2-DG,
2-deoxy-D-glucose. |
FOXO3a-SIRT6 axis contributes to melanoma
cell viability in vitro and tumorigenicity in vivo
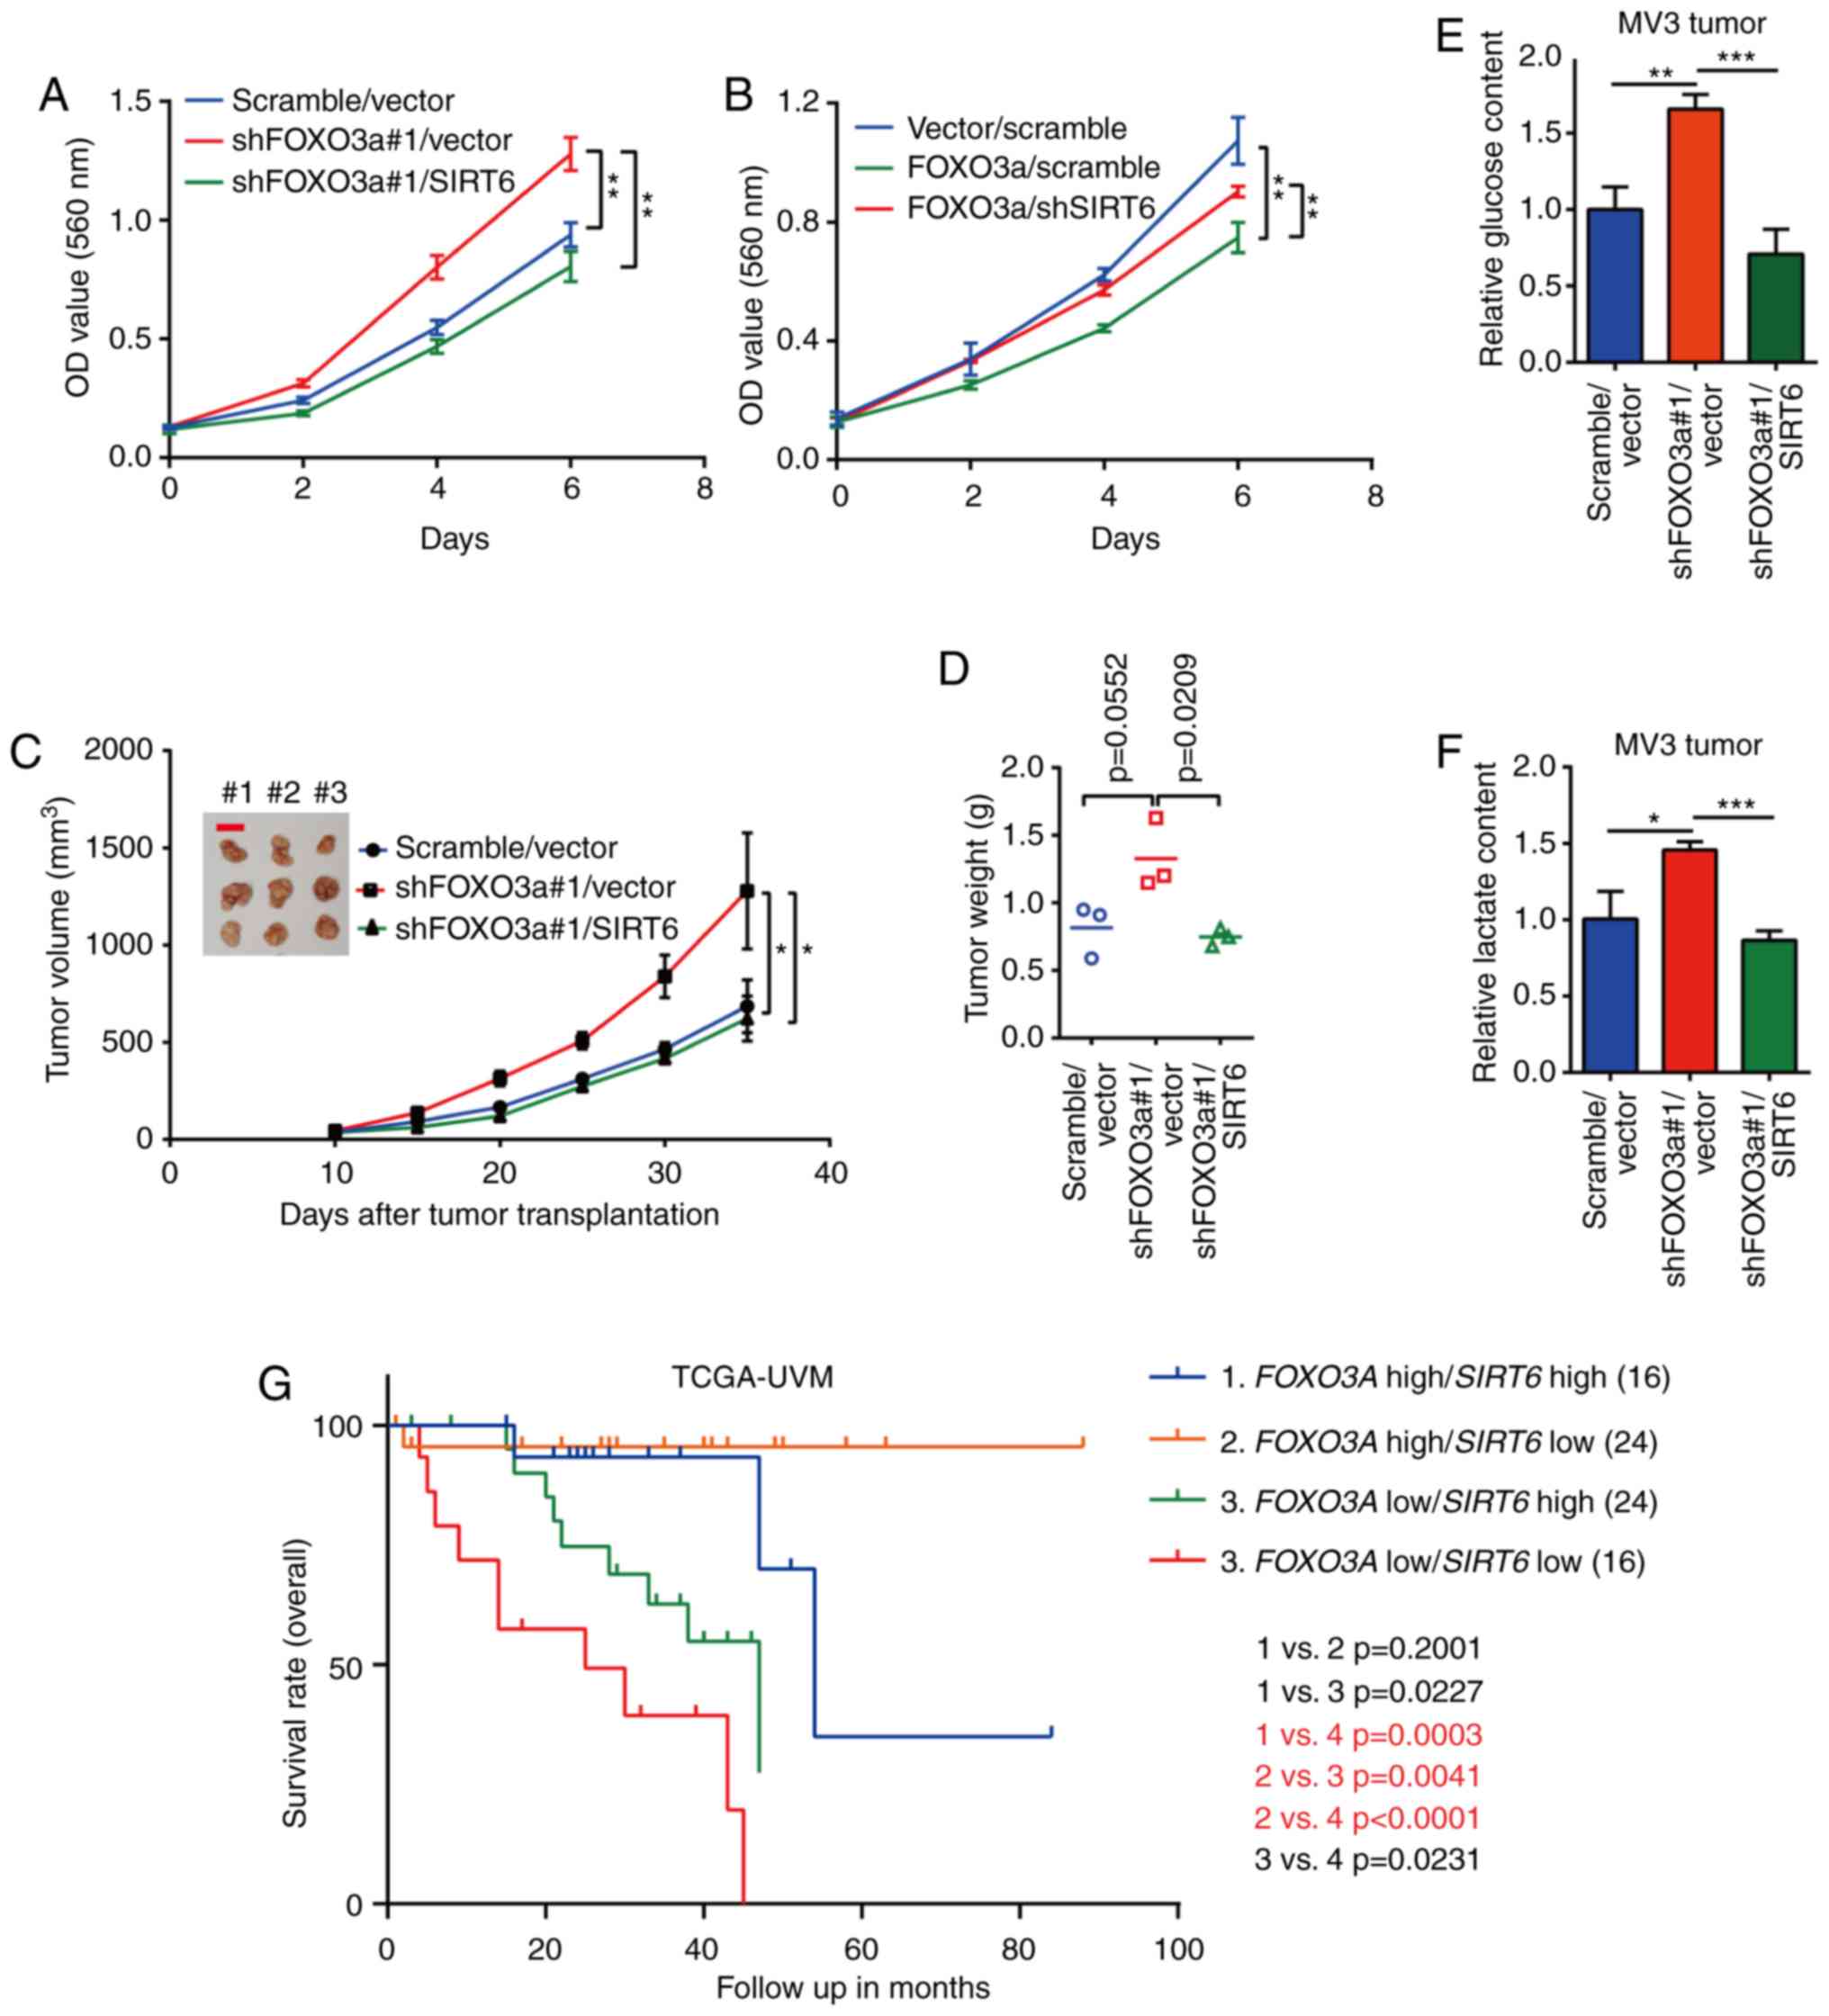
The effect of this regulatory axis on the viability
of melanoma cells was subsequently investigated in vitro.
MTT assays showed that FOXO3a silencing promoted cell viability,
whereas FOXO3a overexpression inhibited cell viability (Fig. 6A and B). Furthermore, SIRT6
overexpression and silencing rescued the effects on cell viability
induced by FOXO3a silencing and overexpression, respectively
(Fig. 6A and B). Subsequently, a
xenograft nude mouse model was employed to confirm the effect of
the FOXO3a-SIRT6 axis on the growth of MV3 cells in vivo.
The results showed that FOXO3a silencing promoted tumor growth
in vivo, whereas SIRT6 restoration rescued the effect of
FOXO3a silencing (Fig. 6C and D).
Then, the glucose and lactate contents of tumors were detected, and
the results showed that the contents of glucose and lactate were
significantly increased in FOXO3a-silenced tumors; however, this
effect was attenuated by SIRT6 restoration (Fig. 6E and F). To further validate the
role of the FOXO3a-SIRT6 axis using clinical data, a cohort from
the TCGA melanoma database was analyzed. The results showed that
FOXO3a high/SIRT6 high co-expression predicted the best overall
survival rate, whereas the FOXO3a low/SIRT6 low subgroup exhibited
the worst prognosis (Fig. 6G).
These results indicated that the FOXO3a-SIRT6 regulatory axis is an
important regulator in cellular metabolism and tumor growth of
melanoma cells both in vitro and in vivo.
Discussion
Previous studies have reported that FOXO3a is a
downstream factor of PI3K/AKT that inhibits the survival, growth,
migration and invasion of uveal melanoma cells, as well as inducing
cell cycle arrest at G1 phase and apoptosis by transcriptionally
regulating the expression of its downstream genes, including
Bcl-2-like protein 11, cyclin-dependent kinase inhibitor 1B,
survivin and cyclin D1 (21,23,24,36).
Furthermore, FOXO3a triple mutant overexpression sensitized
melanoma cells to apoptosis induced by temozolomide (22). These previous indicated that FOXO3a
plays important roles in the development of melanoma.
In the present study, it was found that high FOXO3a
expression predicted improved prognosis for patients with melanoma.
Additionally, FOXO3a expression was associated with the malignancy
of melanoma. These results were consistent with previous reports.
However, in addition to transcriptionally regulated genes related
to cell cycle and apoptosis (21,23,24,36),
there was an alternative mechanism for FOXO3a in the development of
melanoma; it was observed that FOXO3a regulated aerobic glycolysis
by regulating the expression of SIRT6, which is recognized as a
major regulator of cellular metabolism in cancer (8).
Aerobic glycolysis is an important feature of
melanoma; in normoxia, melanoma cells with varying heterogeneity
typically display highly glycolytic phenotypes, in which 60-80% of
glucose is metabolized into lactate (37). BRAF(V600E) oncogene, a major driver
in the tumorigenesis of melanoma, has been shown to promote aerobic
glycolysis (38). This highly
glycolytic phenotype is characterized by high expression of
glycolysis-associated genes that encode glucose transporters and
enzymes involved in aerobic glycolysis. For example, in melanoma,
high expression levels of glycolytic proteins such as GAPDH and
PKM2 were associated with worse clinical outcome in stage III
melanoma (39,40). Additionally, GLUT1 was highly
expressed in melanoma tissues and revealed to enhance the
metastasis of malignant melanoma cells (41). In stage IV melanomas with high
serum LDH, glycolysis is the principle source of energy (42). These findings indicate that
modulating aerobic glycolysis may be a promising approach to treat
melanoma. In the present study, it was shown that FOXO3A
expression in several cohorts of patient with melanoma was
negatively correlated with the expression of a cluster of
glycolysis-associated genes, including HK1, HK3, PFKM, PFKFB3,
PKM and LDHA.
It was revealed that FOXO3a was positively
correlated with the expression of a major glycolysis regulator,
SIRT6, a histone deacetylase. SIRT6 can regulate the
expression of various glycolysis-associated genes, including
GLUT1, PDK4, PDK1, ALDOC, PFK1, LDHB, LDHA, TPI5 and
GAPDH by directly deacetylating histone 3 lysine 9;
meanwhile, SIRT6 also represses the transcriptional activity of
HIF1α and Myc, transcription factors that also regulate genes
associated with glycolysis (35,43,44).
The critical function of SIRT6 in the modulation of aerobic
glycolysis has been reported in numerous tumors, such as breast
cancer (45), urothelial carcinoma
(46) and hepatocellular carcinoma
(47). However, to our knowledge,
the function of SIRT6-regulated glycolysis had not previously been
explored in melanoma.
In the present study, it was found that FOXO3a
could transcriptionally promote the expression of SIRT6. The
detailed mechanism of FOXO3-regulated SIRT6 expression in humans
varies from that previously reported in mice. In mice, the
transcription factor NRF1 regulates the transcription of
SIRT6, whereas FOXO3a only functions as a co-promoter
(34). However, no binding sites
for NRF1 were observed in the promoter region of the human
SIRT6 promoter. Conversely, it was demonstrated that FOXO3a
functioned as a direct transcription factor that targeted the
promoter of SIRT6. Recently, a similar mechanism has also
been reported in a study in colon cancer (48).
To elucidate the critical function of the
FOXO3a-SIRT6 axis in the regulation of glycolysis and tumor growth
in melanoma, SIRT6 was overexpressed in FOXO3a-silenced MV3 cells
and SIRT6 was knocked down in FOXO3a-overexpressing MV3 cells.
Then, glucose uptake and consumption, lactate production, LDH
activity, glycolytic gene expression and cell viability were
evaluated in vitro, and tumor growth was investigated in
vivo. The results showed that the effects of altered FOXO3a
expression could be rescued by inverse manipulations of SIRT6
expression, indicating that the FOXO3a-SIRT6 axis played a pivotal
role in the modulation of cell metabolism and tumor growth.
However, the function of this axis may vary in different types of
cancers and under different conditions. For example, GLUT1
expression is reduced in the absence of FOXO3a in glioma cells
under serum starvation (49),
implying that FOXO3a has a more complex role in the regulation of
cell metabolism and cell survival.
In conclusion, the present study identified a novel
mechanism for FOXO3a in the suppression of melanoma development.
FOXO3a transcriptionally promoted the expression of SIRT6, which
subsequently suppressed the expression of a number of
glycolysis-associated genes (Fig.
7). The FOXO3a-SIRT6 regulatory axis serves an important role
in modulating cellular metabolism, thereby affecting cancer
development in vitro and in vivo. The present
findings indicated that the FOXO3a-SIRT6 axis may be a therapeutic
target for the treatment of melanoma.
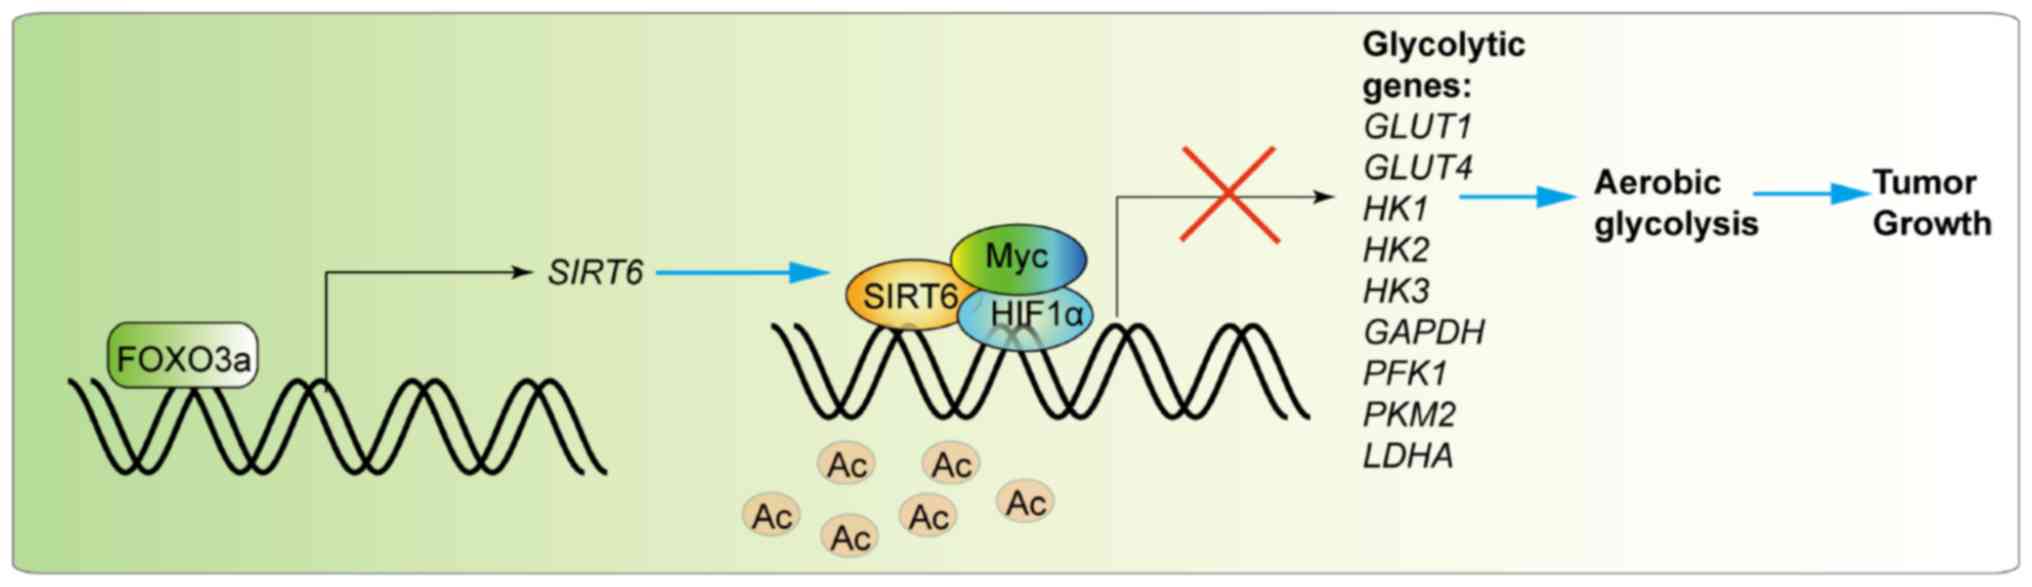 | Figure 7Model of action for the FOXO3a-SIRT6
regulatory axis in the modulation of cell metabolism in melanoma
cells. Briefly, FOXO3a transcriptionally promotes the expression of
SIRT6, which subsequently deacetylates H3K9 in the promoters
of a cluster of glycolysis-associated genes, transcriptionally
suppressing their expression in association with HIF1α or Myc.
FOXO3a, forkhead box O3; SIRT6, sirtuin 6; HIF1α, hypoxia-inducible
factor 1α; Ac, acetyl; HK, hexokinase; GLUT, glucose
transporter; PFK1, phosphofructokinase 1; PKM2,
pyruvate kinase isozyme 2; LDHA, lactate dehydrogenase
A. |
Supplementary Data
Funding
This work was supported by the Project Funded by
Chongqing Special Postdoctoral Science Foundation (grant no.
XmT2018080), the National Key Research and Development Program of
China (grant nos. 2017YFC1308600 and 2016YFC1302204), the National
Natural Science Foundation of China (grant nos. 81672502, 31672496
and 81902664), the Fundamental Research Funds for the Central
Universities (grant no. XDJK2019C013), and the Research and
Innovation Project of Graduate Students in Chongqing (grant no.
CYS19136).
Availability of data and materials
The datasets used and/or analyzed during the
current study are available from the corresponding author on
reasonable request.
Authors' contributions
ZD performed the experiments, acquired the data and
drafted the manuscript. JY, LL, LT and PS performed molecular
biological experiments. JZ, XZ and LG analyzed the data and
performed statistical analysis. ZW and HC conceived and designed
the study, and reviewed/revised the manuscript, figures and tables.
All authors read and approved the final manuscript.
Ethics approval and consent to
participate
The animal experiments in the current study were
approved and supervised by the Institutional Animal Care and Use
Committees of the Southwest University (permit no.
IACUC-20190402-02) and the Experimental Animal Care and Use
Committees of the Institute of Sericulture and Systems Biology. The
study was performed according to the Laboratory Animal Management
Regulations and the Measures of Chongqing Municipality on the
Management of Experimental Animals.
Patient consent for publication
Not applicable.
Competing interests
The authors declare that they have no competing
interests.
Acknowledgments
We thank Mr. Gaichao Zhao (State Key Laboratory of
Silkworm Genome Biology, Southwest University) for his
contributions to the revision of this manuscript.
References
|
1
|
Dimitriou F, Krattinger R, Ramelyte E,
Barysch MJ, Micaletto S, Dummer R and Goldinger SM: The World of
melanoma: Epidemiologic, genetic, and anatomic differences of
melanoma across the globe. Curr Oncol Rep. 20:872018. View Article : Google Scholar : PubMed/NCBI
|
|
2
|
Gray-Schopfer V, Wellbrock C and Marais R:
Melanoma biology and new targeted therapy. Nature. 445:851–857.
2007. View Article : Google Scholar : PubMed/NCBI
|
|
3
|
Hanahan D and Weinberg RA: Hallmarks of
cancer: The next generation. Cell. 144:646–674. 2011. View Article : Google Scholar : PubMed/NCBI
|
|
4
|
Cantor JR and Sabatini DM: Cancer cell
metabolism: One hallmark, many faces. Cancer Discov. 2:881–898.
2012. View Article : Google Scholar : PubMed/NCBI
|
|
5
|
Vander Heiden MG, Cantley LC and Thompson
CB: Understanding the Warburg effect: The metabolic requirements of
cell proliferation. Science. 324:1029–1033. 2009. View Article : Google Scholar : PubMed/NCBI
|
|
6
|
Courtnay R, Ngo DC, Malik N, Ververis K,
Tortorella SM and Karagiannis TC: Cancer metabolism and the Warburg
effect: The role of HIF-1 and PI3K. Mol Biol Rep. 42:841–851. 2015.
View Article : Google Scholar : PubMed/NCBI
|
|
7
|
Dong Z and Cui H: Epigenetic modulation of
metabolism in glioblastoma. Semin Cancer Biol. 57:45–51. 2019.
View Article : Google Scholar
|
|
8
|
Zhu S, Dong Z, Ke X, Hou J, Zhao E, Zhang
K, Wang F, Yang L, Xiang Z and Cui H: The roles of sirtuins family
in cell metabolism during tumor development. Semin Cancer Biol.
57:59–71. 2019. View Article : Google Scholar
|
|
9
|
Gatenby RA and Gillies RJ: Why do cancers
have high aerobic glycolysis? Nat Rev Cancer. 4:891–899. 2004.
View Article : Google Scholar : PubMed/NCBI
|
|
10
|
Paik JH, Kollipara R, Chu G, Ji H, Xiao Y,
Ding Z, Miao L, Tothova Z, Horner JW, Carrasco DR, et al: FoxOs are
lineage-restricted redundant tumor suppressors and regulate
endothelial cell homeostasis. Cell. 128:309–323. 2007. View Article : Google Scholar : PubMed/NCBI
|
|
11
|
Yadav RK, Chauhan AS, Zhuang L and Gan B:
FoxO transcription factors in cancer metabolism. Semin Cancer Biol.
50:65–76. 2018. View Article : Google Scholar : PubMed/NCBI
|
|
12
|
Hornsveld M, Dansen TB, Derksen PW and
Burgering BMT: Re-evaluating the role of FOXOs in cancer. Semin
Cancer Biol. 50:90–100. 2018. View Article : Google Scholar
|
|
13
|
Ma Z, Xin Z, Hu W, Jiang S, Yang Z, Yan X,
Li X, Yang Y and Chen F: Forkhead box O proteins: Crucial
regulators of cancer EMT. Semin Cancer Biol. 50:21–31. 2018.
View Article : Google Scholar : PubMed/NCBI
|
|
14
|
Dong Z, Zhong X, Lei Q, Chen F and Cui H:
Transcriptional activation of SIRT6 via FKHRL1/FOXO3a inhibits the
Warburg effect in glioblastoma cells. Cell Signal. 60:100–113.
2019. View Article : Google Scholar : PubMed/NCBI
|
|
15
|
Shukla S, Shukla M, Maclennan GT, Fu P and
Gupta S: Deregulation of FOXO3A during prostate cancer progression.
Int J Oncol. 34:1613–1620. 2009.PubMed/NCBI
|
|
16
|
Herzog CR, Blake DC Jr, Mikse OR,
Grigoryeva LS and Gundermann EL: FoxO3a gene is a target of
deletion in mouse lung adenocarcinoma. Oncol Rep. 22:837–843. 2009.
View Article : Google Scholar : PubMed/NCBI
|
|
17
|
Jiang L, Cao XC, Cao JG, Liu F, Quan MF,
Sheng XF and Ren KQ: Casticin induces ovarian cancer cell apoptosis
by repressing FoxM1 through the activation of FOXO3a. Oncol Lett.
5:1605–1610. 2013. View Article : Google Scholar : PubMed/NCBI
|
|
18
|
Yu Y, Peng K, Li H, Zhuang R, Wang Y, Li
W, Yu S, Liang L, Xu X and Liu T: SP1 upregulated FoxO3a promotes
tumor progression in colorectal cancer. Oncol Rep. 39:2235–2242.
2018.PubMed/NCBI
|
|
19
|
Ikeda JI, Wada N, Nojima S, Tahara S,
Tsuruta Y, Oya K and Morii E: ID1 upregulation and FoxO3a
downregulation by epsteinbarr virus-encoded LMP1 in Hodgkin's
lymphoma. Mol Clin Oncol. 5:562–566. 2016. View Article : Google Scholar : PubMed/NCBI
|
|
20
|
Ferber EC, Peck B, Delpuech O, Bell GP,
East P and Schulze A: FOXO3a regulates reactive oxygen metabolism
by inhibiting mitochondrial gene expression. Cell Death Differ.
19:968–979. 2012. View Article : Google Scholar :
|
|
21
|
Yu T, Ji J and Guo YL: MST1 activation by
curcumin mediates JNK activation, Foxo3a nuclear translocation and
apoptosis in melanoma cells. Biochem Biophys Res Commun. 441:53–58.
2013. View Article : Google Scholar : PubMed/NCBI
|
|
22
|
Egger ME, McNally LR, Nitz J, McMasters KM
and Gomez-Gutierrez JG: Adenovirus-mediated FKHRL1/TM sensitizes
melanoma cells to apoptosis induced by temozolomide. Hum Gene Ther
Clin Dev. 25:186–195. 2014. View Article : Google Scholar : PubMed/NCBI
|
|
23
|
Hilmi C, Larribere L, Deckert M, Rocchi S,
Giuliano S, Bille K, Ortonne JP, Ballotti R and Bertolotto C:
Involvement of FKHRL1 in melanoma cell survival and death. Pigment
Cell Melanoma Res. 21:139–146. 2008. View Article : Google Scholar : PubMed/NCBI
|
|
24
|
Yan F, Liao R, Farhan M, Wang T, Chen J,
Wang Z, Little PJ and Zheng W: Elucidating the role of the FoxO3a
transcription factor in the IGF-1-induced migration and invasion of
uveal melanoma cancer cells. Biomed Pharmacother. 84:1538–1550.
2016. View Article : Google Scholar : PubMed/NCBI
|
|
25
|
Livak KJ and Schmittgen TD: Analysis of
relative gene expression data using real-time quantitative PCR and
the 2(-Delta Delta C(T)) method. Methods. 25:402–408. 2001.
View Article : Google Scholar
|
|
26
|
Wang M, Liu Y, Zou J, Yang R, Xuan F, Wang
Y, Gao N and Cui H: Transcriptional co-activator TAZ sustains
proliferation and tumorigenicity of neuroblastoma by targeting CTGF
and PDGF-β. Oncotarget. 6:9517–9530. 2015.PubMed/NCBI
|
|
27
|
Yang R, Yi L, Dong Z, Ouyang Q, Zhou J,
Pang Y, Wu Y, Xu L and Cui H: Tigecycline inhibits glioma growth by
regulating miRNA-199b-5p-HES1-AKT pathway. Mol Cancer Ther.
15:421–429. 2016. View Article : Google Scholar : PubMed/NCBI
|
|
28
|
He J, Zhao Y, Zhao E, Wang X, Dong Z, Chen
Y, Yang L and Cui H: Cancer-testis specific gene OIP5: A downstream
gene of E2F1 that promotes tumorigenesis and metastasis in
glioblastoma by stabilizing E2F1 signalling. Neuro Oncol.
20:1173–1184. 2018. View Article : Google Scholar : PubMed/NCBI
|
|
29
|
Johnson DB and Puzanov I: Treatment of
NRAS-mutant melanoma. Curr Treat Options Oncol. 16:152015.
View Article : Google Scholar : PubMed/NCBI
|
|
30
|
Willcox BJ, Donlon TA, He Q, Chen R, Grove
JS, Yano K, Masaki KH, Willcox DC, Rodriguez B and Curb JD: FOXO3A
genotype is strongly associated with human longevity. Proc Natl
Acad Sci USA. 105:13987–13992. 2008. View Article : Google Scholar : PubMed/NCBI
|
|
31
|
Hirvonen K, Laivuori H, Lahti J,
Strandberg T, Eriksson JG and Hackman P: SIRT6 polymorphism
rs117385980 is associated with longevity and healthy aging in
Finnish men. BMC Med Genet. 18:412017. View Article : Google Scholar : PubMed/NCBI
|
|
32
|
Tao R, Xiong X, DePinho RA, Deng CX and
Dong XC: FoxO3 transcription factor and Sirt6 deacetylase regulate
low density lipoprotein (LDL)-cholesterol homeostasis via control
of the proprotein convertase subtilisin/kexin type 9 (Pcsk9) gene
expression. J Biol Chem. 288:29252–29259. 2013. View Article : Google Scholar : PubMed/NCBI
|
|
33
|
Tao R, Xiong X, DePinho RA, Deng CX and
Dong XC: Hepatic SREBP-2 and cholesterol biosynthesis are regulated
by FoxO3 and Sirt6. J Lipid Res. 54:2745–2753. 2013. View Article : Google Scholar : PubMed/NCBI
|
|
34
|
Kim HS, Xiao C, Wang RH, Lahusen T, Xu X,
Vassilopoulos A, Vazquez-Ortiz G, Jeong WI, Park O, Ki SH, et al:
Hepatic-specific disruption of SIRT6 in mice results in fatty liver
formation due to enhanced glycolysis and triglyceride synthesis.
Cell Metab. 12:224–236. 2010. View Article : Google Scholar : PubMed/NCBI
|
|
35
|
Zhong L, D'Urso A, Toiber D, Sebastian C,
Henry RE, Vadysirisack DD, Guimaraes A, Marinelli B, Wikstrom JD,
Nir T, et al: The histone deacetylase Sirt6 regulates glucose
homeostasis via Hif1alpha. Cell. 140:280–293. 2010. View Article : Google Scholar : PubMed/NCBI
|
|
36
|
Yan F, Liao R, Lin S, Deng X, Little PJ
and Zheng W: Forkhead box protein O3 suppresses uveal melanoma
development by increasing the expression of Bcl2like protein 11 and
cyclindependent kinase inhibitor 1B. Mol Med Rep. 17:3109–3114.
2018.
|
|
37
|
Scott DA, Richardson AD, Filipp FV,
Knutzen CA, Chiang GG, Ronai ZA, Osterman AL and Smith JW:
Comparative metabolic flux profiling of melanoma cell lines: Beyond
the Warburg effect. J Biol Chem. 286:42626–42634. 2011. View Article : Google Scholar : PubMed/NCBI
|
|
38
|
Hall A, Meyle KD, Lange MK, Klima M,
Sanderhoff M, Dahl C, Abildgaard C, Thorup K, Moghimi SM, Jensen
PB, et al: Dysfunctional oxidative phosphorylation makes malignant
melanoma cells addicted to glycolysis driven by the (V600E)BRAF
oncogene. Oncotarget. 4:584–599. 2013. View Article : Google Scholar : PubMed/NCBI
|
|
39
|
Falkenius J, Lundeberg J, Johansson H,
Tuominen R, Frostvik-Stolt M, Hansson J and Egyhazi Brage S: High
expression of glycolytic and pigment proteins is associated with
worse clinical outcome in stage III melanoma. Melanoma Res.
23:452–460. 2013. View Article : Google Scholar : PubMed/NCBI
|
|
40
|
Najera L, Alonso-Juarranz M, Garrido M,
Ballestín C, Moya L, Martínez-Díaz M, Carrillo R, Juarranz A, Rojo
F, Cuezva JM and Rodríguez-Peralto JL: Prognostic implications of
markers of the metabolic phenotype in human cutaneous melanoma. Br
J Dermatol. 181:114–127. 2019. View Article : Google Scholar
|
|
41
|
Koch A, Lang SA, Wild PJ, Gantner S, Mahli
A, Spanier G, Berneburg M, Müller M, Bosserhoff AK and Hellerbrand
C: Glucose transporter isoform 1 expression enhances metastasis of
malignant melanoma cells. Oncotarget. 6:32748–32760. 2015.
View Article : Google Scholar : PubMed/NCBI
|
|
42
|
Ho J, de Moura MB, Lin Y, Vincent G,
Thorne S, Duncan LM, Hui-Min L, Kirkwood JM, Becker D, Van Houten B
and Moschos SJ: Importance of glycolysis and oxidative
phosphory-lation in advanced melanoma. Mol Cancer. 11:762012.
View Article : Google Scholar
|
|
43
|
Sebastián C, Zwaans BM, Silberman DM,
Gymrek M, Goren A, Zhong L, Ram O, Truelove J, Guimaraes AR, Toiber
D, et al: The histone deacetylase SIRT6 is a tumor suppressor that
controls cancer metabolism. Cell. 151:1185–1199. 2012. View Article : Google Scholar : PubMed/NCBI
|
|
44
|
Kleszcz R, Paluszczak J, Krajka-Kuźniak V
and Baer-Dubowska W: The inhibition of c-MYC transcription factor
modulates the expression of glycolytic and glutaminolytic enzymes
in FaDu hypo-pharyngeal carcinoma cells. Adv Clin Exp Med.
27:735–742. 2018. View Article : Google Scholar : PubMed/NCBI
|
|
45
|
Choe M, Brusgard JL, Chumsri S, Bhandary
L, Zhao XF, Lu S, Goloubeva OG, Polster BM, Fiskum GM, Girnun GD,
et al: The RUNX2 transcription factor negatively regulates SIRT6
expression to alter glucose metabolism in breast cancer cells. J
Cell Biochem. 116:2210–2226. 2015. View Article : Google Scholar : PubMed/NCBI
|
|
46
|
Wu M, Dickinson SI, Wang X and Zhang J:
Expression and function of SIRT6 in muscle invasive urothelial
carcinoma of the bladder. Int J Clin Exp Pathol. 7:6504–6513.
2014.PubMed/NCBI
|
|
47
|
Feng XX, Luo J, Liu M, Yan W, Zhou ZZ, Xia
YJ, Tu W, Li PY, Feng ZH and Tian DA: Sirtuin 6 promotes
transforming growth factor-β1/H2O2/HOCl-mediated enhancement of
hepatocellular carcinoma cell tumorigenicity by suppressing
cellular senescence. Cancer Sci. 106:559–566. 2015. View Article : Google Scholar : PubMed/NCBI
|
|
48
|
Zhang Y, Nie L, Xu K, Fu Y, Zhong J, Gu K
and Zhang L: SIRT6, a novel direct transcriptional target of
FoxO3a, mediates colon cancer therapy. Theranostics. 9:2380–2394.
2019. View Article : Google Scholar : PubMed/NCBI
|
|
49
|
Brucker DP, Maurer GD, Harter PN, Rieger J
and Steinbach JP: FOXO3a orchestrates glioma cell responses to
starvation conditions and promotes hypoxia-induced cell death. Int
J Oncol. 49:2399–2410. 2016. View Article : Google Scholar : PubMed/NCBI
|