Introduction
Colorectal cancer (CRC) is the third most common
malignancy worldwide, accounting for ~1.8 million new cases and
~880,000 deaths in 2018 (1). The
carcinoma progression sequence is universally accepted and
originates from benign polyps or dysplastic lesions, which develop
into advanced adenoma and invasive carcinoma (2). In the past four decades, the
mortality rate of CRC has decreased, possibly due to improved
cancer screening programs, surgical techniques and therapeutic
strategies for early- and advanced-stage disease (3). However, patients with an advanced
stage have a poor prognosis, with the 5-year survival rate of 12.5%
(4,5).
Tumor progression and distant metastasis are the
primary causes of death in patients with CRC and are complicated by
various genetic and epigenetic changes (6,7).
Epigenetic modification is tightly associated with molecular
changes in DNA that do not occur from alterations in the DNA proper
(8,9). Epigenetic alterations coordinately
occur with other genetic changes, such as chromosomal
rearrangements or genomic mutations, and affect the
transcriptomics, genomics and proteomics that drive cancer
phenotypes (10). Such epigenetic
alterations involve a range of mechanisms, including DNA
methylation, histone modification, microRNAs, chromatin remodeling
and other chromatin components (11). Epigenetics is essential for
research into processes underlying various diseases, including
cancer (12).
DNA methylation is the most researched epigenetic
mechanism (8), during which a
methyl group is added to DNA nucleotides by DNA methyltransferase
(DNMT). DNMT1 is the largest DNMT that participates in methylation
(13). DNMT3 functions as a de
novo methyltransferase and comprises two related proteins
encoded by the DNMT3A and DNMT3B genes (14). DNA methylation is a stable
modification conserved through cellular divisions by DNMTs
(13).
In humans, DNA methylation generally occurs at the
five-carbon position of the cytosine pyrimidine ring preceding
guanine, termed dinucleotide CpG (8). Hypo- and hyper-methylation of the CpG
sites regulate transcriptional events and alter specific gene or
DNA segment expression (15).
Consequently, DNA methylation of tumor suppressor genes causes
progression of several types of carcinoma (15).
Dual specificity tyrosine-phosphorylation-regulated
kinase 2 (DYRK2), a protein kinase of the DYRK family, is mainly
localized in the cytoplasm and exhibits serine/threonine kinase
activity in cells (16). DYRK2
serves as a proapoptotic kinase through p53 phosphorylation at
Ser46 for inducing apoptotic cell death as a response to acute DNA
damage (17,18). In addition to its role in
apoptosis, DYRK2 regulates cell cycle progression by the
degradation of c-Myc, c-Jun, telomere reverse transcriptase and
katanin p60 (19-22). As cell cycle inhibition induces
tumorigenesis, DYRK2 may serve a role in tumor suppression
(16). Clinically, previous
studies have reported decreased DYRK2 expression in advanced breast
(22) and lung cancer (23), hepatocellular carcinoma (24), colorectal cancer (25) and metastatic liver lesions of
colorectal cancer (26).
Accordingly, the regulation of DYRK2 expression may be necessary
for cell proliferation. Nevertheless, the molecular mechanisms
underlying DYRK2 expression remain largely unknown.
The present study aimed to identify the DYRK2
promoter regions and determine whether the promoter region was
subjected to DNA methylation in CRC cell lines and patient tissues.
In addition, the present study aimed to clarify whether DYRK2
expression was upregulated by the inhibition of DYRK2 methylation
at the promoter region, resulting in inhibition of tumor cell
proliferation in CRC.
Materials and methods
Patient samples
The study protocol was approved by the Jikei
University School of Medicine Ethics Review Committee (approval no.
24-315 7081; Tokyo, Japan). All patients provided written informed
consent that their colorectal samples would be utilized for
investigative purposes. CRC and adjacent non-cancerous tissues were
obtained from resected specimens of a total of 80 patients at the
Jikei University Hospital between October 2014 and November 2015.
The distance between cancer and adjacent non-cancerous tissue was
≤5 cm. The inclusion criteria were patients who were diagnosis with
CRC by preoperative diagnosis and who underwent tumor resection for
therapeutic purposes. The exclusion criteria were patients <18
years and unable to provide informed consent. The mean age of
patients was 68.6 years (range, 39-90 years). For mRNA extraction,
samples were frozen immediately after surgical resection and stored
at −80°C until use. The clinicopathological information of the
patients included in the present study is presented in Table SI.
Cell culture and treatment
HCT116 cell lines (human CRC cells) were purchased
from ATCC. The cells were cultured in Dulbecco's modified Eagle's
medium (DMEM; Nacalai Tesque, Inc.) supplemented with 10% FBS
(Biological Industries) and 1% penicillin and streptomycin at 37°C
in a 5% CO2 incubator. DLD-1, LS180, SW480 and SW620
cells were obtained from ATCC and cultured in RPMI-1640 medium
(Nacalai Tesque, Inc.) with 10% FBS, 1% penicillin and streptomycin
at 37°C in a 5% CO2 incubator.
5-Azacytidine (Aza) treatment
Aza was purchased from Wako Pure Chemical Industries
(cat. no. 016-25361) and dissolved in DMSO for stock and working
solution preparation. Human CRC cell lines (HCT116, DLD-1, LS180,
SW620 and SW480) were treated with Aza at concentrations ranging
between 1 and 20 µM for 1 or 2 days. The control cells were
treated with DMSO as a vehicle control for the same time.
Cell transfection
DYRK2 small interfering (si)RNA (#1, Qiagen GmbH;
#2, Invitrogen; Thermo Fisher Scientific, Inc.), negative control
siRNA (Invitrogen; Thermo Fisher Scientific, Inc.) and DNMT1 siRNA
(Sigma-Aldrich; Merck KGaA) were used to establish cell lines with
a transient knockdown. The siRNA sequences are stated in Table SII. To identify cell lines with
transient DYRK2 overexpression, a pCDNA3 flag vector was used; a
pCDNA3 flag empty vector was used as the negative control. The
HCT116 cells were plated and cultured to 60-80% confluency prior to
transfection. The vectors (500 nM) and siRNAs (5 nM) were
transfected to HCT116 cells using the Lipofectamine®
RNAiMAX Reagent (Invitrogen; Thermo Fisher Scientific, Inc.)
according to the manufacturer's instructions. The expression of
each protein was determined 48 h post-transfection by western
blotting.
Western blotting
Western blotting using all the cell lines was
conducted as previously described (19). The Bradford protein assay was used
to measure the concentration of total protein in samples. The
concentration of protein was 1 mg/ml. The amount of protein loaded
was 20-30 µg per lane. The protein samples were separated by
SDS-PAGE on 7.5% gels and transferred to nitrocellulose membranes.
Blocking one (cat. no. 03953-66; Nacalai Tesque, Inc.) was used for
the blocking of the membranes for 1 h at room temperature. The
primary anti-bodies used for immunoblotting were polyclonal rabbit
anti-DYRK2 (1:1,000; cat. no. HPA027230; Sigma-Aldrich; Merck
KGaA), monoclonal mouse anti-DNMT1 (1:1,000; clone H-12; cat. no.
sc-271729; Santa Cruz Biotechnology, Inc.), monoclonal mouse
anti-tubulin (1:1,500; clone B-5-1-2; cat. no. T5168;
Sigma-Aldrich; Merck KGaA) and monoclonal mouse anti-GAPDH
(1:1,500; clone 6C5; cat. no. MAB374; Sigma-Aldrich; Merck KGaA).
The membranes were incu-bated with the primary antibodies overnight
at 4°C and washed three times for 15 min with TBS + 0.05% Tween-20.
The secondary antibodies were monoclonal horseradish
peroxidase-conjugated goat anti-rabbit (1:1,000; clone eB182; cat.
no. 18-8816-31; eBioscience) and goat anti-mouse (1:1,000; clone
eB144; cat. no. 18-8817-31; eBioscience;). The membranes were
incubated for 1 h at room temperature. All western blotting
experiments were conducted at least three times.
RNA extraction and reverse
transcription-quantitative PCR (RT-qPCR)
Total RNA from human and mouse tissues was extracted
using the RNeasy Plus Universal Mini Kit (Qiagen GmbH) according to
the manufacturer's protocol. RNA from all cell lines was extracted
using the TRIsure reagent (Nippon Gene Co., Ltd.). Total RNA was
reverse transcribed into cDNA using the PrimeScript 1st Strand cDNA
Synthesis kit (Takara Bio, Inc.) and each primer pair (50
µM). The primer sequences are summarized in Table SII. The reaction conditions were
65°C for 5 min, 4°C for 5 min, 42°C for 60 min and 95°C for 5 min.
SYBR® Green PCR Master Mix (Applied Biosystems; Thermo
Fisher Scientific, Inc.) was used for qPCR according to the
manufacturer's instructions. Amplification and detection were
performed using a PikoReal 96 Real-Time PCR System (Thermo Fisher
Scientific, Inc.). The thermocycling conditions were as follows:
95°C for 10 min, followed by 40 cycles of 95°C for 15 sec, 60°C for
30 sec and 72°C for 30 sec. GAPDH was used as an internal control.
The mRNA expression level was calculated using the
2−ΔΔCq method (27).
Generation of DYRK2 promoter constructs
and luciferase reporter assay
The transcription start site (TSS) of DYRK2 was
identified using the DataBase of Transcriptional Start Sites
(https://dbtss.hgc.jp). To produce the luciferase
reporter gene construct containing the DYRK2 promoter, genomic DNA
was purified from the HCT116 human CRC cell line using a DNeasy
Blood & Tissue Kit (Qiagen GmbH). Several DNA fragments around
the DYRK2 promoter were obtained from the KAPA HiFi HotStart
ReadyMix (Kapa Biosystems; Roche Diagnostics) using genomic DNA as
a template and primer sets of the forward primer with an
incorporated KpnI site or the reverse primer with an
incorporated NheI site. The primer sequences are summarized
in Table SII. The reaction
conditions were as follows: 95°C for 5 min, followed by 30 cycles
of 98°C for 20 sec, 65°C for 15 sec and 72°C for 3 min, and a final
extension at 72°C for 5 min. The resultant constructs were
amplified by PCR using the BigDye v3.1 Terminator Cycle Sequencing
kit (Applied Biosystems; Thermo Fisher Scientific, Inc.). The
reaction conditions were as follows: 96°C for 30 sec, followed by
25 cycles of 96°C for 10 sec, 50°C for 5 sec and 60°C for 4 min.
The constructs were confirmed by Sanger sequencing with a 3730xl
DNA Analyzer (Applied Biosystems; Thermo Fisher Scientific, Inc.).
The PCR product was ligated into the pGL3-Basic luciferase vector
(Promega Corporation).
For the luciferase reporter assay, HCT116 cells were
seeded in triplicate into a 96-well plate (5×10³
cells/well) and transfected with pGL3 plasmids 48 h later. The pGL3
plasmids contained each construct fragment, along with a
Renilla luciferase plasmid (pRL-TK; Promega Corporation) as
the normalization control using the FuGENE HD (Promega Corporation)
transfection reagent. A pGL3-Basic vector without an insert was
used as a negative control. At 24 h post-transfection, the
luciferase activity was determined using the Dual-Luciferase
Reporter Assay System (Infinite 200PRO; Tecan Group, Ltd.).
Luciferase activity was calculated and expressed as relative light
units. The CpG islands were confirmed by MethPrimer (http://www.urogene.org/methprimer2/), which is
used to design PCR primers for methylation mapping.
Chromatin immunoprecipitation (ChIP)
assay
The ChIP assay was performed using a
SimpleChIP® Enzymatic Chromatin IP kit (cat. no. 9003;
Cell Signaling Technology, Inc.) according to the manufacturer's
instructions. HCT116 cells were fixed with 37% formaldehyde for 10
min at room temperature, washed with 20 ml ice-cold 1X PBS. The
lysate was treated with Micrococcal Nuclease (Takara Bio, Inc.) and
sonicated (20 sec on, 1 min off for 3 times) to obtain fragmented
DNA for subsequent PCR. The DNA was subjected to PCR with specific
primers of the DYRK2 promoter region. The primer sequences are
stated in Table SII. PCR was
performed using the following conditions: 95°C for 15 min, followed
by 40 cycles of 94°C for 30 sec, 54°C for 30 sec and 72°C for 30
sec, and a final step of 72°C for 10 min.
MTS assay
HCT116 cells were seeded into 96-well plates
(1×10⁴ cells/well), and MTS assay was conducted using a
CellTiter 96 AQ Solution Cell Proliferation Assay Kit (Promega)
according to the manufacturer's protocol. The absorbance was
measured at 490 nm with a multiple counter (Infinite 200PRO;
TECAN).
DNA methylation analysis
Genomic DNA was purified from the HCT116 cells or
human tissues using a DNeasy Blood & Tissue kit (Qiagen GmbH).
The DNA was sonicated (30 sec on, 1 min off for 10 times) to obtain
fragmented DNA. The methylated and unmethylated DNA fragments in
whole DNA samples were enriched by an EpiXplore Methylated DNA
Enrichment Kit (Takara Bio, Inc.) according to the manufacturer's
instructions. The fragmented DNA was treated with SYBR®
Green PCR Master Mix (Applied Biosystems; Thermo Fisher Scientific,
Inc.) and a DYRK2 primer set for qPCR. The primers sequences are
summarized in Table SII. The
products were analyzed with a PikoReal 96 Real-Time PCR System. The
thermocycling conditions were as follows 95°C for 10 min, followed
by 40 cycles of 95°C for 15 sec, 60°C for 30 sec and 72°C for 30
sec. The products were calculated by the percentage of input using
Ct values as follows: Percent input=2% ×2(Ct 2% input
sample-Ct IP sample). The input sample used was 2%.
Animals and treatment
The animal experiment was preformed following the
Guidelines for the Proper Conduct of Animal Experiments of the
Science Council of Japan and approved by the Institutional Animal
Care and Use Committee of Jikei University (approval no. 2018-015).
Female 5-week-old C57/BL6 mice (Charles River Laboratories Japan)
were habituated to the new environment for 7 days after arrival.
Azoxymethane (AOM) was obtained from Sigma-Aldrich; Merck KGaA, and
dextran sodium sulfate (DSS) was purchased from MP Biomedicals,
LLC. A total of 15 mice were divided into 3 groups. The mice were
administered a single intraperitoneal injection of AOM (10 mg/kg
body weight) at the age of 6 weeks. One week after the AOM
injection, the mice started to receive 2% DSS in their drinking
water for 7 days. The mice were sacrificed by isoflurane overdose
at 10, 15, or 20 weeks after the AOM injection treatment. Tumor and
adjacent non-cancerous tissues were collected from the colon and
rectum of the mice.
Hematoxylin and eosin (HE) staining and
immunohisto- chemistry
The colorectal tissues of mice were fixed with 4%
paraformaldehyde in 20 mM HEPES buffer (pH 7.5) overnight at 4°C,
followed by immersion in 30% trehalose in 20 mM HEPES to
cryoprotect the tissue. The samples were embedded in Tissue-Tek
O.C.T. Compound (Sakura Finetek Japan Co., Ltd.) and frozen in dry
ice-acetone. For HE staining, frozen 6-µm sections were
washed with water, followed by staining with hematoxylin and eosin
for 7 min and 10 sec at room temperature, respectively. After
dehydration, the sections were sealed for microscopy observation.
For immunohistochemistry, frozen 6-µm sections were treated
with ImmunoSaver (Nisshin EM Co., Ltd.) for 1 h at 80°C for antigen
retrieval and washed with HEPES buffer [20 mM HEPES (pH 7.5), 100
mM NaCl]. Blocking was performed by incubating with 0.4% Triton
X-100 and 10% FBS in HEPES buffer for 60 min at room temperature.
The sections were incubated with rabbit anti-human DYRK2 (dilution
1:400; cat. no. HPA027230; Sigma-Aldrich; Merck KGaA) and mouse
anti-mouse DNMT1 antibody (dilution 1:300; clone H-12; cat. no.
sc-271729; Santa Cruz Biotechnology, Inc.) overnight at 4°C.
Following washing with HEPES buffer, the sections were incubated
with Cy®3-conjugated donkey anti-rabbit (dilution 1:500;
cat. no. 711-165-152; Jackson ImmunoResearch Laboratories, Inc.)
and Cy®5-conjugated donkey anti-mouse IgG (dilution
1:500; cat. no. 715-175-151; Jackson ImmunoResearch Laboratories,
Inc.) for 2 h at 4°C. The sections were washed and mounted with
VECTASHIELD® Mounting Medium (Vector Laboratories, Inc.)
with 4,6′-diamidino-2-phenylindole dihydrochloride (DAPI).
Immunofluorescence was observed under a BZ-X800 fluorescence
microscope (×20 magnification; n=8 fields per sample; Keyence
Corporation).
Statistical analysis
The data are presented as the mean ± standard
deviation. SPSS 25.0 statistical software (IBM Corp) was used for
statistical analyses. One-way ANOVA with a Tukey's multiple
comparisons test and two-tailed Student's t-test were used to
identify the difference between two groups in the results of the
luciferase reporter gene assay, RT-qPCR, and the MTS assay. Paired
Student's t-test was used to compare tumor and adjacent normal
tissues; unpaired Student's t-test was used for cell group
analysis. Associations between DYRK2 expression levels and
clinicopathological parameters were analyzed using the Pearson's
χ2 test. P<0.05 was considered to indicate a
statistically significant difference.
Results
DYRK2 expression is decreased in human
CRC tissues
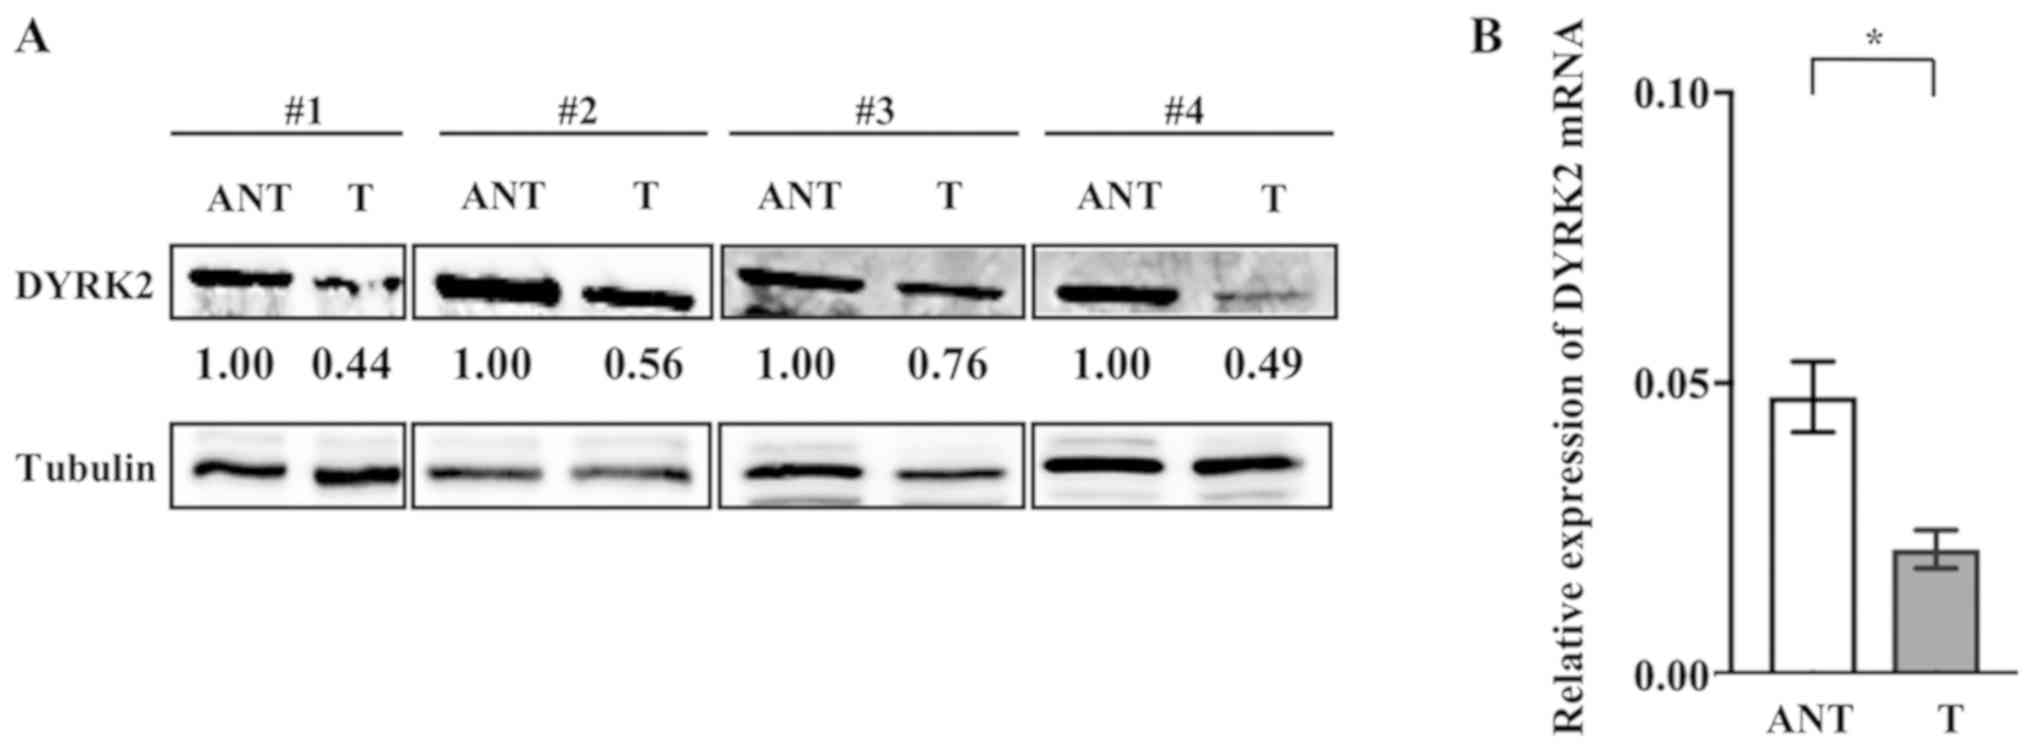
To investigate the roles of DYRK2 in tumorigenesis,
DYRK2 expression was evaluated in several matched pairs of tumor
and adjacent non-cancerous tissues from patients who under-went
surgery for CRC. Western blotting analysis revealed that DYRK2
expression was downregulated in CRC tissues compared with that in
adjacent non-cancerous tissues (Fig.
1A).
RT-qPCR was performed using cancer tissue and
adjacent non-cancerous tissue samples from 80 patients with CRC.
The DYRK2 mRNA level was significantly lower in cancer tissues
compared with that in adjacent non-cancerous tissues (Fig. 1B). These results suggested a
negative association between DYRK2 expression and tumor development
or progression in CRC. In addition, clinicopathological analysis
was performed with 80 CRC samples (Table SI). Tumors were staged according
to the 8th edition of the American Joint Committee on Cancer
staging system (28). The clinical
characteristics of CRC included 14 stage I (17.5%), 25 stage II
(31.2%), 32 stage III (40%) and 9 stage IV (11.3%) cases of CRC,
and 35 of the 80 patients with CRC (43.7%) exhibited high DYRK2
expression (>0.5 of the mRNA level of adjacent normal tissue)
and 45 patients (56.3%) exhibited low DYRK2 expression.
The samples were divided into two groups based on
DYRK2 expression levels, and the clinicopathological
characteristics of the patients in the high- (>0.5 of the mRNA
level of adjacent normal tissue) and low- (≤0.5 of the mRNA level
of adjacent normal tissue) expression groups were analyzed by the
χ2-test (Table I). A
strong association was observed between DYRK2 expression and the
clinicopathological features of patients with CRC, including age
(P=0.003) and tumor location (P=0.030) (Table I). By contrast, no associations
were observed between DYRK2 mRNA expression and sex, clinical
stage, Tumor-Node-Metastasis classification or pathological
differentiation (Table I)
(28).
 | Table IClinicopathological features of 80
patients with colorectal cancer with high or low expression of
DYRK2. |
Table I
Clinicopathological features of 80
patients with colorectal cancer with high or low expression of
DYRK2.
| Characteristic | DYRK2 mRNA level
| χ2
P-value |
|---|
| Low, n (%) | High, n (%) |
|---|
| Sex | | | |
| Male | 28 (35.0) | 22 (27.5) | 0.954 |
| Female | 17 (21.2) | 13 (16.2) | |
| Age, years | | | |
| <70 | 16 (20.0) | 24 (30.0) | 0.003a |
| ≥70 | 29 (36.2) | 11 (13.7) | |
| Location | | | |
| Colon | 29 (36.2) | 14 (17.5) | 0.030a |
| Rectum | 16 (20.0) | 21 (26.2) | |
| Clinical stage | | | |
| I | 10 (12.5) | 4 (5.0) | 0.240 |
| II | 12 (27.5) | 13 (21.2) | |
| III | 16 (20.0) | 16 (20.0) | |
| IV | 7 (8.7) | 2 (2.5) | |
| T
classification | | | |
| T1+T2 | 11 (13.7) | 8 (10.0) | 0.869 |
| T3+T4 | 34 (42.5) | 27 (33.7) | |
| N
classification | | | |
| N0 | 23 (28.7) | 18 (22.5) | 0.978 |
| N1+N2 | 22 (27.5) | 17 (21.2) | |
| M
classification | | | |
| M0 | 38 (47.5) | 33 (41.2) | 0.167 |
| M1 | 7 (8.7) | 2 (2.5) | |
| Pathological
differentiation | | | |
| Tub1,2 | 41 (51.2) | 34 (42.5) | 0.486 |
| por | 1 (1.2) | 1 (1.2) | |
| pap | 1 (1.2) | 0 (0.0) | |
| muc | 2 (2.5) | 0 (0.0) | |
DYRK2 promoter regions are methylated in
CRC
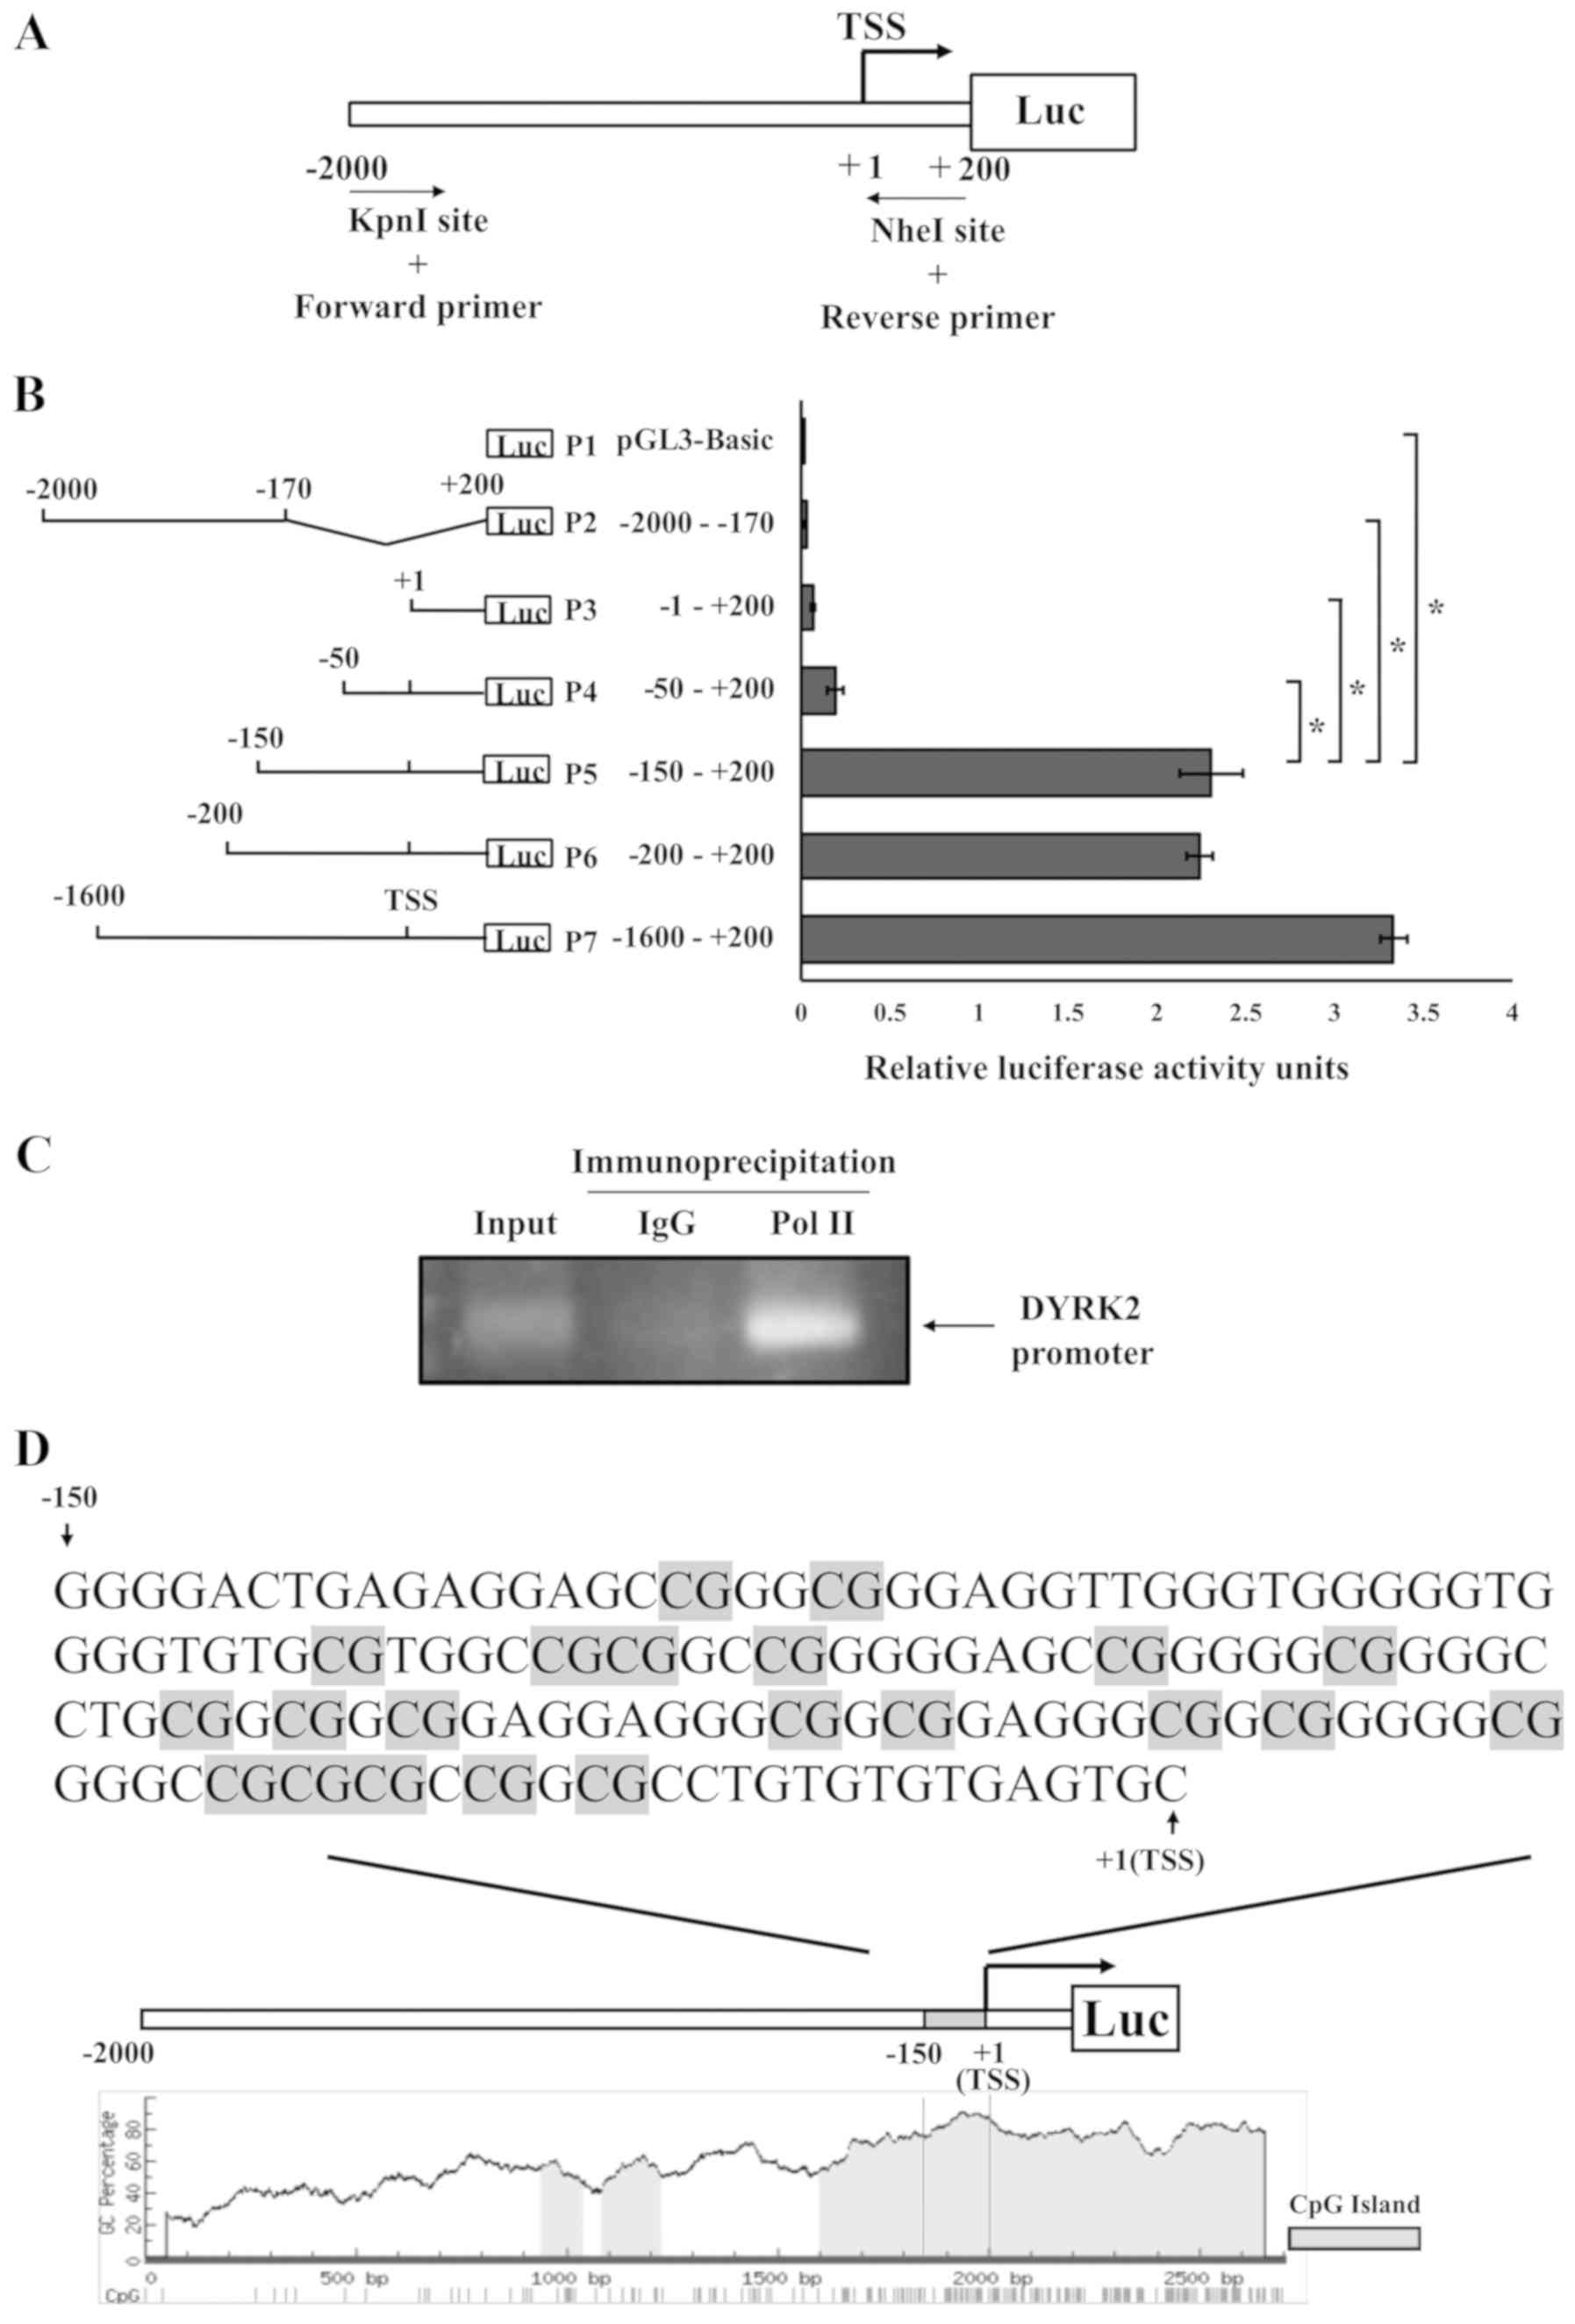
To identify the molecular mechanism of DYRK2
transcriptional regulation, the basal transcriptional regulation of
the DYRK2 promoter region was analyzed from 2,000 bp upstream to
200 bp downstream of the TSS. To achieve this, a DNA fragment
between -2,000 and +200 bp around the TSS was cloned into the pGL3
vector containing firefly luciferase (Fig. 2A). In addition, various truncated
promoter constructs were generated, as presented in Fig. 2B. Luciferase activity was high in
the P5, P6 and P7 fragments in HCT116 cells. However, further
truncation (P1-P4) significantly reduced the reporter activity
compared with that observed with P5 (Fig. 2B). These findings suggested that
one of the promoters for DYRK2 was located in the region between at
least-150 and -50.
A ChIP assay was performed using an RNA polymerase
II antibody to examine whether the −150/+1 region exhibited
promoter functions. The results demonstrated that RNA polymerase II
was bound to the region (Fig. 2C),
further suggesting that the −150/+1 region was one of the promoter
regions for the DYRK2 gene.
Bioinformatics analysis was next performed using the
DYRK2 promoter region in HCT116 cells. A large proportion of
cytosine and guanine was detected in the −150/+1 region (Fig. 2D). These results indicated that the
DYRK2 promoter region contained a CpG island enriched in the CpG
repeats (Fig. 2D). This result
suggested that DNA methylation may occur within the DYRK2
promoter.
DNA methyltransferase inhibitor induces
DYRK2 expression and suppresses proliferation in CRC cell
lines
To determine whether DNA methylation was involved in
the DYRK2 expression, the effects of DNA methyltransferase
inhibitors on DYRK2 mRNA expression were investigated. RT-qPCR
analysis revealed that treatment with Aza upregulated the
transcription of DYRK2 in a dose-dependent manner (Fig. 3A). Similar results for the effect
of Aza treatment were obtained in five CRC cell lines HCT116,
DLD-1, LS180, SW480 and SW620. DYRK2 mRNA expression was
significantly increased following treatment with 5 µM Aza in
all cell lines (Fig. 3B). In
addition, when the HCT116 cells were treated with 10 µM Aza
for 48 h, the DYRK2 protein level was upregulated (Fig. 3C). The DYRK2 promoter area of the
HCT116 cells treated with 10 µM Aza exhibited a lower level
of methylation compared with that in cells treated with the vehicle
(Fig. 3D).
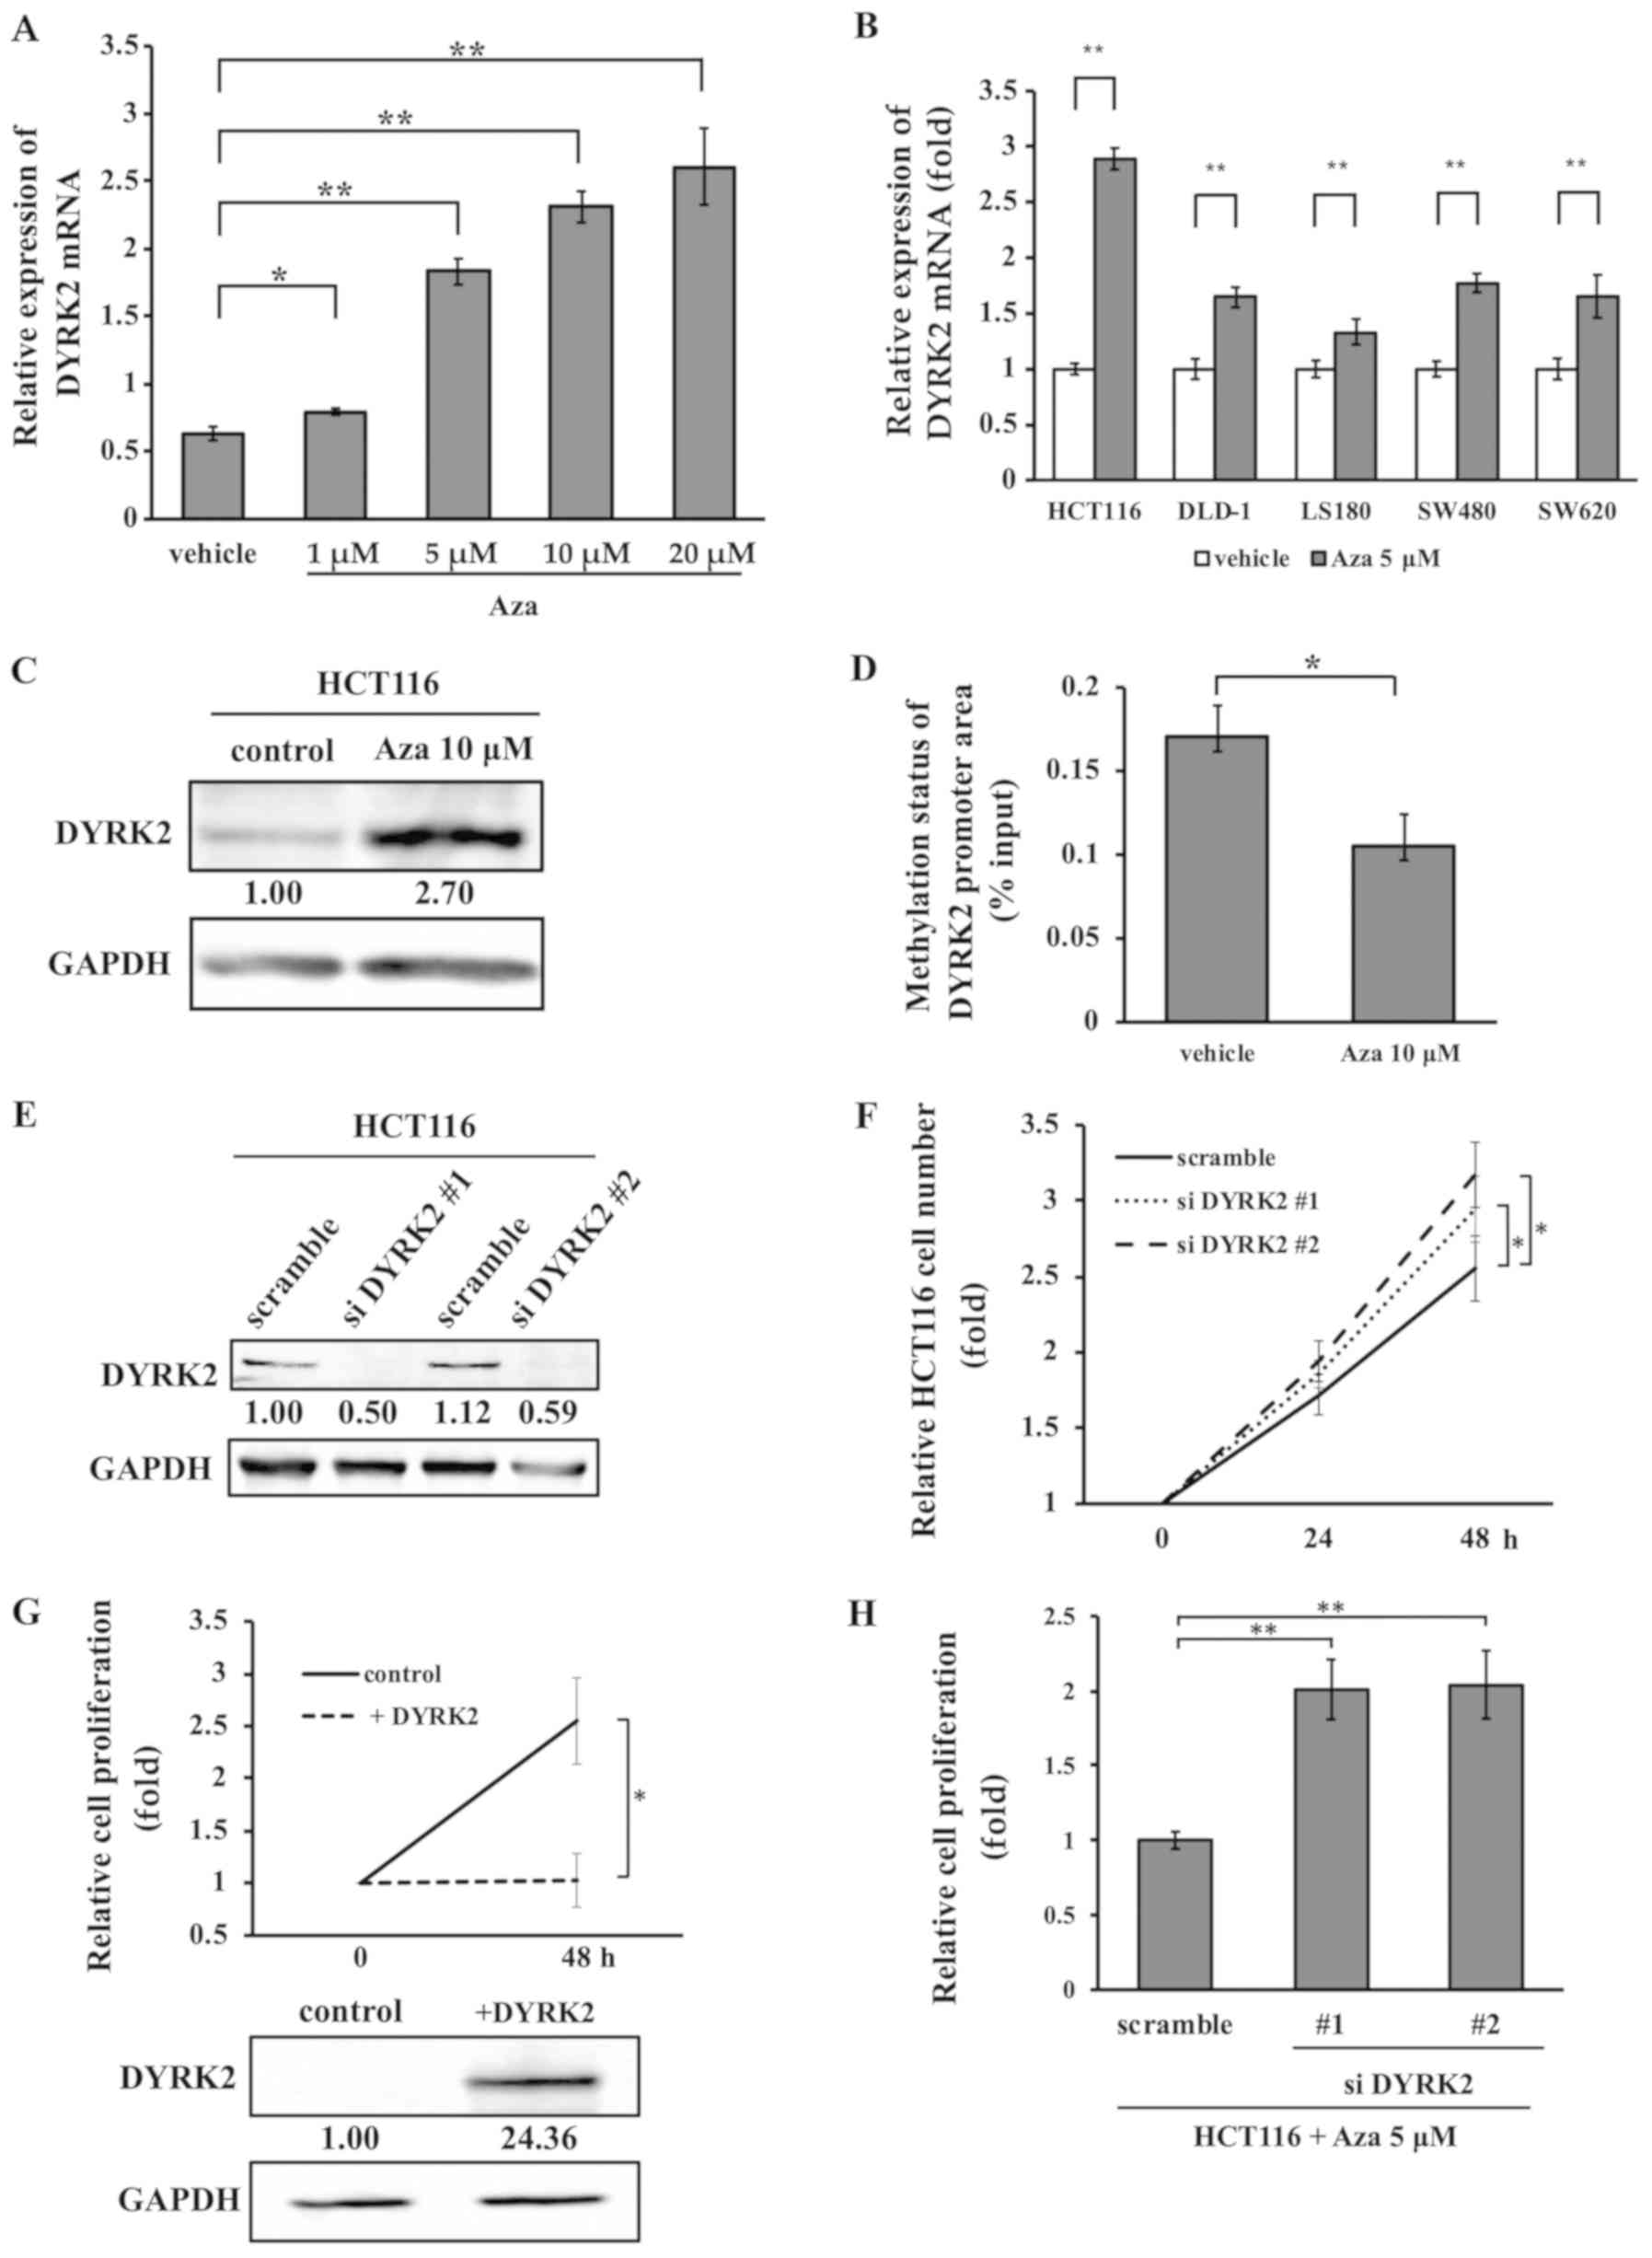 | Figure 3Aza treatment induces the
upregulation of DYRK2 expression and results in suppression of cell
proliferation. (A) Effects of Aza treatment (1, 5, 10, and 20
µM) after 1 day on the expression of DYRK2 mRNA in HCT116
cells were determined by quantitative PCR. n=3. (B) The expression
of DYRK2 mRNA following 5 µM Aza treatment in DLD-1, LS180,
SW480 and SW620 cells was analyzed by quantitative PCR. n=3. (C)
Western blotting demonstrated the alteration of DYRK2 expression 2
days after Aza treatment. (D) Effects of 10 µM Aza treatment
after 2 days on the methylation status of the DYRK2 promoter area
in the HCT116 cells. n=3. (E) HCT116 cells were transfected with
two independent DYRK2-specific siRNAs (#1 and #2) or a scrambled
siRNA. The lysates were analyzed by immunoblotting with anti-DYRK2
or anti-GAPDH antibodies. (F and G) Association between DYRK2
expression and cell proliferation in HCT116 cells. Cell
proliferation in (F) transiently DYRK2-depleted or (G)
DYRK2-overexpressing cells was measured using an MTS assay. The
lysates were analyzed by immunoblotting with anti-DYRK2 or
anti-GAPDH antibodies. n=3. (H) Cell proliferation was determined
in transiently DYRK2-depleted cells compared with the control cells
with Aza treatment to confirm the effects of methylation on the
DYRK2 promoter area. n=3. Data are presented as the mean ± SD.
*P<0.05, **P<0.01. Aza, 5-Azacytidine;
DYRK2, dual specificity tyrosine-phosphorylation-regulated kinase
2; siRNA, small interfering RNA; +DYRK2, DYRK2 overexpression
vector. |
To assess whether cell proliferation was associated
with DYRK2 expression in the CRC cell lines, HCT116 cells were
transfected with DYRK2 siRNA or control siRNA (Fig. 3E). The proliferation rates of these
cells were analyzed using an MTS assay. Cell proliferation was
increased in DYRK2-knockdown HCT116 cells compared with that in
cells transfected with a scrambled control (Fig. 3F). By contrast, DYRK2
overexpression suppressed cell proliferation in HCT116 cells
(Fig. 3G). To investigate the
involvement of DYRK2 promoter methylation in cell proliferation,
DYRK2 cells were transfected with siRNA targeting DYRK2 and treated
with 5 µM Aza. DYRK2-knockdown cells exhibited significantly
increased in cell proliferation compared with the control HCT116
cells following Aza treatment (Fig.
3H). These results suggested that the proliferation of HCT116
cells was suppressed by decreased DYRK2 expression with Aza
treatment.
Regulation of DYRK2 expression by
DNMT1
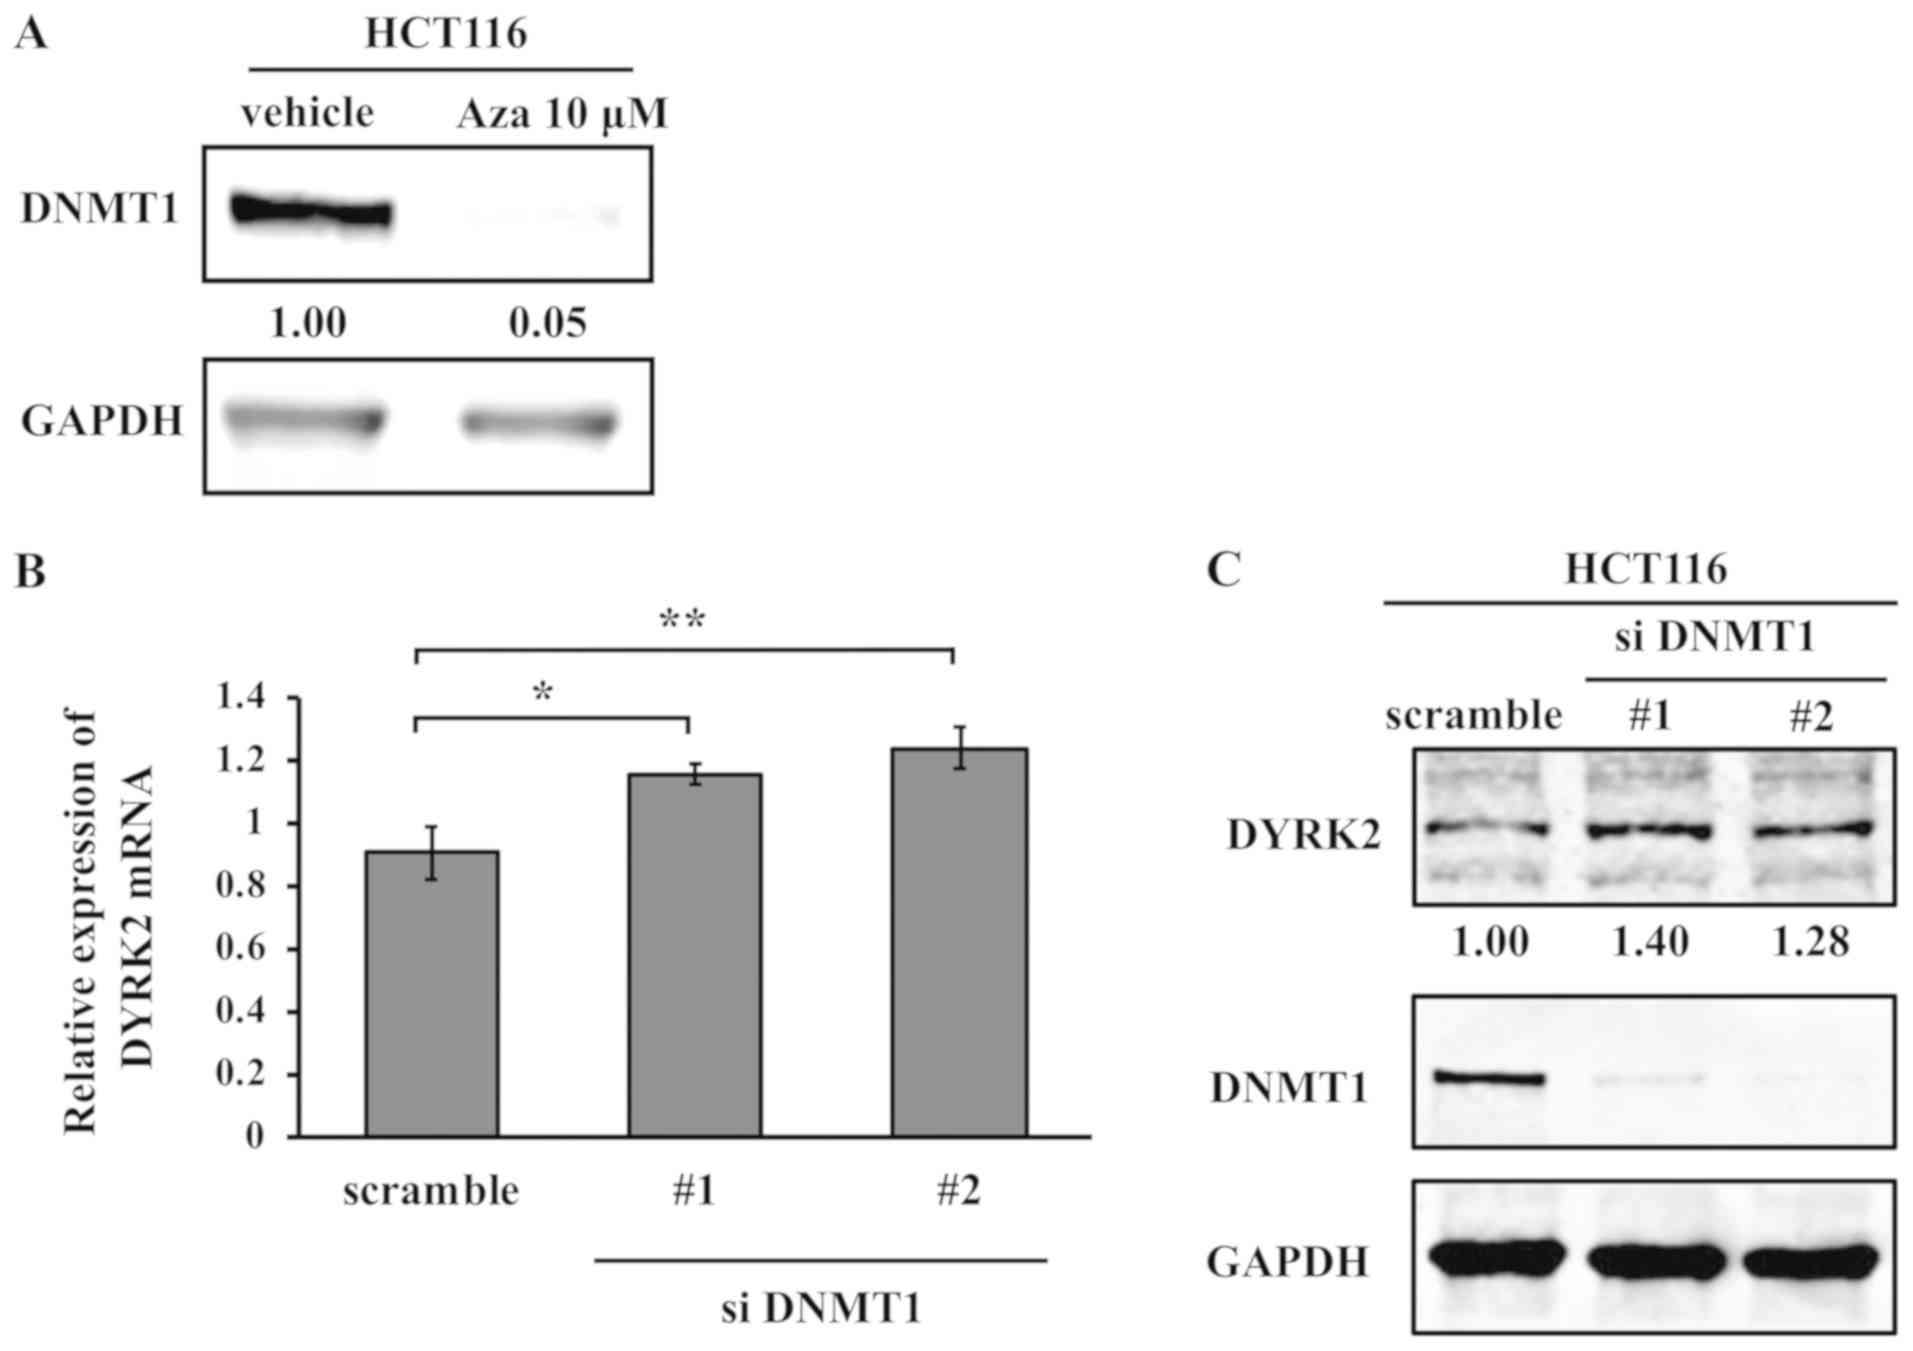
Aza can lead to DNA hypomethylation by irreversible
binding and degradation of DNMT1 (29). The expression of DNMT1was evaluated
following treatment with Aza in HCT116 cells to examine the
involvement of Aza in DNMT activity. Western blotting results
indicated a significant reduction in DNMT1 protein expression by
Aza in HCT116 cells (Fig. 4A).
Next, the present study determined whether DNMT1 was involved in
the regulation of DYRK2 expression at the mRNA and protein levels.
Knockdown of DNMT1 by siRNA in HCT116 cells upregulated DYRK2
expression at the mRNA and protein levels (Fig. 4B and C). These results suggested
that DYRK2 expression was upregulated by treatment with Aza via the
inhibition of DNMT1.
Association between DYRK2 or DNMT1
expression and DYRK2 promoter area methylation status in CRC
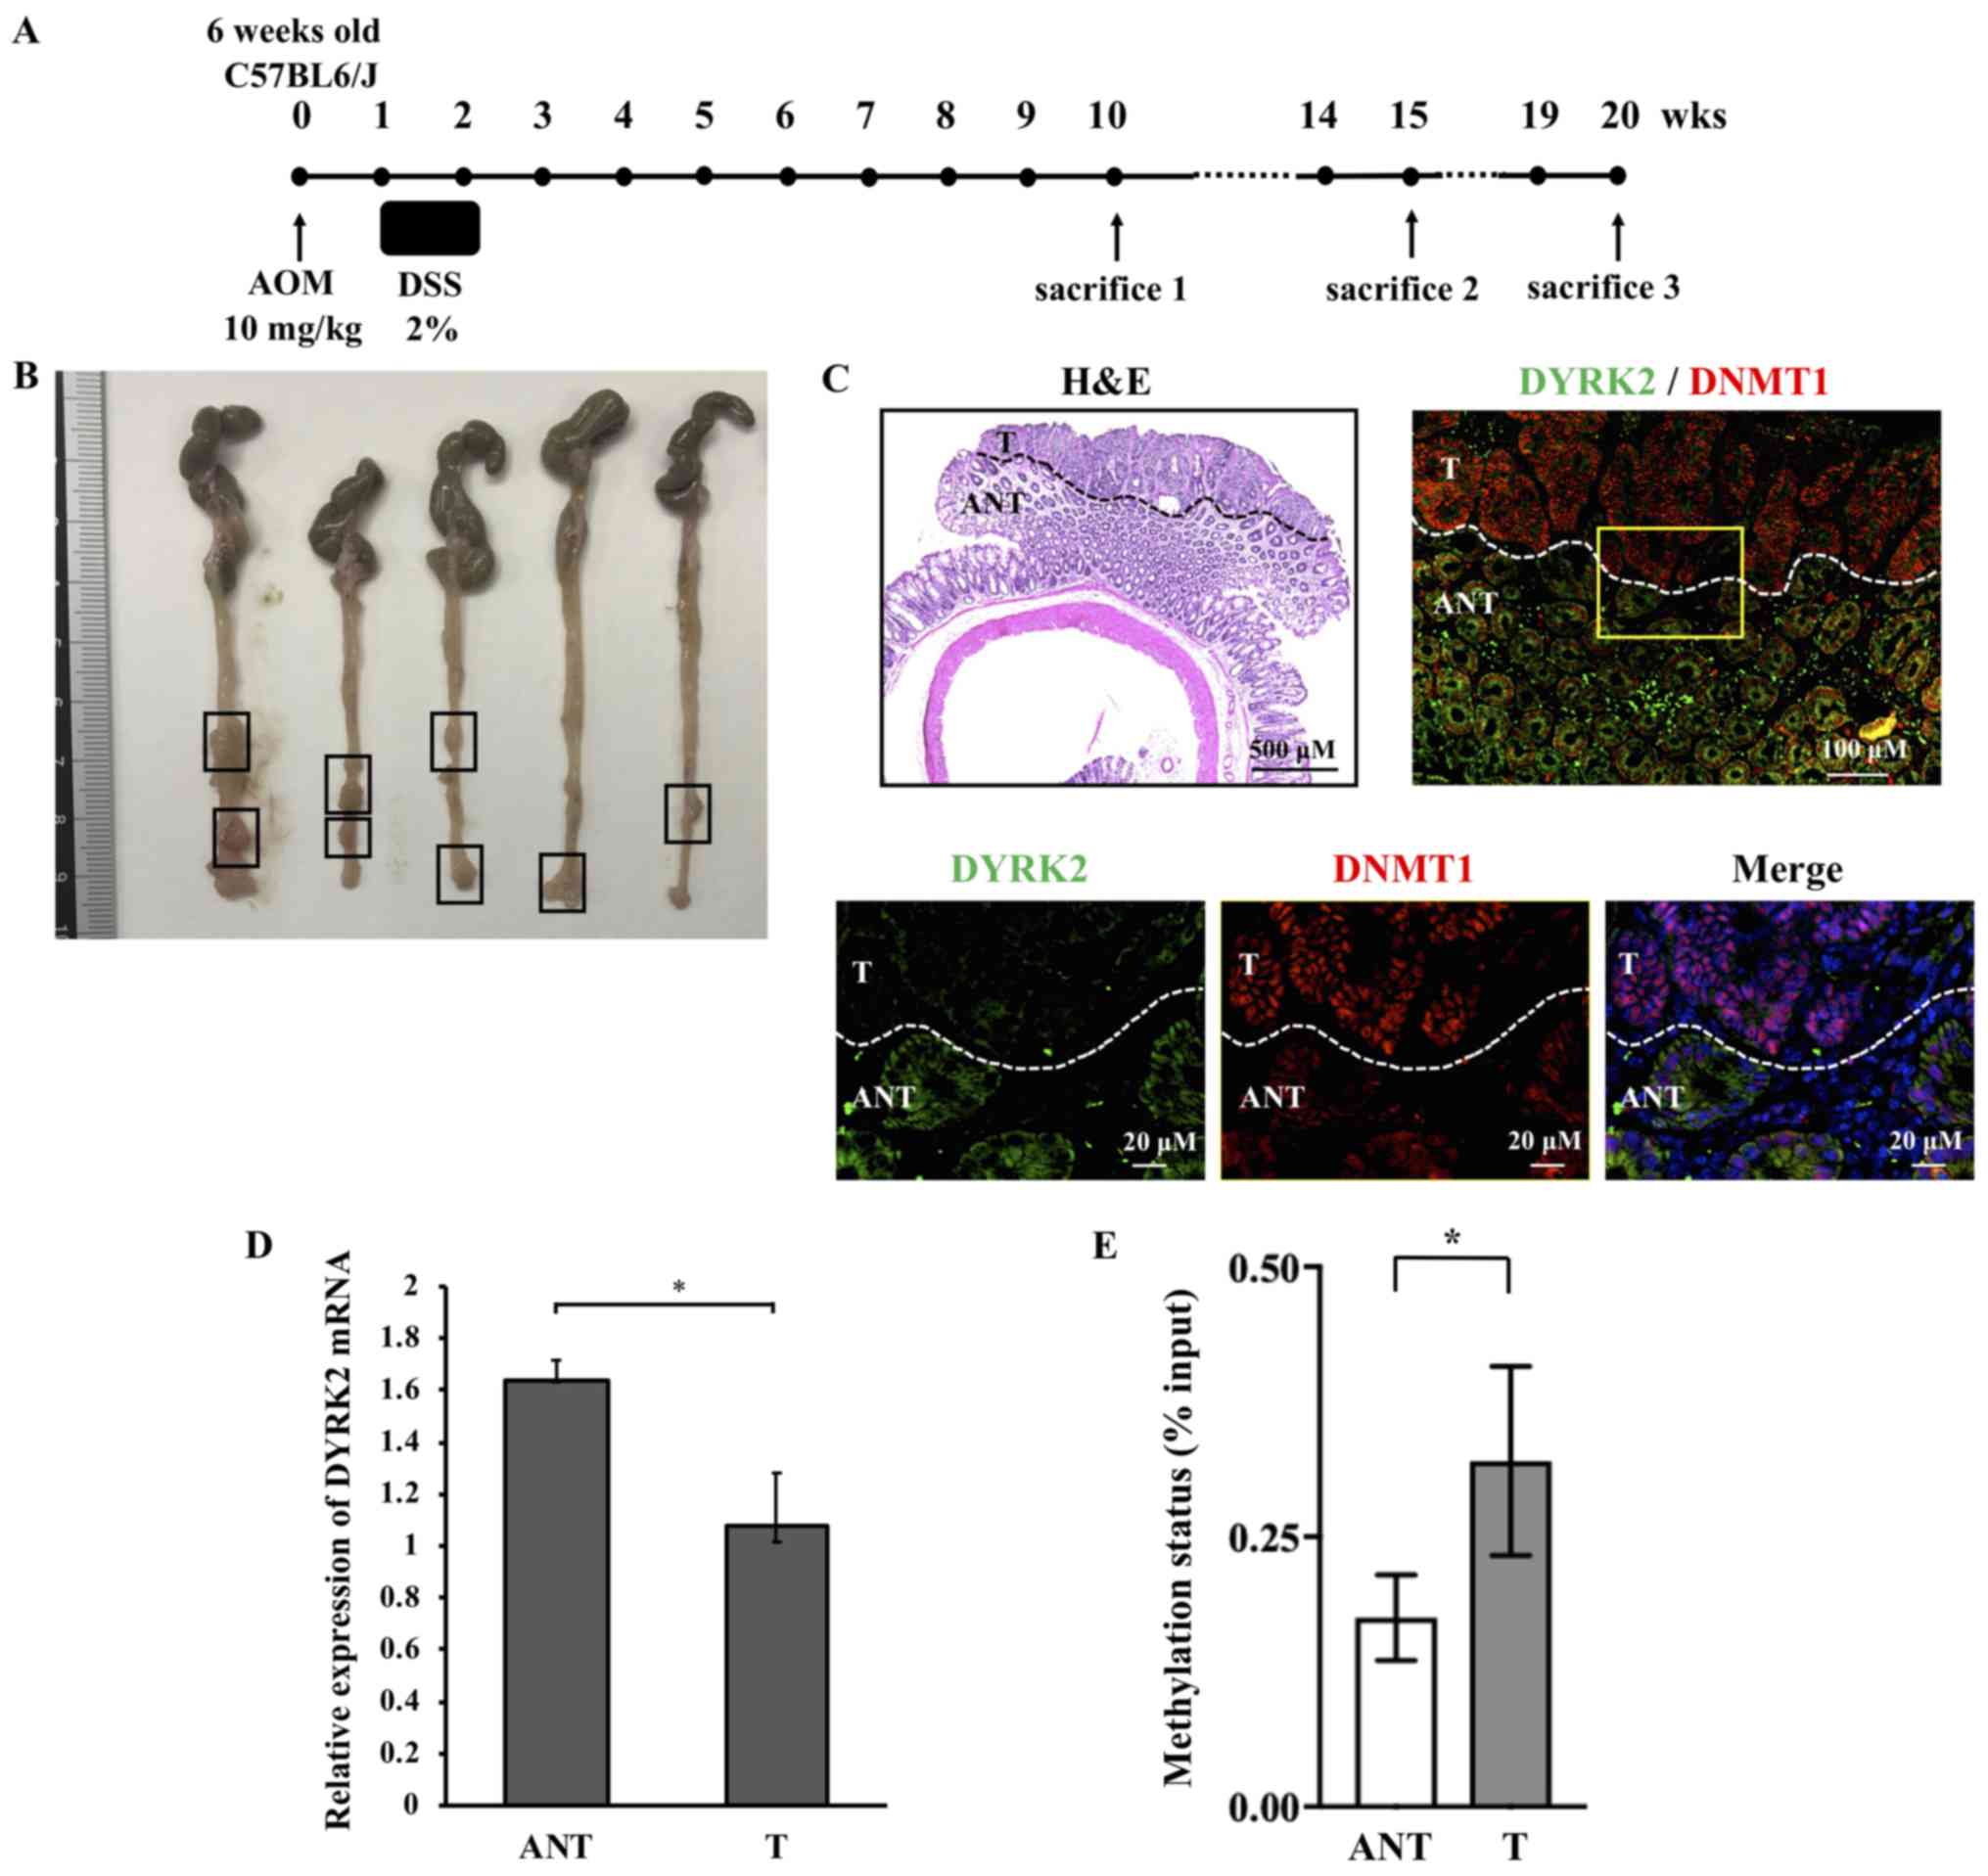
An inflammation-associated CRC murine model was used
to examine whether the downregulation of DYRK2 expression in CRC
tissue was reproduced in the CRC model. Therefore, an AOM/DSS
model, which is widely applicable to the inflammation-associated
colon cancer model in rodents (30-34),
was generated. DYRK2 or DNMT1 expression and DYRK2 promoter area
methylation status were examined in the AOM/DSS
inflammation-associated murine model of CRC. The experimental
protocol of AOM/DSS administration is presented in Fig. 5A.
Macroscopic analysis revealed multiple tumors in the
colon and rectum, which were frequently observed in the distal
colon (Fig. 5B). HE staining
demonstrated that the mice had developed colorectal tumors with
complicated glandular structures, hyperchromatic nuclei and a loss
of nuclear polarity; therefore, these tumors were classified as
carcinomas (Fig. 5C).
Immunofluorescence analysis of DYRK2 and DNMT1 in colorectal mouse
tumors was further performed to investigate the involvement of
DYRK2 expression in DNMT1. DYRK2 expression levels were
downregulated in the tumor tissue compared with adjacent
non-cancerous tissue (Fig. 5C). Of
note, focal nuclear staining of DNMT1 was observed in the tumor
tissue, whereas an overall cell distribution pattern of DNMT1 was
exhibited in the adjacent tissue (Fig.
5C). RT-qPCR of tumor and adjacent non-cancerous tissue was
performed to determine the mRNA expression level of DYRK2;
consistent with the human samples, DYRK2 mRNA expression was lower
in CRC tissue compared with adjacent tissues in the murine model
(Fig. 5D).
The degree of methylation at the DYRK2 promoter
region was determined in human CRC. A total of 20 pairs of matched
CRC and adjacent non-cancerous colorectal tissues, which expressed
low levels of DYRK2 mRNA, were analyzed by quantitative PCR
amplification using DNA methylation enrichment methods. The results
of the methylation analysis suggested that the degree of
methylation at the DYRK2 promoter area was increased in the CRC
tissues compared with that in the adjacent non-cancerous tissues
(Fig. 5E). These results suggested
that DYRK2 expression in CRC was suppressed by DYRK2 promoter
region methylation and was involved in the nuclear localization of
DNMT1.
Discussion
The results of the present study demonstrated the
molecular mechanism of DYRK2 gene regulation in CRC. These results
suggested that the promoter regions of the DYRK2 gene were
methylated in both CRC cell lines and tissues. Suppression of
methylation in the DYRK2 promoter region by Aza and knockdown of
DNMT1 upregulated DYRK2 expression. Thus, the DYRK2 gene may be a
target for aberrant DNA methylation in cancer.
DYRK2 is a tumor suppressive factor that acts via
modifications of p53, c-Myc and c-Jun (19,22).
DYRK2 knockdown has been demonstrated to promote cell proliferation
in breast, ovarian and cervical cancer (35). The present study demonstrated that
DYRK2 overexpression led to inhibition of cell proliferation in a
CRC cell line. In addition, DYRK2 expression was demonstrated to be
regulated at the transcriptional level, as the mRNA level of DYRK2
was significantly decreased in CRC compared with adjacent
non-cancerous tissues.
The present study demonstrated that the promoter
area of DYRK2 contained a GC-rich genomic sequence and is regulated
by DNA methylation. Considering that key tumor suppressor proteins,
such as retinoblastoma, p16, von Hippel-Lindau and CDH1, are
frequently silenced by DNA methylation within their gene promoters
(12), the regulation of DYRK2 by
DNA methylation may serve a key role in tumorigenesis.
Aza is a nucleoside inhibitor that was the first
hypo-methylating agent to be approved by the US Food and Drug
Administration for the treatment of myelodysplastic syndrome and
acute myeloid leukemia (36). A
previous study has reported that Aza disrupts the interaction
between DNA and DNMTs (37), and
low-dose Aza exerts antitumor effects such as the inhibition of
subpopulations of cancer stem-like cells (38). The results of the present study
demonstrated that Aza treatment decreased the methylation level of
DYRK2 promoter area and increased DYRK2 mRNA and protein levels.
Furthermore, DYRK2 with increased expression inhibited CRC cell
proliferation in vitro. These results suggested the
possibility that one of the mechanisms for cell proliferation by
Aza treatment was mediated by DNA methylation of DYRK2.
The methylation of mammalian genomic DNA by Aza
treatment is catalyzed by DNMTs (29). DNMT1 is the predominant enzyme
responsible for the maintenance of DNA methylation (13). In the present study, the mRNA and
protein levels of DYRK2 were upregulated by the knockdown of DNMT1
in CRC cells. This result indicated the that DNMT1 may induce the
methylation of DYRK2. Overall, the results of the present study
suggested that the transcription of DYRK2 was upregulated by
treatment with Aza, which induced the inhibition of DNMT1.
A previous study has demonstrated that DNMT1 is
localized to the replication foci during the S-phase to duplicate
the DNA methylation patterns in daughter strands (39). Further studies have reported that
DNMT1 was highly expressed in pancreatic cancer (40), glioblastoma (41), leukemia (42) and colon cancer (43). Of note, the immunofluorescent
staining in the present study revealed that DNMT1 was upregulated
and primarily localized to the nucleus in mouse CRC tissues. DYRK2
predominantly resided in the cytoplasm in healthy tissue, and the
expression was downregulated in the tumor compared with adjacent
non-cancerous tissue. These alterations were observed at 10 weeks
after AOM/DSS treatment. Therefore, the mechanism of alteration in
DNMT localization may be involved in the regulation of DYRK2
expression as well as tumorigenesis and proliferation in CRC. The
present study also demonstrated the hypermethylation of the DYRK2
promoter area in human CRC compared with adjacent non-cancerous
tissues.
Clinicopathological analysis, including 80 CRC
patients, indicated that low mRNA levels of DYRK2 were
significantly associated with the tumor location in the colon and
patients age ≥70 years. The prognostic prediction of tumor site in
CRC remains controversial, and a previous study have indicated that
patients with advanced stage rectal cancer exhibited a longer
overall survival by 3-4-months compared with those with colon
cancer (44). Therefore, the
results of the present study suggested that DYRK2 may be a
candidate biomarker for prognostic prediction in patients with CRC.
However, no significant association was observed between DYRK2 mRNA
expression and clinical stage. This may be due to the small number
of samples (80 patients). Thus, the sample size will be increased
in our further studies.
There were some limitations in the current study.
First, the exact position of methylation in the DYRK2 promoter
region could not be identified. The results demonstrated that the
DYRK2 promoter region contained several CpGs, which was determined
using a program for PCR primer design. However, the methylation
site could not be identified using bisulfite pyrosequencing
analysis due to the complex sequence of the DYRK2 promoter region
containing a large proportion of CpG repeat genomic sequences.
Therefore, it is necessary to use an alternative approach to
identify the methylation position in the DYRK2 promoter. Another
limitation is that Aza treatment results in non-specific overall
DNA demethylation, which may affect multiple regulatory pathways
(29). Therefore, it is necessary
to confirm changes in cell proliferation using DYRK2-specific
methylation inhibitor in the future.
In conclusion, the results of the present study
suggested a regulatory mechanism for cancer cell proliferation by
methylation of the DYRK2 promoter area associated with the effects
of DNMT1. Identifying new drugs that specifically target DYRK2 and
restore DYRK2 expression may be a potential therapeutic strategy
for the treatment of CRC.
Supplementary Data
Abbreviations:
|
DYRK2
|
dual specificity
tyrosine-phosphorylation- regulated kinase 2
|
|
DNMT
|
DNA methyltransferase
|
|
CRC
|
Colorectal cancer
|
|
TSS
|
transcription start site
|
|
ChIP
|
chromatin immunoprecipitation
|
|
Aza
|
5-Azacytidine
|
|
AOM
|
azoxymethane
|
|
DSS
|
dextran sodium sulfate
|
Acknowledgements
The authors would like to thank Dr Daisuke Ito
(Department of Surgery, The Jikei University School of Medicine)
for sampling of the clinical specimens for the in vitro
experiments.
Funding
This study was supported by grants from the Japan
Society for the Promotion of Science (KAKENHI; grant nos. 18K15253
and 17H03584 to K. Yoshida, 18K19484 and 16K18434 to K.Yamada and
19K16781 to S. Yoshida), Japan Agency for Medical Research and
Development (grant no. A326TS), the Jikei University Graduate
Research Fund for Graduate Students and the Jikei University
Research Fund.
Availability of data and materials
The data sets used and/or analyzed during the
current study are available from the corresponding author on
reasonable request.
Authors' contributions
TK and KoY designed and performed the study. SY and
SH analyzed the immunofluorescence and immunohistochemistry data.
KE made substantial contributions to the analysis and
interpretation of the data. KA, KaY and KiY supervised the
research. TK, KaY, and KiY wrote the manuscript. All authors read
and approved the final manuscript.
Ethics approval and consent to
participate
The study protocol was approved by the Jikei
University School of Medicine Ethics Review Committee (approval no.
24-315 7081). All patients provided written informed consent prior
to the study.
Patient consent for publication
Not applicable.
Competing interests
The authors declare that they have no competing
interests.
References
|
1
|
Bray F, Ferlay J, Soerjomataram I, Siegel
RL, Torre LA and Jemal A: Global cancer statistics 2018: GLOBOCAN
estimates of incidence and mortality worldwide for 36 cancers in
185 countries. CA Cancer J Clin. 68:394–424. 2018. View Article : Google Scholar : PubMed/NCBI
|
|
2
|
Fearon ER and Vogelsteine B: A genetic
model for colorectal tumorigenesis. Cell. 61:759–767. 1990.
View Article : Google Scholar : PubMed/NCBI
|
|
3
|
Dienstmann R, Vermeulen L, Guinney J,
Kopetz S, Tejpar S and Tabernero J: Consensus molecular subtypes
and the evolution of precision medicine in colorectal cancer. Nat
Rev Cancer. 17:79–92. 2017. View Article : Google Scholar : PubMed/NCBI
|
|
4
|
Goldstein DA, Zeichner SB, Bartnik CM,
Neustadter E and Flowers CR: Metastatic colorectal cancer: A
systematic review of the value of current therapies. Clin
Colorectal Cancer. 15:1–6. 2016. View Article : Google Scholar :
|
|
5
|
Siegel R, Desantis C and Jemal A:
Colorectal cancer statistics, 2014. CA Cancer J Clin. 64:104–117.
2014. View Article : Google Scholar : PubMed/NCBI
|
|
6
|
Chaffer CL and Weinberg RA: A perspective
on cancer cell metastasis. Science. 331:1559–1564. 2011. View Article : Google Scholar : PubMed/NCBI
|
|
7
|
Manfredi S, Lepage C, Hatem C, Coatmeur O,
Faivre J and Bouvier AM: Epidemiology and management of liver
metastases from colorectal cancer. Ann Surg. 244:254–259. 2006.
View Article : Google Scholar : PubMed/NCBI
|
|
8
|
Esteller M: Epigenetics in cancer. N Engl
J Med. 358:1148–1159. 2008. View Article : Google Scholar : PubMed/NCBI
|
|
9
|
Simó-Riudalbas L and Esteller M: Cancer
genomics identifies disrupted epigenetic genes. Hum Genet.
133:713–725. 2014. View Article : Google Scholar
|
|
10
|
Berg M and Søreide K: Genetic and
epigenetic traits as biomarkers in colorectal cancer. Int J Mol
Sci. 12:9426–9439. 2011. View Article : Google Scholar
|
|
11
|
Baylin SB and Jones PA: Epigenetic
determinants of cancer. Cold Spring Harb Perspect Biol. 8:pii:
a019505. 2016. View Article : Google Scholar : PubMed/NCBI
|
|
12
|
Feinberg AP: The key role of epigenetics
in human disease prevention and mitigation. N Engl J Med.
378:1323–1334. 2018. View Article : Google Scholar : PubMed/NCBI
|
|
13
|
Miremadi A, Oestergaard MZ, Pharoah PD and
Caldas C: Cancer genetics of epigenetic genes. Hum Mol Genet.
16:R28–R49. 2007. View Article : Google Scholar : PubMed/NCBI
|
|
14
|
Ferguson-Smith AC and Greally JM:
Epigenetics: Perceptive enzymes. Nature. 449:148–149. 2007.
View Article : Google Scholar : PubMed/NCBI
|
|
15
|
Søreide K: Chapter 34 - Cancer Epigenetics
In: Handbook of Epigenetics. 2nd Edition. Academic Press; 2017
|
|
16
|
Nihira NT and Yoshida K: Engagement of
DYRK2 in proper control for cell division. Cell Cycle. 14:802–807.
2015. View Article : Google Scholar : PubMed/NCBI
|
|
17
|
Taira N, Nihira K, Yamaguchi T, Miki Y and
Yoshida K: DYRK2 is targeted to the nucleus and controls p53 via
Ser46 phosphorylation in the apoptotic response to DNA damage. Mol
Cell. 25:725–738. 2007. View Article : Google Scholar : PubMed/NCBI
|
|
18
|
Yoshida K: Nuclear trafficking of
pro-apoptotic kinases in response to DNA damage. Trends Mol Med.
14:305–313. 2008. View Article : Google Scholar : PubMed/NCBI
|
|
19
|
Taira N, Mimoto R, Kurata M, Yamaguchi T,
Kitagawa M, Miki Y and Yoshida K: DYRK2 priming phosphorylation of
c-Jun and c-Myc modulates cell cycle progression in human cancer
cells. J Clin Invest. 122:859–872. 2012. View Article : Google Scholar : PubMed/NCBI
|
|
20
|
Maddika S and Chen J: Protein kinase DYRK2
is a scaffold that facilitates assembly of an E3 ligase. Nat Cell
Biol. 11:409–419. 2009. View Article : Google Scholar : PubMed/NCBI
|
|
21
|
Jung HY, Wang X, Jun S and Park JI:
Dyrk2-associated EDD-DDB1-VprBP E3 ligase inhibits telomerase by
TERT degradation. J Biol Chem. 288:7252–7262. 2013. View Article : Google Scholar : PubMed/NCBI
|
|
22
|
Mimoto R, Taira N, Takahashi H, Yamaguchi
T and Okabe M: DYRK2 controls the epithelial-mesenchymal transition
in breast cancer by degrading Snail. Cancer Lett. 339:214–225.
2013. View Article : Google Scholar : PubMed/NCBI
|
|
23
|
Yamashita S, Chujo M, Moroga T, Anami K,
Tokuishi K, Miyawaki M, Kawano Y, Takeno S, Yamamoto S and Kawahara
K: DYRK2 expression may be a predictive marker for chemotherapy in
non-small cell lung cancer. Anticancer Res. 29:2753–2757.
2009.PubMed/NCBI
|
|
24
|
Zhang X, Xu P, Ni W, Fan H, Xu J, Chen Y,
Huang W, Lu S, Liang L, Liu J, et al: Downregulated DYRK2
expression is associated with poor prognosis and Oxaliplatin
resistance in hepatocellular carcinoma. Pathol Res Pract.
212:162–170. 2016. View Article : Google Scholar : PubMed/NCBI
|
|
25
|
Yan H, Hu K, Wu W, Li Y, Tian H, Chu Z,
Koeffler HP and Yin D: Low expression of dyrk2 (dual specificity
tyrosine phosphorylation regulated Kinase 2) correlates with poor
prognosis in colorectal cancer. PLoS One. 11:e01599542016.
View Article : Google Scholar : PubMed/NCBI
|
|
26
|
Ito D, Yogosawa S, Mimoto R, Hirooka S,
Horiuchi T, Eto K, Yanaga K and Yoshida K: Dual-specificity
tyrosine-regulated kinase 2 is a suppressor and potential
prognostic marker for liver metastasis of colorectal cancer. Cancer
Sci. 108:1565–1573. 2017. View Article : Google Scholar : PubMed/NCBI
|
|
27
|
Livak KJ and Schmittgen TD: Analysis of
relative gene expression data using real-time quantitative PCR and
the 2(-Delta Delta C(T)) method. Methods. 25:402–408. 2001.
View Article : Google Scholar
|
|
28
|
Amin MB, Edge S, Greene F, Byrd DR,
Brookland RK, Washington MK, Gershenwald JE, Compton CC, Hess KR,
Sullivan DC, et al: AJCC Cancer Staging Manual. 8th edition.
Springer; New York: 2017, View Article : Google Scholar
|
|
29
|
Komashko VM and Farnham PJ: 5-azacytidine
treatment reorganizes genomic histone modification patterns.
Epigenetics. 5:229–240. 2010. View Article : Google Scholar : PubMed/NCBI
|
|
30
|
Kim M, Miyamoto S, Sugie S, Yasui Y,
Ishigamori-Suzuki R, Murakami A, Nakagama H and Tanaka T: A
tobacco-specific carcinogen, NNK, enhances AOM/DSS-induced colon
carcinogenesis in male A/J mice. In Vivo. 22:557–563.
2008.PubMed/NCBI
|
|
31
|
Tanaka T, Kohno H, Suzuki R, Yamada Y,
Sugie S and Mori H: A novel inflammation-related mouse colon
carcinogenesis model induced by azoxymethane and dextran sodium
sulfate. Cancer Sci. 94:965–973. 2003. View Article : Google Scholar : PubMed/NCBI
|
|
32
|
Tanaka T, Yasui Y, Tanaka M, Tanaka T,
Oyama T and Rahman KM: Melatonin suppresses AOM/DSS-induced large
bowel oncogenesis in rats. Chem Biol Interact. 177:128–136. 2009.
View Article : Google Scholar
|
|
33
|
Yasui Y, Hosokawa M, Mikami N, Miyashita K
and Tanaka T: Dietary astaxanthin inhibits colitis and
colitis-associated colon carcinogenesis in mice via modulation of
the inflammatory cytokines. Chem Biol Interact. 193:79–87. 2011.
View Article : Google Scholar : PubMed/NCBI
|
|
34
|
Miyoshi N, Nagasawa T, Mabuchi R, Yasui Y,
Wakabayashi K, Tanaka T and Ohshima H: Chemoprevention of
azoxymethane/dextran sodium sulfate-induced mouse colon
carcinogenesis by freeze-dried yam sanyaku and its constituent
diosgenin. Cancer Prev Res (Phila). 4:924–934. 2011. View Article : Google Scholar
|
|
35
|
Mimoto R, Imawari Y, Hirooka S, Takeyama H
and Yoshida K: Impairment of DYRK2 augments stem-like traits by
promoting KLF4 expression in breast cancer. Oncogene. 36:1862–1872.
2017. View Article : Google Scholar
|
|
36
|
Silverman LR, Demakos EP, Peterson BL,
Kornblith AB, Holland JC, Odchimar-Reissig R, Stone RM, Nelson D,
Powell BL, DeCastro CM, et al: Randomized controlled trial of
azacitidine in patients with the myelodysplastic syndrome: A study
of the cancer and leukemia group B. J Clin Oncol. 20:2429–2440.
2002. View Article : Google Scholar : PubMed/NCBI
|
|
37
|
Gnyszka A, Jastrzebski Z and Flis S: DNA
methyltransferase inhibitors and their emerging role in epigenetic
therapy of cancer. Anticancer Res. 33:2989–2996. 2013.PubMed/NCBI
|
|
38
|
Tsai HC, Li H, Van Neste L, Cai Y, Robert
C, Rassool FV, Shin JJ, Harbom KM, Beaty R, Pappou E, et al:
Transient low doses of DNA-demethylating agents exert durable
antitumor effects on hematological and epithelial tumor cells.
Cancer Cell. 21:430–446. 2012. View Article : Google Scholar : PubMed/NCBI
|
|
39
|
Probst AV, Dunleavy E and Almouzni G:
Epigenetic inheritance during the cell cycle. Nat Rev Mol Cell
Biol. 10:192–206. 2009. View Article : Google Scholar : PubMed/NCBI
|
|
40
|
He S, Wang F, Yang L, Guo C, Wan R, Ke A,
Xu L and Hu G: Expression of DNMT1 and DNMT3a are regulated by GLI1
in human pancreatic cancer. PLoS One. 6:e276842011. View Article : Google Scholar : PubMed/NCBI
|
|
41
|
Rajendran G, Shanmuganandam K, Bendre A,
Muzumdar D, Goel A and Shiras A: Epigenetic regulation of DNA
methyltransferases: DNMT1 and DNMT3B in gliomas. J Neurooncol.
104:483–494. 2011. View Article : Google Scholar : PubMed/NCBI
|
|
42
|
Mizuno S, Chijiwa T, Okamura T, Akashi K,
Fukumaki Y, Niho Y and Sasaki H: Expression of DNA
methyltransferases DNMT1, 3A, and 3B in normal hematopoiesis and in
acute and chronic myelogenous leukemia. Blood. 97:1172–1179. 2001.
View Article : Google Scholar : PubMed/NCBI
|
|
43
|
Robertson KD, Uzvolgyi E, Liang G,
Talmadge C, Sumegi J, Gonzales FA and Jones PA: The human DNA
methyltransferases (DNMTs) 1, 3a and 3b: Coordinate mRNA expression
in normal tissues and overexpression in tumors. Nucleic Acids Res.
27:2291–2298. 1999. View Article : Google Scholar : PubMed/NCBI
|
|
44
|
Lee YC, Lee YL, Chuang JP and Lee JC:
Differences in survival between colon and rectal cancer from SEER
data. PLoS One. 8:e787092013. View Article : Google Scholar : PubMed/NCBI
|