Introduction
Colorectal cancer (CRC) is a common malignant tumor
of the digestive tract, with an estimated one million people
diagnosed annually and a mortality rate of ~33% (1). Although the early symptoms of CRC are
difficult to detect, tumor progression and metastasis often
presents with symptoms such as changes in stool habits,
hematochezia and emaciation (2).
Current treatment regimens for CRC include surgery, radiotherapy
and chemotherapy; however, surgery is largely ineffective for
patients with advanced-stage disease and the side effects of
radiotherapy and chemotherapy are severe, with chemoresistance
often posing a major challenge (3,4).
Thus, there is an urgent need to identify novel oncogenes that may
be driving CRC tumorigenesis, which may serve as effective
diagnostic markers and therapeutic targets to facilitate the
diagnosis of early-stage CRC and block tumor development.
Neurotrophin-4 (NTF4) belongs to the family of neurotrophic factors
(NTFs), which are most commonly known for their roles in the
nervous system (5,6). Previous studies have observed that
other NTFs, and their corresponding receptors, are associated with
breast and gastric cancer development (6,7);
however, little is known on the role of NTF4 in this process. Our
previous study demonstrated that NTF4 was upregulated in patients
with CRC, and bioinformatics analysis found NTF4 to be associated
with tumor development (8).
However, the specific mechanisms underlying the role of NTF4 in CRC
remain largely unknown.
Epithelial-to-mesenchymal transition (EMT) is a
crucial process that enables cancer cells to acquire invasive and
metastatic properties. Tumor cells that undergo EMT are
characterized by the loss of epithelial markers and the acquisition
of mesenchymal properties, accompanied by changes in various other
molecular markers, including the down-regulation of epithelial
markers, such as E-cadherin and β-catenin, and the upregulation of
mesenchymal markers, such as vimentin and N-cadherin (9). Our previous study demonstrated that
EMT was instrumental in promoting CRC invasion and progression
(10).
Autophagy is a phagocytic process, whereby
cytoplasmic proteins or organelles are phagocytosed into vesicles
and fused with lysosomes to form autophagic lysosomes, or
autophagolysosomes (11). These
autophagolysosomes degrade the contents of the lysosomes in
response to the metabolic requirements of the cells and provide
nutrients to promote the renewal of organelles. The majority of
malignant tumors are positively or negatively regulated by
autophagy at some point during the initiation, development or
metastasis of tumors; for example, it was previously reported that
autophagy inhibited programmed cell death to inhibit cancer cell
growth (12), whereas another
study reported that autophagy improved the tolerance of cancer
cells to stress and promoted their survival (13). Most previous studies on CRC have
observed that autophagy promotes both the initiation and
development of cancer, and reduces the sensitivity of cancer cells
to treatment (14,15). Thus, the present study aimed to
investigate the role of the novel oncogene, NTF4, as a regulator of
autophagy in CRC.
Materials and methods
Patient samples
The present study was approved by the Ethics
Committee of Shanghai Pudong Hospital and written informed consent
was obtained from all participants. A total of 74 CRC specimens and
4 normal healthy colon tissue samples were collected from patients
between July 2016 and July 2018 (Table
I). Eligible CRC patients should have received adjuvant
chemotherapy or radiotherapy prior to surgery, and patients with
additional cancer diagnoses were excluded from the study. All
patients were classified according to the TNM staging system (8th
edition; https://cancerstaging.org).
Postoperative adjuvant therapies were performed according to the
standard schedule and doses.
 | Table IClinical characteristics of
patients. |
Table I
Clinical characteristics of
patients.
|
Characteristics | No. |
|---|
| Tumor (T)
stage | |
| pT1 | 3 |
| pT2 | 7 |
| pT3 | 22 |
| pT4 | 42 |
| N stage | |
| N0 | 48 |
| N1 | 22 |
| N2 | 4 |
| M stage | |
| M0 | 70 |
| M1 | 4 |
| Age, years | |
| ≤45 | 24 |
| >45 | 50 |
| Sex | |
| Male | 54 |
| Female | 20 |
| Tumor location | |
| Right colon | 29 |
| Left colon | 12 |
| Transverse
colon | 5 |
| Sigmoid colon | 28 |
| Histological
grade | |
|
Well-differentiated | 70 |
| Poorly
differentiated | 4 |
| Mucinous colloid
type | |
| No | 57 |
| Yes | 17 |
Immunohistochemistry (IHC)
IHC staining was performed on paraffin-embedded
sections obtained from the patient tissues. The sections were
subsequently deparaffinized in xylene and rehydrated in a
descending series of ethanol (100, 90, 80 and 75%) for 3 min each,
followed by heating in sodium citrate buffer for antigen retrieval.
The sections were blocked in 5% BSA (Beyotime Institute of
Biotechnology) and incubated with a rabbit anti-NTF4 primary
antibody (1:100; cat. no. 12297; ProteinTech Group, Inc.) at 4°C
overnight. Following incubation with the primary antibody, the
sections were incubated with a horseradish peroxidase
(HRP)-conjugated anti-rabbit secondary antibody (1:200; cat. no.
SA00001; ProteinTech Group, Inc.) for 1 h at room temperature. The
slides were subsequently stained with 3,3′-diaminobenzidine and
hematoxylin at room temperature for 5 min, and visualized using an
Olympus IX71 inverted microscope (Olympus Corporation) at a
magnification of ×200.
Cell lines and reagents
The human CRC cell lines HCT-116 and HT-29 were
purchased from the American Type Culture Collection and cultured in
RPMI-1640 medium supplemented with 10% FBS (Invitrogen; Thermo
Fisher Scientific, Inc.) and maintained in a humidified atmosphere
at 37°C and 5% CO2. Cells were digested and passaged
upon reaching 80% confluence. All cell lines were authenticated
using STR profiling and all experiments were performed with
mycoplasma-free cells.
Cell transfection
Three short hairpin RNAs (shRNAs) targeting NTF4 and
a scramble (scr) control were cloned into the pLKO.1 lentiviral
vector (Table II). The pLKO-1.
shRNA (sh)NTF4 plasmid, psPAX2 and PMG.2G were co-transfected into
293 cells to obtain the shNTF4 lentivirus using
Lipofectamine® 3000 reagent (Thermo Fisher Scientific,
Inc.), according to the manufacturer's protocol. The shNTF4
lentiviral supernatant was subsequently harvested and used to
infect HCT-116 and HT-29 cells at a multiplicity of infection of
25. Infected cells were screened using puromycin (5 µg/ml)
for 72 h and the expression levels of NTF4 in the cells were
confirmed using western blotting.
| Table IIshRNA sequence for NTF4 and siRNA
sequence for Atg5. |
Table II
shRNA sequence for NTF4 and siRNA
sequence for Atg5.
| Sense (5′-3′) | Antisense
(5′-3′) |
|---|
| NTF4-sh1 |
GCUGAUAACGCUGAGGAAGTT |
CUUCCUCAGCGUUAUCAGCTT |
| NTF4-sh2 |
GCAAGGCCAAGCAGUCCUATT |
UAGGACUGCUUGGCCUUGCTT |
| NTF4-sh3 |
GCUGGCGAUGGAUUCGAAUTT |
AUUCGAAUCCAUCGCCAGCTT |
| siAtg5 |
GACGUUGGUAACUGACAAATT |
UUUGUCAGUUACCAACGUCTT |
The siRNAs were transfected into HCT-116 cells using
Lipofectamine® 3000 reagent, according to the
manufacturer's protocol.
Reverse transcription-quantitative PCR
(RT-qPCR) analysis
Total RNA was extracted using TRIzol®
reagent (Beyotime Institute of Biotechnology), according to the
manufacturer's protocol. Total RNA was reverse-transcribed into
cDNA using the PrimeScript™ RT reagent kit (Takara Bio, Inc.) at
37°C for 15 min and 85°C for 5 sec. qPCR (95°C for 30 sec; 95°C for
3 sec, 60°C for 30 sec, for 40 cycles) was subsequently performed
using the SYBR® Premix Taq™ kit (Takara Bio, Inc.) and a
Vii 7R real-time PCR machine (Applied Biosystems; Thermo Fisher
Scientific, Inc.). The primers used for the qPCR are listed in
Table III. Expression levels
were quantified using the 2−ΔΔCq method (16) and normalized to the internal
reference gene β-actin.
| Table IIIPrimers for reverse
transcription-quantitative PCR analysis. |
Table III
Primers for reverse
transcription-quantitative PCR analysis.
| Gene | Forward primer
(5′-3′) | Reverse primer
(5′-3′) |
|---|
| NTF4 |
GTACTTCTTTGAAACCCGCTG |
GCAGTGTCAATTCGAATCCATC |
| GAPDH |
GGGACCTGACTGACTACCTC |
TCATACTCCTGCTTGCTGAT |
| Ecad |
AGTCACTGACACCAACGATAAT |
ATCGTTGTTCACTGGATTTGTG |
| Vim |
AGTCCACTGAGTACCGGAGAC |
CATTTCACGCATCTGGCGTTC |
| Snail1 |
AAGGATCTCCAGGCTCGAAAG |
GCTTCGGATGTGCATCTTGA |
| Beclin-1 |
CAAGATCCTGGACCGTGTCA |
TGGCACTTTCTGTGGACATCA |
| Atg4b |
AGAGCCCGTTTGGATACT |
GTCGATGAATGCGTTGAG |
| Atg7 |
TGTATAACACCAACACACTCGA |
GGCAGGATAGCAAAACCAATAG |
| Vsp34 |
GGACCTTCTGACCACGAT |
GCAACAGCATAACGCCTC |
Western blotting
Total protein was extracted from the cells using
RIPA lysis buffer with 1% phenylmethanesulfonyl fluoride and 1%
DL-Dithiothreitol. Total protein was quanti-fied using a
bicinchoninic acid assay kit (Beyotime Institute of Biotechnology)
and 20 µg protein/lane was separated by 10% SDS-PAGE. The
separated proteins were subsequently transferred onto PVDF
membranes (Beijing Solarbio Science & Technology Co., Ltd.) and
blocked with 5% BSA for 1 h at room temperature. The membranes were
incubated with the following primary antibodies at 4°C for 12 h:
Anti-NTF4 (1:1,000; ProteinTech Group, Inc.), anti-E-cadherin
(1:1,000; cat. no. 20874; ProteinTech Group, Inc.), anti-N-cadherin
(1:1,000; cat. no. 22018 ProteinTech Group, Inc.), anti-vimentin
(1:1,000; cat. no. 10366; ProteinTech Group, Inc.), anti-Twist
(1:1,000; cat. no. 25465; ProteinTech Group, Inc.), anti-Atg5
(1:1,000; cat. no. 10181; ProteinTech Group, Inc.), anti-Beclin-1
(1:1,000; cat. no. ab207612; Abcam), anti-p62 (1:1,000; cat. no.
56416; Abcam), anti-LC3B (1:1,000; cat. no. ab51520; Abcam),
anti-phosphorylated (p)-p38 mitogen-activated protein kinase (MAPK;
1:1,000; cat. no. 4511; Cell Signaling Technology, Inc.), anti-p38
MAPK (1:1,000; cat. no. 8690; Cell Signaling Technology, Inc.),
anti-phosphorylated extracellular signal-regulated kinase
(p-ERK)1/2 (1:1,000; cat. no. 4370; Cell Signaling Technology,
Inc.), anti-ERK1/2 (1:1,000; cat. no. 4695; Cell Signaling
Technology, Inc.), anti-p-JNK (1:1,000; cat. no. 9255; Cell
Signaling Technology, Inc.) and anti-β-actin (1:4,000; cat. no.
600008; ProteinTech Group, Inc.). Following incubation with the
primary antibody, the membranes were incubated with anti-rabbit
HRP-conjugated secondary antibodies (1:4,000; ProteinTech Group,
Inc.) for ~1 h at room temperature. Protein bands were visualized
using ECL reagents (Thermo Fisher Scientific, Inc.) and an Omega
Lum G machine (Aplegen).
Co-immunoprecipitation (Co-IP)
A total of 1×10⁷ cells were harvested and
lysed using NP-40 buffer. The lysates were pre-cleared using 20
µl Protein A/G sepharose beads (Santa Cruz Biotechnology,
Inc.) and subsequently centrifuged at 3,000 × g for 5 min at 4°C to
obtain the supernatant. The pre-cleared lysate was incubated with 1
µg anti-NTF4 polyclonal antibody for 12 h at 4°C with
gentile rotation. Subsequently, 50 µl Protein A/G sepharose
beads were added to the lysate to capture the immunocomplex.
Following incubation for 4 h at 4°C, the beads were harvested by
centrifugation at 3,000 × g at 4°C for 3 min, and washed four times
with NP-40 buffer. Elution of the proteins was conducted by adding
2X SDS loading buffer to the beads and boiling for 5 min at 95°C
before subsequently performing western blotting, as previously
described.
Immunofluorescence (IF) staining
Coverslips were placed horizontally on the bottom of
a 6-well plate and 1×10⁶ cells were seeded/well and
cultured at 37°C overnight. Cells were fixed with 4%
paraformaldehyde for 10 min at room temperature and then
permeabilized with 0.3% Triton X-100 for 10 min. The coverslips
were blocked with 5% BSA for 60 min and subsequently incubated with
the following primary antibodies at 4°C overnight: Anti-E-cadherin
(1:100), anti-NTF4 (1:100, cat. no. 12297; ProteinTech Group,
Inc.), anti-LC3B (1:100, cat. no. ab51520; Abcam) and anti-Atg5
(1:100; cat. no. sc-133158; Santa Cruz Biotechnology, Inc.). The
coverslips were washed three times with PBS for 5 min prior to
being incubated with an Alexa 594-conjugated anti-rabbit secondary
antibody or an Alexa 488-conjugated anti-mouse secondary antibody
(1:400; cat. no. SA00013; ProteinTech Group, Inc.) for 1 h at 4°C
in the dark. DAPI was used as a counterstain to label the nuclei.
Stained cells were visualized and photographed using an Olympus
IX71 inverted fluorescence microscope (Olympus Corporation) at a
magnification of ×400.
CRC and normal healthy tissues were embedded in
paraffin and cut into 4-µm sections. The sections were
subsequently deparaffinized and blocked as previously described for
IHC staining. Then, the sections were incubated with an anti-NTF4
primary antibody overnight at 4°C, followed by sequential
incubation with an HRP-conjugated secondary antibody for 1 h and a
FITC-conjugated anti-HRP antibody (1:200; ProteinTech Group, Inc.)
for 10 min at room temperature.
The sections were subsequently boiled in 1 mM EDTA,
followed by 15 min at a sub-boiling temperature to remove the
antibodies that were incorporated into the tissues to re-stain for
E-cadherin and Atg5. Similar to NTF-4 staining, anti-E-cadherin and
anti-Atg5 antibodies were incubated with the slides. The sections
were then incubated with HRP-conjugated anti-rabbit/mouse secondary
antibodies and a Cy3-conjugated goat anti-HRP antibody or
Cy5-conjugated goat anti-HRP antibody (1:200; cat. no. SA-00009,
ProteinTech Group, Inc.). DAPI was used as a counterstain to label
the nuclei. Stained sections were visualized and photographed using
an Olympus IX71 inverted fluorescence microscope (Olympus
Corporation) at a magnification of ×400.
Transmission electron microscopy
(TEM)
A total of 1×10⁵ cells were harvested for
TEM, which was performed as previously described (14). Autophagosome formation was
visualized using a Hitachi HT7700 transmission electron microscope
(Hitachi High-Technologies Corporation).
Cell migration and invasion assays
Cell migration and invasion were analyzed using
Transwell plates (pore size, 8 µm; BD Biosciences).
Transwell plates (Corning Inc.) were coated with or without 55
µl Matrigel (1:8; BD Biosciences) for the invasion or
migration assay, respectively. Cells were plated in the upper
chambers of Transwell plates in RPMI-1640 medium without FBS. A
total of 1 ml 90% RPMI-1640 supplemented with 10% FBS was added to
the lower chambers. Following incubation for 48 h, the migrating or
invading cells were fixed with 4% paraformaldehyde for 30 min and
subsequently stained with 0.1% crystal violet solution for 30 min
at room temperature. The stained cells in the lower chamber were
counted using an inverted microscope (Nikon Corporation) at a
magnification of ×400, to evaluate the invasion or migration
ability.
Wound healing assay
A total of 5×10⁵ cells in 10% FBS medium
were seeded into 6-well culture plates and cultured to 90%
confluence. Then, a sterile 200-µl micropipette tip was used
to scratch the cell monolayer. The cells were cultured in
serum-free medium incubated at 37°C for 48 h prior to being
visualized using an inverted microscope (LV150N; Nikon Corporation)
at a magnification of ×200. The wound areas were quantified using
ImageJ software, version 1.8.0 (National Institutes of Health).
Flow cytometric analysis of
apoptosis
A total of 2×10⁵ cells were collected by
centrifugation at room temperature (800 × g for 5 min) and washed
three times with PBS. The samples were resuspended in 100 µl
binding buffer and subsequently stained with 5 µl Annexin-V
and propidium iodide (PI) for 20 min at room temperature in the
dark. Following staining, an additional 400 µl binding
buffer was added to resuspend the sample. Apoptotic cells were
subsequently analyzed using a flow cytometer (BD Biosciences) and
visualized by FlowJo software, version. 7.6.1 (Ashland).
Cell cycle analysis
A total of 1×10⁶ cells were collected by
centrifugation at room temperature (800 × g for 5 min), fixed in
70% ethanol and incubated at 4°C overnight. Cells were subsequently
stained with PI staining solution for 30 min at room temperature in
the dark before being analyzed by flow cytometry. The fractions of
the cells in the G1, S and G2/M phases were calculated using Modfit
software (version 5; Verity Software House, Inc.).
Cell proliferation assay
A total of 3×10³ cells were cultured in
96-well plates in 100 µl RPMI-1640 medium. Cell
proliferation was assessed via the Cell Counting Kit-8 (CCK-8) kit
(Dojindo Molecular Technologies, Inc.) according to the
manufacturer's protocol. Briefly, 10 µl CCK-8 solution was
added to each well of the plate for different incubation times (0,
24, 48 and 72 h) at 37°C. The absorbance was measured at 450 nm
after 2 h of incubation.
Colony formation assay
A total of 500 cells were seeded into 6-well plates
and incubated at 37°C. The colony size was observed daily using a
microscope until the number of cells in the majority of colonies
was >50. The medium was subsequently removed, and the cells were
stained with 0.2% crystal violet solution for 30 min at room
temperature. The cells were washed three times with PBS before the
colonies were visualized and photographed using a light microscope
(77002; Yuyan Instruments Co., Ltd.) at a magnification of ×4. The
rate of colony formation was calculated using the following
equation: Rate of colony formation (%)=(colony number/500)
×100.
Subcutaneous xenografts of nude mice
All experimental procedures were approved by the
Institutional Animal Care and Utilization Committee of Fudan
University Pudong Animal Experimental Center. The study was
conducted according to the Animal Research Reporting In Vivo
Experiments guide-lines. A total of 14 female Balb/c-nu mice,
weighing 20±3 g and aged 5 weeks, were purchased from Beijing Vital
River Laboratory Animal Technology Co., Ltd. The mice were randomly
divided into the HCT116-sh2 and HCT116-scr groups. A total of
5×10⁶ HCT116-sh2 or HCT116-scr cells suspended in 100
µl PBS were injected subcutaneously into the axilla of each
mouse. At 1 week after injection, the long (L) and short (S)
diameter of the tumors were measured using vernier calipers every 3
days (tumor volume=L × S2/2). The measured tumor volume
was used to draw the growth curve of subcutaneous tumors. All mice
were sacrificed 3 weeks after injection and the subcutaneous tumors
were removed completely.
Statistical analysis
Data are presented as the mean ± standard deviation
and each experiment was performed in triplicate. Significant
differences between two groups was performed using a Student's
t-test, whereas differences between >2 groups were performed
using one-way ANOVA, with Tukey's post hoc test for multiple
comparisons. P<0.05 was considered to indicate a statistically
significant difference.
Results
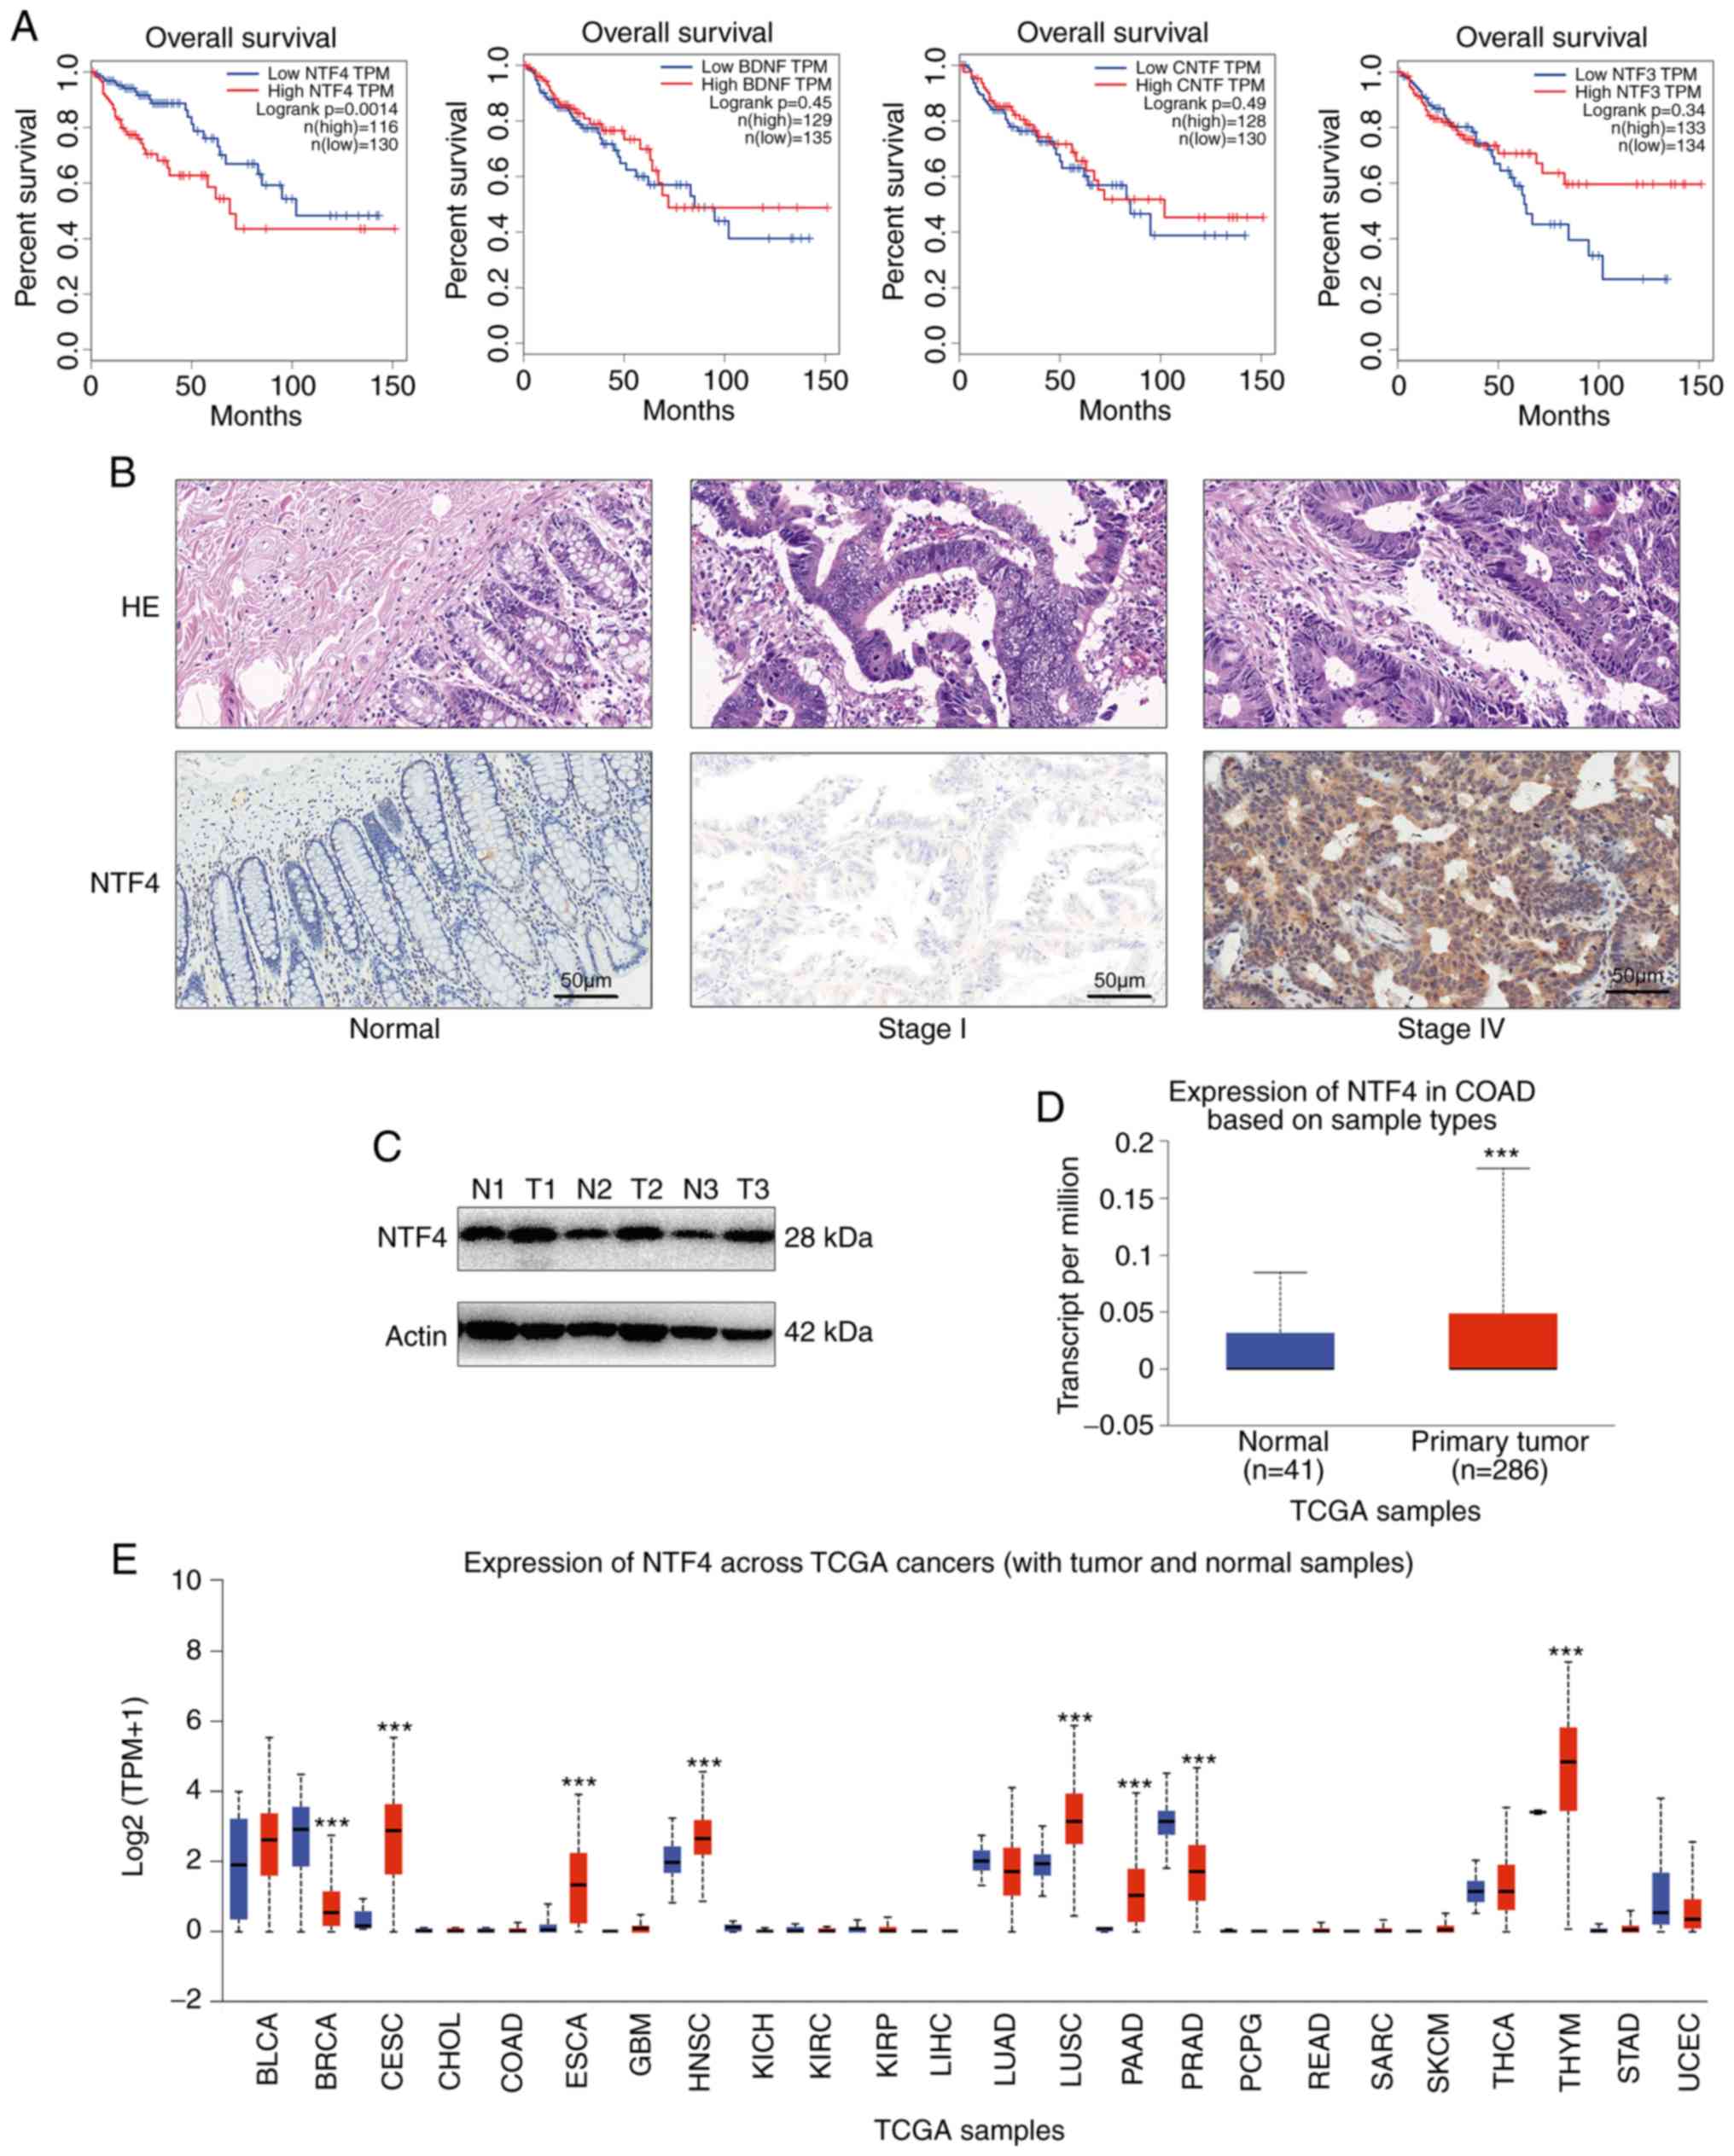
NTF4 is upregulated in CRC tissue
Overall survival (OS) according to the expression of
NTFs was determined using the GEPIA online tool (http://gepia.cancer-pku.cn/) based on TCGA database
via Kaplan-Meier analysis (18).
CRC with high expression levels of NTF4 was associated with poor OS
(Fig. 1A). To confirm the function
of NTF4 in CRC, IHC was performed to detect the expression levels
of NTF4. NTF4 was found to be significantly overexpressed in CRC
tissue compared with healthy non-tumor mucosa, and advanced CRCs
exhibited higher expression levels compared with early-stage CRC
samples (Fig. 1B). Western
blotting confirmed that NTF4 was upregulated at the protein level
in tumor tissue compared with normal tissue (Fig. 1C). Similar results were obtained
through analyzing the expression levels of NTF4 in CRC using TCGA
database and the Ualcan web tool (http://ualcan.path.uab.edu) (19) (Fig.
1D). In addition, the expression levels of NTF4 were
differentially regulated in various other types of cancer,
including cervical and breast cancer (Fig. 1E). Overall, the findings suggested
that NTF4 may act as a biomarker in multiple types of cancer.
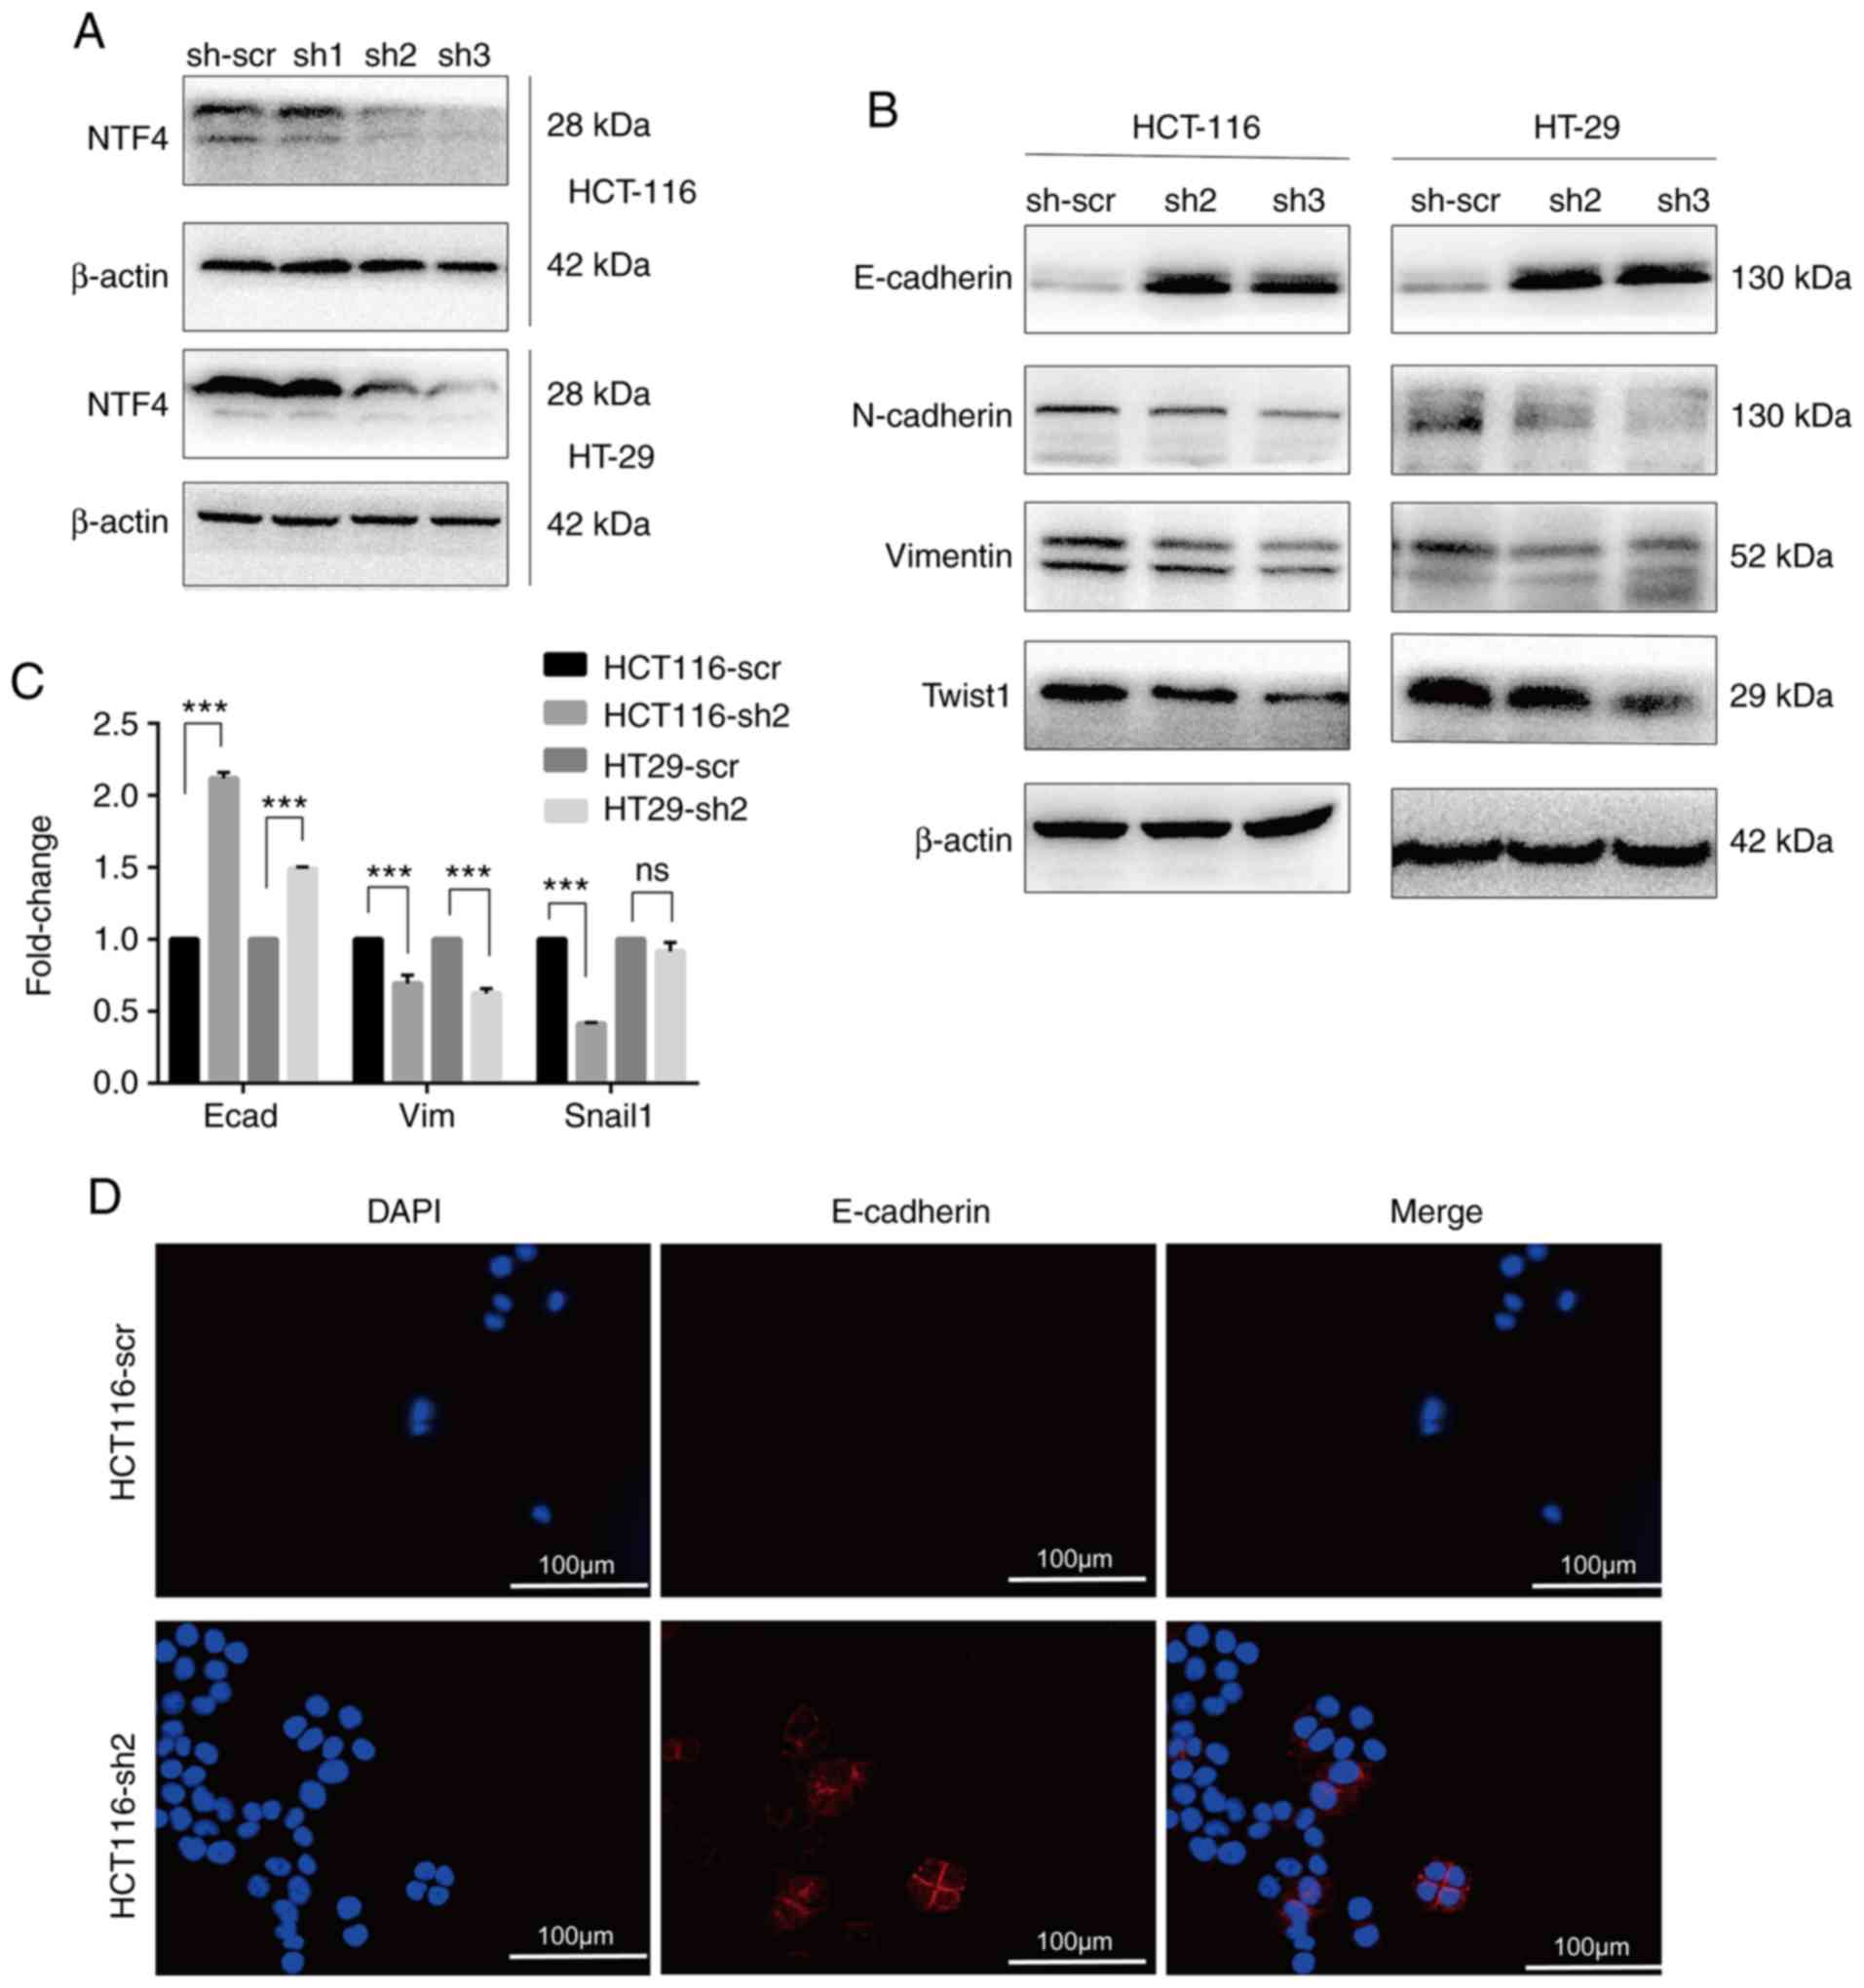
Knockdown of NTF4 inhibits EMT in
vitro
To identify an association between NTF4 and EMT,
three shRNA lentiviruses targeting NTF4 were infected into HCT-116
and HT-29 cells. Using western blotting, sh2 and sh3 were observed
to significantly reduce the expression levels of NTF4 in both CRC
cell lines (Fig. 2A). Several EMT
markers were subsequently detected in sh2 and sh3-infected cells.
The expression levels of E-cadherin were significantly increased,
whereas those of N-cadherin, vimentin and Twist were significantly
decreased in both sh2- and sh3-infected cells compared with
sh-scr-infected cells (Fig. 2B).
RT-qPCR analysis detected results similar to those of western
blotting, except that no significant differences in Snail
expression levels were identified between HT-29-sh2 and HT-29-scr
cells (Fig. 2C). Furthermore, IF
was used to identify the localization and expression of the EMT
marker E-cadherin in HCT-116 cells. E-cadherin was detected on the
cell membrane and cell junctions (Fig.
2D). The expression levels of E-cadherin in HCT116-sh2 cells
were significantly increased compared with HCT116-scr (Fig. 2D). These results indicated that the
knockdown of NTF4 suppressed EMT in CRC cells.
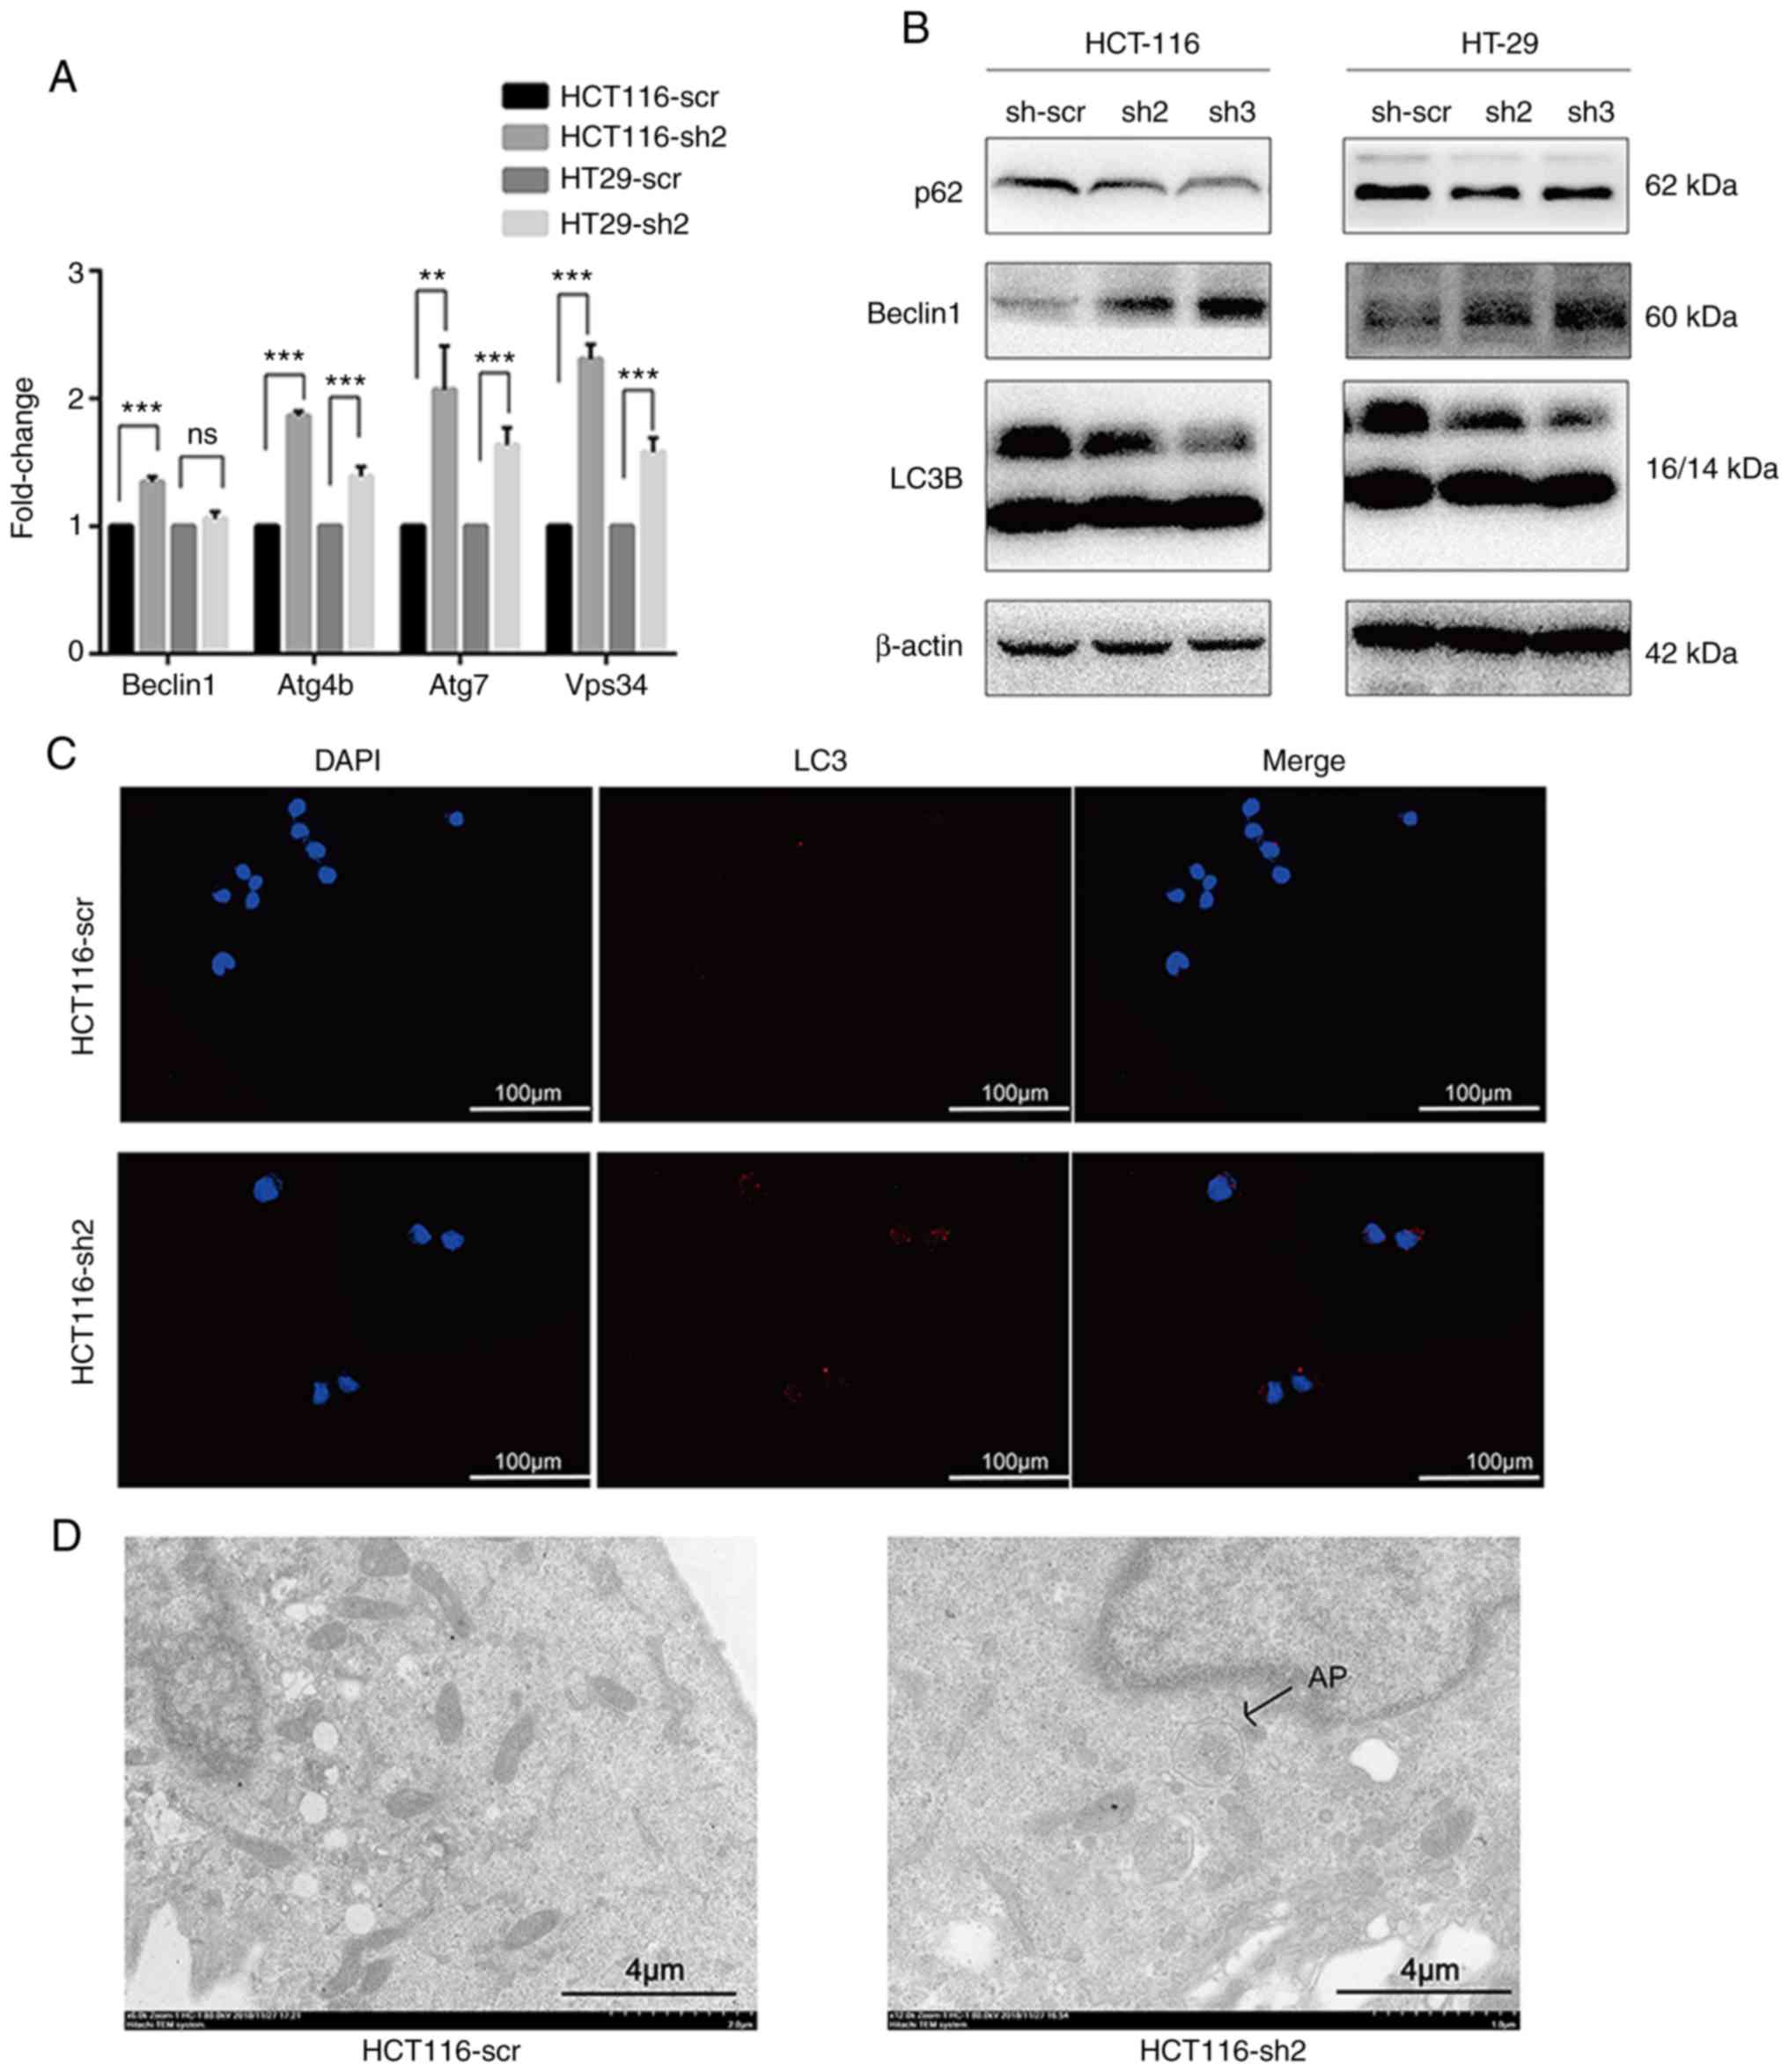
Knockdown of NTF4 activates autophagy in
vitro
To investigate the association between NTF4 and
autophagy, mRNA expression levels of autophagy-associated genes
were assessed by RT-qPCR. The majority of the autophagy-associated
genes were significantly increased in HCT116-sh2 and HT-29-sh2
cells compared with those in HCT116-scr and HT-29-scr cells;
however, no significant difference was observed in the expres-sion
levels of Beclin-1 between HT-29-sh2 and HT-29-scr cells (Fig. 3A). The expression levels of
autophagy-associated proteins were analyzed using western blotting.
In both HCT-116 and HT-29 cells, the expression levels of p62 were
found to be significantly decreased, whereas Beclin-1 and the
LC3II/I ratio were significantly increased in both sh2- and
sh3-infected cells compared with sh-scr-infected cells (Fig. 3B). Furthermore, IF was used to
detect the autophagic flux in HCT-116 cells. The autophagic flux in
HCT116-sh2 cells was significantly increased compared with that in
HCT116-scr-infected cells (Fig.
3C). Finally, TEM was performed to observe autophagosome
formation (Fig. 3D); autophagosome
formation was observed in HCT116-sh2-cells, but not in
HCT116-scr-infected cells. These data indicated that the knockdown
of NTF4 may activate autophagy in CRC cells.
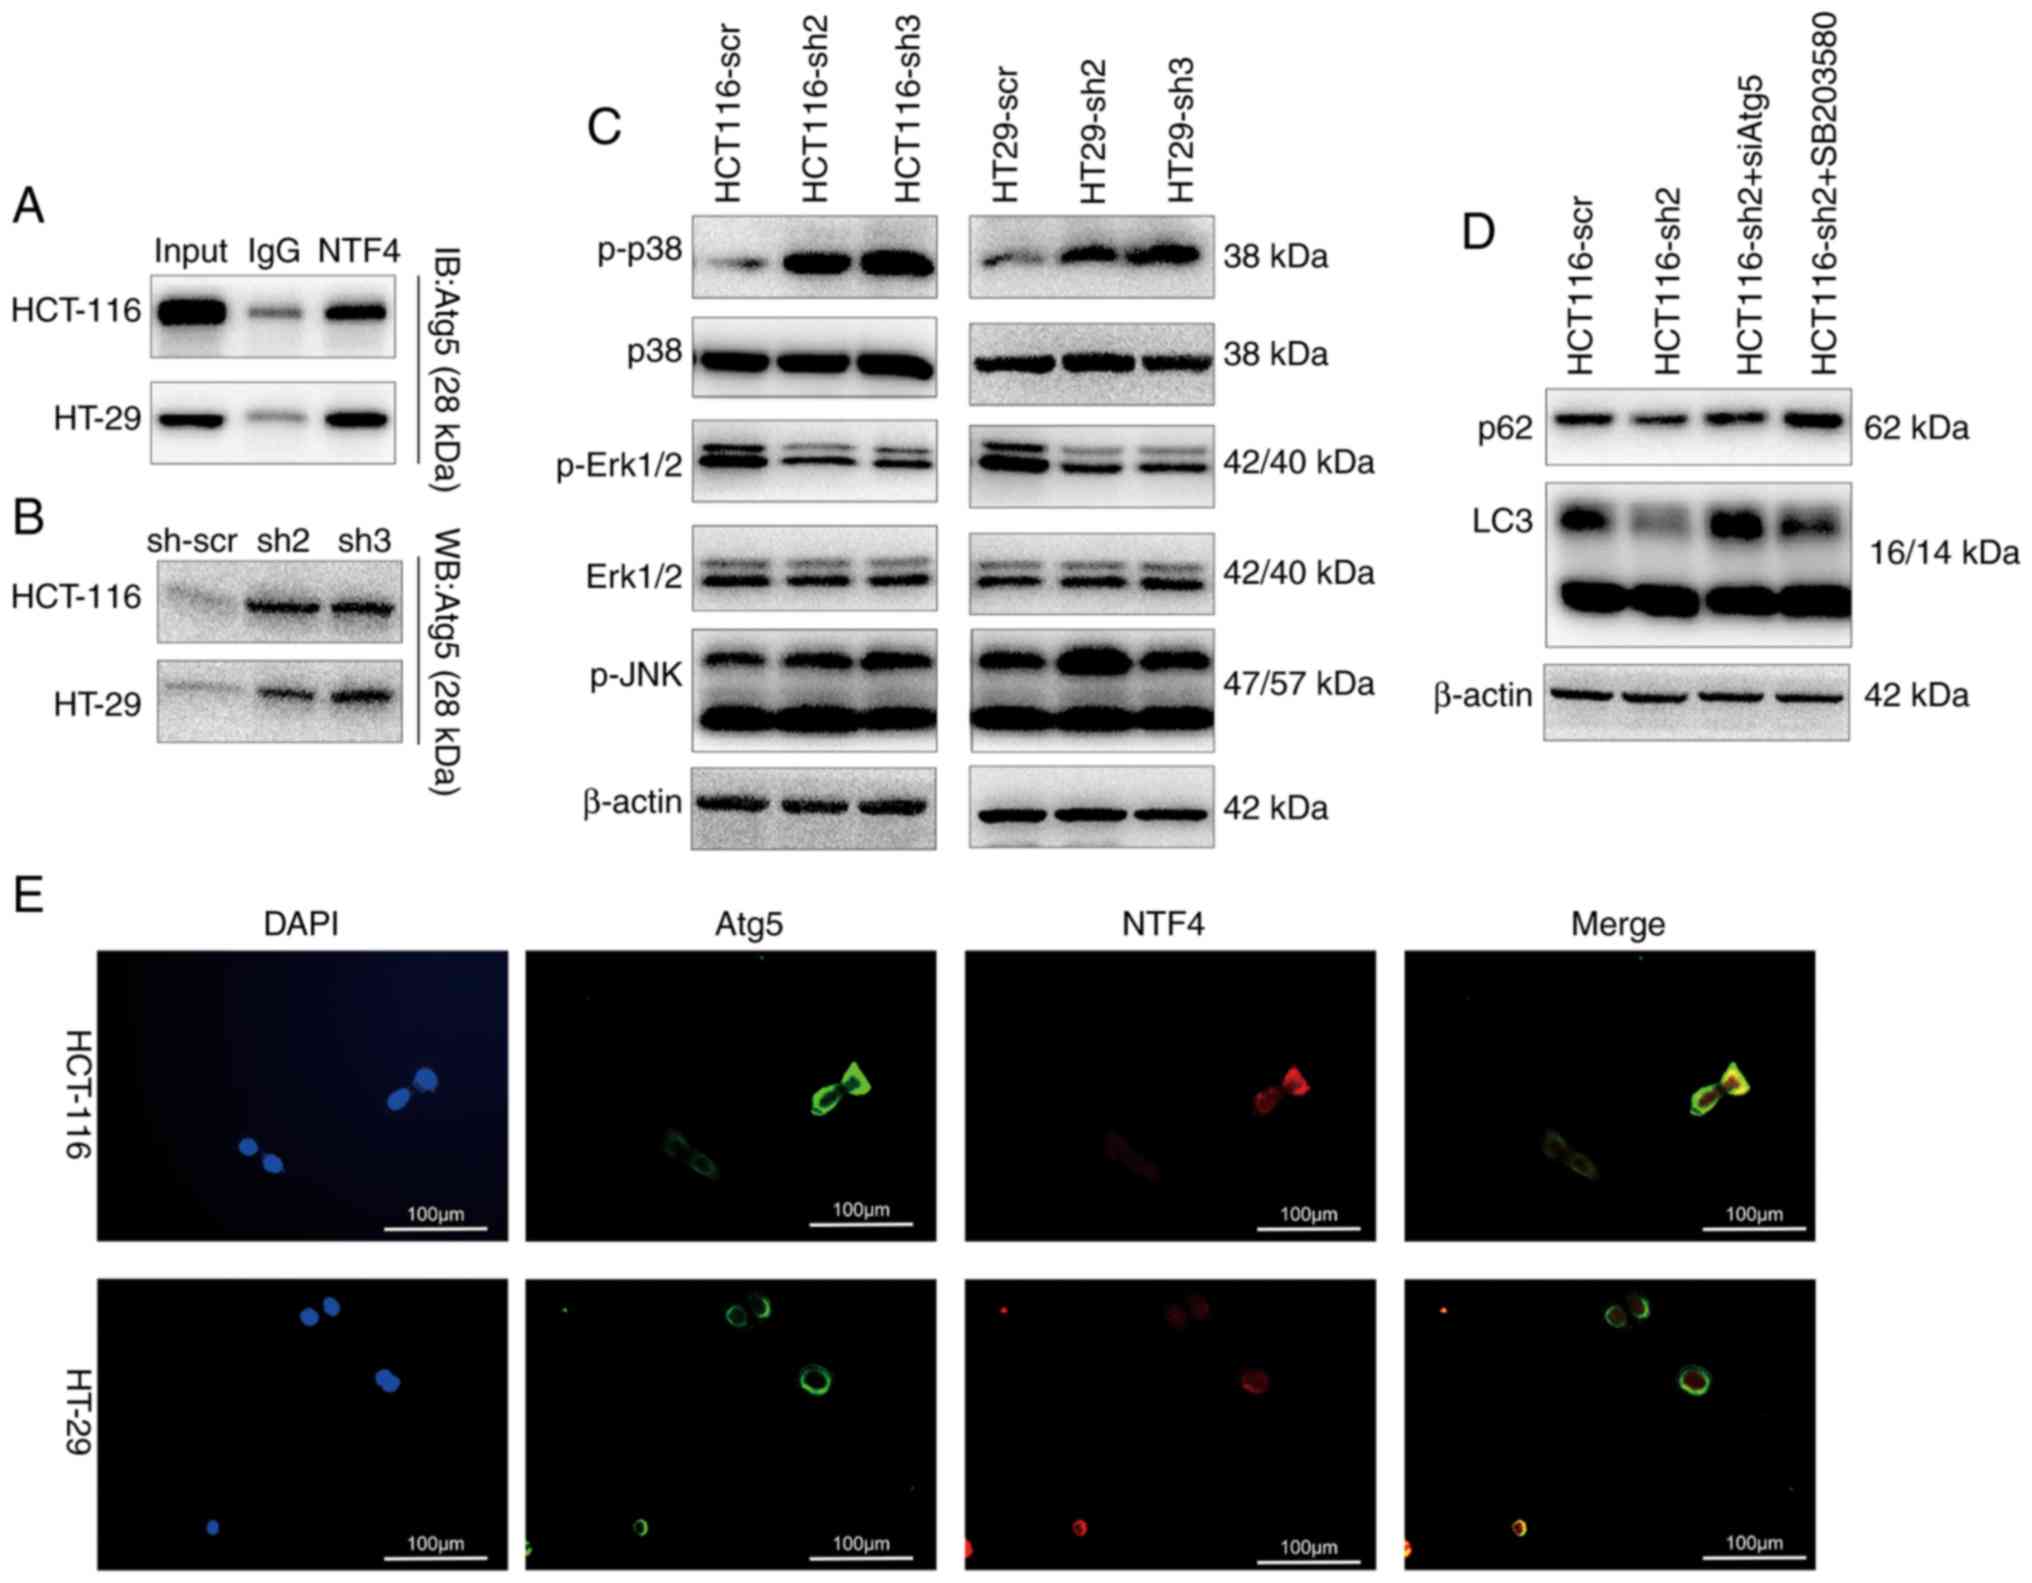
NTF4 regulates autophagy through
interacting with the Atg5 and MAPK pathway
In order to determine the regulatory role of NTF4 in
autophagy, several key autophagy-associated molecules and pathways
were investigated. Through Co-IP analysis, NTF4 was found to
interact with Atg5, an important autophagy regulatory molecule
(Fig. 4A). The knockdown of NTF4
also increased the expression levels of Atg5 (Fig. 4B). IF identified a significant
co-localization between NTF4 and Atg5 in HCT-116 and HT-29 cells
(Fig. 4E). In addition, activation
of the MAPK pathway was detected by western blotting; p38 MAPK
expression levels were significantly upregulated, whereas ERK1/2
expression levels were significantly inhibited in NTF4 knockdown
cells (Fig. 4C). Both siAtg5 and
the p38 MAPK inhibitor SB203580 (10 µM for 2 h) rescued the
decreased expression levels of p62 and increased the LC3 II/I ratio
in HCT116-sh2-infected cells (Fig.
4D).
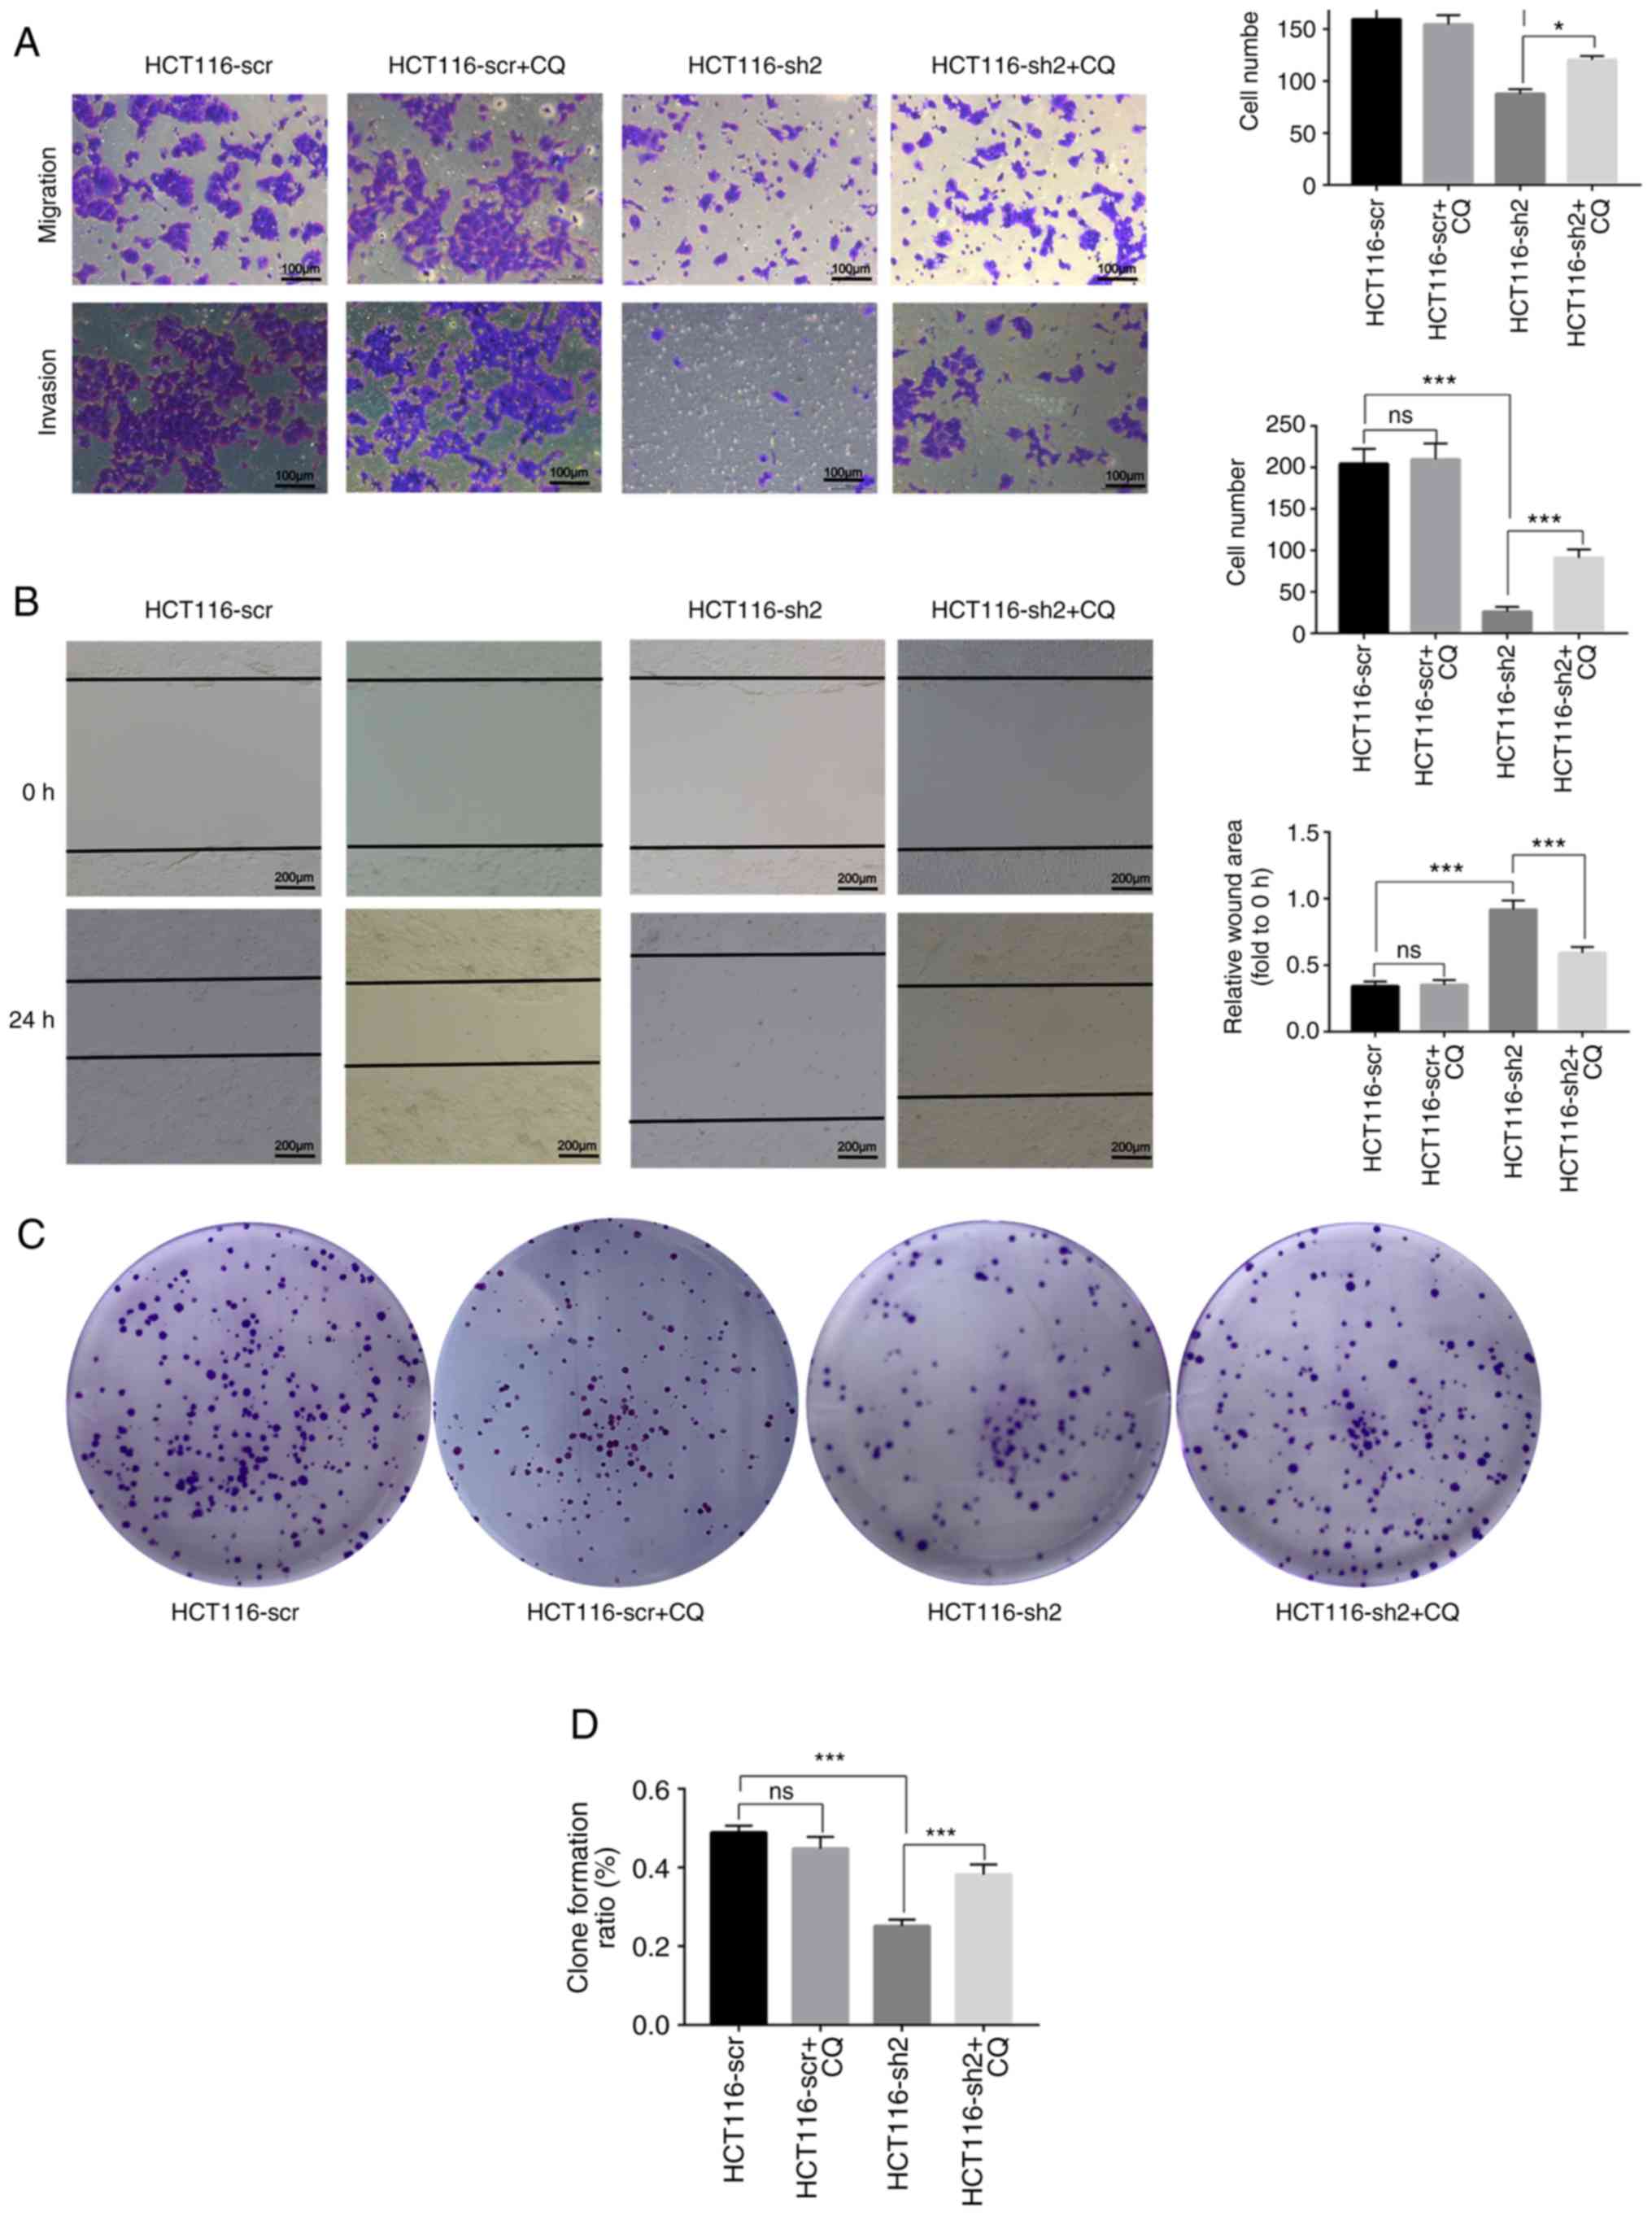
Knockdown of NTF4 inhibits CRC cell
invasion, migration, proliferation and colony formation, and
promotes cell cycle arrest
In order to determine the association between
NTF4-induced autophagy and cell invasion, HCT116-scr and
HCT116-sh2-cells were treated with the autophagy inhibitor
chloroquine (CQ) and Transwell assays were performed. Cells in the
HCT116-sh2 group exhibited reduced migratory and invasive capacity
compared with the scramble control group, whereas CQ treatment
successfully increased the migratory and invasive ability of the
HCT116-sh2 group. In addition, CQ treatment exerted no effect on
HCT116-scr. (Fig. 5A). In the
wound healing assay, the wound area in the HCT116-sh2 group was
wider compared with the scramble control group after 48 h, whereas
CQ treatment in the HCT116-sh2 group reduced the size of the wound.
Similarly, CQ exerted no effect on HCT116-scr in this assay
(Fig. 5B). Collectively, these
results indicated that the knockdown of NTF4 may inhibit cell
migration and invasion through activating autophagy.
To investigate the association between NTF4-induced
autophagy and cell proliferation, CCK-8 and colony formation assays
were performed. The knockdown of NTF4 in HCT-116 cells
significantly inhibited colony formation, whereas CQ treatment
reversed this inhibition (Fig. 5C and
D). Similar to colony formation, the proliferation of HCT-116
cells was also inhibited by knockdown of NTF4 and was rescued by CQ
treatment. CQ treatment exerted no effect on HCT116-scr in the
proliferation and colony formation assays (Fig. 5E). Flow cytometric analysis
conducted to determine the effect of NTF4 on the cell cycle
revealed that sh2-infected cells had an increased percentage of
cells in the G1 phase and a decreased percentage in the S phase,
which indicated that the knockdown of NTF4 promoted cell cycle
arrest. CQ treatment significantly rescued cell cycle arrest in the
HCT116-sh2 group. However, CQ treatment also reduced cell cycle
arrest in HCT116-scr (Fig. 5F and
G).
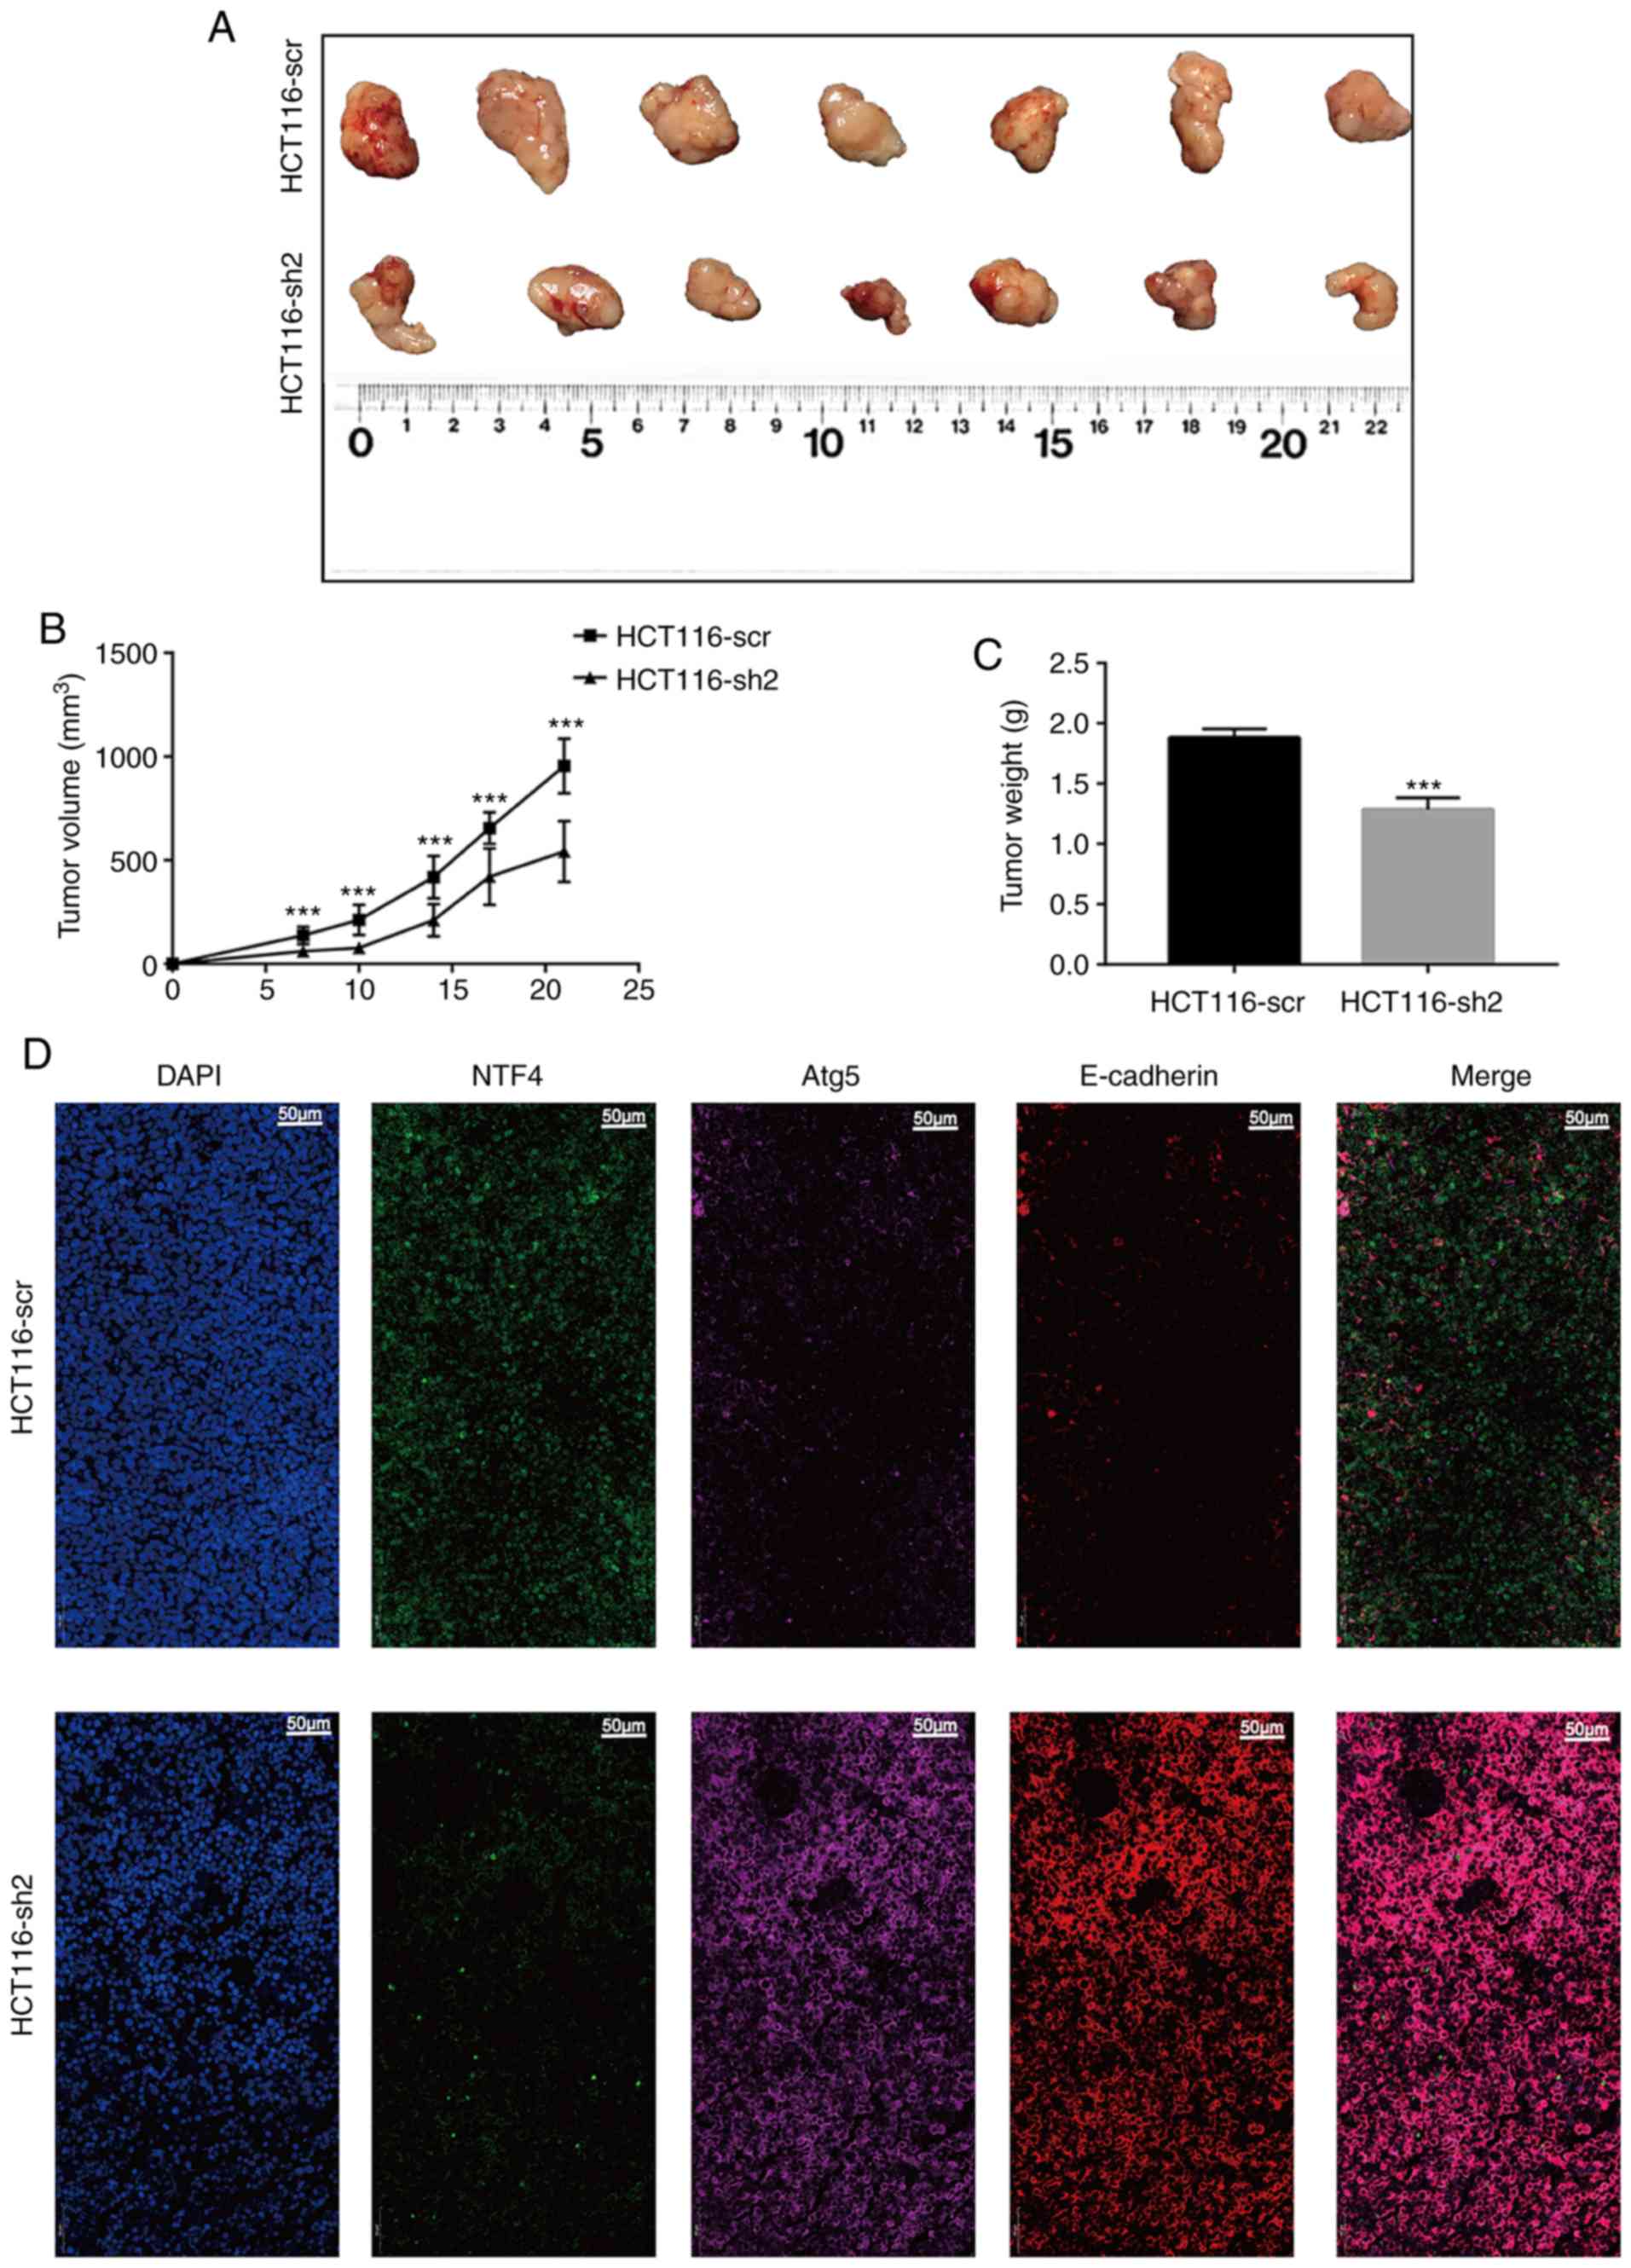
Knockdown of NTF4 suppresses tumor growth
in vivo
To investigate the effect of NTF4 in vivo,
HCT116-sh2 and HCT116-scr cells were injected into Balb/c-nu mice.
At 7 days post-injection, the tumor volume in the HCT116-sh2 group
was significantly smaller compared with that in the HCT116-scr
group (Fig. 6A and B). This trend
was maintained until day 21, where there was a significant
difference in the growth rate between the two groups. In addition,
the tumor weights within the HCT116-sh2 group were significantly
lower compared with those in the HCT116-scr group (Fig. 6C). The expression of the EMT marker
E-cadherin and the autophagy marker Atg5 was further investigated
using IF. Similar to in vitro studies, the expression of
both E-cadherin and Atg5 was significantly increased in
HCT11-sh2-derived compared with HCT11-scr-derived xenografts
(Fig. 6D). These findings
indicated that the knockdown of NTF4 in vivo may also
suppress EMT and activate autophagy.
Discussion
NTF4 encodes the protein NTF4, which is a
neurotrophic factor that signals predominantly through the TrkB
receptor tyrosine kinase. The majority of studies on NTF4 has
focused on its functions in neurology and ophthalmology, but rarely
on its role in cancer, with the exception of breast cancer, where
NTF4 was shown to contribute to cancer cell survival and served as
a potential target to inhibit tumor growth (20). Our previous study demonstrated that
NTF4 was significantly overexpressed in CRC tissues compared with
normal tissues (21). NTF4 was
also observed to be associated with tumor progression. EMT is an
important mechanism that initiates tumor invasion and migration to
promote tumor progression. In addition, previous studies have
revealed that autophagy is associated with tumor progression; the
dietary intake of urolithin A inhibited the migration of CRC cells
and the activity of matrix metallopro-teinase-9 through inducing
autophagy (22). In another study,
RNF216 prevented autophagy in CRC cells through inhibiting the
autophagy-associated gene Beclin-1 during nutritional starvation,
thus promoting the proliferation and migration of CRC cells
(23). Therefore, the aim of the
present study was to further investigate these two mechanisms.
Through western blotting, it was confirmed that the
sh2 and sh3 lentivirus induced the knockdown of NTF4 expression
levels; this significantly increased the expression levels of
E-cadherin, whilst decreasing the expression levels of N-cadherin,
vimentin and Twist. These results suggested that NTF4 may induce
EMT. The knockdown of NTF4 also significantly decreased the
expression levels of p62 and increased the expression levels of
Beclin-1 and the LC3 II/I ratio. NTF4 was also observed to interact
with Atg5, which is an important regulator of autophagy (20). The inhibition of ERK1/2 has
previously been demonstrated to regulate the induction of autophagy
(25,26). p38 MAPK reportedly plays a dual
role in the regulation of autophagy, as both a positive and a
negative regulator; in a previous study, p38 MAPK was found to be a
contributing factor to oridonin-induced autophagy (27), whereas in another study, the
suppression of p38 MAPK promoted necroptotic and autophagic cell
death in tumor necrosis factor α-treated L929 cells (28). The present study demonstrated that
the knockdown of NTF4 increased p38 MAPK and decreased ERK1/2
expression levels, which suggested that the role of NTF4 in the
MAPK pathway may be complicated. Furthermore, the knockdown of NTF4
promoted autophagic flux and the formation of autophagosomes, which
indicated that the knockdown of NTF4 may activate autophagy through
interacting with Atg5 and regulating the MAPK pathway. In addition,
the knock-down of NTF4 significantly inhibited HCT-116 cell
invasion and migration, which was successfully restored by CQ
treatment; similar results were reported for the proliferation and
colony formation assays. It was also observed that the knockdown of
NTF4 promoted cell cycle arrest in HCT-116 cells. As the autophagy
inhibitor exerted similar effects on both HCT116-scr and HCT-sh2,
it was inferred that NTF4 knockdown promoted cell cycle arrest in
HCT-116 cells via activating the p38 MAPK pathway. Previous
research in vascular smooth muscle cells has demonstrated that
Honokiol, an active component in the extracts of Magnolia
officinalis, represses cyclin D1/CDK4 and cyclin E/CDK2 complexes
to block the cell cycle in the G1 phase (29). Finally, knockdown of NTF4 was
observed to significantly inhibit tumor growth in vivo.
However, our research was performed only in HCT-116
and HT-29 cells, and more CRC cell lines must be investigated to
verify the findings of the present study. We also aim to
investigate the specific mechanism of action of NTF4 in other
tumors. In addition, future research will also include other
members of the NTF family.
In conclusion, NTF4 was found to be upregulated in
CRC and was associated with tumor progression; the knockdown of
NTF4 inhibited CRC tumorigenesis, which may be mediated through
regulating EMT and autophagy.
Acknowledgements
Not applicable.
Funding
The present study was funded by The Academic Leaders
Training Program Supported by Pudong Health Bureau of Shanghai
(grant no. PWRd2016-05) and the Scientific Research Foundation
provided by Pudong Hospital affiliated to Fudan University (grant
no. YJ2020-01).
Availability of data and materials
The datasets generated and/or analyzed during the
present study are available from the corresponding author on
reasonable request.
Authors' contributions
YC and ZY designed and performed the experiments; DW
contributed to the statistical analysis of the data; and YQ and ZM
contributed to the design of the study. All authors read and
approved the final version of the manuscript.
Ethics approval and consent to
participate
The present study was approved by the Ethics
Committee of the Shanghai Pudong Hospital and written informed
consent was obtained from all participants. All experimental
procedures on animals were approved by the Institutional Animal
Care and Utilization Committee of Fudan University Pudong Animal
Experimental Center. The study was conducted according to the
Animal Research Reporting In Vivo Experiments guidelines.
Patient consent for publication
Not applicable.
Competing interests
The authors declare that they have no competing
interests.
References
|
1
|
Cunningham D, Atkin W, Lenz HJ, Lynch HT,
Minsky B, Nordlinger B and Starling N: Colorectal cancer. Lancet.
375:1030–1047. 2010. View Article : Google Scholar : PubMed/NCBI
|
|
2
|
Long AG, Lundsmith ET and Hamilton KE:
Inflammation and colorectal Cancer. Curr Colorectal Cancer Rep.
13:341–351. 2017. View Article : Google Scholar : PubMed/NCBI
|
|
3
|
Yatsuoka T, Nishimura Y, Sakamoto H,
Tanaka Y and Kurozumi M: Lymph node metastasis of colorectal cancer
with submucosal invasion. Gan To Kagaku Ryoho. 40:2041–2043.
2013.In Japanese.
|
|
4
|
Shi Y, Huang XX, Chen GB, Wang Y, Zhi Q,
Liu YS, Wu XL, Wang LF, Yang B, Xiao CX, et al: Dragon (RGMb)
induces oxaliplatin resistance in colon cancer cells. Oncotarget.
7:48027–48037. 2016. View Article : Google Scholar : PubMed/NCBI
|
|
5
|
Minichiello L, Casagranda F, Tatche RS,
Stucky CL, Postigo A, Lewin GR, Davies AM and Klein R: Point
mutation in trkB causes loss of NT4-dependent neurons without major
effects on diverse BDNF responses. Neuron. 21:335–345. 1998.
View Article : Google Scholar : PubMed/NCBI
|
|
6
|
Shen Y, Inoue N and Heese K:
Neurotrophin-4 (ntf4) mediates neurogenesis in mouse embryonic
neural stem cells through the inhibition of the signal transducer
and activator of transcription-3 (stat3) and the modulation of the
activity of protein kinase B. Cell Mol Neurobiol. 30:909–916. 2010.
View Article : Google Scholar : PubMed/NCBI
|
|
7
|
Lamouille S, Xu J and Derynck R: Molecular
mechanisms of epithelial-mesenchymal transition. Nat Rev Mol Cell
Biol. 15:178–196. 2014. View
Article : Google Scholar : PubMed/NCBI
|
|
8
|
Morrison CD, Parvani JG and Schiemann WP:
The relevance of the TGF-β Paradox to EMT-MET programs. Cancer
Lett. 341:30–40. 2013. View Article : Google Scholar : PubMed/NCBI
|
|
9
|
Sánchez-Tilló E, Liu Y, de Barrios O,
Siles L, Fanlo L, Cuatrecasas M, Darling DS, Dean DC, Castells A
and Postigo A: EMT-activating transcription factors in cancer:
Beyond EMT and tumor invasiveness. Cell Mol Life Sci. 69:3429–3456.
2012. View Article : Google Scholar : PubMed/NCBI
|
|
10
|
Yang Z, Wu D, Chen Y, Min Z and Quan Y:
GRHL2 inhibits colorectal cancer progression and metastasis via
oppressing epithelial-mesenchymal transition. Cancer Biol Ther.
20:1195–1205. 2019. View Article : Google Scholar : PubMed/NCBI
|
|
11
|
Galluzzi L, Baehrecke EH, Ballabio A, Boya
P, Bravo-San Pedro JM, Cecconi F, Choi AM, Chu CT, Codogno P,
Colombo MI, et al: Molecular definitions of autophagy and related
processes. Embo J. 36:1811–1836. 2017. View Article : Google Scholar : PubMed/NCBI
|
|
12
|
Ouyang L, Shi Z, Zhao S, Wang FT, Zhou TT,
Liu B and Bao JK: Programmed cell death pathways in cancer: A
review of apoptosis, autophagy and programmed necrosis. Cell
Prolif. 45:487–498. 2012. View Article : Google Scholar : PubMed/NCBI
|
|
13
|
Sato K, Tsuchihara K, Fujii S, Sugiyama M,
Goya T, Atomi Y, Ueno T, Ochiai A and Esumi H: Autophagy is
activated in colorectal cancer cells and contributes to the
tolerance to nutrient deprivation. Cancer Res. 67:9677–9684. 2007.
View Article : Google Scholar : PubMed/NCBI
|
|
14
|
Huang S and Sinicrope FA:
Celecoxib-induced apoptosis is enhanced by ABT-737 and by
inhibition of autophagy in human colorectal cancer cells.
Autophagy. 6:256–269. 2010. View Article : Google Scholar : PubMed/NCBI
|
|
15
|
Zhang H, Tang J, Li C, Kong J, Wang J, Wu
Y, Xu E and Lai M: MiR-22 regulates 5-FU sensitivity by inhibiting
autophagy and promoting apoptosis in colorectal cancer cells.
Cancer Lett. 356:781–790. 2015. View Article : Google Scholar
|
|
16
|
Livak KJ and Schmittgen TD: Analysis of
relative gene expression data using real-time quantitative PCR and
the 2(-Delta Delta C(T)) method. Methods. 25:402–408. 2001.
View Article : Google Scholar
|
|
17
|
Yang Z, Yu W, Huang R, Ye M and Min Z:
SIRT6/HIF-1α axis promotes papillary thyroid cancer progression by
inducing epithelial-mesenchymal transition. Cancer Cell Int.
19:172019. View Article : Google Scholar
|
|
18
|
Tang Z, Li C, Kang B, Gao G, Li C and
Zhang Z: GEPIA: A web server for cancer and normal gene expression
profiling and interactive analyses. Nucleic Acids Res. 45:W98–W102.
2017. View Article : Google Scholar : PubMed/NCBI
|
|
19
|
Chandrashekar DS, Bashel B, Balasubramanya
SAH, Creighton CJ, Ponce-Rodriguez I, Chakravarthi BVSK and
Varambally S: UALCAN: A portal for facilitating tumor subgroup gene
expression and survival analyses. Neoplasia. 19:649–658. 2017.
View Article : Google Scholar : PubMed/NCBI
|
|
20
|
Vanhecke E, Adriaenssens E, Verbeke S,
Meignan S, Germain E, Berteaux N, Nurcombe V, Le Bourhis X and
Hondermarck H: Brain-derived neurotrophic factor and
neurotrophin-4/5 are expressed in breast cancer and can be targeted
to inhibit tumor cell survival. Clin Cancer Res. 17:1741–1752.
2011. View Article : Google Scholar : PubMed/NCBI
|
|
21
|
Yang Z, Chen Y, Wu D, Min Z and Quan Y:
Analysis of risk factors for colon cancer progression. Onco Targets
Ther. 12:3991–4000. 2019. View Article : Google Scholar : PubMed/NCBI
|
|
22
|
Zhao W, Shi F, Guo Z, Zhao J, Song X and
Yang H: Metabolite of ellagitannins, urolithin A induces autophagy
and inhibits metastasis in human sw620 colorectal cancer cells. Mol
Carcinog. 57:193–200. 2018. View
Article : Google Scholar :
|
|
23
|
Wang H, Wang Y, Qian L, Wang X, Gu H, Dong
X, Huang S, Jin M, Ge H, Xu C and Zhang Y: RNF216 contributes to
proliferation and migration of colorectal cancer via suppressing
BECN1-dependent autophagy. Oncotarget. 7:51174–51183.
2016.PubMed/NCBI
|
|
24
|
Yousefi S, Perozzo R, Schmid I, Ziemiecki
A, Schaffner T, Scapozza L, Brunner T and Simon HU:
Calpain-mediated cleavage of Atg5 switches autophagy to apoptosis.
Nat Cell Biol. 8:1124–1132. 2006. View
Article : Google Scholar : PubMed/NCBI
|
|
25
|
Shinojima N, Yokoyama T, Kondo Y and Kondo
S: Roles of the Akt/mTOR/p70S6K and ERK1/2 signaling pathways in
curcumin-induced autophagy. Autophagy. 3:635–637. 2007. View Article : Google Scholar : PubMed/NCBI
|
|
26
|
Wang RC, Wei Y, An Z, Zou Z, Xiao G,
Bhagat G, White M, Reichelt J and Levine B: Akt-mediated regulation
of autophagy and tumorigenesis through beclin 1 phosphorylation.
Science. 338:956–959. 2012. View Article : Google Scholar : PubMed/NCBI
|
|
27
|
Cui Q, Tashiro S, Onodera S, Minami M and
Ikejima T: Oridonin induced autophagy in human cervical carcinoma
hela cells through ras, JNK, and P38 regulation. J Pharmacol Sci.
105:317–325. 2007. View Article : Google Scholar : PubMed/NCBI
|
|
28
|
Ye YC, Yu L, Wang HJ, Tashiro S, Onodera S
and Ikejima T: TNFα-induced necroptosis and autophagy via
supression of the p38-NF-κB survival pathway in L929 ells. J
Pharmacol Sci. 117:160–169. 2011. View Article : Google Scholar
|
|
29
|
Lee B, Kim CH and Moon SK: Honokiol causes
the p21WAF1-mediated G(1)-phase arrest of the cell cycle through
inducing p38 mitogen activated protein kinase in vascular smooth
muscle cells. FEBS Lett. 580:5177–5184. 2006. View Article : Google Scholar : PubMed/NCBI
|