Introduction
Currently, lung cancer is the most frequently
diagnosed cancer (11.6% of total cases) and the leading cause of
cancer-associated deaths (18.4% of total cancer deaths) in 2018,
worldwide (1). The estimated
5-year survival rate of patients with lung cancer is ~15% (1). In addition, of the patients who are
diagnosed with lung cancer, 80% are typically diagnosed with
non-small cell lung cancer (NSCLC) (2); therefore, a comprehensive
understanding of NSCLC is urgently required. Lung cancer is
typically diagnosed at a late stage, due to its insidious nature,
and surgical resection is not available as a suitable treatment
option. Currently, tyrosine kinase inhibitors (such as gefitinib
and erlotinib) are the most commonly used drugs for treatment of
lung cancer (3). However, the
development of tolerance and the side effects of these drugs are
key challenges in clinical practice (4). Therefore, an improved understanding
of the molecular mechanisms involved in tumorigenesis in lung
cancer is required in order to identify novel molecular markers to
improve the therapeutic effect.
In our previous study (5), it was found that FIGNL1 was
regulated by the HIST1H3D gene, which is located on
chromosome 6 and encodes histone H3.1 of the H3 class of histones
in humans. Previous studies have also shown that mutations in
histones (epigenesis shift) may lead to shifts of the chromatin
state and induce cancerous changes (6,7), as
higher transcriptional activity requires a less compact state of
chromatin (8). In previous
biomedical research, HIST1H3D was associated with gastric
(9) and lung cancer (5). On the other hand, FIGNL1 was found to
be an important regulator of cell proliferation and the cell cycle
(10,11), which negatively regulates the
apoptotic process (12).
FIGNL1 is an important member of the ATPase
Associated with diverse cellular Activities (AAA-ATPase) group and
plays an important role in regulating animal developmental
morphogenesis (13). The
N-terminal of AAA-ATPases was found to be responsible for its
localization on the centrosomes, while the AAA domain at the
C-terminal is hypothesized to drive diverse cellular functions,
such as interactions with cofactors or nucleotides (14-16).
As a molecular chaperone, AAA-ATPase participates in a wide range
of cellular regulatory progresses, such as protein folding and
degradation, bio-synthesis of organelles, and vesicular transport
and cytoskeleton maintenance (16,17).
According to a previous study, FIGNL1 was found to be primarily
localized in the nucleus (18), in
addition it has been found to be involved in numerous biological
processes (19-23). With respect to its basic functions,
FIGNL1 participates in hydrolase, ATPase, microtubule-severing
activities (19-21), and regulation of double-strand
break repair by homologous recombination (18). In vivo experiments indicated
that FIGNL1 maintains the stable structure during microtubule
depolymerization and remodeling of chromosome axis protein
(18); this in turn affects
meiotic nuclear division in male rats, and causes decreased weight
of male mouse testes (22).
Skeletal anomalies have also been found in mice lacking
fignl1 (23), which
suggested that the FIGNL1 gene may play a key role in regulating
systemic development.
However, to the best of our knowledge, the
biological mechanisms by which FIGNL1 regulates cell proliferation
have not yet been elucidated. With respect to diverse range of
functions of FIGNL1, to drive normal cellular activities, FIGNL1
mutations may lead to abnormal cellular behaviors. The present
study hypothesized that FIGNL1 could also be an important regulator
in the development of lung cancer and has been associated with the
proliferation of lung cancer cells (24). Therefore, the aim of the present
study was to identify the molecular mechanisms in which FIGNL1
regulates lung cancer cell growth, with the potential to become
novel targets in the treatment of NSCLC.
Materials and methods
FIGNL1 immunohistochemical staining and
clinical survival trace
Sample collection
Clinical samples were collected from patients with
non-small cell lung cancer (NSCLC) at the Department of Pathology,
the First Affiliated Hospital of Bengbu Medical College (Anhui,
China) between May 2012 and October 2015, under the regulations of
the Institutional Review Boards of the First Affiliated Hospital of
Bengbu Medical College (approval no. BYYFY-2017.KY05). All patients
provided written informed consent for clinical treatment, under the
regulations of the Declaration of Helsinki. Cancerous and
para-cancerous tissues (~5 cm around the cancerous tissues) were
collected from 109 patients, all of whom were diagnosed with
primary lung cancer; none of the patients had received
chemotherapy, radiotherapy or targeted therapy before tissue
collection.
Staining methods
The samples were sliced at a thickness of 0.1 mm,
followed by fixation with 4% paraformaldehyde at 4°C for 2 h, and
then coated with paraffin. The tissues were then subjected to
standard dewaxing and rehydration. The sections were incubated in
citric acid buffer (pH 6.0) for 15 min for antigen retrieval,
followed by incubation for 10 min with 3%
H2O2 solution to inactivate endogenous
enzymatic activity. The sections were then blocked with 5% goat
serum (Beyotime Institute of Biotechnology) at room temperature for
10 min then, incubated overnight with the primary anti-FIGNL1
antibody (dilution at 1:200; cat. no. ab185674; Abcam) at 4°C.
Subsequently, the sections were washed with PBS the next day and
incubated with the Elivision™ plus Polyer HRP (mouse/rabbit)
immunohistochemistry kit (pre-diluted; cat. no. KIT-9903; Maxim
Biotech, Inc.) as the secondary antibody at 20°C for 30 min. Next,
the sections were stained with DAB staining fluid for 3 min,
followed by counterstaining with hematoxylin for 3 min, both at
room temperature. Lastly, the sections were treated with neutral
balsam for permanent use. The stained sections were then observed
and classified based on sex, age, tumor size, pathology type, nodal
invasion conditions, and Tumor-Node-Metastasis stage, according to
the 8th edition Union for International Cancer Control Lung Cancer
Stage Classification (25). At
least 5 fields of view were randomly selected in each section and
counted at ×400 magnification with an inverted light microscope
(Shanghai Caikang Electronic Co., Ltd.).
Classification criteria
Positive FIGNL1 staining was defined as the
appearance of clear brown or sepia color in the cytoplasm and
positive intensity was calculated using the following equation:
Positive stained cell count/the total cell count. Each section was
scored using the following criteria: 0, No positive staining
(<5%); 1, weak positive staining (5-25%); 2, moderate positive
staining (25-50%); and 3, strong positive staining (50%). A score
<1 was indicative of low FIGNL1 expression, whereas a score ≥2
was considered to indicate high FIGNL1 expression; para-carcinoma
tissues were used as the negative control for the cancerous
tissues. In addition, the ratio between the late stage (stage III)
and early stage (stage I and II) was compared to determine the
effect of FIGNL1 on lung cancer development. Furthermore, overall
survival analysis (total duration of 81 months) of the 109 patients
was performed (mean follow-up, 50.924±2.807 months) to assess the
effect of FIGNL1 on patient survival.
Cell culture
The H460, H23, H1299 and A549 cell lines were
obtained from China Centre for Type Culture Collection, and
cultured with RPMI 1640 medium (Gibco; Thermo Fisher Scientific,
Inc.), with 10% fetal bovine serum (Gibco; Thermo Fisher
Scientific, Inc.) at 37°C in a humidified incubator (SANYO,
Electric Co., Ltd.) with 5% CO2. Cell passage was
performed using PBS and a 2-min incubation with 0.25% trypsin
(Gibco; Thermo Fisher Scientific, Inc.). Images of the transfected
cells were captured using a fluorescent microscope (Olympus
Corporation), while for the wound healing, invasion and Transwell
assays, an inverted light microscope (Shanghai Caikang Electronic
Co., Ltd.) was used. The cell lines were authenticated using a
PCR-based method for single-locus analysis; strict sterilization
conditions for cell culture were maintained and mycoplasma testing
was routinely performed.
Recombinant vector construction and
cell transfection
The interference vector,
pHBLV-U6-MCS-CMV-ZsGreen-PGK -PURO (5 µg; Hanbio
Biotechnology Co., Ltd.) was linearized using double restriction
digestion and BamHI and EcoRI (Thermo Fisher
Scientific, Inc.), purified using a Gel-Spin DNA Extraction kit
(Shanghai Generay Biotech Co., Ltd.) then, ligated with short
hairpin (sh)RNAs, using T4 ligase (Fermentas; Thermo Fisher
Scientific, Inc.). The susceptible cells, DH5α (Tiangen Biotech
Co., Ltd.) were transfected with the recombinant vectors, pSPAX2
(Hanbio Biotechnology Co., Ltd., 10 µg) and pMD2G (Hanbio
Biotechnology Co., Ltd., 5 µg) and the interference vector
linked with targeted shRNA (10 µg), which were harvested
using a Plasmid MaxPrep kit (Tiangen Biotech, China). All the
vectors were then transfected together into 293T cells using the
LipoFiter™ Transfection Reagent (Hanbio Biotechnology Co., Ltd.)
according to the manufacturer's instructions, followed by enhanced
green fluorescent protein fluorescence and puromycin screening of
the pHBLV-U6-MCS-CMV-ZsGreen-PGK-PURO shuttle vector positive
cells. High titers (>108 transforming units/ml) of
the concentrated lentivirus solutions were harvested from the
supernatant. The designed shRNAs (TsingKe Biological Technology)
are presented in Table I. The
shRNAs were diluted to 0.1 nmol for the downstream reaction, and
the transfected cells were passaged to at least 5 generations
(transfected after 24 h of culturing), followed by the subsequent
experiments. The H1299 cells were divided into 4 groups: Cells
transfected with positive control (shCtrl), shRNA1, shRNA2 and
shRNA3, respectively, while the A549 cells were transfected with
either shCtrl or shRNA1. The cell lines, in which no transfection
was performed are defined as the negative control group.
 | Table ISequences for the shRNAs. |
Table I
Sequences for the shRNAs.
| shRNA name | Sequence
(5′-3′) |
|---|
| shRNA F | GATCCGTTCTCCGAACGTGTCACGTAATTCAAGAGATTACGTGACACGTTCGGAGAATTTTTTC |
| shRNA R |
AATTGAAAAAATTCTCCGAACGTGTCACGTAATCTCTTGAATTACGTGACACGTTCGGAGAACG |
| shRNA1 F | GATCCGCTACCATAACACCGGATCAATTCAAGAGATTGATCCGGTGTTATGGTAGCTTTTTTG |
| shRNA1 R |
AATTCAAAAAAGCTACCATAACACCGGATCAATCTCTTGAATTGATCCGGTGTTATGGTAGCG |
| shRNA2 F | GATCCGCCGGAGAGCAATCGTTTGAAATTCAAGAGATTTCAAACGATTGCTCTCCGGTTTTTTG |
| shRNA2 R |
AATTCAAAAAACCGGAGAGCAATCGTTTGAAATCTCTTGAATTTCAAACGATTGCTCTCCGGCG |
| shRNA3 F | GATCCGCCGTGCACAGATATTACGCATTTCAAGAGAATGCGTAATATCTGTGCACGGTTTTTTG |
| shRNA3 R |
AATTCAAAAAACCGTGCACAGATATTACGCATTCTCTTGAAATGCGTAATATCTGTGCACGGCG |
Assessment of cell proliferation
Cell proliferation was investigated using a Cell
Counting Kit-8 (CCK-8) assay (Xi'an Baiying Biotechnology Co.,
Ltd.) according to the manufacturer's instructions. Cells were
seeded into 96-well plates, at a density of 1,000 cells per well
(100 µl), and the absorbance was measured at 450 nm. Then,
10 µl CCK-8 reagent was added to each well for 2 h each day,
then the absorbance of each well was measured at 0, 24, 48, 72, and
96 h. The absorbance indicated cell counts obtained within a day,
and the ratio between subsequent and primary absorbance was
considered as the fold proliferation rate.
Reverse transcription-quantitative PCR
(RT-qPCR)
Total RNA was extracted from the cells using a RNA
extraction kit (Wuhan Servicebio Technology Co., Ltd.), and the
cDNA was generated using a RevertAid First Strand cDNA Synthesis
kit (Thermo Fisher Scientific, Inc.), according to the
manufacturer's guidelines. The total RNA and cDNA were quantified
and confirmed using a NanoDrop™ 2000 spectrophotometer (Thermo
Fisher Scientific, Inc.) and agarose gel electrophoresis. The
FastStart Universal SYBR Green master mix (Roche Diagnostics) was
used for qPCR on a thermocycler (model 7300; Applied Biosystems;
Thermo Fisher Scientific, Inc.). The primers in Table II were synthesized by Tsingke
Biotechnology Corporation. Each well included 0.5 µl both
forward and reverse primers, 2 µl cDNA (50 ng/µl), 10
µl 2X SYBR Green mix, and 7 µl double distilled
water, in a total volume of 20 µl. For the RT-qPCR each
sample had 3 replicates, and each group of samples contained three
biological repeats. To determine the specific PCR conditions
(annealing temperature, a standard PCR was performed using the
primers. The following thermocycling conditions were used: Initial
denaturation at 95°C for 5 min, followed by 40 cycles at 95°C for
10 sec, annealing and extension at 58°C for 60 sec, and the final
melting curve analysis was performed using the instrument's default
settings. The Cq values were exported and normalized to the
housekeeping gene, GAPDH as described by Livak and Schmittgen
(26).
| Table IIPrimers for reverse
transcription-quantitative PCR. |
Table II
Primers for reverse
transcription-quantitative PCR.
| Name | Sequence
(5′-3′) | Tm (°C) |
|---|
| H-FIGNL1-S |
GGAGCAACAAATCGGCCACAA | 60 |
| H-FIGNL1-A |
ATGTCTGCTCCTGAAAACGCATC | 60 |
| H-FIGNL1
(CDS)-S |
TAGAGCTAGCGAATTCATGCAGACCTCCAGCTCTAG | 60 |
| H-FIGNL1
(CDS)-A |
CTTTGTAGTCGGATCCCTTTCCACAACCAAAAGTTTTGTTC | 60 |
| H-GAPDH-S |
TGACTTCAACAGCGACACCCA | 60 |
| H-GAPDH-A |
CACCCTGTTGCTGTAGCCAAA | 60 |
| PCNA-S |
ACACTAAGGGCCGAAGATAACG | 60 |
| PCNA-A |
ACAGCATCTCCAATATGGCTGA | 60 |
| MCM2-S |
ATGATCGAGAGCATCGAGAACC | 60 |
| MCM2-A |
GCCAAGTCCTCATAGTTCACCA | 60 |
| MCM4-S |
GACGTAGAGGCGAGGATTCC | 60 |
| MCM4-A |
GCTGGGAGTGCCGTATGTC | 60 |
| SKP2-S |
ATGCCCCAATCTTGTCCATCT | 60 |
| SKP2-A |
CACCGACTGAGTGATAGGTGT | 60 |
FIGNL1 overexpression vector
construction and cell transfection
The human FIGNL1 CDS was obtained from the cDNAs
extracted as aforementioned by cloning using the primers, H-FIGNL1
(CDS)-forward and reverse, as shown in Table II. Subsequently, the exogenous
fragment was ligated into the pLenO-GTP-C-3XFlag vector (Hanbio
Biotechnology Co., Ltd.), using the restriction enzymes
EcoRI and BamHI, and T4 ligase (both from Takara Bio,
Inc.) (Fig. S1). The recombinant
vector was successfully transformed into DH5α cells and the
plasmids were selected from endotoxin screening. DNA sequencing was
performed to confirm the absence of any mutation in the complete
FIGNL1 CDS region, then the recombinant vector (5 µg) was
transfected into the A549 and H1299 cell lines, according to the
lentiviral transfection guidelines according to the manufacturer's
protocol. Following FIGNL1 overexpression, cell proliferation was
determined using a CCK-8 assay, as aforementioned.
Western blot analysis
Total protein was extracted using RIPA lysis buffer,
containing 1 mg/ml phenylmethylsulfonyl fluoride (Beyotime
Institute of Biotechnology) on ice for 30 min. The protein
concentration was calculated using the bicinchoninc acid protein
assay kit (Beyotime Institute of Biotechnology), according to the
manufacturer's protocols, then the samples were denatured for 10
min at 95°C. The protein samples (60 µg in each lane) and
prestained protein marker (Thermo Fisher Scientific, Inc.) were
separated using SDS-PAGE (5% upper and 10% lower) (Beyotime
Insitute of Biotechnology), transferred to nitrocellulose
membranes, which were subsequently blocked with 5% skimmed milk in
PBS-Tween-20 buffer at the room temperature for 1 h, and incubated
overnight at 4°C with the primary antibodies (rabbit FIGNL1; cat.
no. 17604-1-AP; dilution at 1:1,000; ProteinTech Group, Inc. or
mouse GAPDH, cat. no. ab181602; dilution at 1:10,000; Abcam). Then,
the membranes were incubated with the secondary antibody (goat
anti-mouse IgG, cat. no. 31160; dilution at 1:5,000 or goat
anti-rabbit IgG; cat. no. 31210; dilution at 1:5,000) (both from
Thermo Fisher Scientific, Inc.) at room temperature for 1 h, and
the proteins were detected using an enhanced chemiluminescence-plus
kit (Thermo Fisher Scientific, Inc.). Images were obtained using a
ChemiDoc XR+ detection system (Bio-Rad Laboratories,
Inc.). The gray-scale data was normalized to GAPDH. The following
primary antibodies were used: Rabbit anti-FIGNL1 and mouse GAPDH
(both ProteinTech Group, Inc.). The following secondary antibodies
were used: Goat anti-mouse IgG and goat anti-rabbit IgG (both
ProteinTech Group, Inc.).
Cell cycle and apoptosis analysis
using flow cytometry
The H1299 and A549 cell lines were harvested with
trypsin (under 37°C) and centrifugation at 300 × g (at room
temperature for 5 min), and stained with either a cell cycle
detection kit (containing PI; Sigma-Aldrich; Merck KGaA), with
RNase A (Fermentas; Thermo Fisher Scientific, Inc.) or with Annexin
V-APC for cell apoptosis detection (AAT Bioquest Inc.), according
to the manufacturer's instructions. For cell cycle detection, the
cells were stained at room temperature for 20 min, while for
apoptosis analysis, the cells were incubated at room temperature
for 60 min. Both experiments required the avoidance of light. A
Guava easyCyte HT flow cytometer (EMD Millipore) was used to
perform the experiments and the FlowJo software (v10.0.7; FlowJo,
LLC) was used to analyze the cell cycle and apoptosis data. Each
group of samples included three biological repeats for data
analysis.
Clonality assay
A total of 1,000 cells were seeded into each well of
a 6-well culture plate (Corning, Inc.). Cells were cultured for 14
days or until the cell count of a single clone was >50. The
cells were washed with PBS and images were captured using an
inverted microscope prior to staining with crystal violet (Sangon
Biotech Co., Ltd.) for 10-20 min at the room temperature, then
washed with sterilized double distilled water. Images were captured
again using an inverted light microscope at ×400 magnification. The
cell count of a single clone indicated clonality.
Wound healing and cell invasion
assays
A total of 1.5×10⁵ cells (H1299 and A549)
were seeded into each well of a 12-well culture plate and medium
was replaced the following day, containing a low concentration of
serum (0.5% FBS; Gibco; Thermo Fisher Scientific Inc.). The wound
was created using a 10 µl pipette tip in each well after the
cell density reached 100% confluency, and images were obtained
using an inverted light microscope at ×400 magnification, at the
start of the assay and following 24 h of culture. The migration
ratio was calculated based on the images using ImageJ software
(version 1.52a; National Institutes of Health.).
Cell Transwell (cat. no. 3422) and invasion assays
(cat. no. 354480) (both from Corning Inc.) were performed according
to the manufacturer's instructions. During the Transwell assay,
cells were suspended at the concentration of 1×10⁶
cells/ml with serum-free medium, before seeding into the upper
chambers (100 µl in each chamber), while the lower chambers
contained medium with 30% FBS. After culturing at 37°C in a
humidified incubator with 5% CO2 for 48 h, the cells
that have migrated into the lower chambers were stained with
crystal violet (at room temperature for 3 min) and observed using
an inverted light microscope. The invasion assay was conducted
using the same method; however, Corning® BioCoat™
Matrigel® invasion chambers were used (Corning, Inc.),
and the medium in the lower chambers contained medium with 20% FBS
(600 µl).
Cell line derived tumor xenograft
experiments
A total of 14, 6-week old male BALB/c nude mice
(weighing 16.58±0.45 g) were used and divided into the control
group (7 mice) and the experimental group (7 mice) for the tumor
xenograft experiments. The H1299 cell line was transfected with
shCtrl or shFIGNL1 and resuspended with PBS, at a density of
2×10⁷ cells/ml. A total of 2×10⁶ cells (100
µl) were injected into the armpits of the 8-week old male
BALB/c nude mice on day 1. The mice in the control group weighed
19.82±0.50 g, while the mice in the experimental group weighed
19.57±0.34 g. The weight and volume of the tumors were measured
every 2 days, using a Lumina Series III imaging system
(PerkinElmer, Inc.) starting on day 7. The tumor volume was
calculated using the following equation: Volume
(mm3)=(π/6) × length × width × height.
The mice were purchased from the Shanghai SLAC
Laboratory Animal Co. Ltd., and all experimental procedures
involving animals were under the regulations of the Guide for the
Care and Use of Laboratory Animals and the Animal Welfare Act with
supervision from the Bengbu Medical College Experimental Animal
Experimental Ethics Committee (approval no. 2017-091). The mice
were all raised in a certified specific pathogen-free environment
[with ad libitum access to food and water under controlled
temperature (25°C), humidity (50-80%), and a 12-h light cycle].
Animals were housed 3-5 mice per cage and acclimatized for at least
7 days prior to the start of the study. The mice were all under
good health conditions, and no mice died following the injection of
the cancer cells. The behaviors including normal activities
(playing, determining dominance, sleeping and grooming), alertness
(fighting, isolation from the group, barbering, vocalization,
circling, lethargy and rearing up or sniffing), as well as
pathophysical signs (tumor growth, respiration rate, and weight
loss) were all monitored. The animals were sacrificed by cervical
translocation at the end of the experiment and death was verified
by non-pupillary response to light, lack of spontaneous breathing
and cardiac arrest for at least 5 min, and the tumor tissues were
harvested for subsequent volume and weight measurement.
cDNA microarray
Total cell RNA was extracted using
TRIzol® (Invitrogen; Thermo Fisher Scientific, Inc.)
then, the RNA sample were sent to Aksomics Inc., for them to
perform cDNA microarray analysis, using the Agilent®
Human 4x 44K gene expression microarrays v2 (Agilent Technologies
Inc.). Differential gene expression profiles were analyzed between
H1299 control and FIGNL1 knockdown cells, using biocomputational
techniques and further analyzed using The Database for Annotation,
Visualization and Integrated Discovery online analysis tool, with
the Gene Ontology (GO) (27,28)
and Kyoto Encyclopedia of Genes and Genomes (KEGG) databases
(https://genome.jp/kegg/pathway.html).
P<0.05 was considered to indicate a statistically significant
difference for GO terms and KEGG pathways.
Statistical analysis
Data are presented as the mean ± standard deviation.
All experiments were repeated at least three times. Between-group
differences were analyzed using the Student's unpaired t-test
(parametric) or one-way ANOVA Sidak's post hoc test. P<0.05 were
considered to indicate a statistically significant difference.
Statistical analyses were performed using the SPSS statistics
software (v25.0; IBM Corp.) and the graphs were generated using
GraphPad Prism v8.0 (GraphPad Software, Inc.).
Results
During our previous research (Figs. S2 and S3) (5), FIGNL1 was found to decrease cell
proliferation by 2.90-fold compared with that in the negative
control using high content screening method. Thus, to identify the
potential function of FIGNL1, RNA interference experiment was
performed to knockdown the expression level of FIGNL1. A total of 3
shRNAs were designed and transfected into the lung cancer cell
lines. FIGNL1 knockdown led to decreased proliferation of lung
cancer cells and induced alterations in cell cycle, while
increasing the ratio of apoptosis and reduced the migratory and
invasive abilities of the lung cancer cells. The common NSCLC cell
lines (A549 and H1299) were used in the present study.
Survival curve and clinical
immunohistochemical analysis for FIGNL1
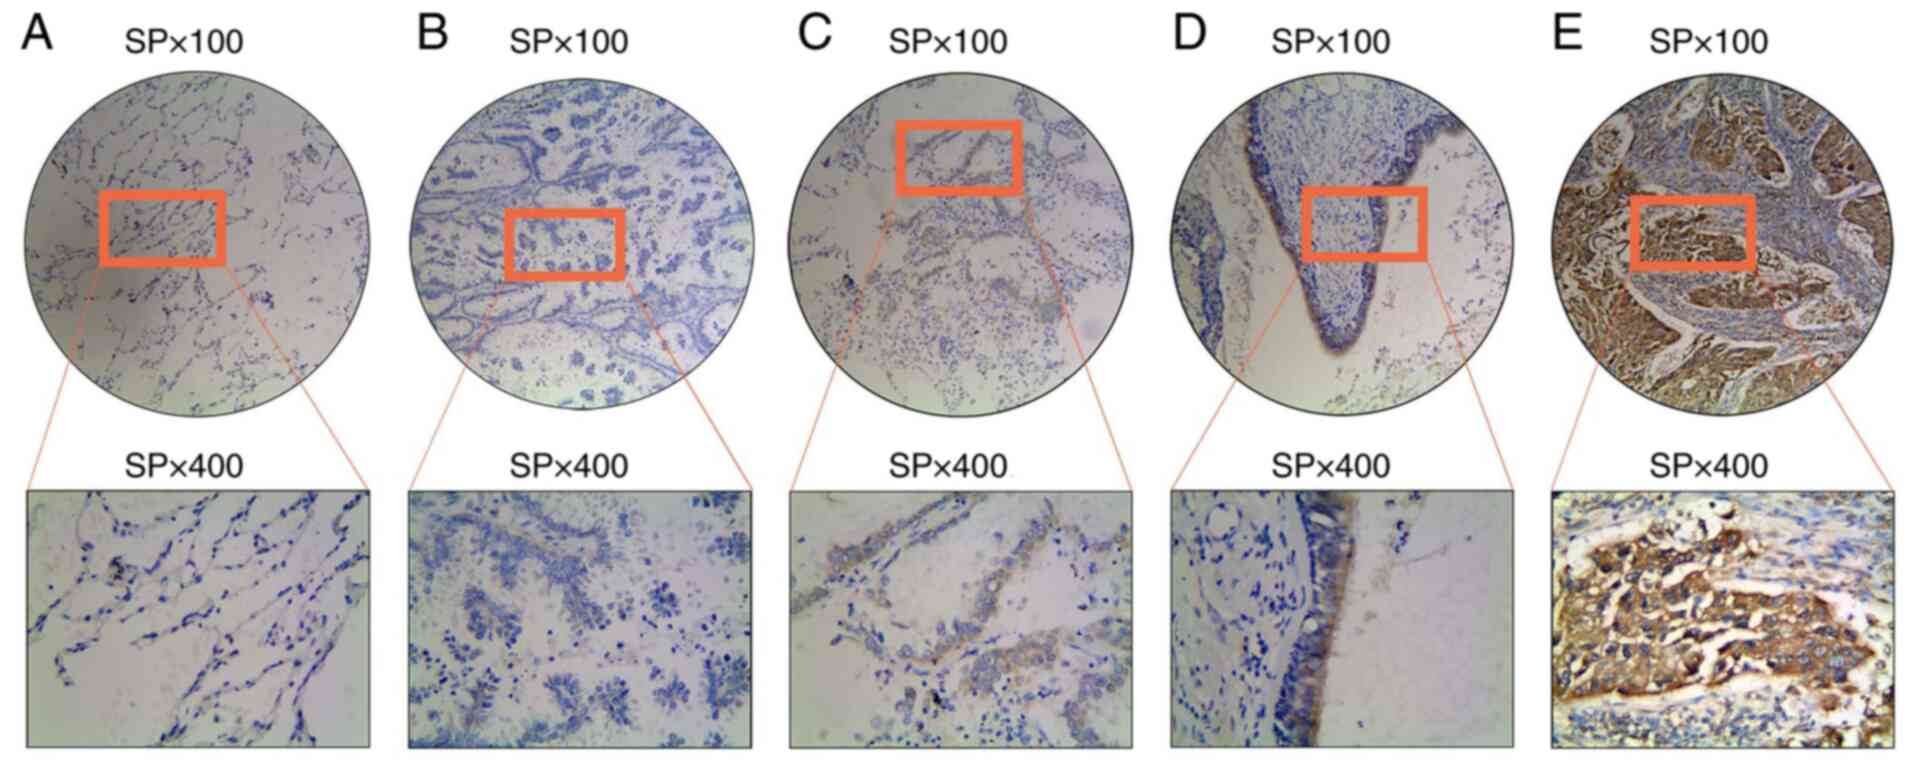
Immunohistochemical staining was performed from 109
cancerous and para-carcinoma lung tissue samples collected from
patients with NSCLC, to determine the FIGNL1 expression level in
cancerous lung tissues. Analysis of the results revealed that 93
patients were classified into the low FIGNL1 expression group,
while 16 patients were classified into the high FIGNL1 expression
group (Fig. 1A-E and Table III). The mean follow-up period
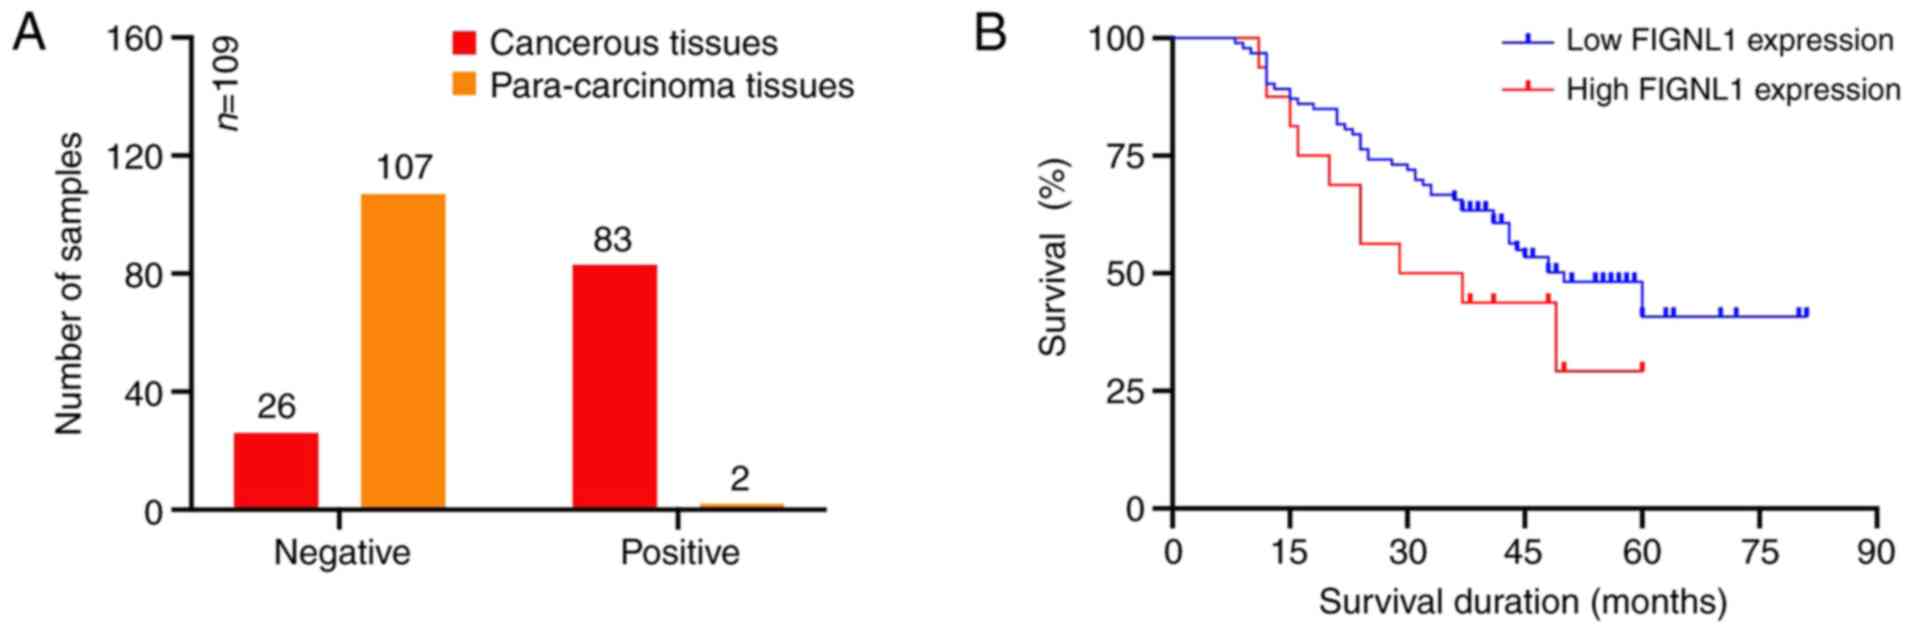
was 50.924±2.807 months (overall follow-up was 81 months). Survival
analysis revealed no significant difference of FIGNL1 expression on
patient survival (P=0.2023). The distribution of FIGNL1 expression
in the cancerous and para-carcinoma tissues is shown in Fig. 2A. A total of 83 cancer tissue
specimens (76.1%) had positive FIGNL1 expression, while only 2
para-carcinoma tissues (1.8%) had positive expression. To determine
the effect of FIGNL1 on survival outcomes, Kaplan-Meier curves were
generated (Fig. 2B). The predicted
average and median survival time are presented in Table IV. In addition, it was found that
the later TNM stage of lung cancer diagnosis, the patients had
higher FIGNL1 expression levels; however, FIGML1 expression was not
associated with sex, age, tumor size or pathological type
(adenocarcinoma or squamous carcinoma), but it was significantly
associated with nodal invasion and TNM stage (Table V).
| Table IIIData summary of the survival
records. |
Table III
Data summary of the survival
records.
| Expression
level | Number of
Patients | Censored
Subjects | Survival
percentage | Death events | χ2 | Degree of
freedom | P-value |
|---|
| Low | 93 | 47 | 50.5 | 46 | 1.626 | 1 | 0.2023 |
| High | 16 | 6 | 37.5 | 10 | | | |
| Table IVPredicted mean and median survival
duration from the survival curve of the patients. |
Table IV
Predicted mean and median survival
duration from the survival curve of the patients.
| Group | Mean survival ± SD,
months | 95% CI | Median survival ±
SD, months | 95% CI |
|---|
| Low | 52.219±3.014 | 46.312-58.126 | 50.000±6.226 | 37.796-62.204 |
| High | 36.396±4.828 | 26.933-45.858 | 29.000±13.000 | 3.520-54.480 |
| Total number of
patients | 50.924±2.807 | 45.422-56.425 | 48.000±5.155 | 37.896-58.104 |
| Table VAssociation of the
clinicopathological parameters between the low and high expression
FIGNL1 groups in patients with lung cancer. |
Table V
Association of the
clinicopathological parameters between the low and high expression
FIGNL1 groups in patients with lung cancer.
| Clinicopathological
parameters | Number of
patients | FIGNL1 expression
level
| P-value |
|---|
| Low | High |
|---|
| Sex | | | | |
| Male | 77 | 66 | 11 | 0.857 |
| Female | 32 | 27 | 5 | |
| Age, years | | | | |
| ≥60 | 52 | 41 | 11 | 0.068 |
| <60 | 57 | 52 | 5 | |
| Tumor size, cm | | | | |
| >3.0 | 47 | 39 | 8 | 0.547 |
| ≤3.0 | 62 | 54 | 8 | |
| Pathological
type | | | | |
|
Adenocarcinoma | 67 | 56 | 11 | 0.517 |
| Squamous
Carcinoma | 42 | 37 | 5 | |
| Nodal Invasion | | | | |
| N0 | 66 | 60 | 6 | 0.036 |
|
N1/N2/N3 | 42 | 32 | 10 | |
| TNM stage | | | | |
| I+IIA | 77 | 70 | 7 | 0.011 |
| IIB+III | 32 | 23 | 9 | |
Construction of RNA interference
vector
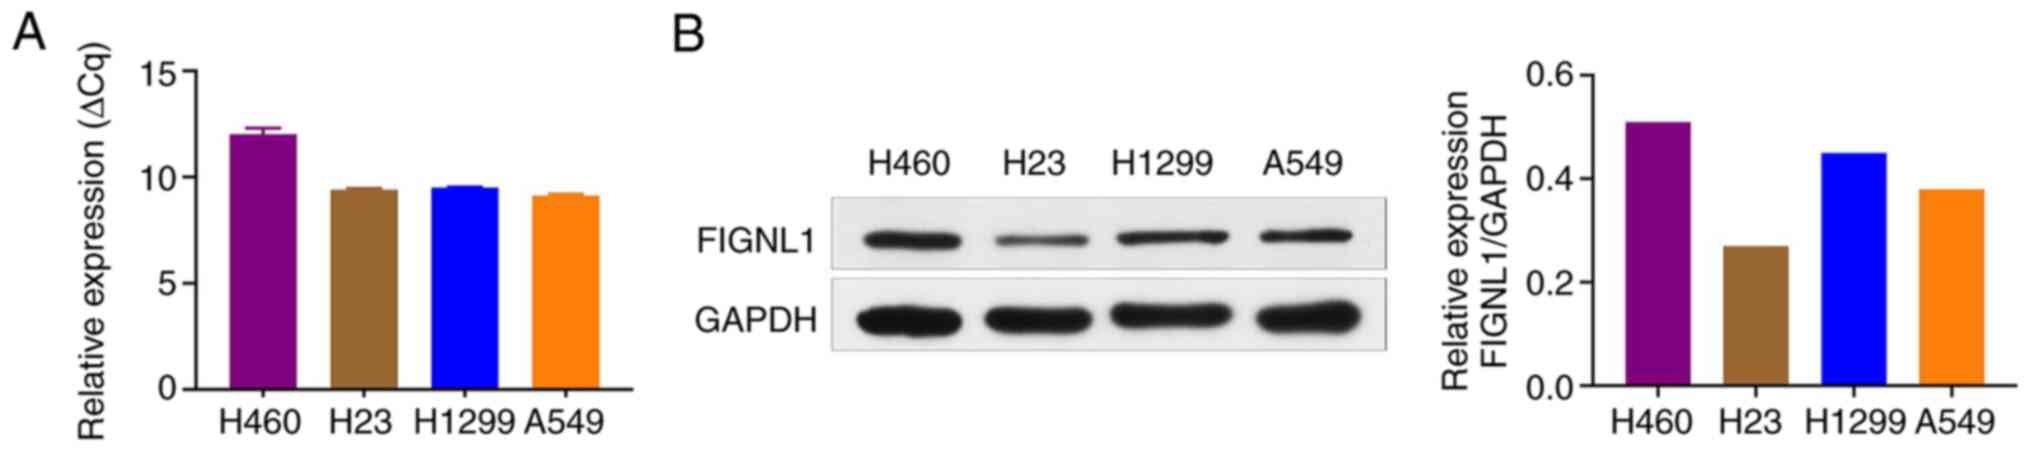
To facilitate a comprehensive characterization of
FIGNL1 expression in lung cancer cells, the cell lines with higher
expression of FIGNL1, were used to construct a knockdown cell line.
As shown in Fig. 3, FIGNL1 mRNA
and protein expression levels were at relatively high levels, and
their expression levels were also stable in the H1299 and A549 cell
lines; therefore, these were used for further experimentation (RNA
interference) and more suitable for the xenograft experiment.
During the RNA interference experiments, a total of 3 shRNAs were
designed and successfully ligated into the interference vector,
pHBLV- U6-MCS-CMV-ZsGreen-PGK-PURO, which was then transfected into
293T together with pSPAX2 and pMD2G. DNA sequencing results proved
the successful assembly of the recombinant shuttle vector (Fig. S4).
Lentiviral transfection
The recombinant vectors were harvested and then
transfected into 293T cells to produce virions to infect the A549
and H1299 cell lines. As shown in Table VI, viral titer was determined in
the H1299 and A549 cell lines prior to infection. The H1299 and
A549 cell lines were then infected with lentivirus produced from
293T cells. The plasmid had the capability to express the GFP
protein, which was used to evaluate the transfection efficiency.
When cell density observed under the fluorescent field reached 70%
(Fig. S5), the cells were
collected for puromycin screening for 48 h until the cell density
reached 70-80% confluence to perform downstream experiments.
| Table VIViral titer evaluation in
transfecting the A549 and H1299 cell lines. |
Table VI
Viral titer evaluation in
transfecting the A549 and H1299 cell lines.
| shRNA | Viral titer in
A549, TU/ml | Infection volume,
µl | Viral titer in
H1299, TU/m | Infection volume,
µl |
|---|
| shCtrl |
2×10⁸ | 20 |
2×10⁸ | 2 |
| shRNA1 |
2×10⁸ | 20 |
2×10⁸ | 2 |
| shRNA2 |
2×10⁸ | 20 |
2×10⁸ | 2 |
| shRNA3 |
2×10⁸ | 20 |
2×10⁸ | 2 |
FIGNL1 knockdown reduces cell
proliferation and increases apoptosis
The results of RT-q PCR (Fig. 4A and B) and western blot analysis
(Fig. 4E) revealed that the
various shRNAs decreased FIGNL1 expression in the H1299 and A549
cell lines. For subsequent experiments, shFIGNL1-2 was selected in
the H1299 cell line and shFIGNL1-1 for use in A549. Since
shFIGNL1-2 induced the highest mRNA expression reduction by 74.3%
among the three shRNAs in H1299 cells, and shFIGNL1-1 led to a 79%
decrease in mRNA expression level in A549 cells, these two shRNAs
were used for the following experiments. The involvement of FIGNL1
in the regulation of cell proliferation was investigated using a
CCK-8 assay, for 96 h. As shown in Fig. 4C and D, FIGNL1 knockdown induced a
sharp decrease in cell growth rate compared with the control group.
The effect of FIGNL1 overexpression was also investigated using an
overexpressing vector and the results showed that the recombinant
pLenO-GTP-C-3XFlag vector significantly increased the expression
level of FIGNL1 in cells (Fig.
4E). In addition, cell proliferation was also significantly
increased from FIGNL1 overexpression in both the H1299 and A549
cell lines (Fig. 4G).
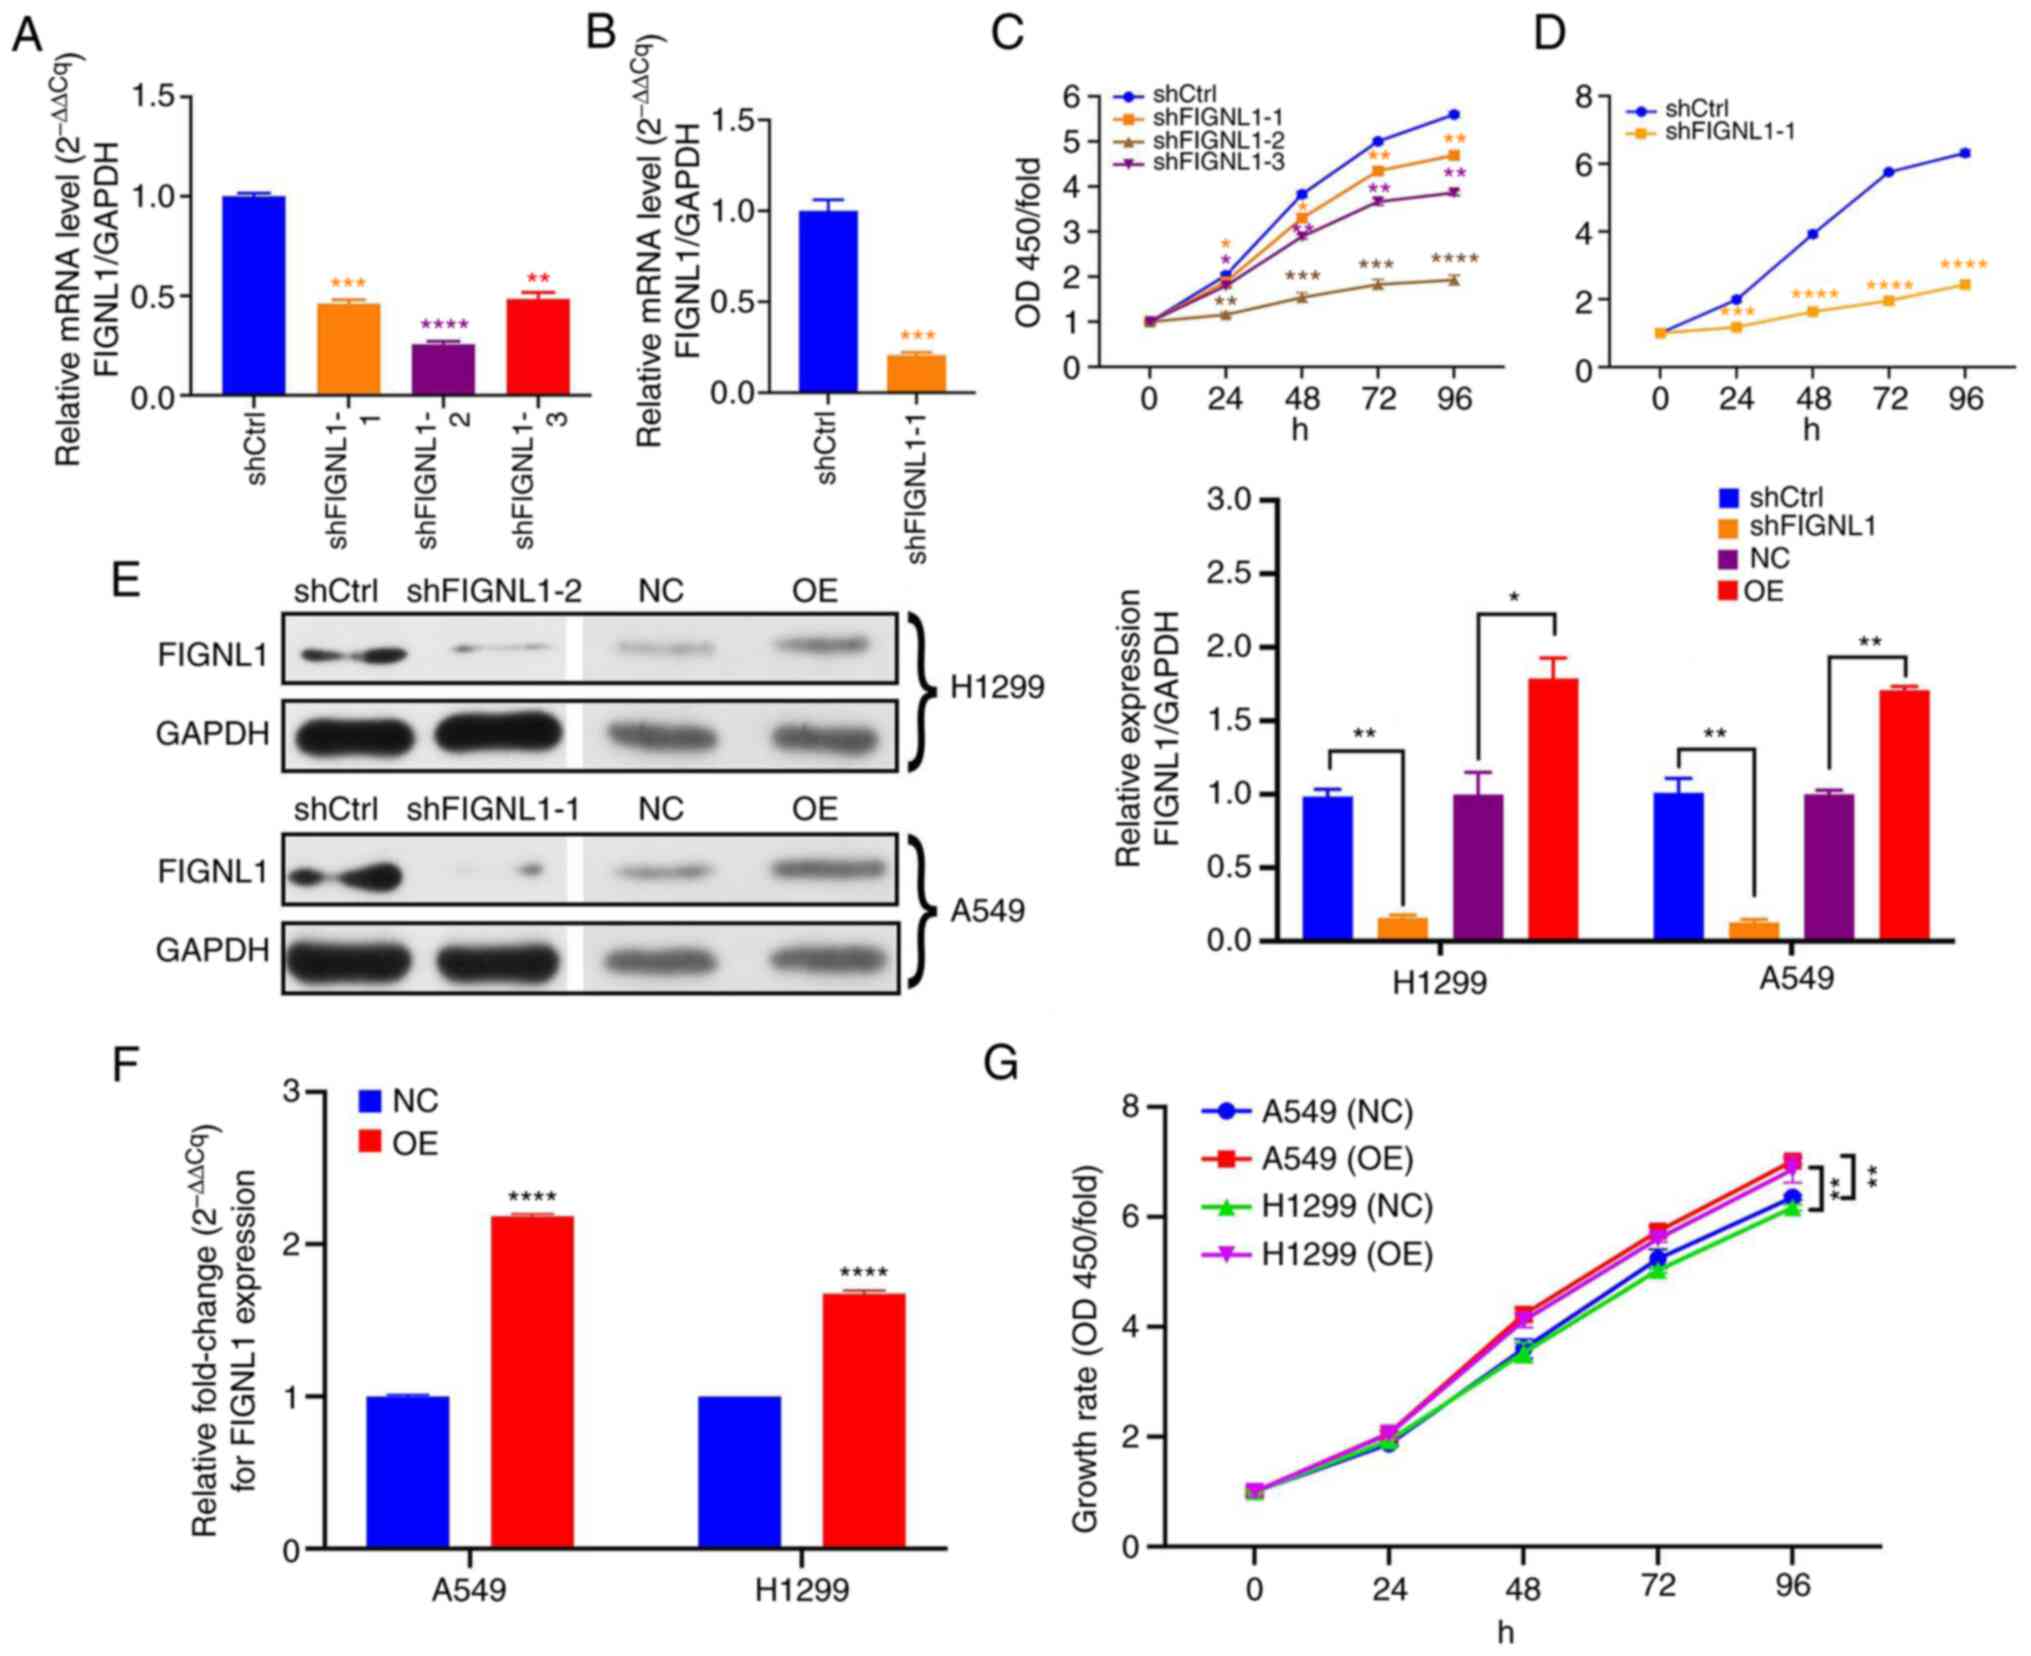 | Figure 4Examination of FIGNL1 protein and
mRNA expression level and its effects on cell growth rate. (A)
shFIGNL1-2 decreased the mRNA expression level the most, among the
three shRNAs in H1299 cell line. (B) shFIGNL1-1 led to a
significant decrease in mRNA expression level in A549 cells. (C)
The three shRNAs inhibited growth at different levels; shFIGNL1-2
had the strongest ability to suppress cell growth in H1299 cell
line. (D) Compared with that in the shCtrl group, shFIGNL1-1 could
significantly reduce cell growth in the A549 cell line. (E) FIGNL1
protein expression levels following knockdown and overexpression in
the H1299 and A549 cell lines. (F) FIGNL1 mRNA expression level was
significantly increased following transfection with the
overexpres-sion vector in both cell lines. (G) Cell growth was
significantly increased following overexpression of FIGNL1.
*P<0.05, **P<0.01,
***P<0.001, ****P<0.0001. n=3. FIGNL1
knockdown using shFIGNL1-2 in H1299 cells and shFIGNL1-1 in A549
cells. sh, short hairpin; Ctrl, control; OD, optical density; NC,
negative control; OE, overexpression; FIGNL1, fidgetin-like 1. |
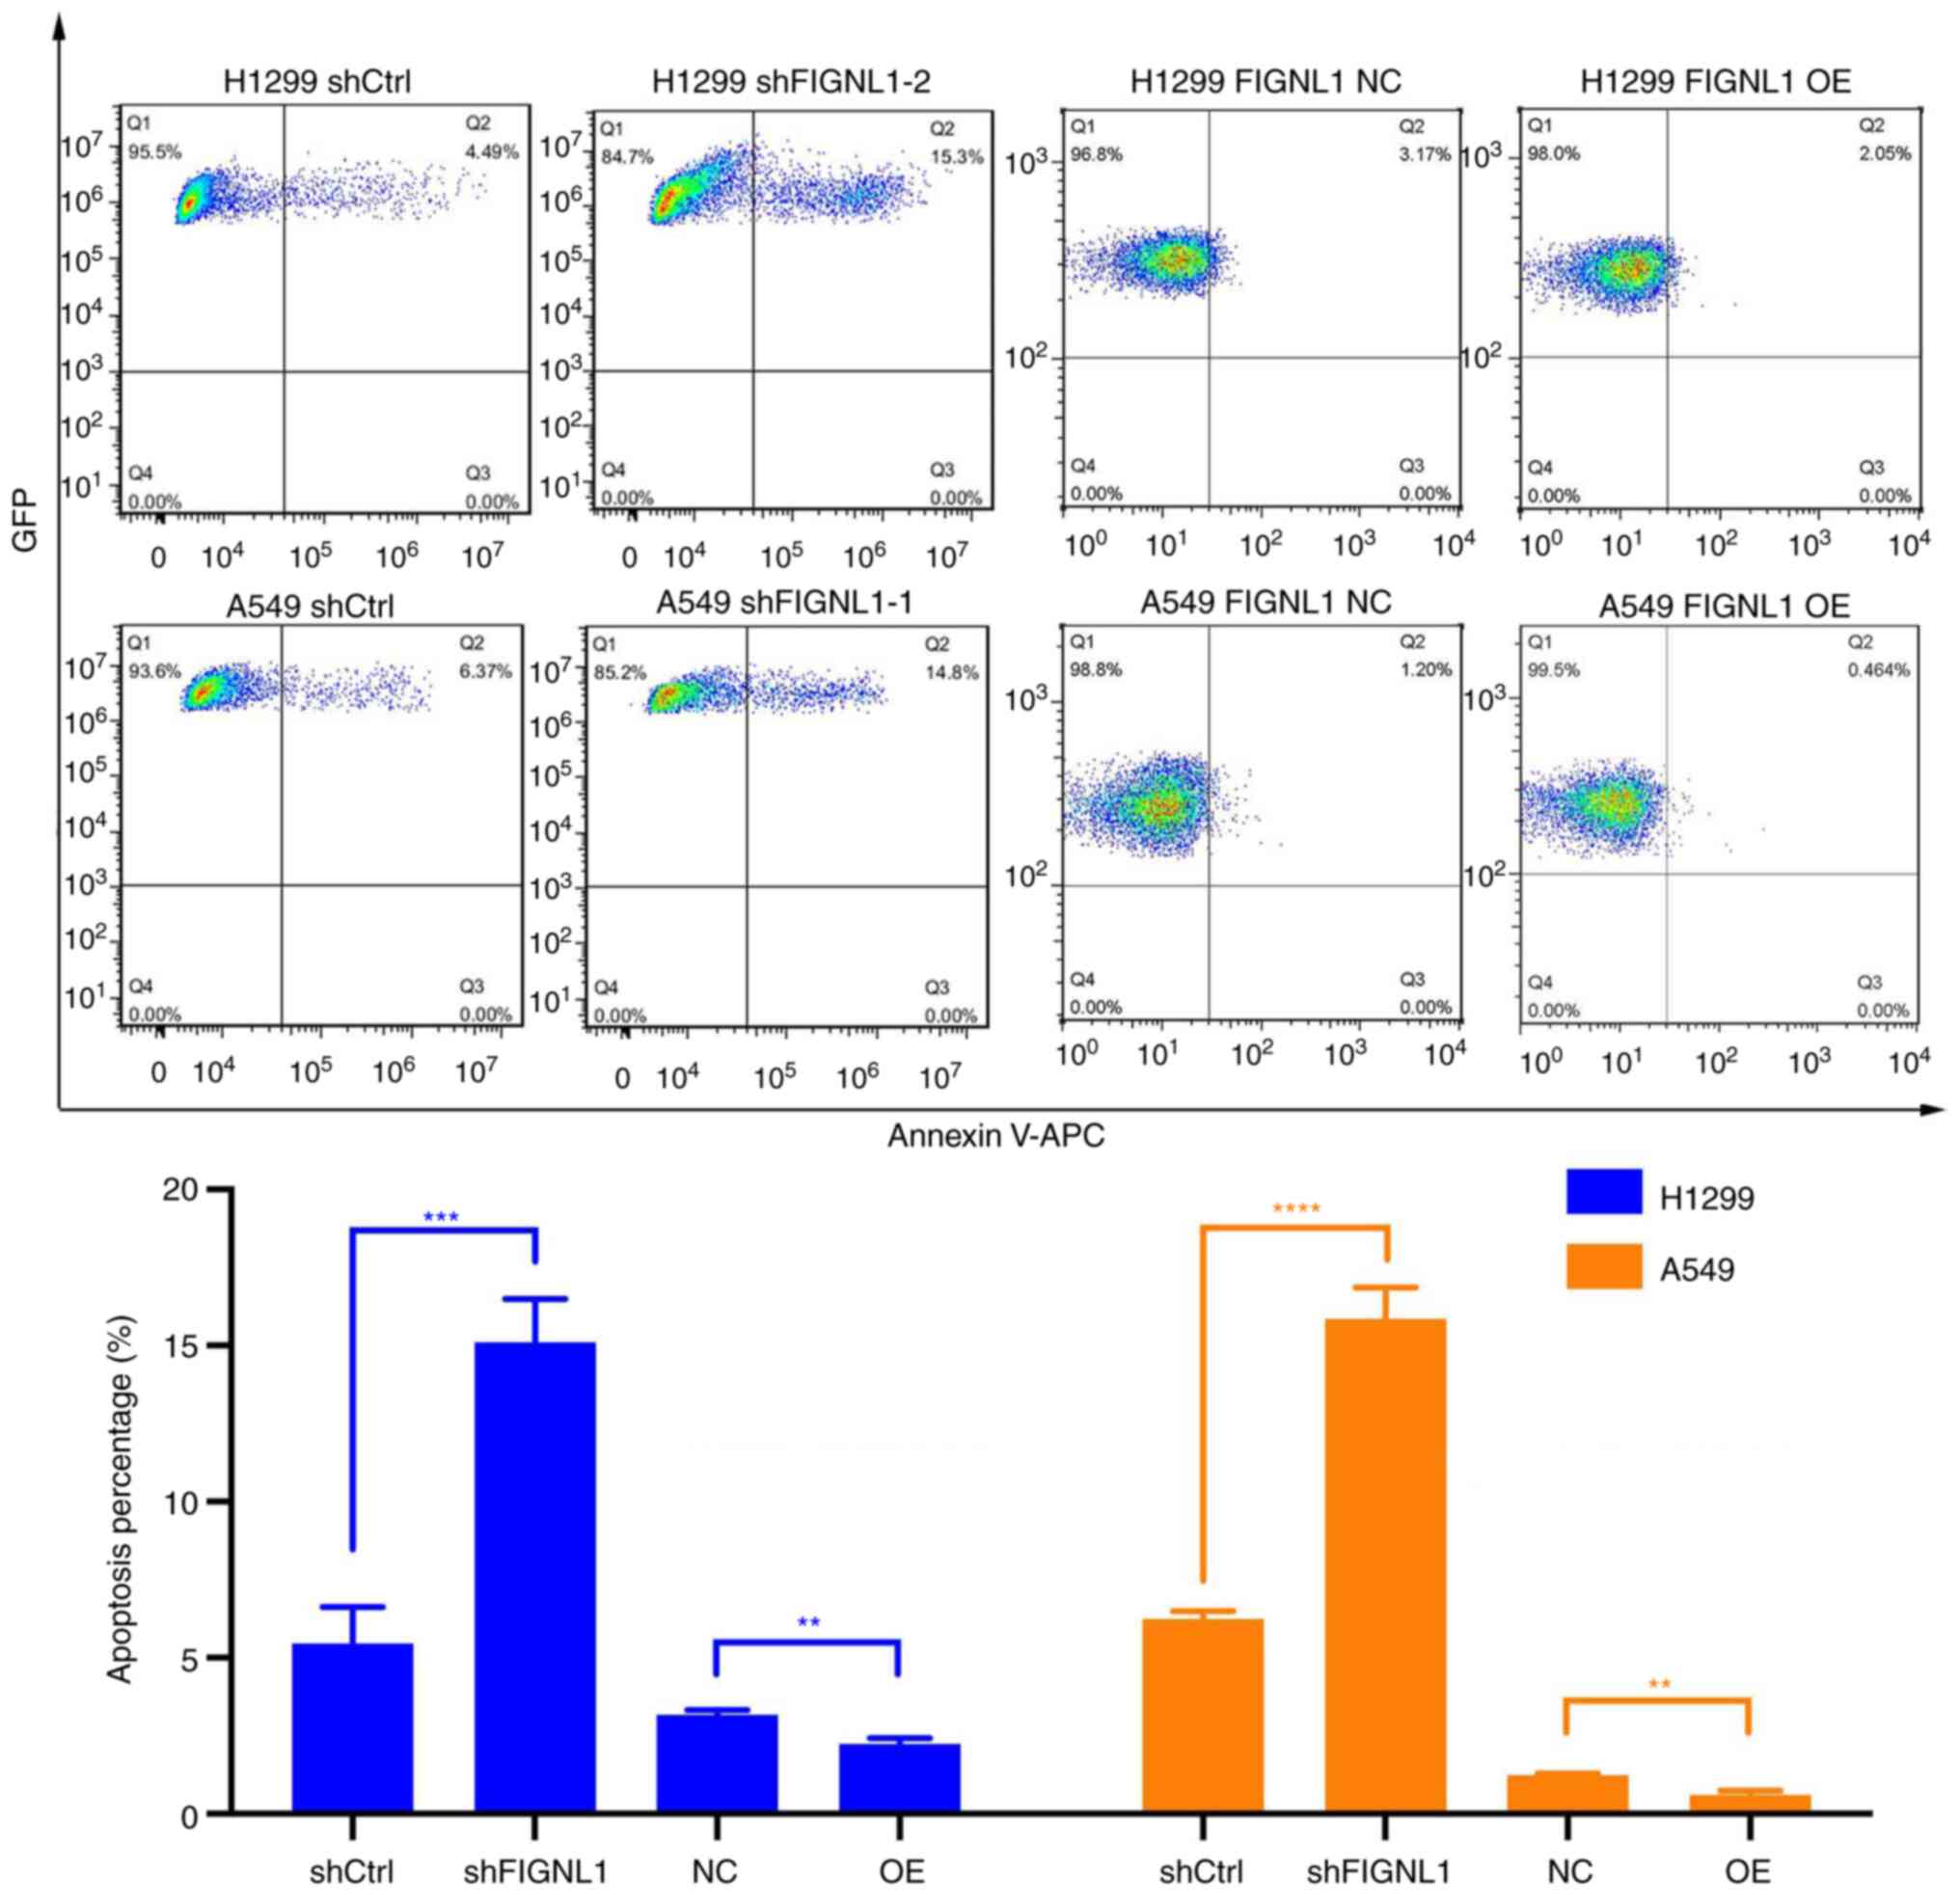
Since altered cell proliferation and apoptosis may
attenuate cell growth, flow cytometry assays were performed to
investigate the effect of FIGNL1 knockdown and overexpression on
cell growth. Cell cycle progression was analyzed between the
control groups and the cells with knockdown or overexpression of
FIGNL1. As shown in Fig. 5, FIGNL1
knockdown significantly increase in G1 phase arrest
(P<0.05), as well as a significantly decreasing the cells at S
phase in both cells (P<0.05) compared with the shCtrl group.
However, in the overexpression groups, increased FIGNL1 expression
resulted in significantly reduced G1 phase arrest in
both H1299 and A549 cells, along with non-significant changes in
the S phase. In addition, lower FIGNL1 expression significantly
increased cell apoptosis, while increased FIGNL1 expression
significantly decreased the percentage of apoptotic cells
(P<0.05, Fig. 6). These results
indicated that FIGNL1 plays an important role in cell proliferation
and apoptosis, and that both factors might be responsible for
attenuated cell growth rate. Detailed statistics for cell cycle and
apoptosis distribution are presented in Tables VIITable VIII-IX.
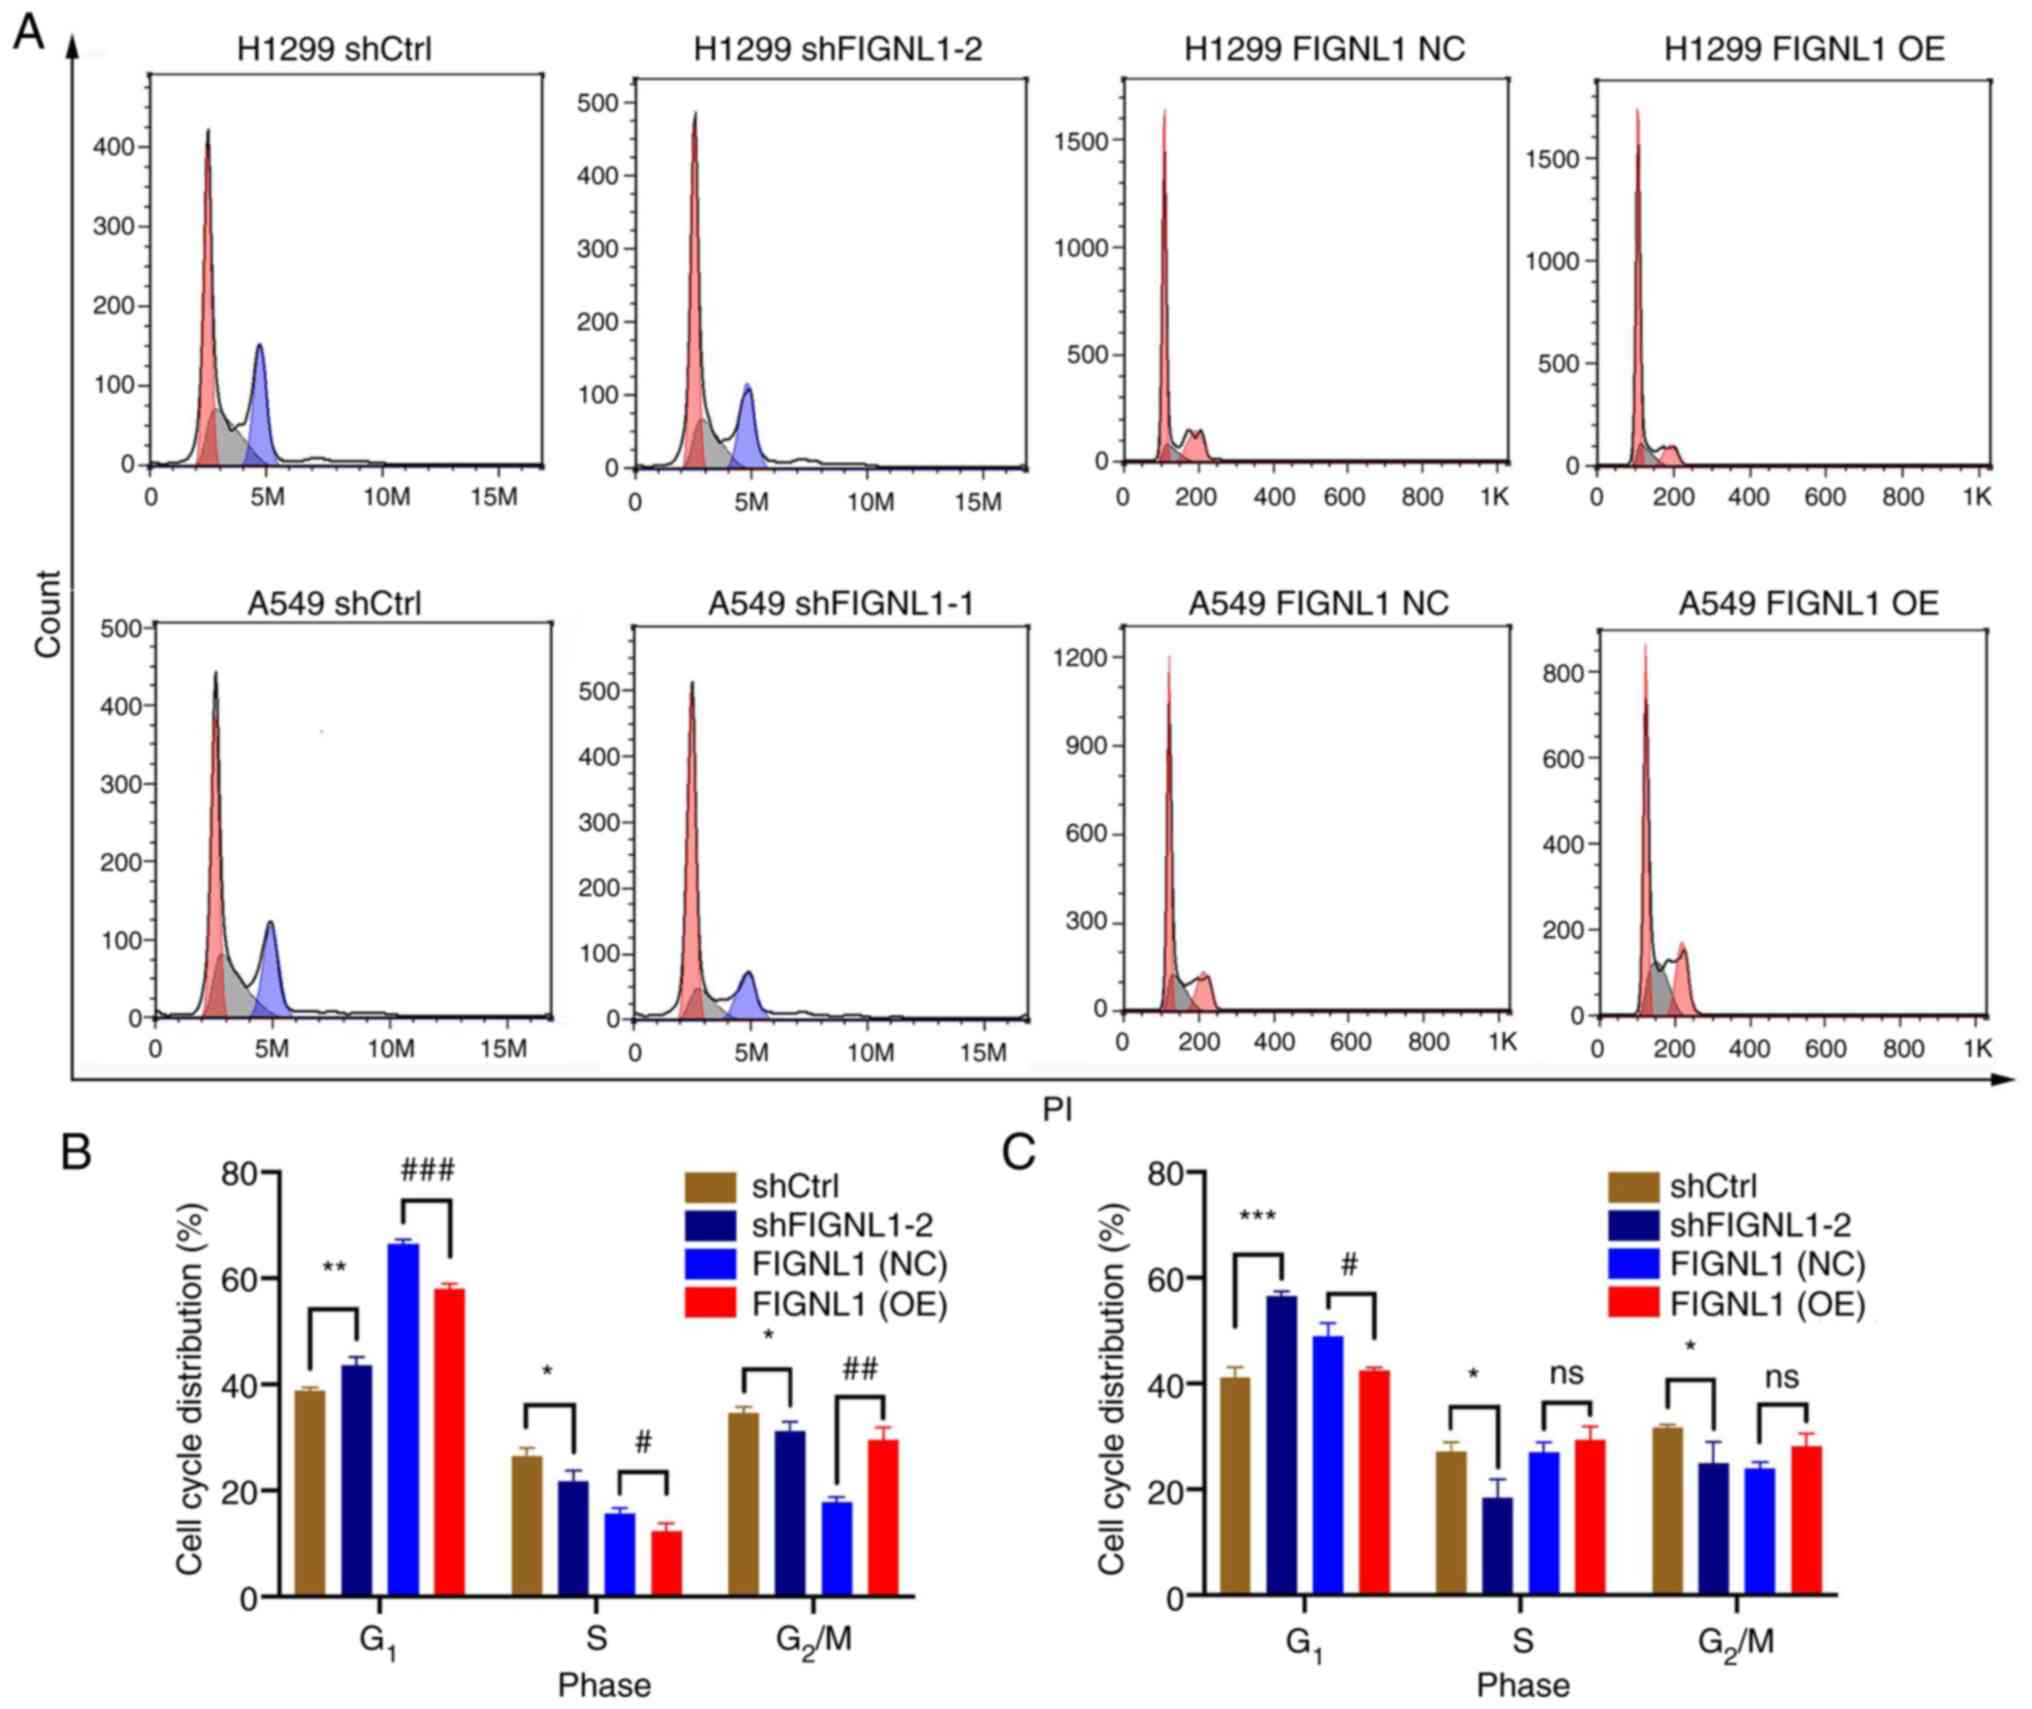 | Figure 5Effects of FIGNL1 knockdown and
overexpression on cell cycle. (A) Flow cytometry plots showing the
changes in the cell cycle shift in the H1299 and A549 cell lines
following knockdown or overexpression of FIGNL1. In (B) H1299 and
(C) A549 cell lines, FIGNL1 knockdown induced arrested cells in
G1 stage and shortened S and G2/M phases.
However, FIGNL1 overexpression had the opposite effect, with
shortened G1 phase. *,#P<0.05,
**,##P<0.01, ***/###P<0.001. n=3. NC,
negative control; OE, overexpression; sh, short hairpin; Ctrl,
control; FIGNL1, fidgetin-like 1. |
| Table VIIStatistical analysis for cell cycle
distribution following FIGNL1 knockdown. |
Table VII
Statistical analysis for cell cycle
distribution following FIGNL1 knockdown.
A, Cell cycle
analysis for the H1299 cell line
|
|---|
| Stage | shCtrl | shFIGNL1-2 | P-value |
|---|
| G1,
% | 38.82±0.60 | 43.63±1.54 | 0.0154a |
| S, % | 26.53±1.51 | 21.79±1.98 | 0.0216a |
| G2/M,
% | 34.65±1.09 | 31.21±1.75 | 0.1466b |
B, Cell cycle
analysis for the A549 cell line
|
|---|
| Stage | shCtrl | shFIGNL1-1 | P-value |
|---|
| G1,
% | 41.16±1.97 | 56.57±0.90 | 0.0023c |
| S, % | 27.17±1.74 | 18.4±3.42 | 0.0994b |
| G2/M,
% | 31.67±0.54 | 24.98±4.01 | 0.0958b |
| Table VIIIStatistical analysis of cell cycle
distribution following FIGNL1 overexpression. |
Table VIII
Statistical analysis of cell cycle
distribution following FIGNL1 overexpression.
A, Cell cycle
analysis for the H1299 cell line
|
|---|
| Stage | FIGNL1 NC | FIGNL1 OE | P-value |
|---|
| G1,
% | 66.47±0.82 | 58.04±0.90 | 0.0003a |
| S, % | 15.67±1.03 | 12.39±1.46 | 0.1081b |
| G2/M,
% | 17.86±0.92 | 29.57±2.35 | 0.0013c |
B, Cell cycle
analysis for the A549 cell line
|
|---|
| Stage | FIGNL1 NC | FIGNL1 OE | P-value |
|---|
| G1,
% | 48.96±2.50 | 42.52±0.50 | 0.0120d |
| S, % | 27.05±1.83 | 29.34±2.53 | 0.2728b |
| G2/M,
% | 23.99±1.16 | 28.14±2.42 | 0.0556b |
| Table IXChanges in cell apoptosis following
knockdown or overexpression of FIGNL1. |
Table IX
Changes in cell apoptosis following
knockdown or overexpression of FIGNL1.
| Cell line | shRNA
| Overexpression
|
|---|
| shCtrl | shFIGNL1 | P-value | FIGNL1 NC | FIGNL1 OE | P-value |
|---|
| H1299 | 5.45±1.18 | 15.1±1.39a | 0.0005b | 3.17±0.14 | 2.24±0.18 | 0.0020b |
| A549 | 6.23±0.24 | 15.83±1.00c | 0.0039d | 1.22±0.06 | 0.597±0.122 | 0.0014b |
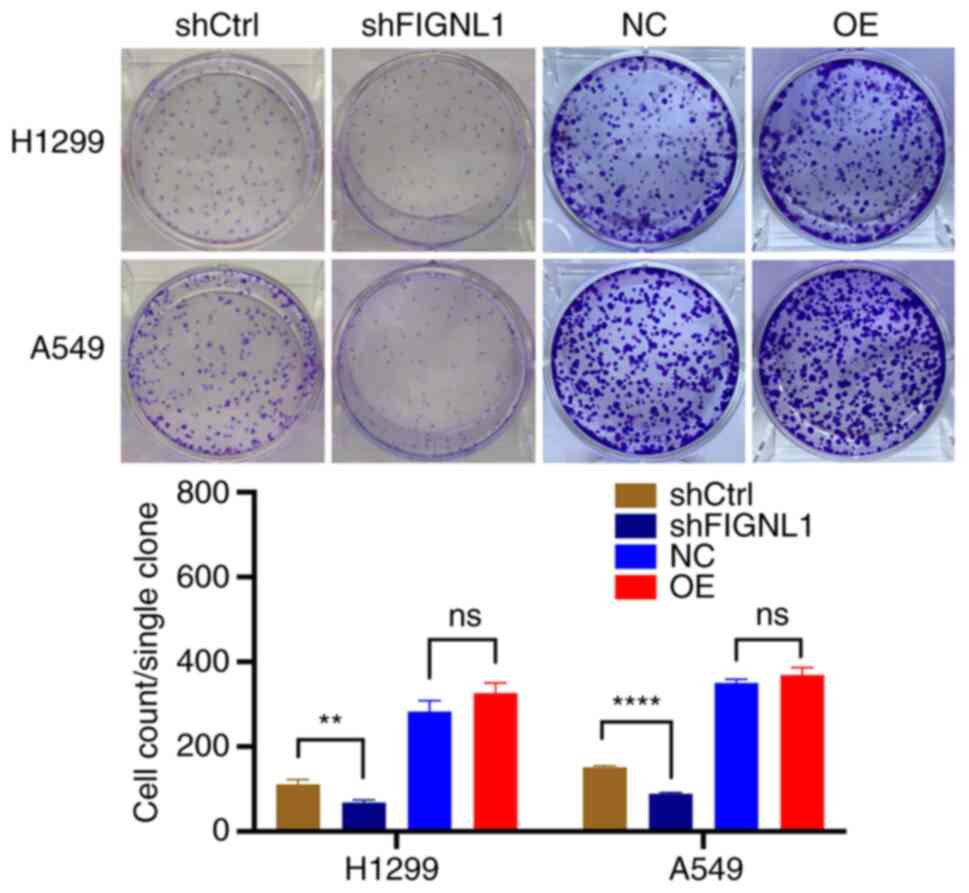
Effects of FIGNL1 on cell behavior
Following confirmation of the hypothesis that FIGNL1
could influence both cell proliferation and apoptosis, a further
set of experiments were performed for a more precise functional
characterization of FIGNL1. First, clone formation assay was
performed between the shRNA groups and overexpression groups in the
H1299 and A549 cell lines (Fig.
7). The results showed a significant decrease in clonality in
both the A549 and H1299 cell lines owing to the knockdown of FIGNL1
(P<0.05). However, overexpression of FIGNL1 showed no
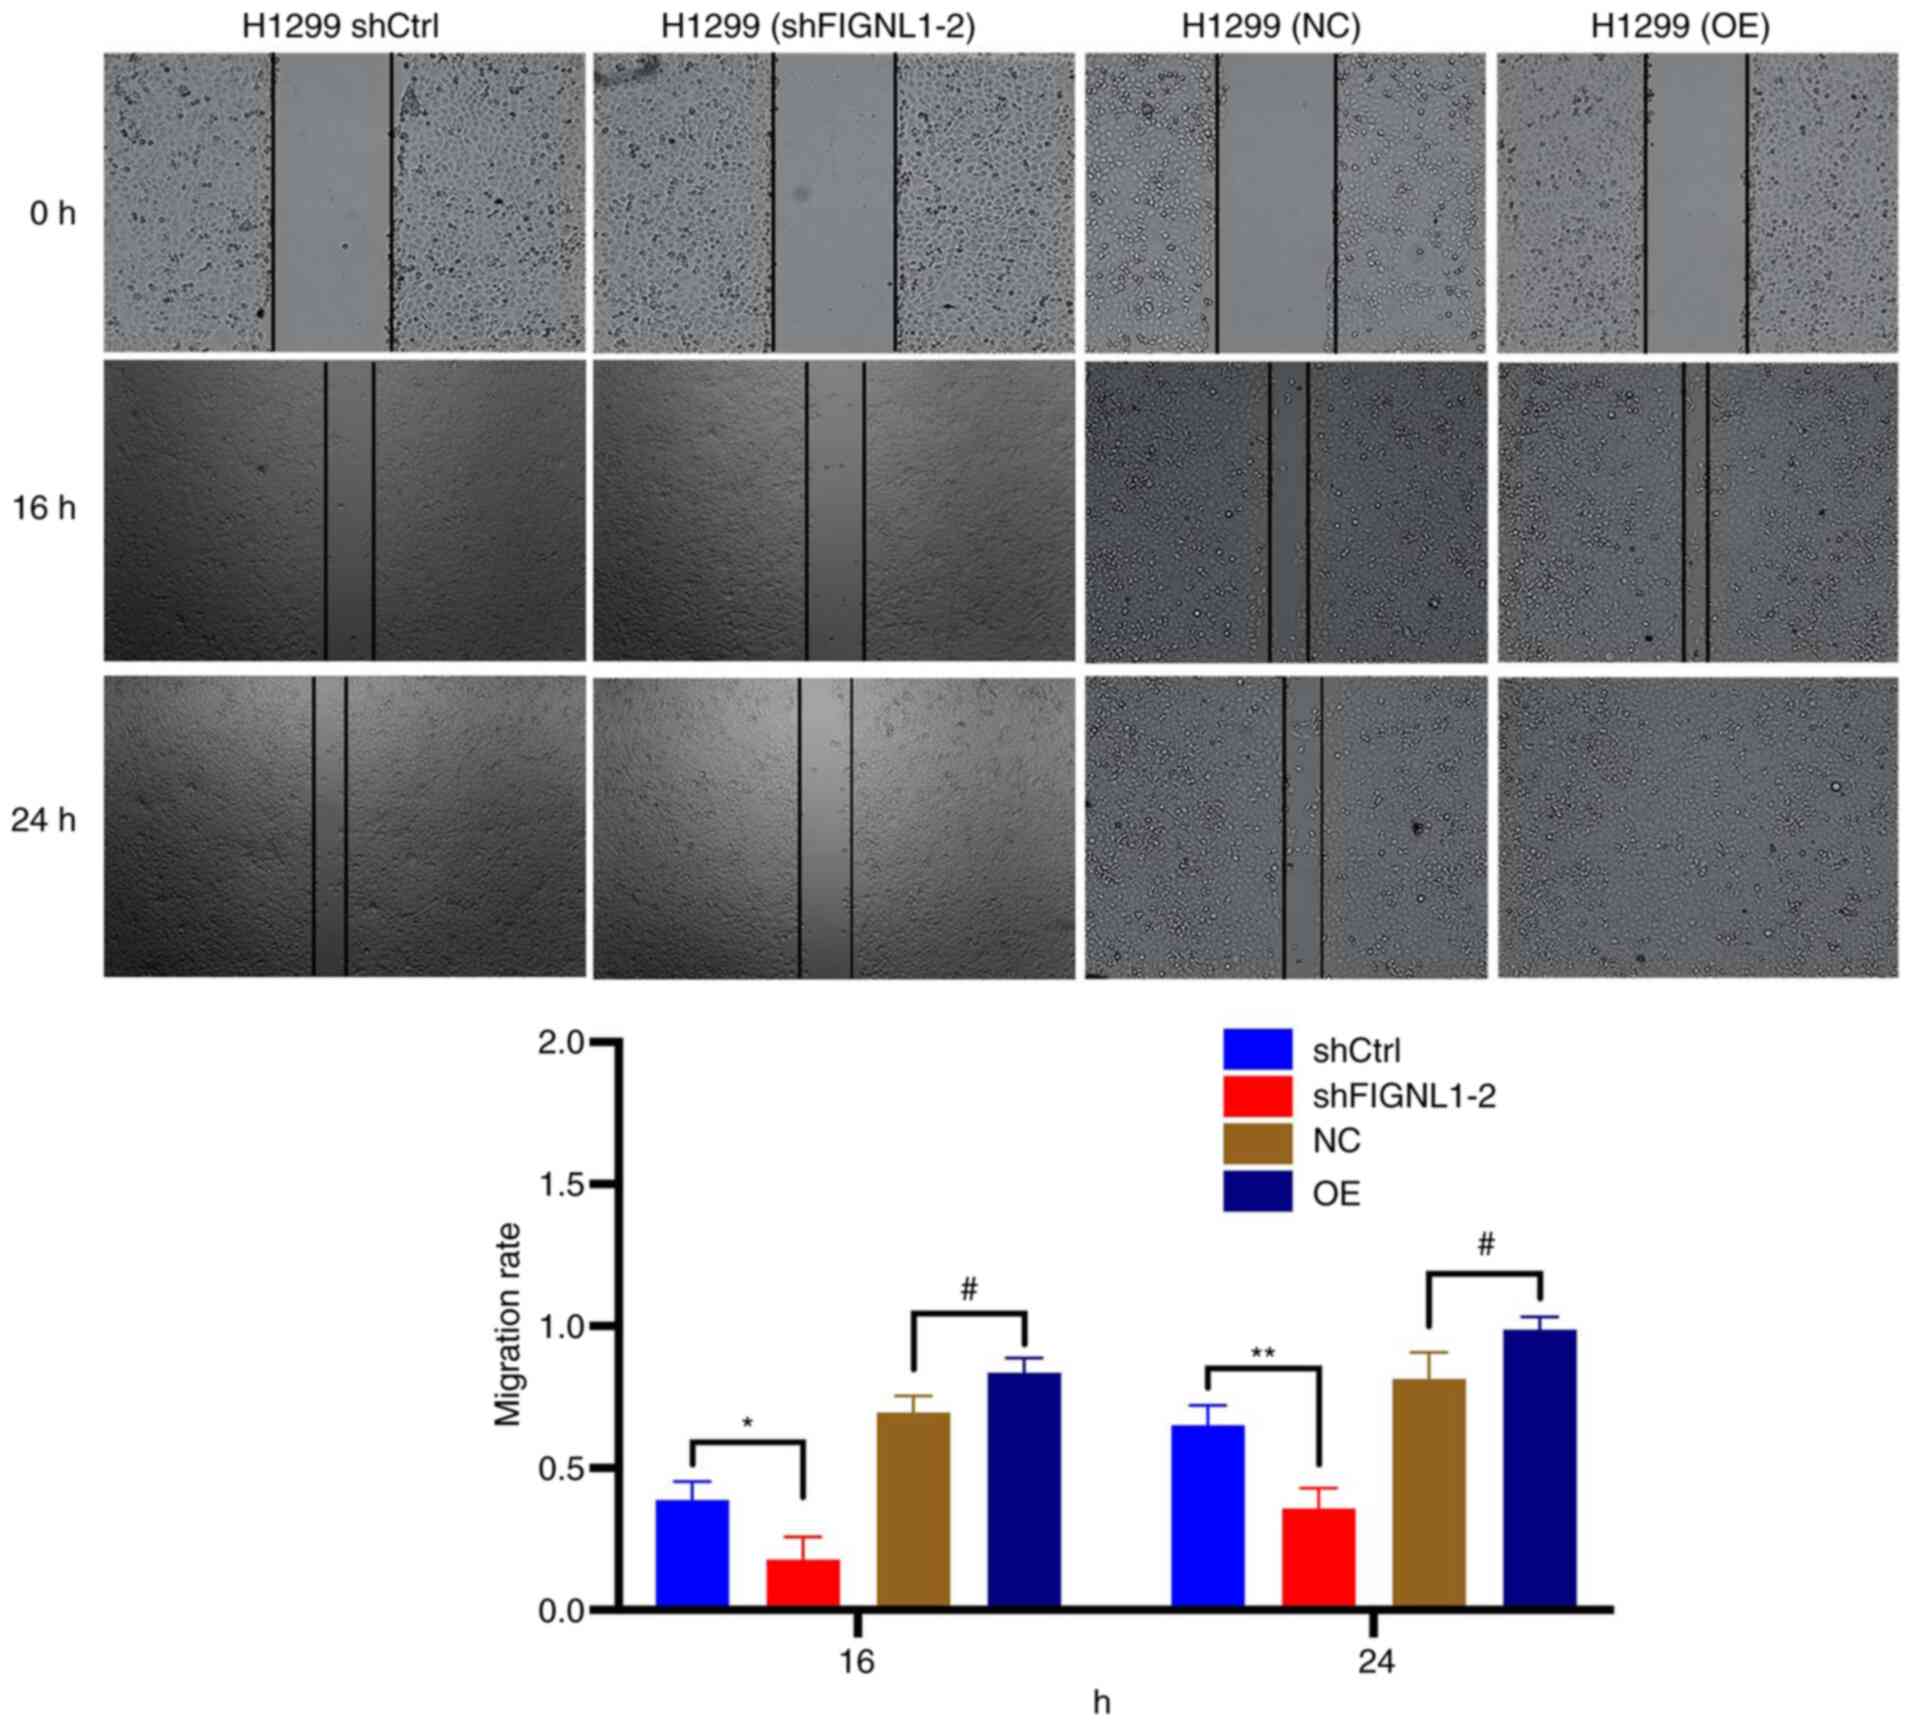
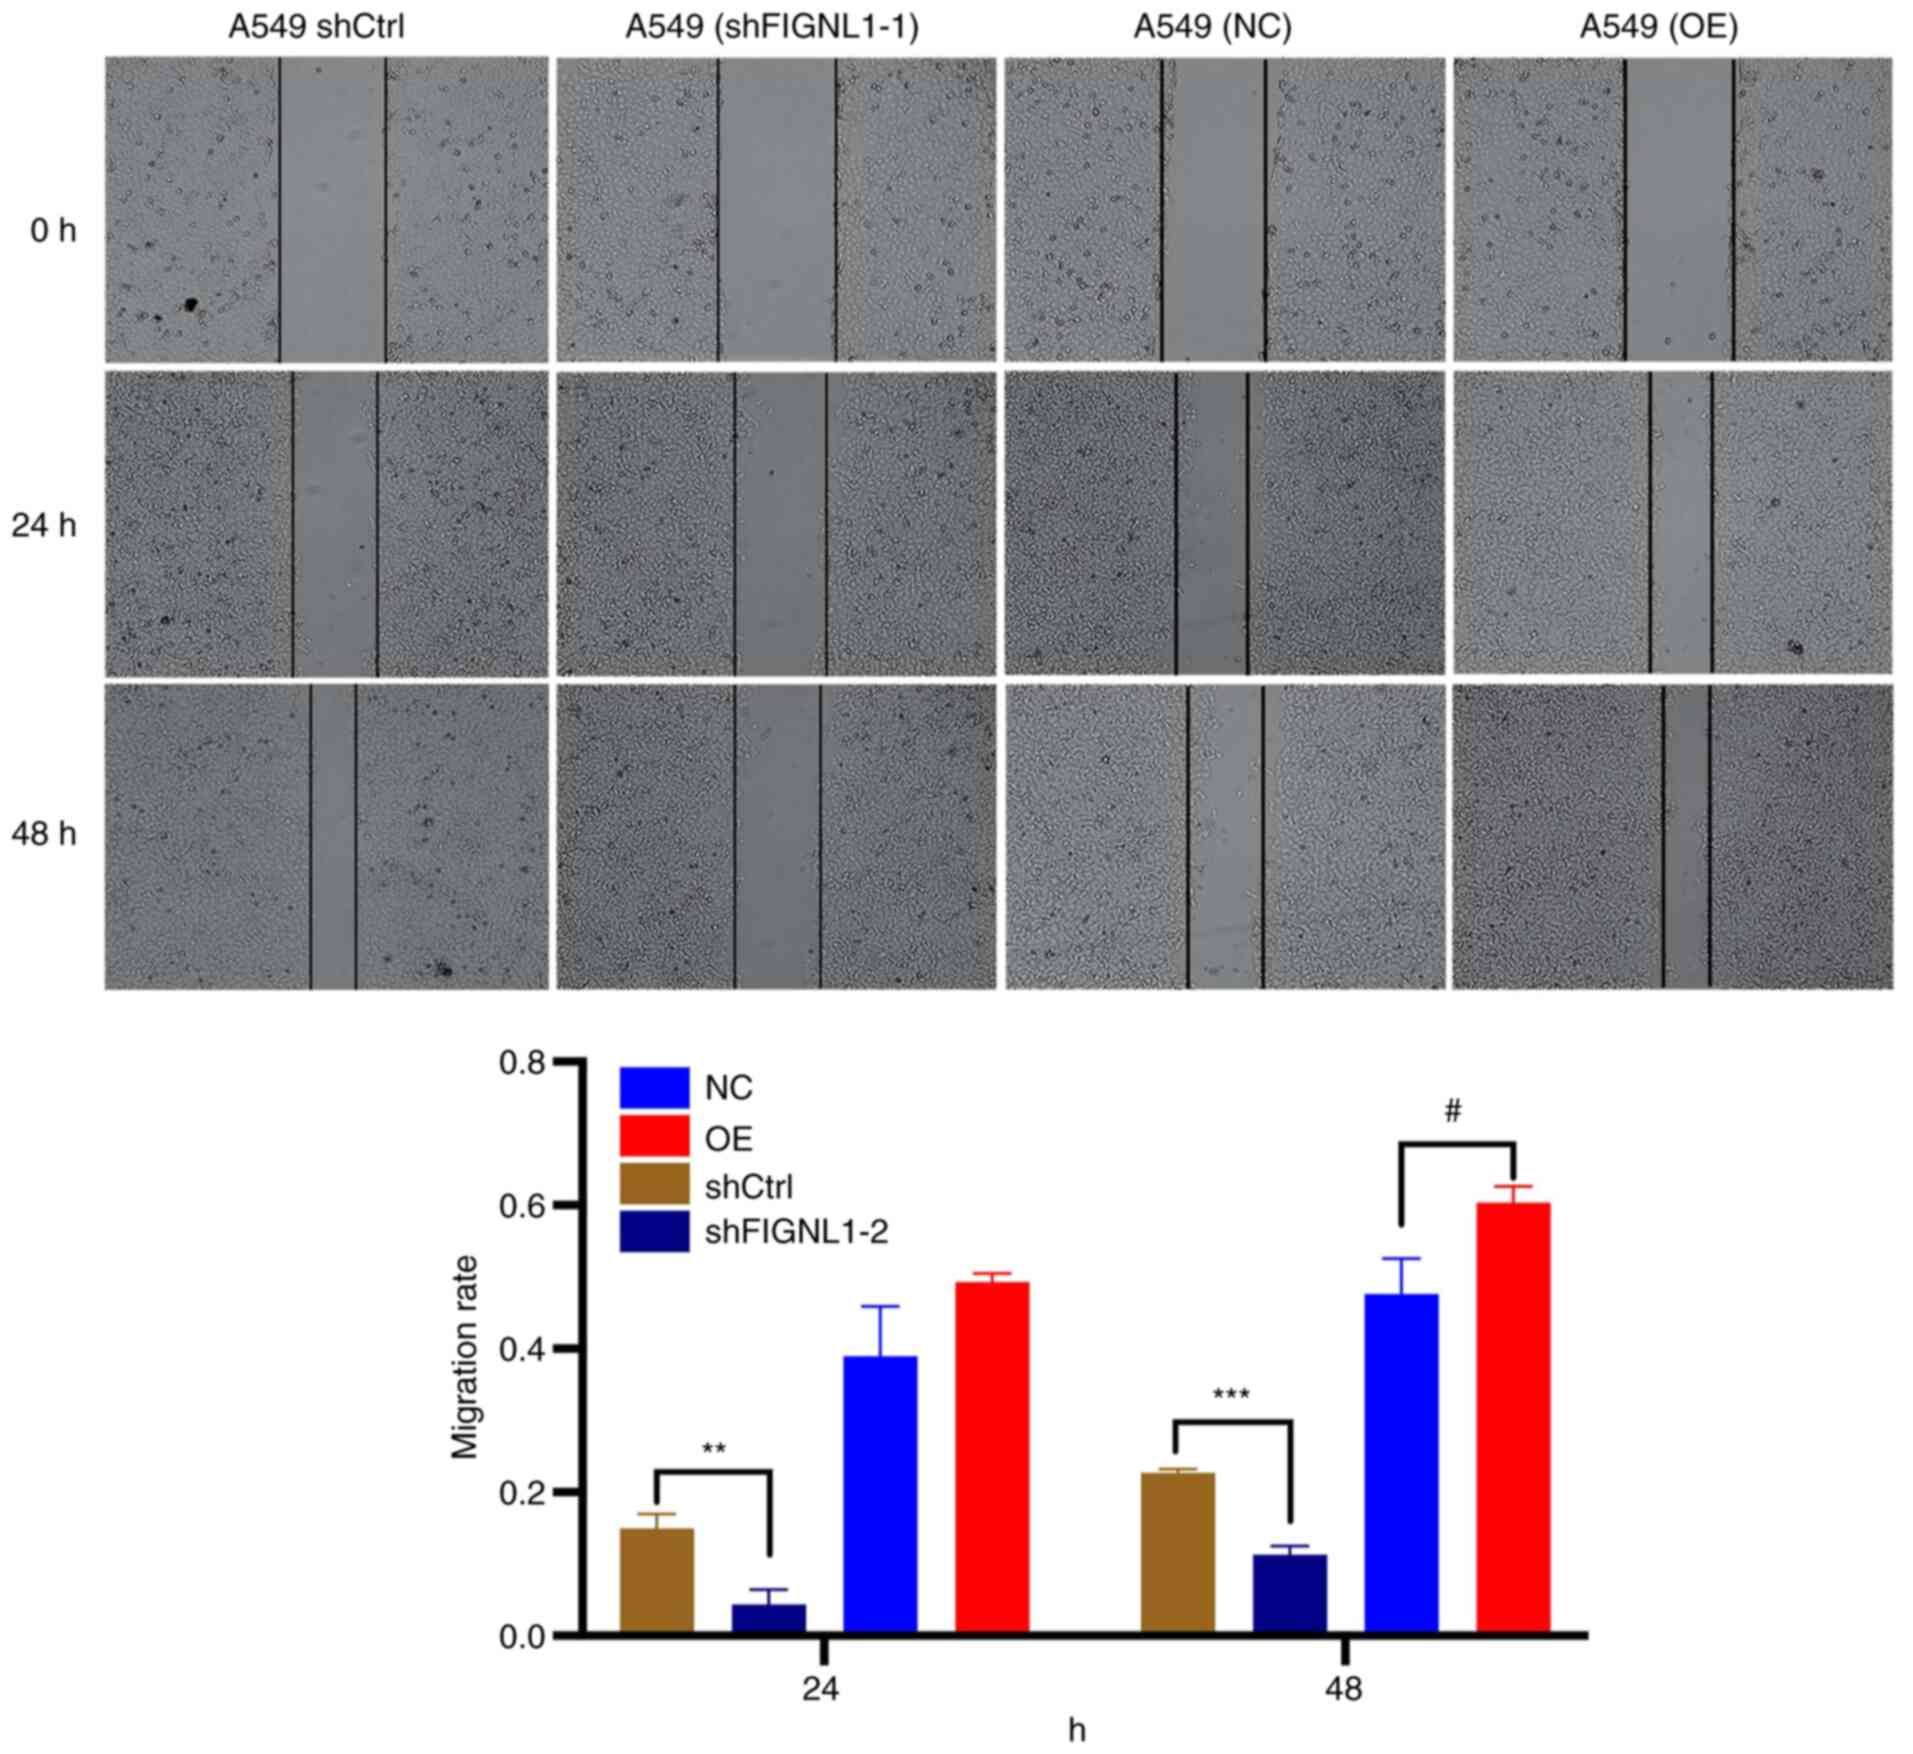
significant difference in colony formation. Furthermore, a wound
healing assay was used to determine the migratory ability of both
of the cell lines. Compared with that in the control group, both
the cell lines, that had been transfected with shFIGNL1 showed a
reduced migration ability, while the overexpression group exhibited
significantly increased migratory ability to heal the wound
(P<0.05; Figs. 8 and 9). Consistent results were obtained from
the Transwell and Matrigel assays (Fig. 10). Both cell lines transfected
with shFIGNL1 (shFIGNL1-1 in A549 cells and shFIGNL1-2 in H1299
cells) exhibited a significant reduction in invasive growth, while
the opposite results were observed following overexpression of
FIGNL1 (P<0.05).
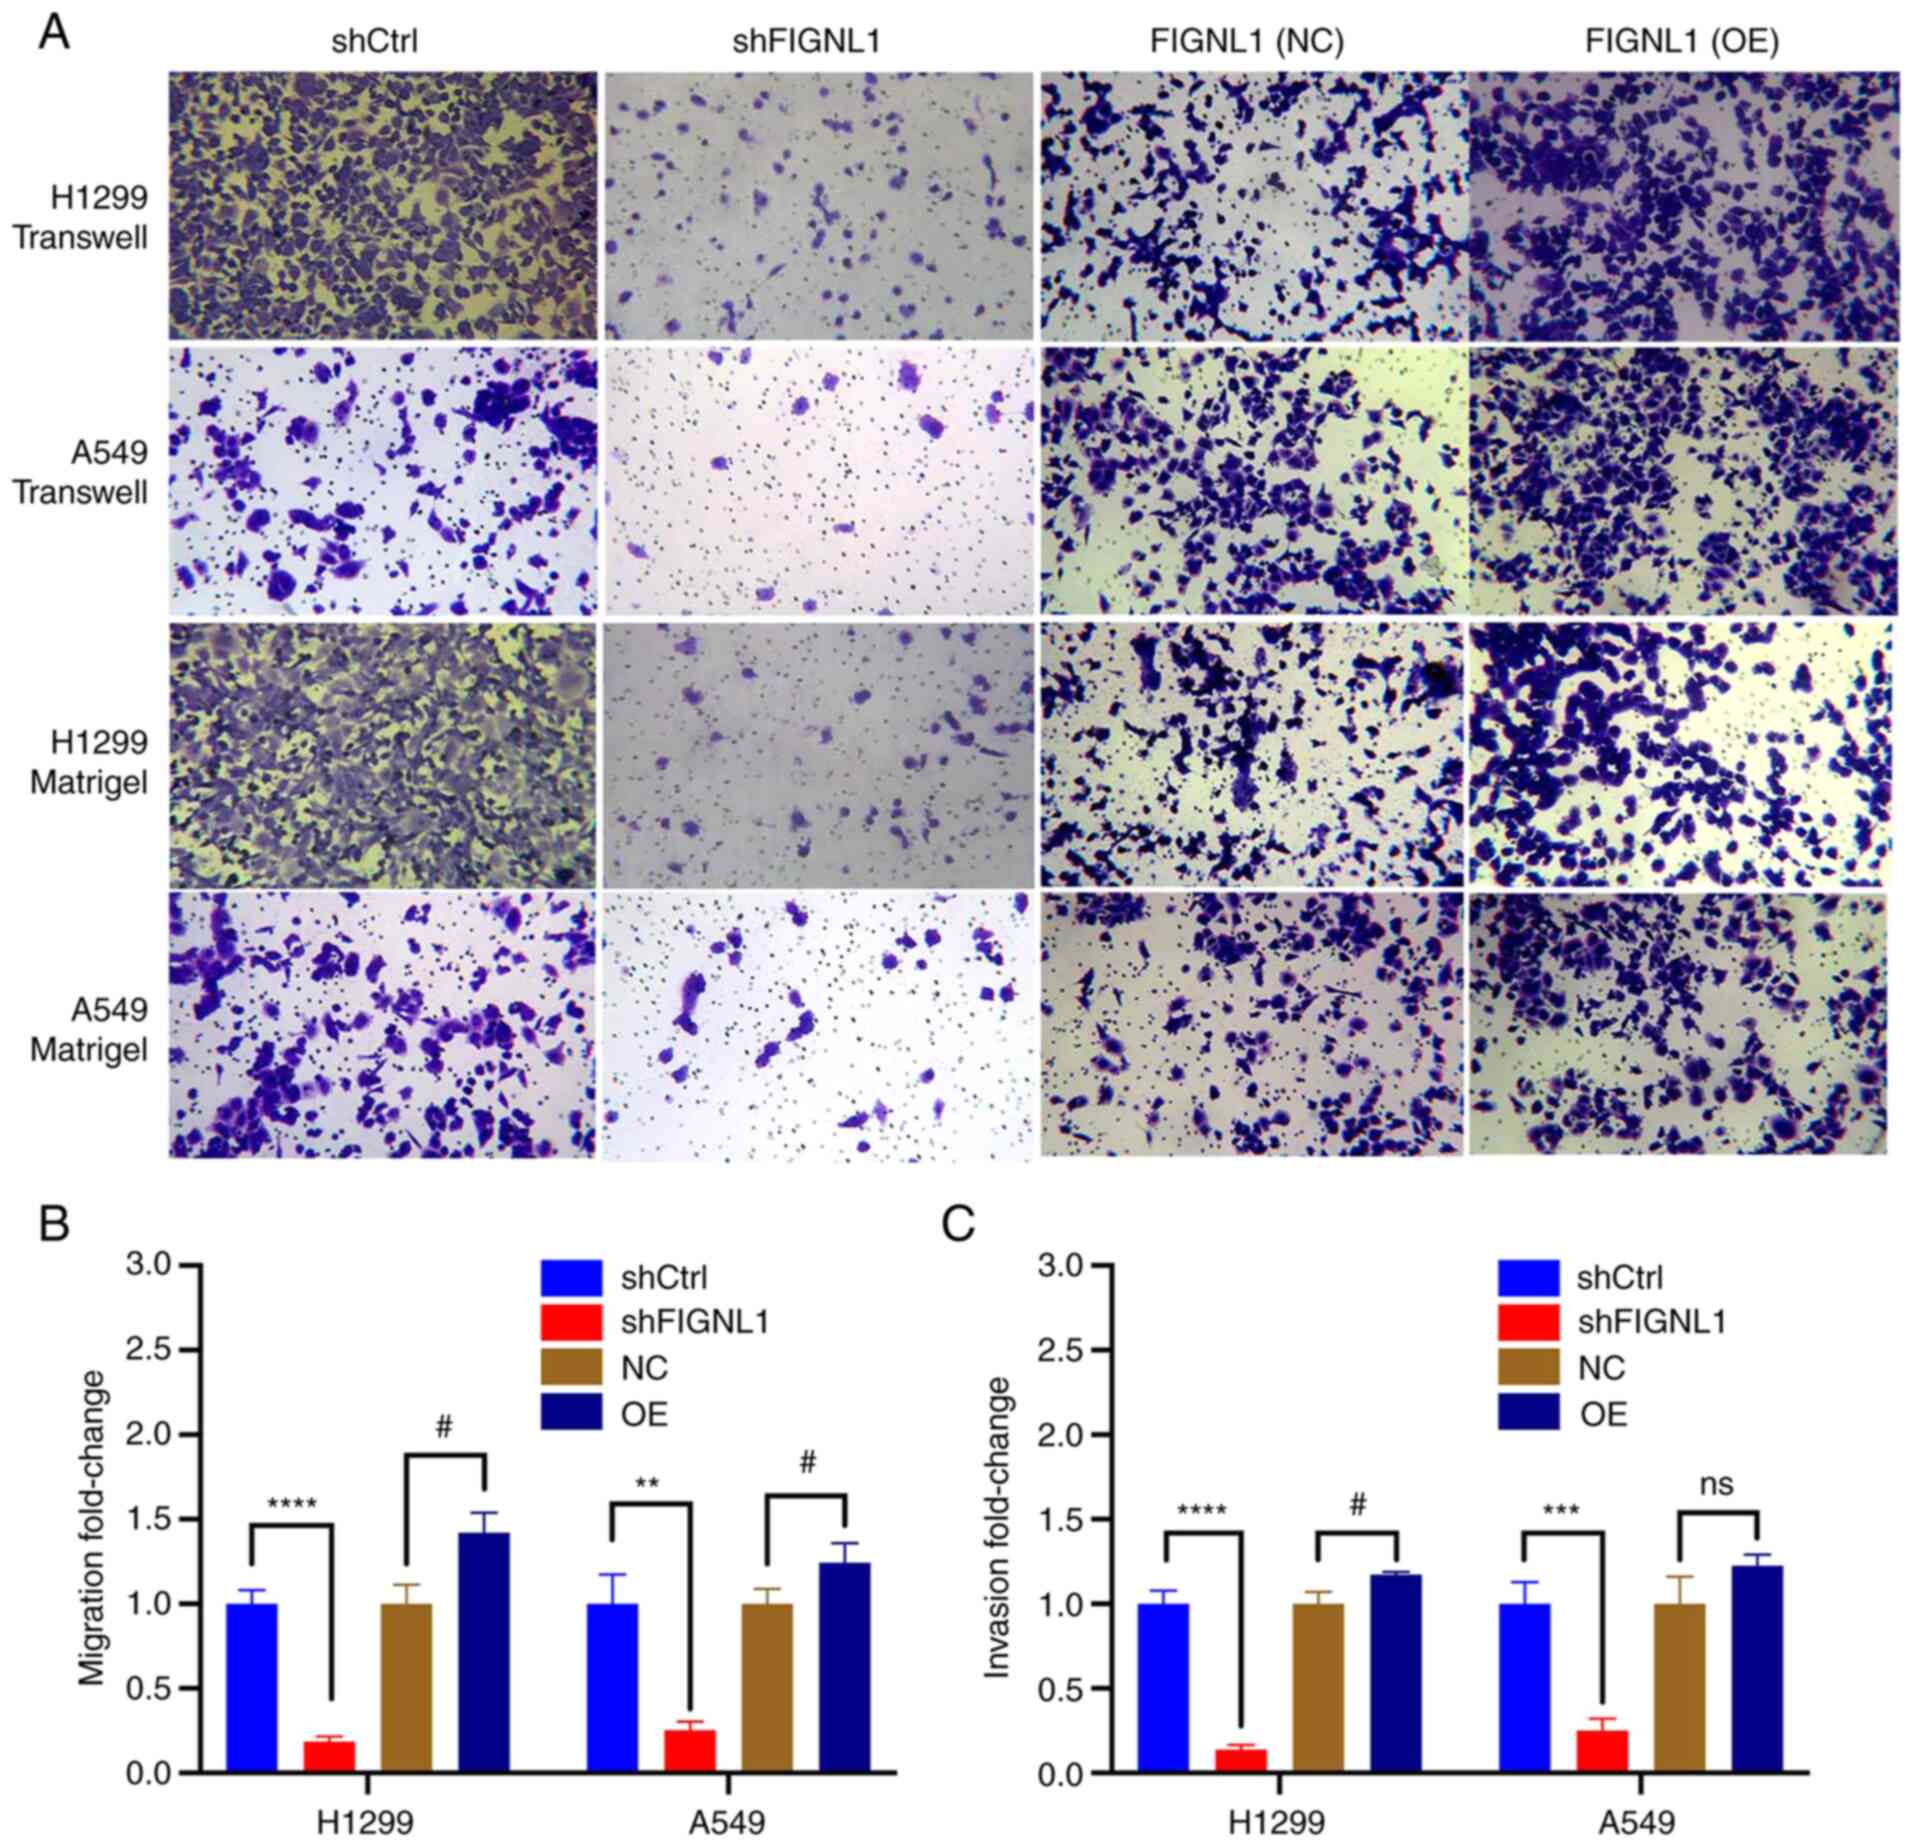 | Figure 10(A) Representative images of
Transwell and Matrigel assays showing the effect of FIGNL1
knockdown and overexpression on cell migration and invasion
abilities, respecitvely and the results were subsequently (B and C)
quantified. In both experiments, knockdown of FIGNL1 significantly
reduced the ability of cells to migrate and invade.
#P<0.05, **P<0.01,
***P<0.001, ****P<0.0001. n=3. FIGNL1
knockdown using shFIGNL1-2 in H1299 cells and shFIGNL1-1 in A549
cells. NC, negative control; OE, overexpression; sh, short hairpin;
Ctrl, control; FIGNL1, fidgetin-like 1. |
These findings suggested that FIGNL1 could be
required for the maintenance of normal cell division and migration
abilities, which are important for tumor formation and development
in vivo. Functional disturbance of FIGNL1 may result in
abnormal activity of lung cancer cells as indicated in
vitro.
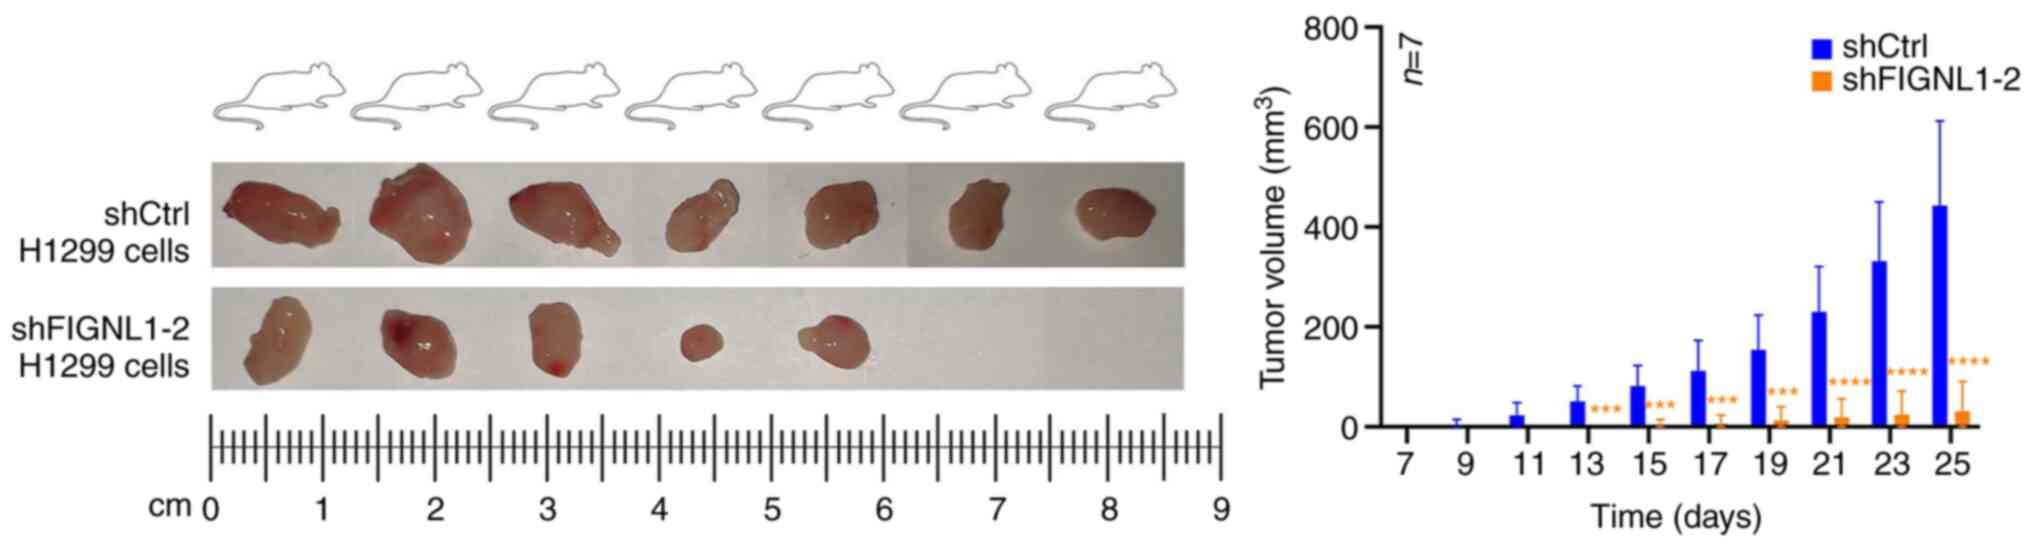
Effect of FIGNL1 on the speed of tumor
formation and potential mechanisms
In the xenograft experiment, FIGNL1 knockdown led to
delayed tumor formation compared with that in mice injected with
H1299 shCtrl (P<0.05). As illustrated in Fig. 11, the long diameter of the tumors
for the tenth time-point (day 25) was observed and ranged from 0 to
6.98 mm compared with 8 to 11.77 mm in the control group, while the
short diameters ranged from 0 to 4.53 mm compared with 7.45 to
11.18 mm in the control group. No significant weight loss was
observed in the animals, and the percentages of the weight increase
ranged from 12.49 to 47.34% compared with 25.43 to 40.53% in the
control group. These effects could be associated with the role of
FIGNL1 in promoting proliferation. To investigate the underlying
mechanisms of this hypothesis, a cDNA microarray analysis in H1299
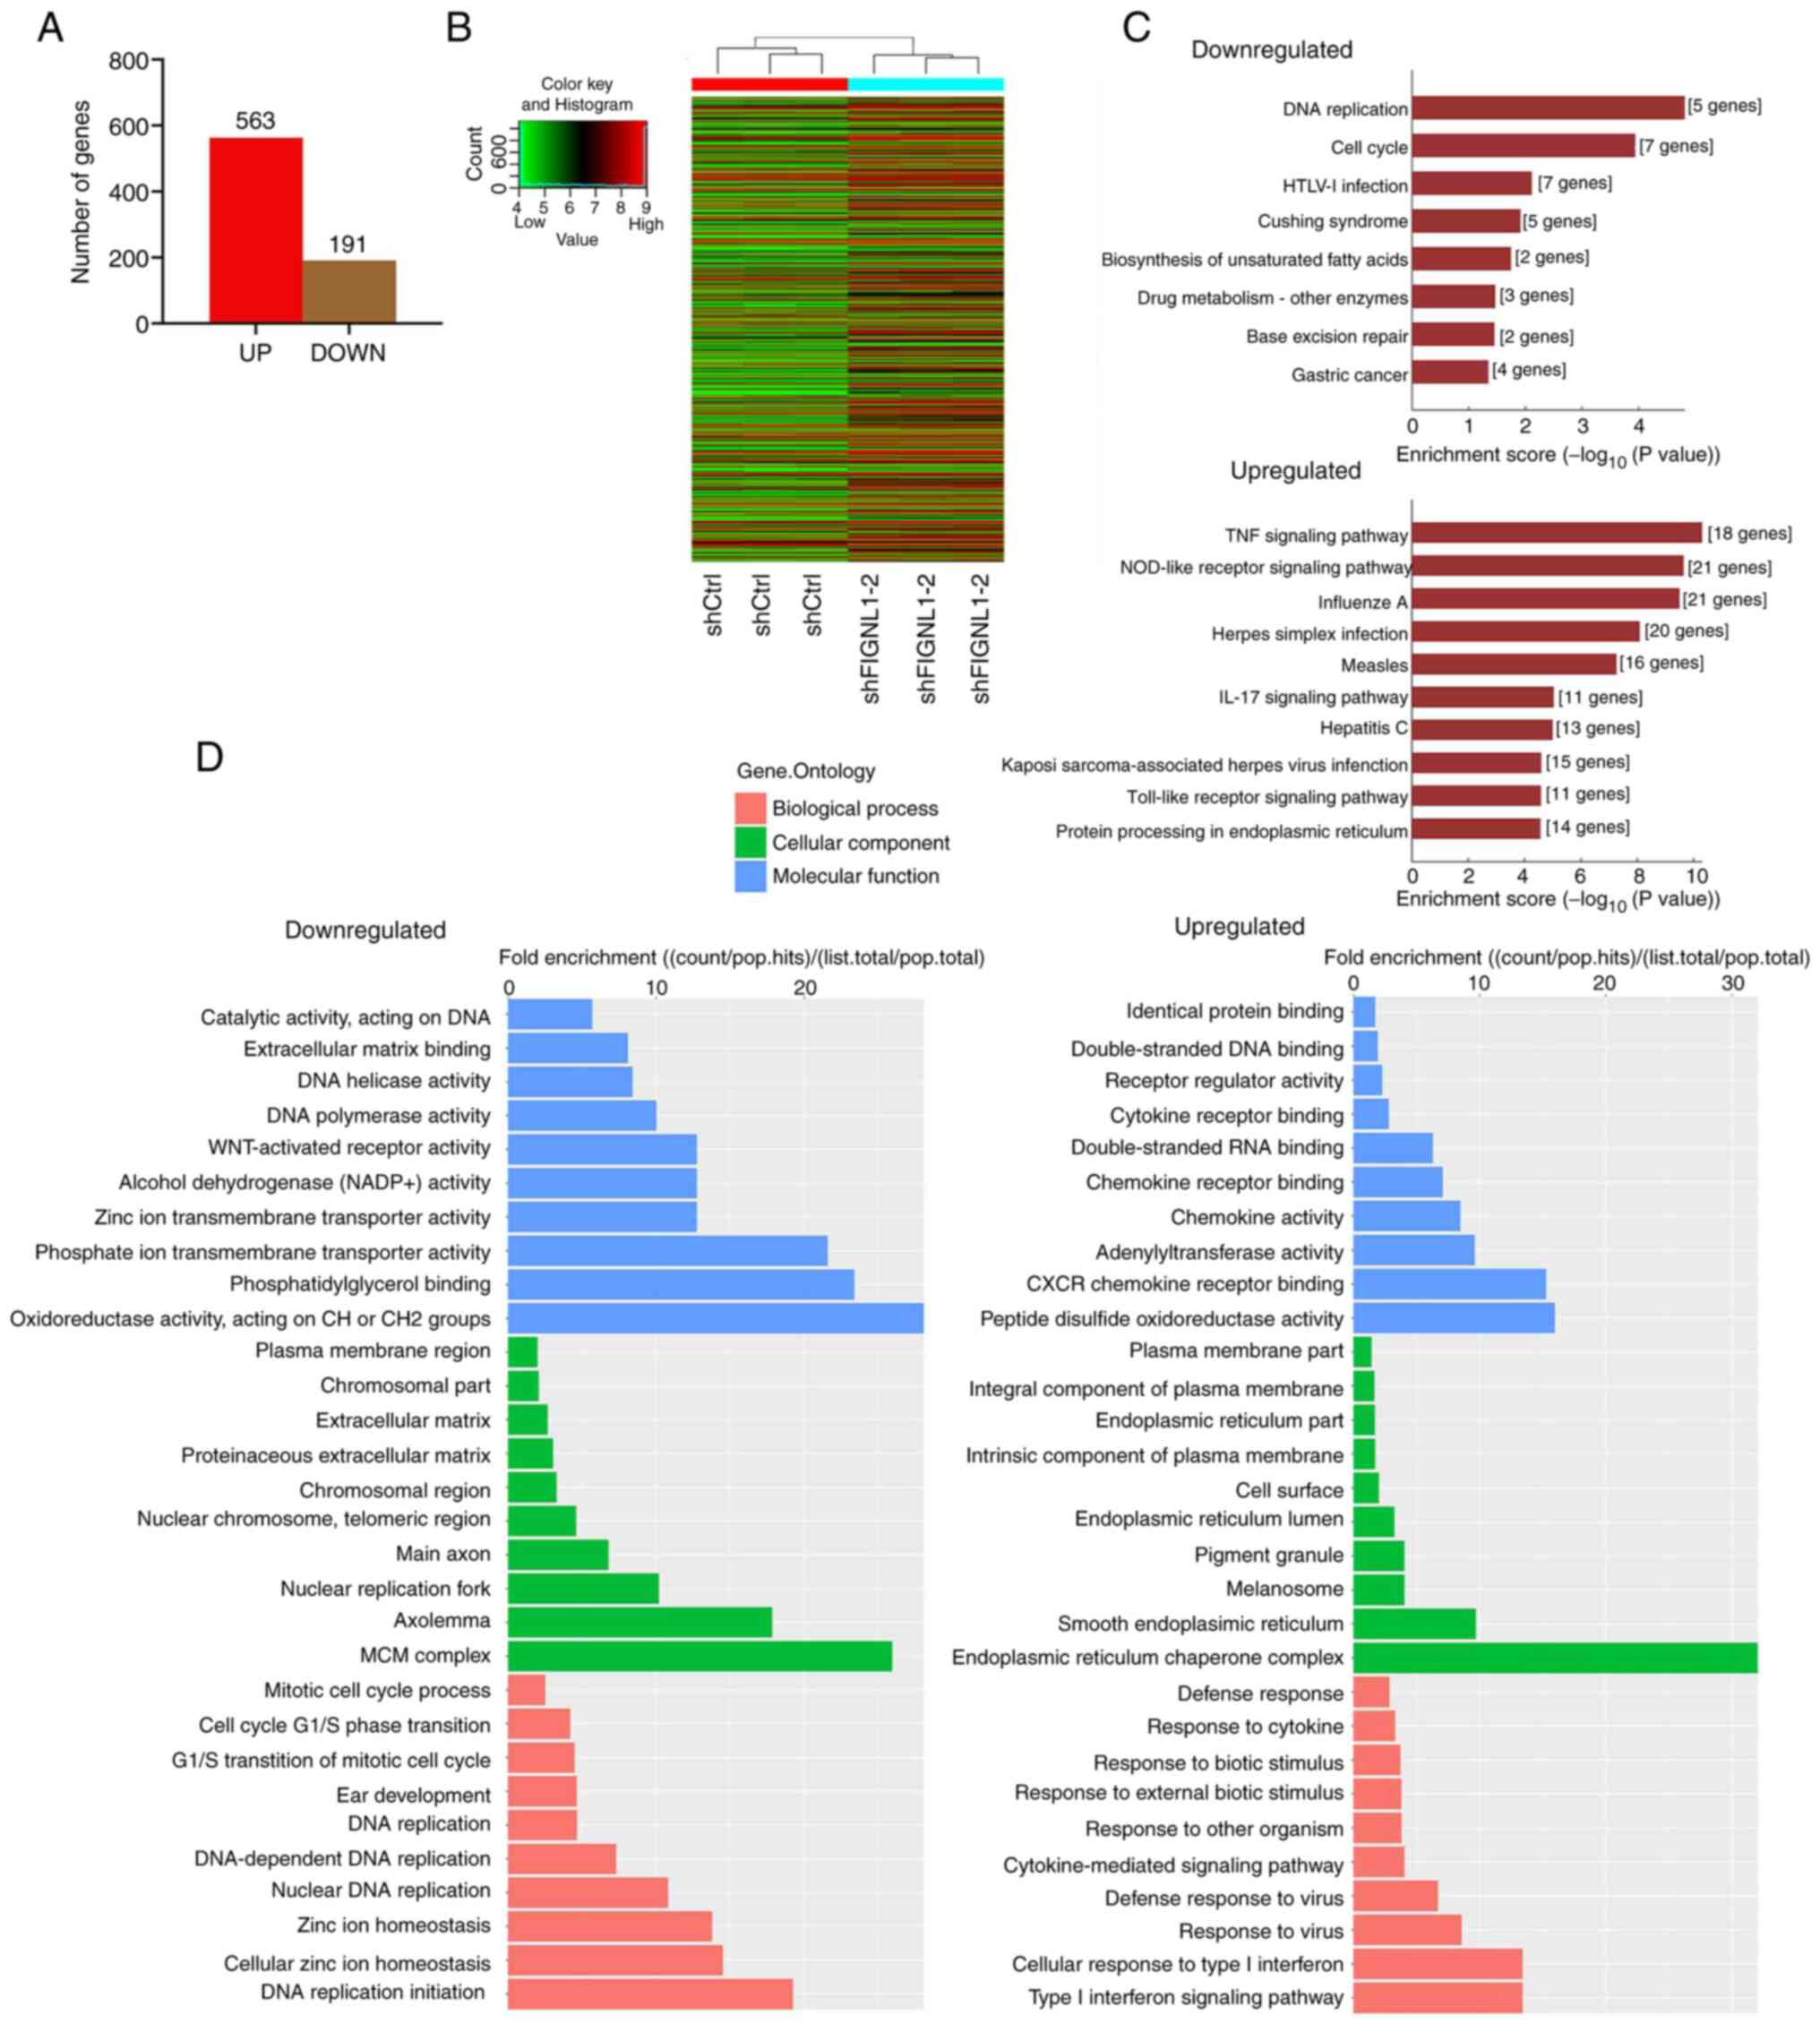
knockdown cells was performed. A total of 754 DEGs (out of 28,311
genes detected) were identified, of which 563 and 191 were up- and
downregulated, respectively (Fig.
12A). In addition, among the downregulated DEGs, numerous
processes were inhibited as shown in Fig. 12C and D. KEGG enrichment analysis
indicated that knockdown of FIGNL1 may lead to attenuated
biological processes, as the enriched pathways among the
downregulated genes were cellular proliferation-related processes,
such as DNA replication and cell cycle, as shown in Fig. 12C. From the bioinformatics
analysis, there was significant decrease in the protein expression
levels of proliferating cell nuclear antigen (PCNA),
mini-chromosome maintenance complex component (MCM)-2 and
-4, S-phase kinase associated protein 2 (SKP2); therefore,
the expression of these proteins were determined at the
transcriptional and translational levels to verify the data with
the microarray results. As shown in Fig. 13, changes in the protein
expression level of PCNA, MCM2 and SKP2 were consistent with the
results of RT-qPCR and microarray analysis; the only exception was
MCM4.
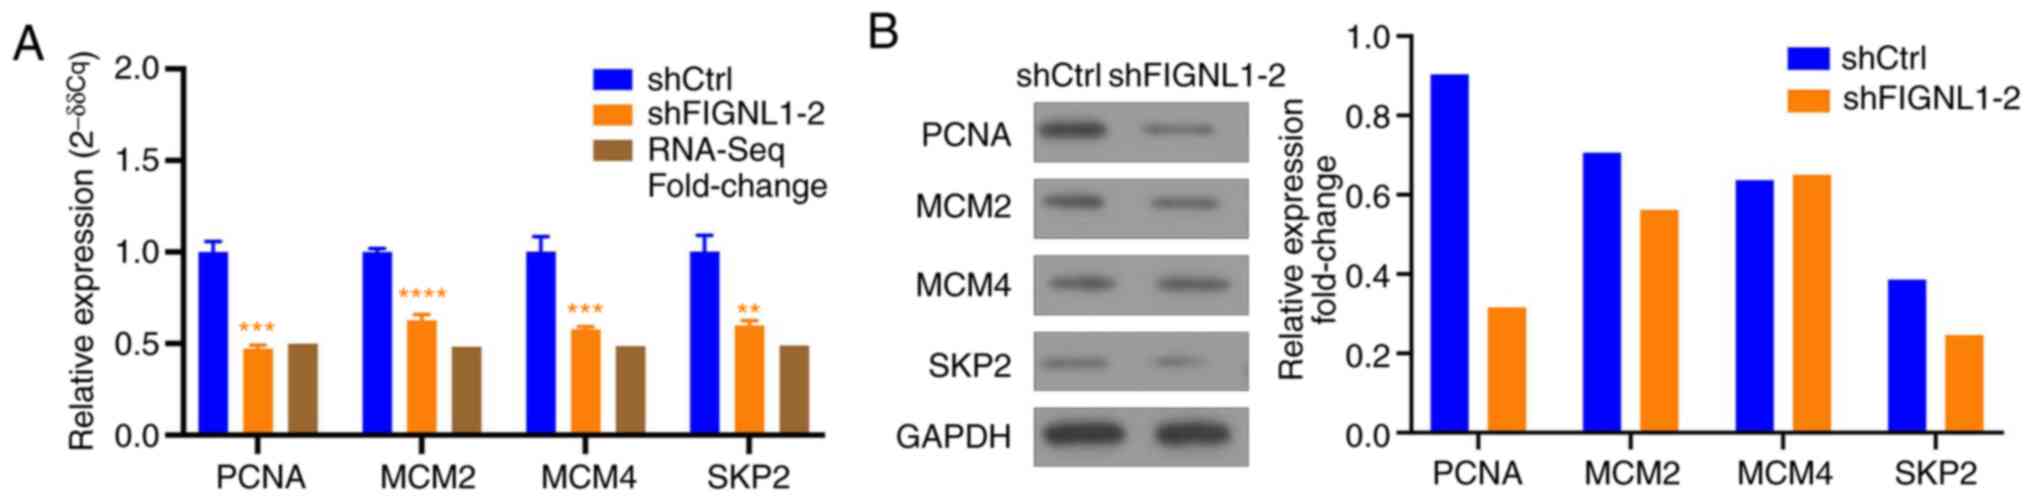 | Figure 13RT-qPCR and western blot analysis of
mRNA and protein expression level for the genes identified from the
microarray results. (A) RT-q PCR quantification and (B) western
blot grayscale image and expression analysis of the selected
downregulated genes. **P<0.01,
***P<0.001, ****P<0.0001. n=3. sh,
short hairpin; Ctrl, control, RT-qPCR, reverse
transcription-quantitative PCR; PCNA, proliferating cell nuclear
antigen; MCM, mini-chromosome maintenance complex component,
SKP2, S-phase kinase associated protein 2; FIGNL1,
fidgetin-like 1. |
Discussion
Several animal studies have shown the crucial role
of FIGNL1 in developmental morphogenesis; in addition,
dysregulation of FIGNL1 may lead to numerous diseases, such as
congenital heart disease (29) and
cancer (18). However, the role of
FIGNL1 in tumorigenesis has not been well-characterized,
particularly with respect to lung carcinoma. In the present study,
micro-array analysis of FIGNL1 knockdown cells suggested that
FIGNL1 may be associated with tumorigenesis in the lungs. Results
from RT-qPCR showed increased mRNA expression level of FIGNL1 in
the H1299 and A549 lung cancer cell lines. These findings indicated
that FIGNL1 promoted cell proliferation; however, the underlying
mechanisms are not well-known. Thus, several experiments were
performed using the H1299 and A549 lung cancer cell lines, as
FIGNL1 mRNA and protein expression level was relatively stable in
these cell lines; therefore, they were more suitable for RNA
interference. FIGNL1 knockdown was found to inhibit cell
proliferation, and increased cell death. Increased arrest of cells
in the G1 stage reduced the rate of proliferation, while
the concomitant knockdown of FIGNL1 expression resulted in more
cell death. FIGNL1 was also found to affect fission ability of
cells, wound healing, mobility and invasion, as indicated by colony
formation, wound healing, Transwell and Matrigel assays,
respectively. Thus, we hypothesized that this was caused by the
knockdown of FIGNL1, as suggested by the cDNA microarray experiment
(Fig. 12).
FIGNL1 is a conserved member of AAA ATPase protein
superfamily, which maintains the structural stability of
microtubules in cells, using the chemical energy obtained from
hydrolysis of ATP (16,17). It drives multiple essential
cellular activities, such as protein unfolding and degradation,
membrane fusion, nucleosome remodeling, and microtubule severing
(13,15,30).
Thus, changes in FIGNL1 expression may lead to alterations in cell
growth. Thus, cDNA microarray analysis was performed to predict the
potential downstream targets. PCNA, MCM -2 and -4, and
SKP2 were identified as potential targets for FIGNL1; these
have been identified as cancer-related genes. PCNA is a
conserved acidic protein synthesized in the S stage of the cell
cycle (31); it is essential for
chromosomal DNA replication in eukaryotic cell nucleus (32). It primarily serves as a cyclin or
auxiliary protein of DNA polymerase δ and DNA polymerase ε
(31,32) and plays an important role in
regulating cell cycle events (33,34)
and was associated with NSCLC (35). Discovering PCNA as an
underlying target of FIGNL1 may provide details of the mechanisms
of cell cycle changes induced by FIGNL1 knockdown; however further
investigation is required. Another key regulator during S phase is
oncogene SKP2 (also known as p45 or FBXL1),
which belongs to the F-box protein family (36-39).
This gene has been found to participate in the regulation of
numerous signal transduction pathways, such as ubiquitination
dependent proteolysis process and cell cycle control (36,37).
A recent study showed that SKP2 also participates in
DNA-damage repair, triggered by ubiquitination dependent
proteolysis and cell cycle control processes (40). In addition, SKP2 genomic
mutations were shown to induce lung cancer cell death (41). MCM2 and MCM4 are
potential therapeutic targets for NSCLC (42,43);
these were shown to be associated with the duration of the
G1 phase in the cell cycle and were the key regulatory
components for DNA replication. Increase in MCM protein expression
was found to induce NSCLC tumor formation, progression and
malignant transformation (44).
Due to these distinctions, the MCM complex family has been
considered as a valuable proliferation marker in numerous types of
cancers. In lung cancer (44),
MCM2 and MCM4 was associated with cell proliferation,
cell cycle arrest, TP53-dependent apoptosis, and Aurora B
pathway (45). However, MCM4
protein expression level was not consistent with the results from
RT-qPCR (Fig. 13B); this
suggested that FIGNL1 knockdown may not alter MCM4 protein
expression level.
In the present study, knockdown of FIGNL1 induced
notable changes in cell behavior, which could be the result of the
reduced number of DEGs involved in DNA replication, as identified
from the cDNA microarray analysis. Therefore, the changes observed
as a result of FIGNL1 knocked-down cells may be attributable to the
changes in the status of the downstream targets, such as
PCNA, MCM complexes and SKP2. As aforementioned,
these three regulators merit further investigation, as the changes
in their expression level were consistent with their biological
functions, in addition to cell behavior changes documented in the
morphotype research. Therefore, the effect of FIGNL1 on lung cancer
cell proliferation may be induced by the reduced expression of
FIGNL1. The present study found an important biological role of
FIGNL1 in regulating cell proliferation and apoptosis and lays a
foundation for further investigation into its biological impacts;
however, the underlying mechanisms by which FIGNL1 regulates cell
survival and the mechanism, by which it modulates its downstream
targets, and thus exerts its effects on DNA replication, requires
further investigation.
Supplementary Data
Acknowledgments
Not applicable.
Funding
The present study was supported by the Natural
Science Foundation of Anhui Province (grant no. 1708085MH210) and
financial support was provided by the National Key Clinical
Specialty Discipline Construction Program of China (grant no.
2012-649).
Availability of data and materials
The datasets used and/or analyzed during this study
are available from the corresponding author on reasonable
request.
Authors' contributions
LH designed the study. LH and ML designed and
performed immunohistochemistry experiments. ML, YR, WP, JH, AJ, and
ZY designed, performed, and analyzed the cell biology experiments.
ML and YR designed and performed the xenograft study. ML and WP
performed the statistical analysis. ML, YR, WP, and JH wrote the
paper. All authors approved the final version of the
manuscript.
Ethics approval and consent to
participate
The animal experiments were approved by the Animal
Ethics Committee at the Bengbu Medical College. The collection of
the clinical samples was performed under the supervision of
Institutional Review Boards of the First Affiliated Hospital of
Bengbu Medical College (approval no. BYYFY-2017.KY05). All patients
provided written informed consent to provide their tumor tissues
for further study, according to the Declaration of Helsinki.
Patient consent for publication
Written informed consent was obtained from the
patients and their relatives.
Competing interests
The authors declare that they have no competing
interests.
Abbreviations:
|
CCK-8
|
Cell Counting Kit-8
|
|
FIGNL1
|
fidgetin-like 1
|
|
GO
|
Gene Ontology
|
|
KEGG
|
Kyoto Encyclopedia of Genes and
Genomes
|
|
MCM
|
mini-chromosome maintenance
complex
|
|
NSCLC
|
non-small cell lung cancer
|
|
PCNA
|
proliferating cell nuclear antigen
|
|
SKP2
|
S-phase kinase associated protein
2
|
References
|
1
|
Bray F, Ferlay J, Soerjomataram I, Siegel
RL, Torre LA and Jemal A: Global cancer statistics 2018: GLOBOCAN
estimates of incidence and mortality worldwide for 36 cancers in
185 countries. CA Cancer J Clin. 68:394–424. 2018. View Article : Google Scholar : PubMed/NCBI
|
|
2
|
Zheng M: Classification and pathology of
lung cancer. Surg Oncol Clin N Am. 25:447–468. 2016. View Article : Google Scholar : PubMed/NCBI
|
|
3
|
Xu J, Yang H, Jin B, Lou Y, Zhang Y, Zhang
X, Zhong H, Wang H, Wu D and Han B: EGFR tyrosine kinase inhibitors
versus chemotherapy as first-line therapy for non-small cell lung
cancer patients with the L858R point mutation. Sci Repo.
6:382702016. View Article : Google Scholar
|
|
4
|
Burotto M, Manasanch EE, Wilkerson J and
Fojo T: Gefitinib and erlotinib in metastatic non-small cell lung
cancer: A meta-analysis of toxicity and efficacy of randomized
clinical trials. Oncologist. 20:400–410. 2015. View Article : Google Scholar : PubMed/NCBI
|
|
5
|
Rui Y, Peng WJ, Wang M, Wang Q, Liu ZL,
Chen YQ and Huang LN: HIST1H3D: A promising therapeutic target for
lung cancer. Int J Oncol. 50:815–822. 2017. View Article : Google Scholar : PubMed/NCBI
|
|
6
|
Jenuwein T and Allis CD: Translating the
histone code. Science. 293:1074–1080. 2001. View Article : Google Scholar : PubMed/NCBI
|
|
7
|
Rheinbay E, Louis DN, Bernstein BE and
Suvà ML: A tell-tail sign of chromatin: Histone mutations drive
pediatric glioblastoma. Cancer Cell. 21:329–331. 2012. View Article : Google Scholar : PubMed/NCBI
|
|
8
|
Turner BM: Cellular memory and the histone
code. Cell. 111:285–291. 2002. View Article : Google Scholar : PubMed/NCBI
|
|
9
|
Iwaya T, Fukagawa T, Suzuki Y, Takahashi
Y, Sawada G, Ishibashi M, Kurashige J, Sudo T, Tanaka F, Shibata K,
et al: Contrasting expression patterns of histone mRNA and microRNA
760 in patients with gastric cancer. Clin Cancer Res. 19:6438–6449.
2013. View Article : Google Scholar : PubMed/NCBI
|
|
10
|
Austin TO, Matamoros AJ, Friedman JM,
Friedman AJ, Nacharaju P, Yu W, Sharp DJ and Baas PW: Nanoparticle
delivery of fidgetin siRNA as a Microtubule-based therapy to
augment nerve regeneration. Sci Rep. 7:96752017. View Article : Google Scholar : PubMed/NCBI
|
|
11
|
Park SJ, Kim SJ, Rhee Y, Byun JH, Kim SH,
Kim MH, Lee EJ and Lim SK: Fidgetin-like 1 gene inhibited by basic
fibroblast growth factor regulates the proliferation and
differentiation of osteoblasts. J Bone Miner Res. 22:889–896. 2007.
View Article : Google Scholar : PubMed/NCBI
|
|
12
|
Schraenen A, de Faudeur G, Thorrez L,
Lemaire K, Van Wichelen G, Granvik M, Van Lommel L, In't Veld P and
Schuit F: mRNA expression analysis of cell cycle genes in islets of
pregnant mice. Diabetologia. 53:2579–2588. 2010. View Article : Google Scholar : PubMed/NCBI
|
|
13
|
Hanson PI and Whiteheart SW: AAA+
proteins: Have engine, will work. Nat Rev Mol Cell Biol. 6:519–529.
2005. View Article : Google Scholar : PubMed/NCBI
|
|
14
|
Zhao X, Jin M, Wang M, Sun L, Hong X, Cao
Y and Wang C: Fidgetin-like 1 is a ciliogenesis-inhibitory
centrosome protein. Cell Cycle. 15:2367–2375. 2016. View Article : Google Scholar : PubMed/NCBI
|
|
15
|
Snider J and Houry WA: AAA+ proteins:
Diversity in function, similarity in structure. Biochem Soc Trans.
36:72–77. 2008. View Article : Google Scholar : PubMed/NCBI
|
|
16
|
Martin J and Lupas A: AAA-ATPases.
Encyclopedia of Biological Chemistry. 2nd edition. Academic Press;
pp. 1–6. 2013
|
|
17
|
Bar-Nun S and Glickman MH: Proteasomal
AAA-ATPases: Structure and function. Biochim Biophys Acta.
1823:67–82. 2012. View Article : Google Scholar
|
|
18
|
Yuan J and Chen J: FIGNL1-containing
protein complex is required for efficient homologous recombination
repair. Proc Natl Acad Sci USA. 110:10640–10645. 2013. View Article : Google Scholar : PubMed/NCBI
|
|
19
|
Hu Z, Feng J, Bo W, Wu R, Dong Z, Liu Y,
Qiang L and Liu M: Fidgetin regulates cultured astrocyte migration
by severing tyrosinated microtubules at the leading edge. Mol Biol
Cell. 28:545–553. 2017. View Article : Google Scholar :
|
|
20
|
Tao J, Feng C and Rolls MM: The
microtubule-severing protein fidgetin acts after dendrite injury to
promote their degeneration. J Cell Sci. 129:3274–3281. 2016.
View Article : Google Scholar : PubMed/NCBI
|
|
21
|
Leo L, Yu W, D'Rozario M, Waddell EA,
Marenda DR, Baird MA, Davidson MW, Zhou B, Wu B, Baker L, et al:
Vertebrate fidgetin restrains axonal growth by severing labile
domains of microtubules. Cell Rep. 12:1723–1730. 2015. View Article : Google Scholar : PubMed/NCBI
|
|
22
|
L'Hote D, Vatin M, Auer J, Castille J,
Passet B, Montagutelli X, Serres C and Vaiman D: Fidgetin-like1 is
a strong candidate for a dynamic impairment of male meiosis leading
to reduced testis weight in mice. PLoS One. 6:e275822011.
View Article : Google Scholar : PubMed/NCBI
|
|
23
|
Truslove MG: The anatomy and development
of the fidget mouse. J Genet. 54:641956. View Article : Google Scholar
|
|
24
|
Ma J, Li J, Yao X, Lin S, Gu Y, Xu J, Deng
Z, Ma W and Zhang H: FIGNL1 is overexpressed in small cell lung
cancer patients and enhances NCI-H446 cell resistance to cisplatin
and etoposide. Oncol Rep. 37:1935–1942. 2017. View Article : Google Scholar : PubMed/NCBI
|
|
25
|
Detterbeck FC, Boffa DJ, Kim AW and Tanoue
LT: The edition lung cancer stage classification. Chest.
151:193–203. 2016. View Article : Google Scholar
|
|
26
|
Livak KJ and Schmittgen TD: Analysis of
relative gene expression data using real-time Quantitative PCR and
the 2(-Delta Delta C(T)) method. Method. 25:402–408. 2002.
View Article : Google Scholar
|
|
27
|
Ashburner M, Ball CA, Blake JA, Botstein
D, Butler H, Cherry JM, Davis AP, Dolinski K, Dwight SS, Eppig JT,
et al: Gene ontology: Tool for the unification of biology. The Gene
Ontology Consortium Nat Genet. 25:25–29. 2000.
|
|
28
|
The Gene Ontology Consortium: The Gene
Ontology Resource: 20 years and still GOing strong. Nucleic Acids
Res. 47:D330–D338. 2019. View Article : Google Scholar :
|
|
29
|
Wang D, Chu M, Wang F, Zhou A, Ruan M and
Chen Y: A Genetic variant in FIGN gene reduces the risk of
congenital heart disease in Han Chinese populations. Pediatr
Cardiol. 38:1169–1174. 2017. View Article : Google Scholar : PubMed/NCBI
|
|
30
|
Lupas AN and Martin J: AAA proteins. Curr
Opin Struct Biol. 12:746–753. 2002. View Article : Google Scholar : PubMed/NCBI
|
|
31
|
Fontanini G, Macchiarini P, Pepe S,
Ruggiero A, Hardin M, Bigini D, Vignati S, Pingitore R and
Angeletti CA: The expression of proliferating cell nuclear antigen
in paraffin sections of peripheral, node-negative non-small cell
lung cancer. Cancer. 70:1520–1527. 1992. View Article : Google Scholar : PubMed/NCBI
|
|
32
|
Jackson P, Ridgway P, Rayner J, Noble J
and Braithwaite A: Transcriptional regulation of the PCNA promoter
by p53. Biochem Biophys Res Commun. 203:133–140. 1994. View Article : Google Scholar : PubMed/NCBI
|
|
33
|
Chiang CP, Lang MJ, Liu BY, Wang JT, Leu
JS, Hahn LJ and Kuo MY: Expression of proliferating cell nuclear
antigen (PCNA) in oral submucous fibrosis, oral epithelial
hyperkeratosis and oral epithelial dysplasia in Taiwan. Oral Oncol.
36:353–359. 2000. View Article : Google Scholar : PubMed/NCBI
|
|
34
|
Srinivasan M and Jewell SD: Quantitative
estimation of PCNA, c-myc, EGFR and TGF-alpha in oral submucous
fibrosis-an immunohistochemical study. Oral Oncol. 37:461–467.
2001. View Article : Google Scholar : PubMed/NCBI
|
|
35
|
Fan J, Zhou X, Huang J, Wang X and Che G:
Prognostic roles of PCNA expressions in non-small cell lung cancer:
A meta-analysis. Int J Clin Exp Med. 9:5655–5665. 2016.
|
|
36
|
Craig KL and Tyers M: The F-box: A new
motif for ubiquitin dependent proteolysis in cell cycle regulation
and signal transduction. Prog Biophys Mol Biol. 72:299–328. 1999.
View Article : Google Scholar : PubMed/NCBI
|
|
37
|
Bai C, Sen P, Hofmann K, Ma L, Goebl M,
Harper JW and Elledge SJ: SKP1 connects cell cycle regulators to
the ubiquitin proteolysis machinery through a novel motif, the
F-box. Cell. 86:263–274. 1996. View Article : Google Scholar : PubMed/NCBI
|
|
38
|
Sutterlüty H, Chatelain E, Marti A,
Wirbelauer C, Senften M, Müller U and Krek W: p45SKP2 promotes
p27Kip1 degradation and induces S phase in quiescent cells. Nat
Cell Biol. 1:207–214. 1999. View
Article : Google Scholar : PubMed/NCBI
|
|
39
|
Zhang H, Kobayashi R, Galaktionov K and
Beach D: p19Skp1 and p45Skp2 are essential elements of the cyclin
A-CDK2 S phase kinase. Cell. 82:915–925. 1995. View Article : Google Scholar : PubMed/NCBI
|
|
40
|
Wu J, Zhang X, Zhang L, Wu CY, Rezaeian
AH, Chan CH, Li JM, Wang J, Gao Y, Han F, et al: Skp2 E3 ligase
integrates ATM activation and homologous recombination repair by
ubiquitinating NBS1. Mol Cell. 46:351–361. 2012. View Article : Google Scholar : PubMed/NCBI
|
|
41
|
Yokoi S, Yasui K, Iizasa T, Takahashi T,
Fujisawa T and Inazawa J: Down-regulation of SKP2 induces apoptosis
in lung-cancer cells. Cancer Sci. 94:344–349. 2003. View Article : Google Scholar : PubMed/NCBI
|
|
42
|
Han J, Lian M, Fang J, Liu H, Wang R, Zhai
J, Fan Yang Y, Fen L, Shi Q, Zhi Ma H, et al: Minichromosome
maintenance (MCM) protein 4 overexpression is a potential
prognostic marker for laryngeal squamous cell carcinoma. J BUON.
22:1272–1277. 2017.PubMed/NCBI
|
|
43
|
Yang J, Ramnath N, Moysich KB, Asch HL,
Swede H, Alrawi SJ, Huberman J, Geradts J, Brooks JS and Tan D:
Prognostic significance of MCM2, Ki-67 and gelsolin in non-small
cell lung cancer. BMC Cancer. 6:2032006. View Article : Google Scholar : PubMed/NCBI
|
|
44
|
Zhang X, Teng Y, Yang F, Wang M, Hong X,
Ye LG, Gao YN and Chen GY: MCM2 is a therapeutic target of
lovastatin in human non-small cell lung carcinomas. Oncol Rep.
33:2599–2605. 2015. View Article : Google Scholar : PubMed/NCBI
|
|
45
|
Liu K, Kang M, Liao X and Wang R:
Genome-wide investigation of the clinical significance and
prospective molecular mechanism of minichromosome maintenance
protein family genes in patients with Lung Adenocarcinoma. PLoS
One. 14:e02194672019. View Article : Google Scholar : PubMed/NCBI
|