Introduction
Lung cancer is the most commonly diagnosed cancer
worldwide (11.6% of all cases) and is a leading cause of
cancer-related mortality in both males and females due to the poor
5-year overall survival rate and high recurrence rate (1,2).
Non-small cell lung cancer, including large cell carcinoma,
squamous cell carcinoma and adenocarcinoma, is the major subtype
(~80%) among lung cancer cases (3).
Among these histological subtypes, adenocarcinoma is the most
common one to be diagnosed in Taiwan (1,4,5).
In Western countries, 70–90% of lung cancer cases
are attributed to cigarette smoking; however, in Taiwan, only 7% of
female lung cancer cases are associated with smoking (6,7).
Several previous studies have identified genes (e.g., KRAS,
phosphoinositide-3-kinase, catalytic, α polypeptide and
EGFR) (7–12) that are associated with lung cancer
in non-smokers. Our previous studies revealed that one of the
semaphorins, semaphorin (SEMA)5A, could potentially serve as a
therapeutic biomarker (13) and
demonstrated that SEMA5A inhibited tumor proliferation and
migration in lung adenocarcinoma (14). However, to the best of our
knowledge, the mechanism by which SEMA5A serves these roles is
still unknown.
Semaphorins are a large protein family, which is
divided into eight classes based on structural features and the
distribution among different phyla (15). The sema domain is the distinctive
structural and functional element of semaphorins (16) and is present as a single copy
located at the N-terminus of semaphorins. It is crucial for
signaling (17). Semaphorins were
first identified as axon guidance molecules in the nervous system,
participating in neuron growth and helping to determine neuronal
polarity (18). Several studies
have revealed that semaphorins are also involved in the immune
system (19,20), the cardiovascular system (21), the musculoskeletal system (22) and tumor progression (23). For example, SEMA4D has been
characterized as a pro-tumorigenic factor, inducing tumor
angiogenesis in head and neck cancer cells (24). SEMA3B has been identified as
a tumor suppressor gene, which inhibits lung cancer cell
proliferation and induces apoptosis (25). SEMA6A has been demonstrated to
regulate lung cancer cell apoptosis through its extracellular sema
domain that attenuates intracellular signaling (26). Several studies have reported that
SEMA5A can inhibit cancer cell proliferation by various mechanisms,
such as the inhibition of human glioma cell motility (27), the suppression of pancreatic tumor
burden (28) and the maintenance of
an epithelial phenotype in malignant pancreatic cancer cells
(29). However, whether SEMA5A
employs similar mechanisms in lung adenocarcinoma requires further
investigation.
The present study explored the roles of different
domains of SEMA5A in its tumor-suppressive effects in lung
adenocarcinoma cell lines using several in vitro assays and
revealed that different SEMA5A domains have different functions in
regulating tumor cell proliferation.
Materials and methods
Cell culture and treatments
A549 and H1299 lung carcinoma cell lines
(Bioresource Collection and Research Center, Food Industry Research
and Development Institute, Hsinchu, Taiwan) were cultured in
RPMI-1640 medium (Gibco; Thermo Fisher Scientific, Inc.)
supplemented with 10% FBS (MilliporeSigma) and 1%
penicillin-streptomycin (Gibco; Thermo Fisher Scientific, Inc.).
The cell lines were incubated at 37°C in a humidified atmosphere
with 5% CO2.
Cell line authentication
Cell experiments were performed on cells that were
passaged <20 times and were routinely tested for mycoplasma
using a PCR Mycoplasma Detection Kit (Applied Biological Materials,
Inc.) according to the manufacturer's protocol. The cell lines were
authenticated by short-tandem repeat analysis (Mission Biotech
Inc.).
Plasmid construction
To overexpress the various SEMA5A domains, different
plasmids were constructed by the BioMed Resource Core of the 1st
Core Facility Lab, National Taiwan University College of Medicine
(Taipei, Taiwan). The constructs of 5A-Full, 5A-ECD
and 5A-ICD were individually inserted into a pN1 vector,
which was modified from the pEGFP-N1 vector (National Taiwan
University College of Medicine, Taipei, Taiwan).
pN1-6×His/5A-Full/FLAG/Kan was constructed to overexpress
SEMA5A full length with a His-tag at the N-terminus and a Flag-tag
at the C-terminus. pN1-18×His/5A-ECD/Kan was constructed to
overexpress the extracellular domain with a His-tag at the
N-terminus. pN1-5A-ICD/18×His/Kan was constructed to
overexpress the intracellular domain with a His-tag at the
C-terminus. A schematic graph of constructs of SEMA5A Full, ECD and
ICD is shown in Fig. S1.
Transfection
The A549 and H1299 cells were transfected with
different SEMA5A-expressing plasmids
[pN1-6×His/5A-Full/FLAG/Kan (7,225 bp; 200 ng/µl),
pN1-18×His/5A-ECD/Kan (6,919 bp; 200 ng/µl) and
pN1-5A-ICD/18×His/Kan (4,336 bp; 200 ng/µl)] and control
plasmid (pN1 vector; 3,957 bp; 200 ng/µl) using jetPRIME
transfection reagent (Polyplus-transfection SA) for 10 min at room
temperature according to the manufacturer's protocol. The A549 and
H1299 cells were seeded in a 6-cm dish (2.5×10⁵
cells/well) and incubated at 37°C for 24 h before transfection.
Cells were transfected with different SEMA5A domain plasmids using
jetPRIME transfection reagent (Polyplus-transfection SA).
Transfection reagent was mixed with plasmids for 10 min at room
temperature, and then added into 6-cm dish along with cell culture
medium. Cells were then incubated at 37°C for 24 h for RNA
extraction or at 37°C for 48 h for protein extraction. Cells
transfected with SEMA5A full length, SEMA5A
extracellular domain and SEMA5A intracellular domain were
the SEMA5A full length (5A-Full), SEMA5A
extracellular domain (5A-ECD) and SEMA5A intracellular
domain (5A-ICD) groups, respectively.
RNA extraction and reverse
transcription-quantitative PCR (RT-qPCR) analysis
Total RNA was extracted from cultured A549 and H1299
cells using NucleoZOL reagent (Machery-Nagel GmbH) according to the
manufacturer's protocol. Total RNA (1 µg) was reverse transcribed
using a High-Capacity cDNA Reverse Transcription Kit (Applied
Biosystems; Thermo Fisher Scientific, Inc.). The temperature
protocol for reverse transcription was as follows: 25°C for 10 min,
37°C for 120 min and 85°C for 5 min, followed by 4°C forever.
Subsequently, 5% of each cDNA reaction was used as the template for
qPCR using OmicsGreen qPCR MasterMix (OmicsBio). The primers are
shown in Table I. RT-qPCR was
performed using a Step One Plus Real-Time PCR System (Thermo Fisher
Scientific, Inc.). The thermocycling conditions for qPCR were: 95°C
for 15 min, followed by 40 cycles of 95°C for 15 sec, 60°C for 20
sec and 72°C for 20 sec. The mRNA expression levels were normalized
using GAPDH, and relative mRNA levels were measured using
the 2−ΔΔCq method (30).
 | Table I.Primers used for reverse
transcription-quantitative PCR. |
Table I.
Primers used for reverse
transcription-quantitative PCR.
| Gene | Sequence
(5′-3′) |
|---|
| 5A-Full | F:
GTGCGTCTTCAACCTGAGCG |
|
| R:
CCTGGTCCACGGTGCCAC |
| 5A-ECD | F:
GTGCGTCTTCAACCTGAGCG |
|
| R:
CCTGGTCCACGGTGCCAC |
| 5A-ICD | F:
CCTGCCCCCCTTAATACCAGC |
|
| R:
CTTCCCAGTGAGATGTGGGTTG |
| JAK1 | F:
TCCAAGAACCTGAGTGTGGC |
|
| R:
CCTGCACCGGCTTTCATAGA |
| JAK2 | F:
CCTTTTTAGAGGGGAAATGAGGT |
|
| R:
ATGGTGTCTAAAGTGGAGTAGC |
| TYK2 | F:
CCATCATTCCGCACCATCCT |
|
| R:
GTTGGTCGGATCGTAGCAGT |
| STAT1 | F:
GGACCGCACCTTCAGTCTTT |
|
| R:
TCTCATTCACATCTCTCAACTTCAC |
| STAT2 | F:
TTCTGCCGGGACATTCAGGA |
|
| R:
TGGCTCTCCACAGGTGTTTC |
| IRF9 | F:
AGCTTGAGAGGGGCATCCTA |
|
| R:
GGCCCTGAAAGTACCTGACC |
| G1P2 | F:
GTGGACAAATGCGACGAACC |
|
| R:
GAAGGTCAGCCAGAACAG |
| G1P3 | F:
AATGCGGGTAAGGATGCAGG |
|
| R:
CCATTCAGGATCGCAGACCA |
| IFIT1 | F:
CTCTGCCTATCGCCTGGATG |
|
| R:
AGCTTCAGGGCAAGGAGAAC |
| IFITM1 | F:
CATGTCGTCTGGTCCCTGTT |
|
| R:
GTCACAGAGCCGAATACCAGT |
| IFITM2 | F:
TGAGAAAACGGAACTACTGGGG |
|
| R:
GAGCATCTCGTAGTTGGGAGG |
| IFITM3 | F:
TGCTGATCTTCCAGGCCTATG |
|
| R:
AGCGTGTGAGGATAAAGGGC |
| GAPDH | F:
AACGGGAAGCTTGTCATCAATGGAAA |
|
| R:
GCATCAGCAGAGGGGGCAGAG |
Protein extraction
Before lysis, A549 and H1299 cells were washed with
cold PBS (Bioman Scientific Co., Ltd.) and samples were harvested
with cell scrapers. RIPA lysis buffer (MilliporeSigma) with RNase
inhibitor and protease inhibitor cocktail (MilliporeSigma) was used
to lyse the cells. Total protein concentrations were detected using
Protein Assay Dye Reagent Concentrate (Bio-Rad Laboratories, Inc.).
Membrane protein extraction was conducted using a Mem-PER™ plus
membrane protein extraction kit (Thermo Fisher Scientific, Inc.)
according to the manufacturer's protocol. Proteins in the cell
culture medium were concentrated using a Nanosep centrifugal 10K
OMEGA™ filter (Pall Life Sciences) at 300 × g for 40 min at 4°C,
and BSA (1 ng/ml; Sigma-Aldrich; Merck KGaA) was added externally
to the cell culture medium as the spike-in control.
Western blotting
Proteins extracted from A549 and H1299 cells and
culture medium were prepared as aforementioned. Proteins (25 µg per
lane) were separated by 8 or 10% SDS-PAGE and transferred to PVDF
membranes (GE Healthcare). The membranes were blocked with the
undiluted Lightning Blocking Buffer (Enginelife Science Co., Ltd.)
for 10 min at room temperature and incubated with the following
primary antibodies overnight at 4°C: SEMA5A (dilution, 1:1,000;
cat. no. PAL924Hu01; Cloud-Clone Corp.), p-STAT1 (dilution,
1:1,000; cat. no. AP0109; ABclonal Biotech Co., Ltd.), STAT1
(dilution, 1:1,000; cat. no. 10144-2-AP; ProteinTech Group, Inc.),
p-STAT2 (dilution, 1:1,000; cat. no. AP0284; ABclonal Biotech Co.,
Ltd.), STAT2 (dilution, 1:1,000; cat. no. 72604; Cell Signaling
Technology, Inc.), p-JAK1 (dilution, 1:1,000; cat. no. AP0530;
ABclonal Biotech Co., Ltd.), JAK1 (dilution, 1:1,000; cat. no.
3332; Cell Signaling Technology, Inc.), p-JAK2 (dilution, 1:1,000;
cat. no. AP0531; ABclonal Biotech Co., Ltd.), JAK2 (dilution,
1:1,000; cat. no. 3230; Cell Signaling Technology, Inc.), IFIT1
(dilution, 1:1,000; cat. no. 14769; Cell Signaling Technology,
Inc.), G1P2 (ISG15) (dilution, 1:1,000; cat. no. 2758; Cell
Signaling Technology, Inc.), ACTB (dilution, 1:5,000; cat. no.
3700; Cell Signaling Technology, Inc.), caspase-3 (CASP3)
(dilution, 1:1,000; cat. no. 9662; Cell Signaling Technology,
Inc.), cleaved caspase-3 (dilution, 1:1,000; cat. no. 9661; Cell
Signaling Technology, Inc.) and GAPDH (dilution, 1:5,000; cat. no.
10494-1-AP; ProteinTech Group, Inc.). The secondary antibodies were
goat anti-rabbit IgG HRP (dilution, 1:10,000; cat. no. RA-BZ202;
Croyez Bioscience Co., Ltd.) and goat anti-mouse IgG(H+L) HRP
(dilution, 1:10,000; cat. no. RA-BZ102; Croyez Bioscience Co.,
Ltd.). After immunoblotting, the membranes were washed with
Tris-buffered saline with 0.1% Tween-20 and incubated with
horseradish peroxidase-conjugated goat anti-rabbit IgG (Croyez
Bioscience Co., Ltd.) or goat anti-mouse IgG (Croyez Bioscience
Co., Ltd.) for 1 h at room temperature. The blotted protein bands
were detected using LuminataTM Forte Western HRP Substrate in an
enhanced chemiluminescence system (MilliporeSigma) with the
BioSpectrum Imaging System (Analytik Jena AG). The intensities of
bands were analyzed using ImageJ 1.48v (National Institutes of
Health).
Cell proliferation assay
A549 and H1299 cells (3,000 cells/well) transfected
with plasmids containing different SEMA5A domains, including
5A-Full, 5A-ECD, 5A-ICD or empty control plasmid, were first seeded
in a 6-cm dish and transfected with different SEMA5A-expressing
plasmids for 24 h. Then, the transfected cells were seeded on
96-well plates at a density of 3,000 cells/well. After incubation
for 12 h, cell proliferation was measured using MTT (Bionovas
Biotechnology Co., Ltd.) assays at 0, 24, 48 and 72 h. A mixture of
10 µl MTT solution and 90 µl RPMI medium was added to each well and
incubated for 2 h. Dimethyl sulfoxide (99.8%; Sigma-Aldrich; Merck
KGaA) was used to dissolve the purple formazan. The absorbance was
measured at 570 nm. The cell growth ratio was expressed as the
relative absorbance compared with 0 h.
Gap closure assay
A549 and H1299 cells transfected with plasmids
containing different SEMA5A domains, including 5A-Full, 5A-ECD,
5A-ICD or empty control plasmid, were first seeded in a 6-cm dish
and transfected as aforementioned for 24 h. The transfected cells
were seeded in the Ibidi Culture-Insert (Ibidi GmbH) at a density
of 2.5×10⁴ cells/reservoir, serum-starved and incubated
at 37°C overnight. After incubation, the inserts were carefully
removed and the cell-free gap images were captured at 0, 12 and 24
h. Cell migration was measured by comparison with the cell-free
area at 0 h using a light microscope and quantified using ImageJ
1.48v software (National Institutes of Health).
Colony formation assay
A549 and H1299 cells transfected with plasmids
containing different SEMA5A domains, including 5A-Full, 5A-ECD,
5A-ICD or empty control plasmid, were seeded in a 6-cm dish and
transfected as aforementioned for 24 h, and then seeded in 6-well
plates at a density of 300 cells/well. After incubation at 37°C for
2 weeks, cells were fixed with 500 µl methanol-acetic acid
(Sigma-Aldrich; Merck KGaA) solution (3:1) for 10 min at room
temperature and stained with 0.1% crystal violet for another 10 min
at room temperature. Colonies containing >50 cells were counted
and quantified using ImageJ 1.48v software (National Institutes of
Health).
Flow cytometry analysis of cell cycle
distribution and apoptosis
To analyze cell cycle phases and cell death, A549
and H1299 cells transfected with plasmids containing different
SEMA5A domains, including 5A-Full, 5A-ECD, 5A-ICD or empty control
plasmid, in the medium were harvested along with the detached
cultured cells. Cell lysis buffer (0.5% Triton X-100, 0.2 µg/ml
Na2EDTA•2H2O, 1% BSA in PBS) was used to lyse
cells, and cells were fixed with cold 100% methanol at −20°C
overnight. After washing with PBS, cells were stained with PI
(Thermo Fisher Scientific, Inc.) solution (20 µg PI/ml; 0.1 mg
RNase/ml in PBS) for 10 min on ice. The suspension was analyzed on
a Beckman Coulter FC500 instrument (Beckman Coulter, Inc.) using
CXP Analysis Software v2.3 (Beckman Coulter, Inc.).
Illumina microarray analysis
The levels of mRNA corresponding to the different
SEMA5A constructs in A549 cells were detected and analyzed as
aforementioned. Total RNA was extracted from cultured cells using
NucleoZOL reagent (Machery-Nagel GmbH) according to the
manufacturer's protocol. Total RNA was primed with T7 Oligo(dT) and
amplified using an Illumina TotalPre RNA Amplification Kit (Ambion;
Thermo Fisher Scientific, Inc.). Following the first strand cDNA
synthesis, DNA polymerase and RNAase H were used to simultaneously
degrade the RNA and synthesize the second strand cDNA. The
double-stranded cDNA then underwent a clean-up process, and in
vitro transcription was conducted to synthesize multiple copies
of biotinylated complementary RNA (cRNA). After amplification, the
cRNA was hybridized to Illumina Human HT-12 v4 BeadChips (GSGX
Version 1.9.0; part number, 15002873; serial number, 200769980010;
Illumina, Inc.) at 58°C for 16 h. After hybridization, the BeadChip
was washed and stained with streptavidin-Cy3 dye. The intensity of
the bead's fluorescence was detected using a HiScan SQ instrument
(Illumina, Inc.), and the results were analyzed using BeadStudio
v2011.1 software (Illumina, Inc.). After scanning, the intensity
data of Illumina Human HT-12 v4 BeadChips were analyzed using the
software Partek v7.0 (Partek, Inc.), and background-adjusted
signals were normalized by a quantile normalization algorithm.
Unpaired Student's t-tests were utilized to identify differentially
expressed genes (DEGs; Tables SI
and SII). The filtering criteria
were set at a fold change ≥1.5 or ≤0.67 and P<0.05 compared with
the empty control. Principal component analysis was utilized to
evaluate the similarity of the gene expression profiles.
Hierarchical clustering analysis and the Genesis 1.7.7 program
(31) were used to generate a
visual representation of the expression profiles. Furthermore,
Ingenuity Pathway Analysis (Ingenuity Systems; Qiagen, Inc.) was
applied to identify gene-gene interaction networks, biological
functions and canonical pathways of DEGs. The datasets generated
during the current study are available in the Gene Expression
Omnibus repository (https://www.ncbi.nlm.nih.gov/geo/query/acc.cgi?acc=GSE157062).
Statistical analysis
Statistical analyses were performed using GraphPad
Prism 8 (GraphPad Software, Inc.). Data are presented as the mean ±
SD of at least three independent experiments. Statistical
significance was analyzed by unpaired Student's t-test, one-way
ANOVA test and Bonferroni post hoc test or two-way ANOVA test and
Bonferroni post hoc test and expressed as a P-value. P<0.05 was
considered to indicate a statistically significant difference.
Fisher's Exact test was utilized to identify canonical pathways
that differentially expressed genes were involved in. The
significance of pathways was determined according to Ingenuity's
default threshold (−log(P-value)>1.3).
Results
5A-Full and 5A-ECD suppress the
proliferation and migration of lung adenocarcinoma cells
In previous studies, SEMA5A has been identified as a
biomarker, and to suppress the proliferation and migration of lung
adenocarcinoma cells (13,14). The present study first examined the
effects of different SEMA5A domains on the progression of lung
adenocarcinoma in A549 and H1299 cells. Total RNA was extracted at
24 h after the transfection of plasmids encoding different SEMA5A
constructs, including 5A-Full, 5A-ECD and 5A-ICD. After successful
overexpression of these constructs as demonstrated by RT-qPCR
(Fig. 1A and B), in vitro
functional assays were performed in both A549 and H1299 cells. The
results demonstrated that 5A-Full and 5A-ECD, but not 5A-ICD,
significantly (P<0.05) inhibited cell proliferation in MTT
assays (Fig. 1C and D) and cell
migration at 24 h in gap closure assays (Fig. 1E-H) compared with empty control in
both A549 and H1299 cells. Additionally, the 5A-ECD construct
significantly (P<0.05) decreased the colony formation of A549
cells, and the two constructs significantly (P<0.05) decreased
the colony formation of H1299 cells (Fig. 1I-L). However, the results of flow
cytometry revealed no significant difference in the effect of
different SEMA5A domains on the cell cycle distribution and
apoptosis, and no significant alterations of cleaved caspase-3 were
observed in A549 and H1299 cells overexpressing different SEMA5A
domains (Fig. S2). These results
supported the proposed tumor-suppressive role of 5A-Full in lung
adenocarcinoma cells and also revealed that the extracellular
domain of SEMA5A contributed to the tumor-suppressive role.
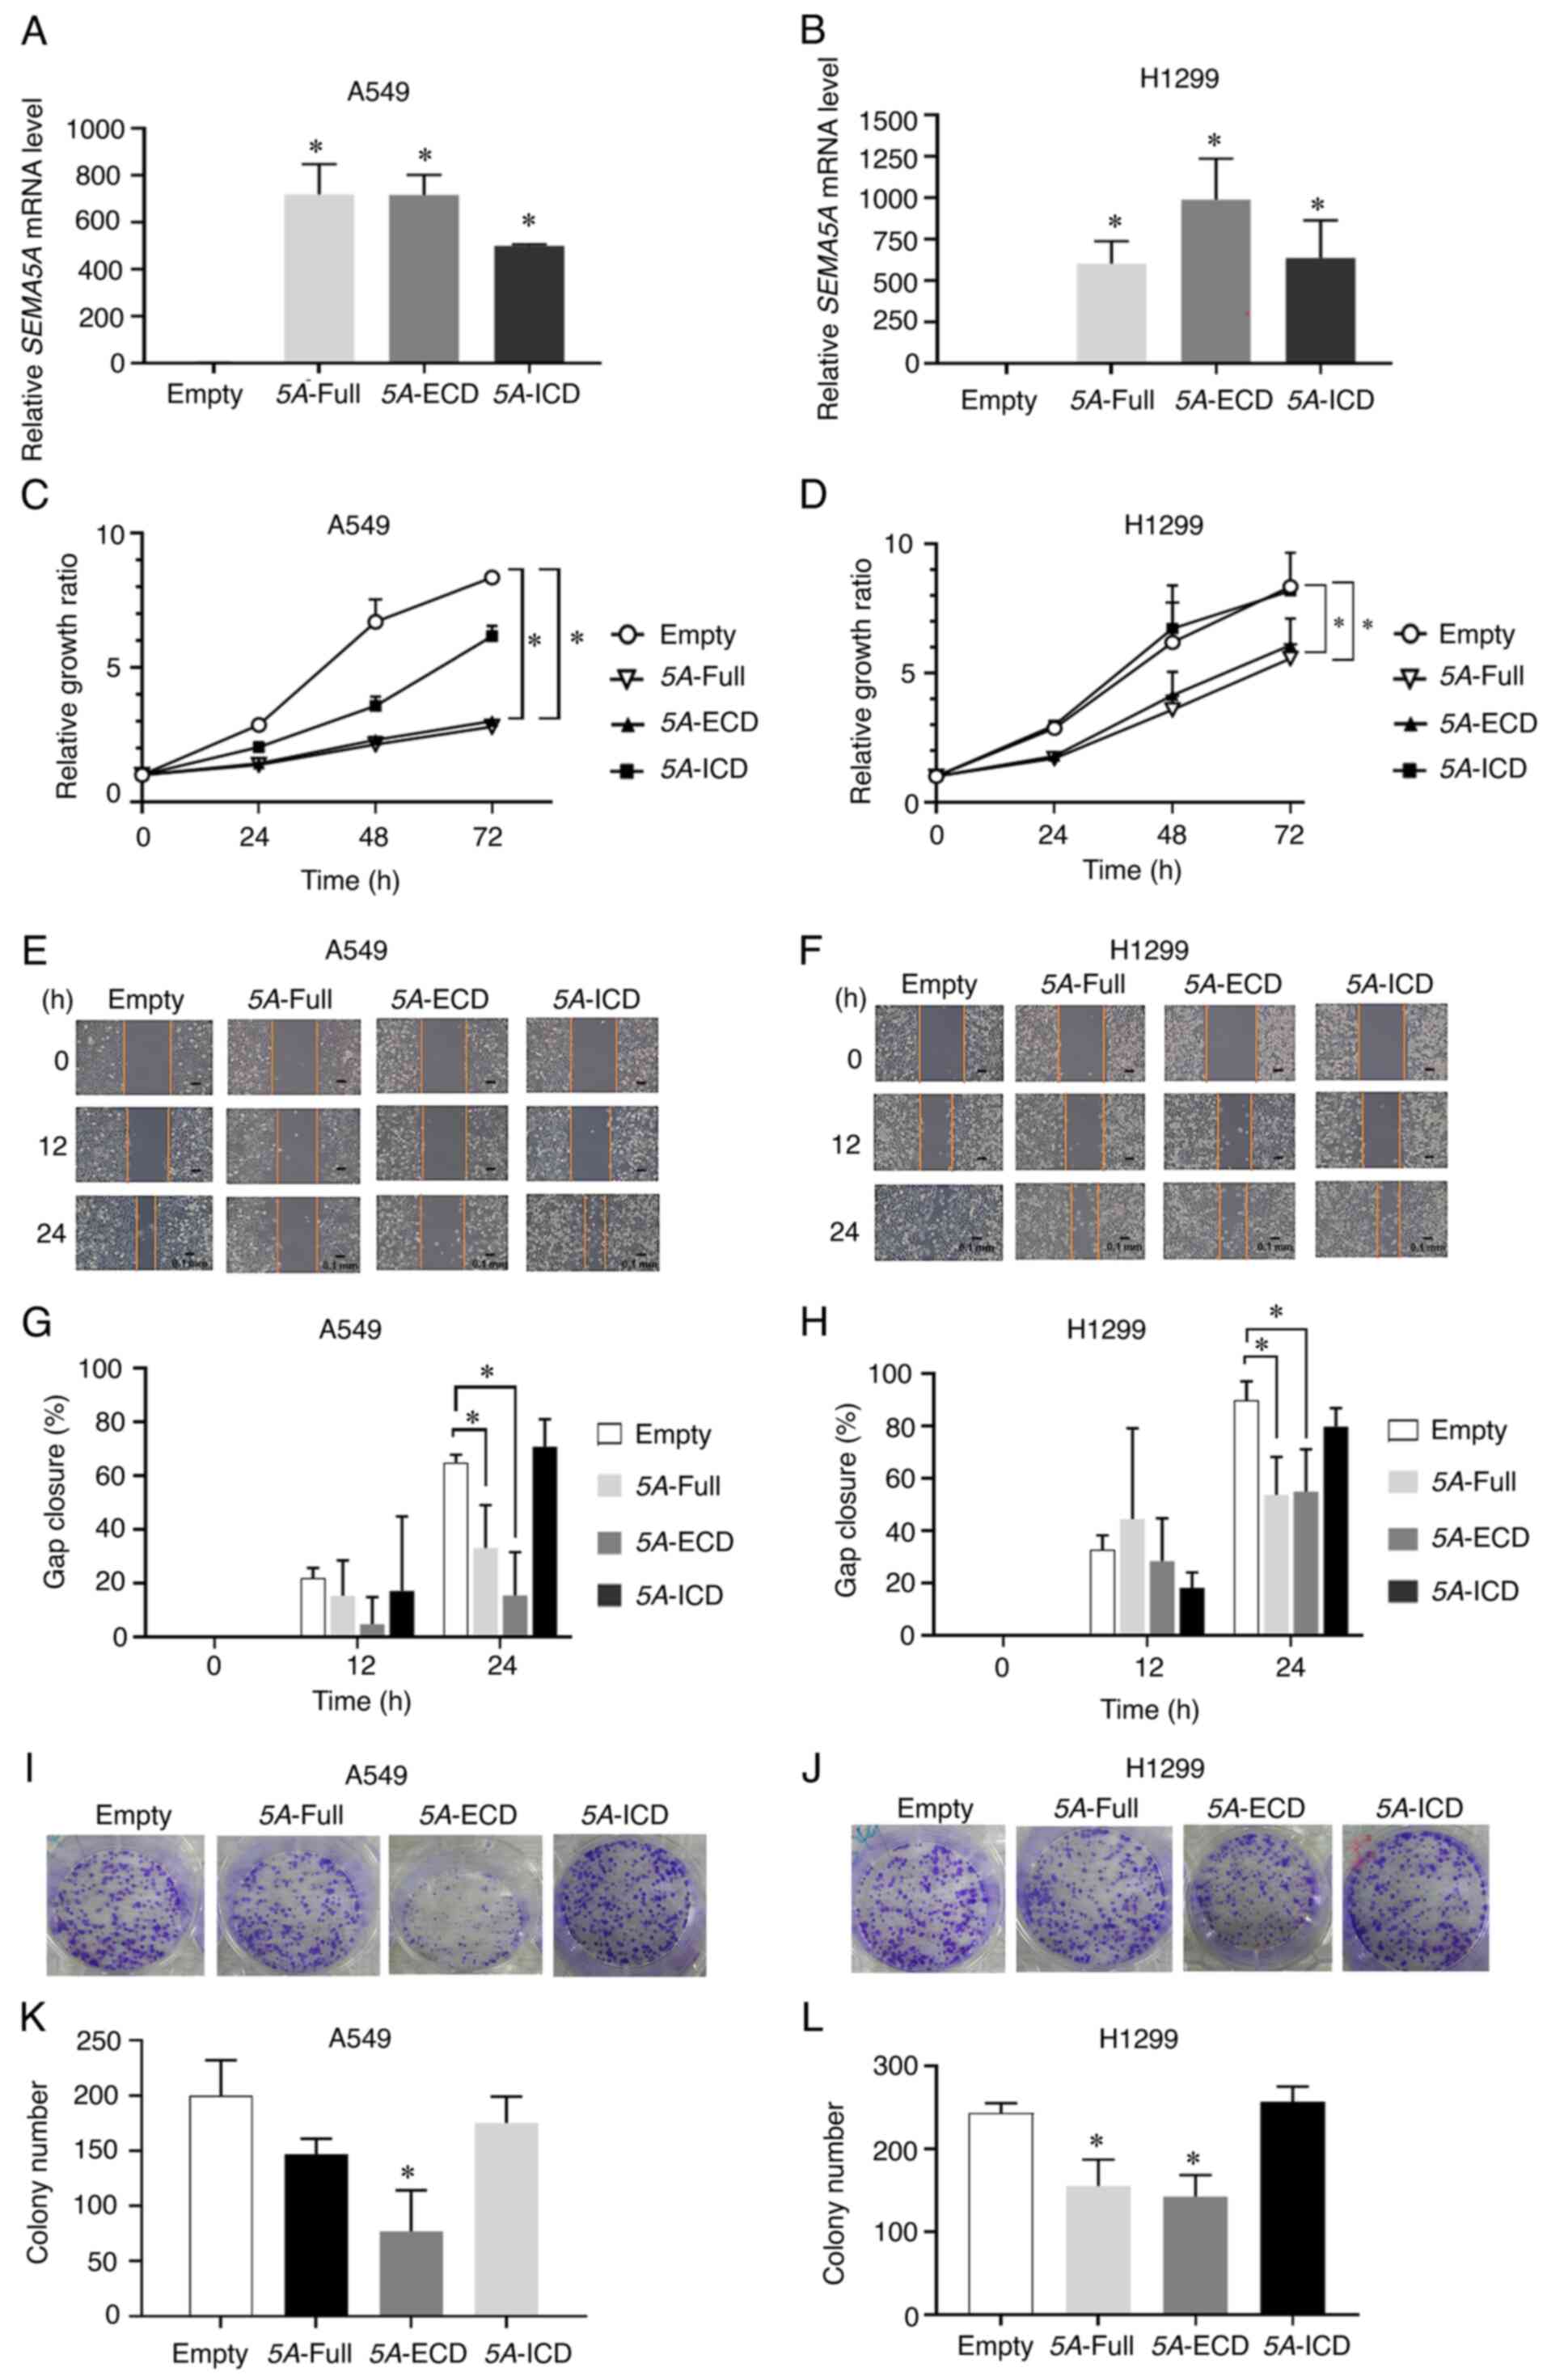 | Figure 1.5A-Full and 5A-ECD suppress the
proliferation and migration of lung adenocarcinoma cells. A549 and
H1299 lung adenocarcinoma cells were transfected with plasmids
containing different SEMA5A domains, including 5A-Full, 5A-ECD,
5A-ICD and empty control plasmid. Relative expression levels of
SEMA5A in (A) A549 and (B) H1299 lung adenocarcinoma cells
overexpressing different SEMA5A domains examined by reverse
transcription-quantitative PCR. GAPDH was used as the
internal control. Proliferation of (C) A549 and (D) H1299 cells
expressing different domains of SEMA5A assessed using MTT assays.
(E and F) Gap closure assays. Representative images were captured
at 0, 12 and 24 h for (E) A549 and (F) H1299 cells. Scale bar, 0.1
mm. Quantification of relative gap closure of (G) A549 and (H)
H1299 cells. The percentage of wound closure was compared with the
wound area at 0 h. (I and J) Colony formation assays.
Representative images were captured for (I) A549 and (J) H1299
cells. (K and L) Quantification of colony counts of colony
formation assays of (K) A549 and (L) H1299 cells. Experiments were
repeated in triplicate, and the results are presented as the mean ±
SD. Two-way ANOVA and Bonferroni post hoc test were performed for
(C and D); one-way ANOVA and Bonferroni post hoc test were
performed for (A, B, G, H, K and L). *P<0.05 vs. Empty. 5A-ECD,
SEMA5A extracellular domain; 5A-Full, SEMA5A full length; 5A-ICD,
SEMA5A intracellular domain; SEMA5A, semaphorin 5A. |
Identification of genes regulated by
SEMA5A domains in A549 cells by microarray analysis
To further investigate the functional roles of
different SEMA5A domains, the gene expression profiles of A549
cells overexpressing different SEMA5A domains were examined using
Illumina Human HT-12 v4 BeadChips. To select the differential gene
expression, the filtering criteria were set at a fold change ≥1.5
or ≤0.67 and P<0.05 compared with the empty control. Principal
component analysis was used to examine the reproducibility among
samples. As shown in Fig. 2A, where
each dot represents one sample, and the different colors represent
different groups, the groups expressing different SEMA5A domains
were separated clearly from the empty control group and from each
other; however, the samples within each group were clustered
together. This indicated high reproducibility within the same group
and different expression profiling across groups.
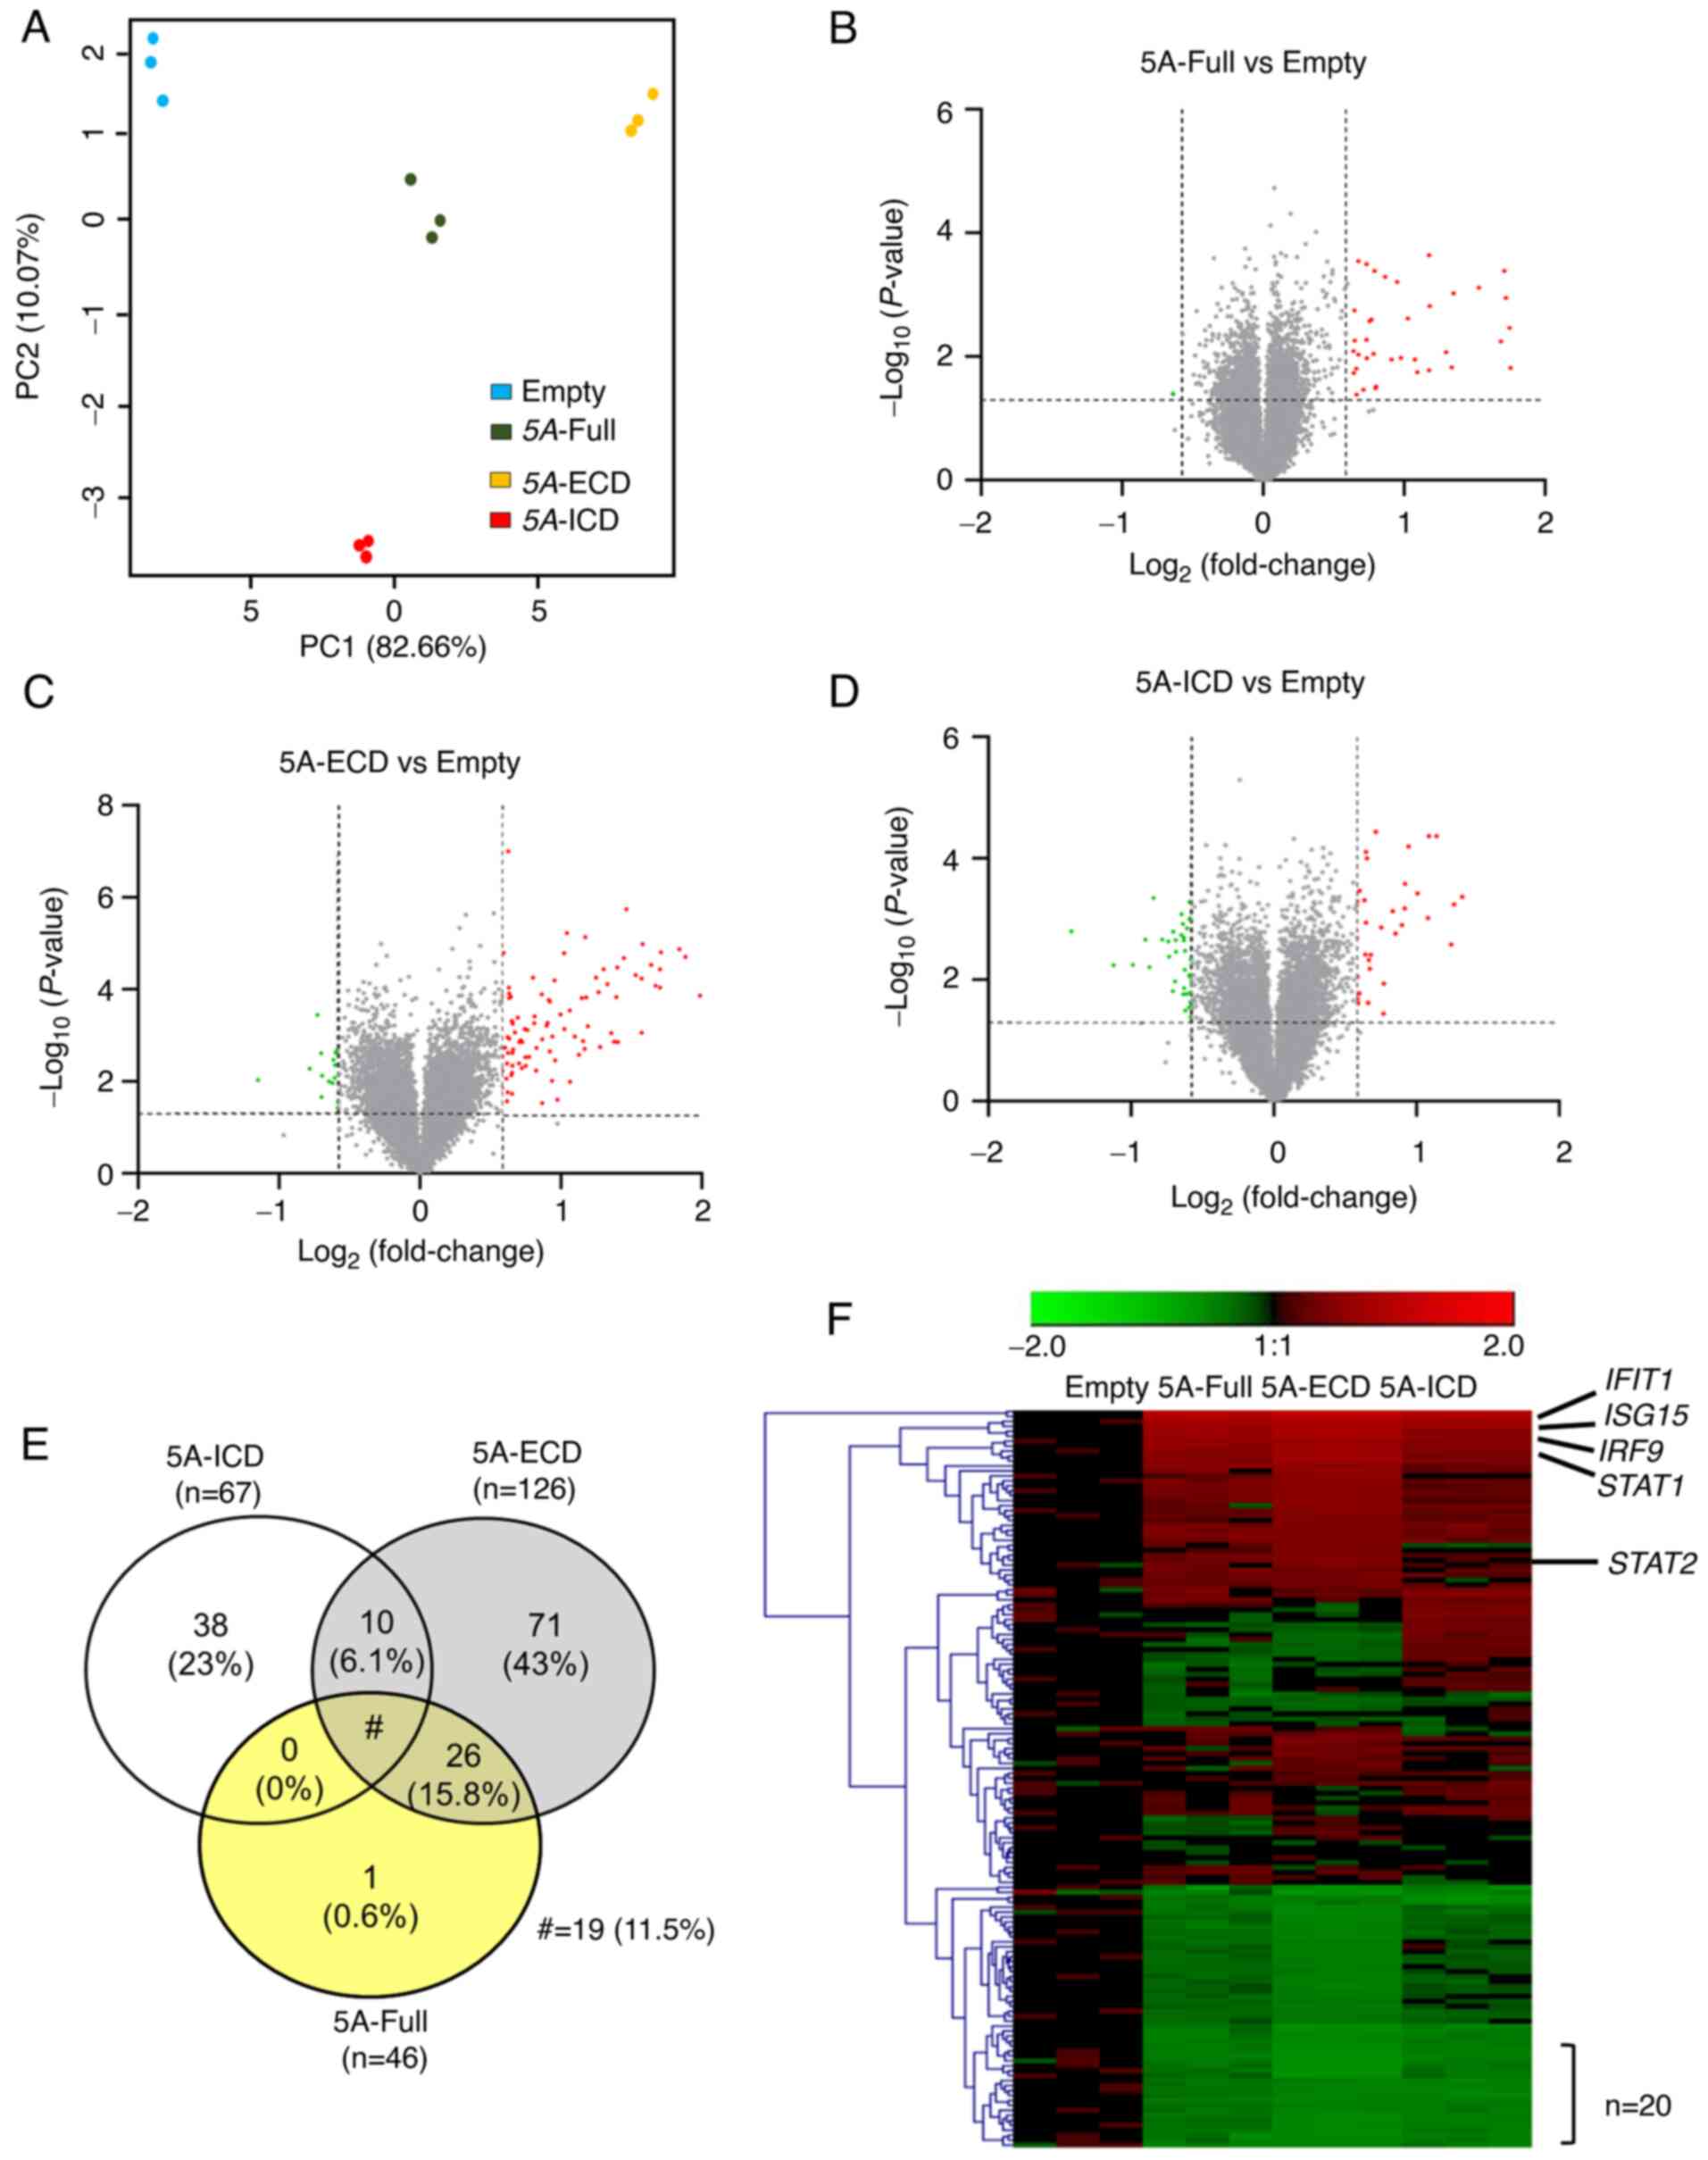 | Figure 2.Identification of genes regulated by
SEMA5A domains in A549 cells by microarray analysis. (A) Principal
component analysis of A549 cells overexpressing different SEMA5A
domains. Principal components were plotted using expression of
differentially expressed probes after quantile normalization. Each
dot represents one sample. (B-D) Volcano plots of DEGs in A549
cells overexpressing (B) 5A-Full, (C) 5A-ECD or (D) 5A-ICD. Dashed
lines show the thresholds of fold change (≥1.5 or ≤0.67) and
P-value (<0.05). Red, upregulated genes; green, downregulated
genes. (E) Venn diagram of DEGs in cells expressing different
SEMA5A domains. (F) Heatmap and hierarchical cluster analysis of
DEGs regulated by different SEMA5A domains. Each column represents
one sample and each row represents one gene. Red, upregulated
genes; green, downregulated genes. The black lines indicated
representative genes involved in interferon signaling pathways.
Unpaired Student's t-tests were utilized to identify DEGs. 5A-ECD,
SEMA5A extracellular domain; 5A-Full, SEMA5A full length; 5A-ICD,
SEMA5A intracellular domain; DEGs, differentially expressed genes;
PC, principal component; SEMA5A, semaphorin 5A. |
A total of 165 DEGs were identified when comparing
any 5A group with the empty group, including 46 DEGs in the 5A-Full
group, 126 in the 5A-ECD group and 67 in the 5A-ICD group (Fig. 2B-D). Among these genes, 19 DEGs were
common to all the groups expressing different SEMA5A domains, and
there were 38 unique DEGs for the 5A-ICD group and 71 for the
5A-ECD group (Fig. 2E). The DEGs in
the 5A-Full group were almost identical to those in the 5A-ECD
group, except nucleolar protein with MIF4G domain 1 (Fig. 2E). The common gene list is shown in
Table SII. All 165 DEGs were
hierarchically clustered and shown in a heatmap (Fig. 2F). In general, the expression
profiling of genes in the 5A-Full group was more similar to that of
the 5A-ECD group than that of the 5A-ICD group.
Next, to analyze which pathways the DEGs were
involved in, Ingenuity Pathway Analysis was used to analyze the
functions of DEGs in the different SEMA5A groups. The top four
canonical pathways that the different SEMA5A domains were involved
in were ‘Interferon Signaling’, ‘Activation of IRF by Cytosolic
Pattern Recognition Receptor’, ‘Systemic Lupus Erythematosus in B
cell Signaling Pathway’ and ‘Role of PKR in Interferon Induction
and Antiviral Response’ (Fig. 3A, C and
E). The corresponding molecular and cellular functions that
different SEMA5A domains were possibly involved in included ‘Cell
Signaling’, ‘Gene Expression’, ‘Cellular Development’, ‘Cellular
Movement’, ‘Cellular Growth and Proliferation’, ‘Cell-To-Cell
Signaling and Interaction’ and ‘Cell Death and Survival’ (Fig. 3B, D and F).
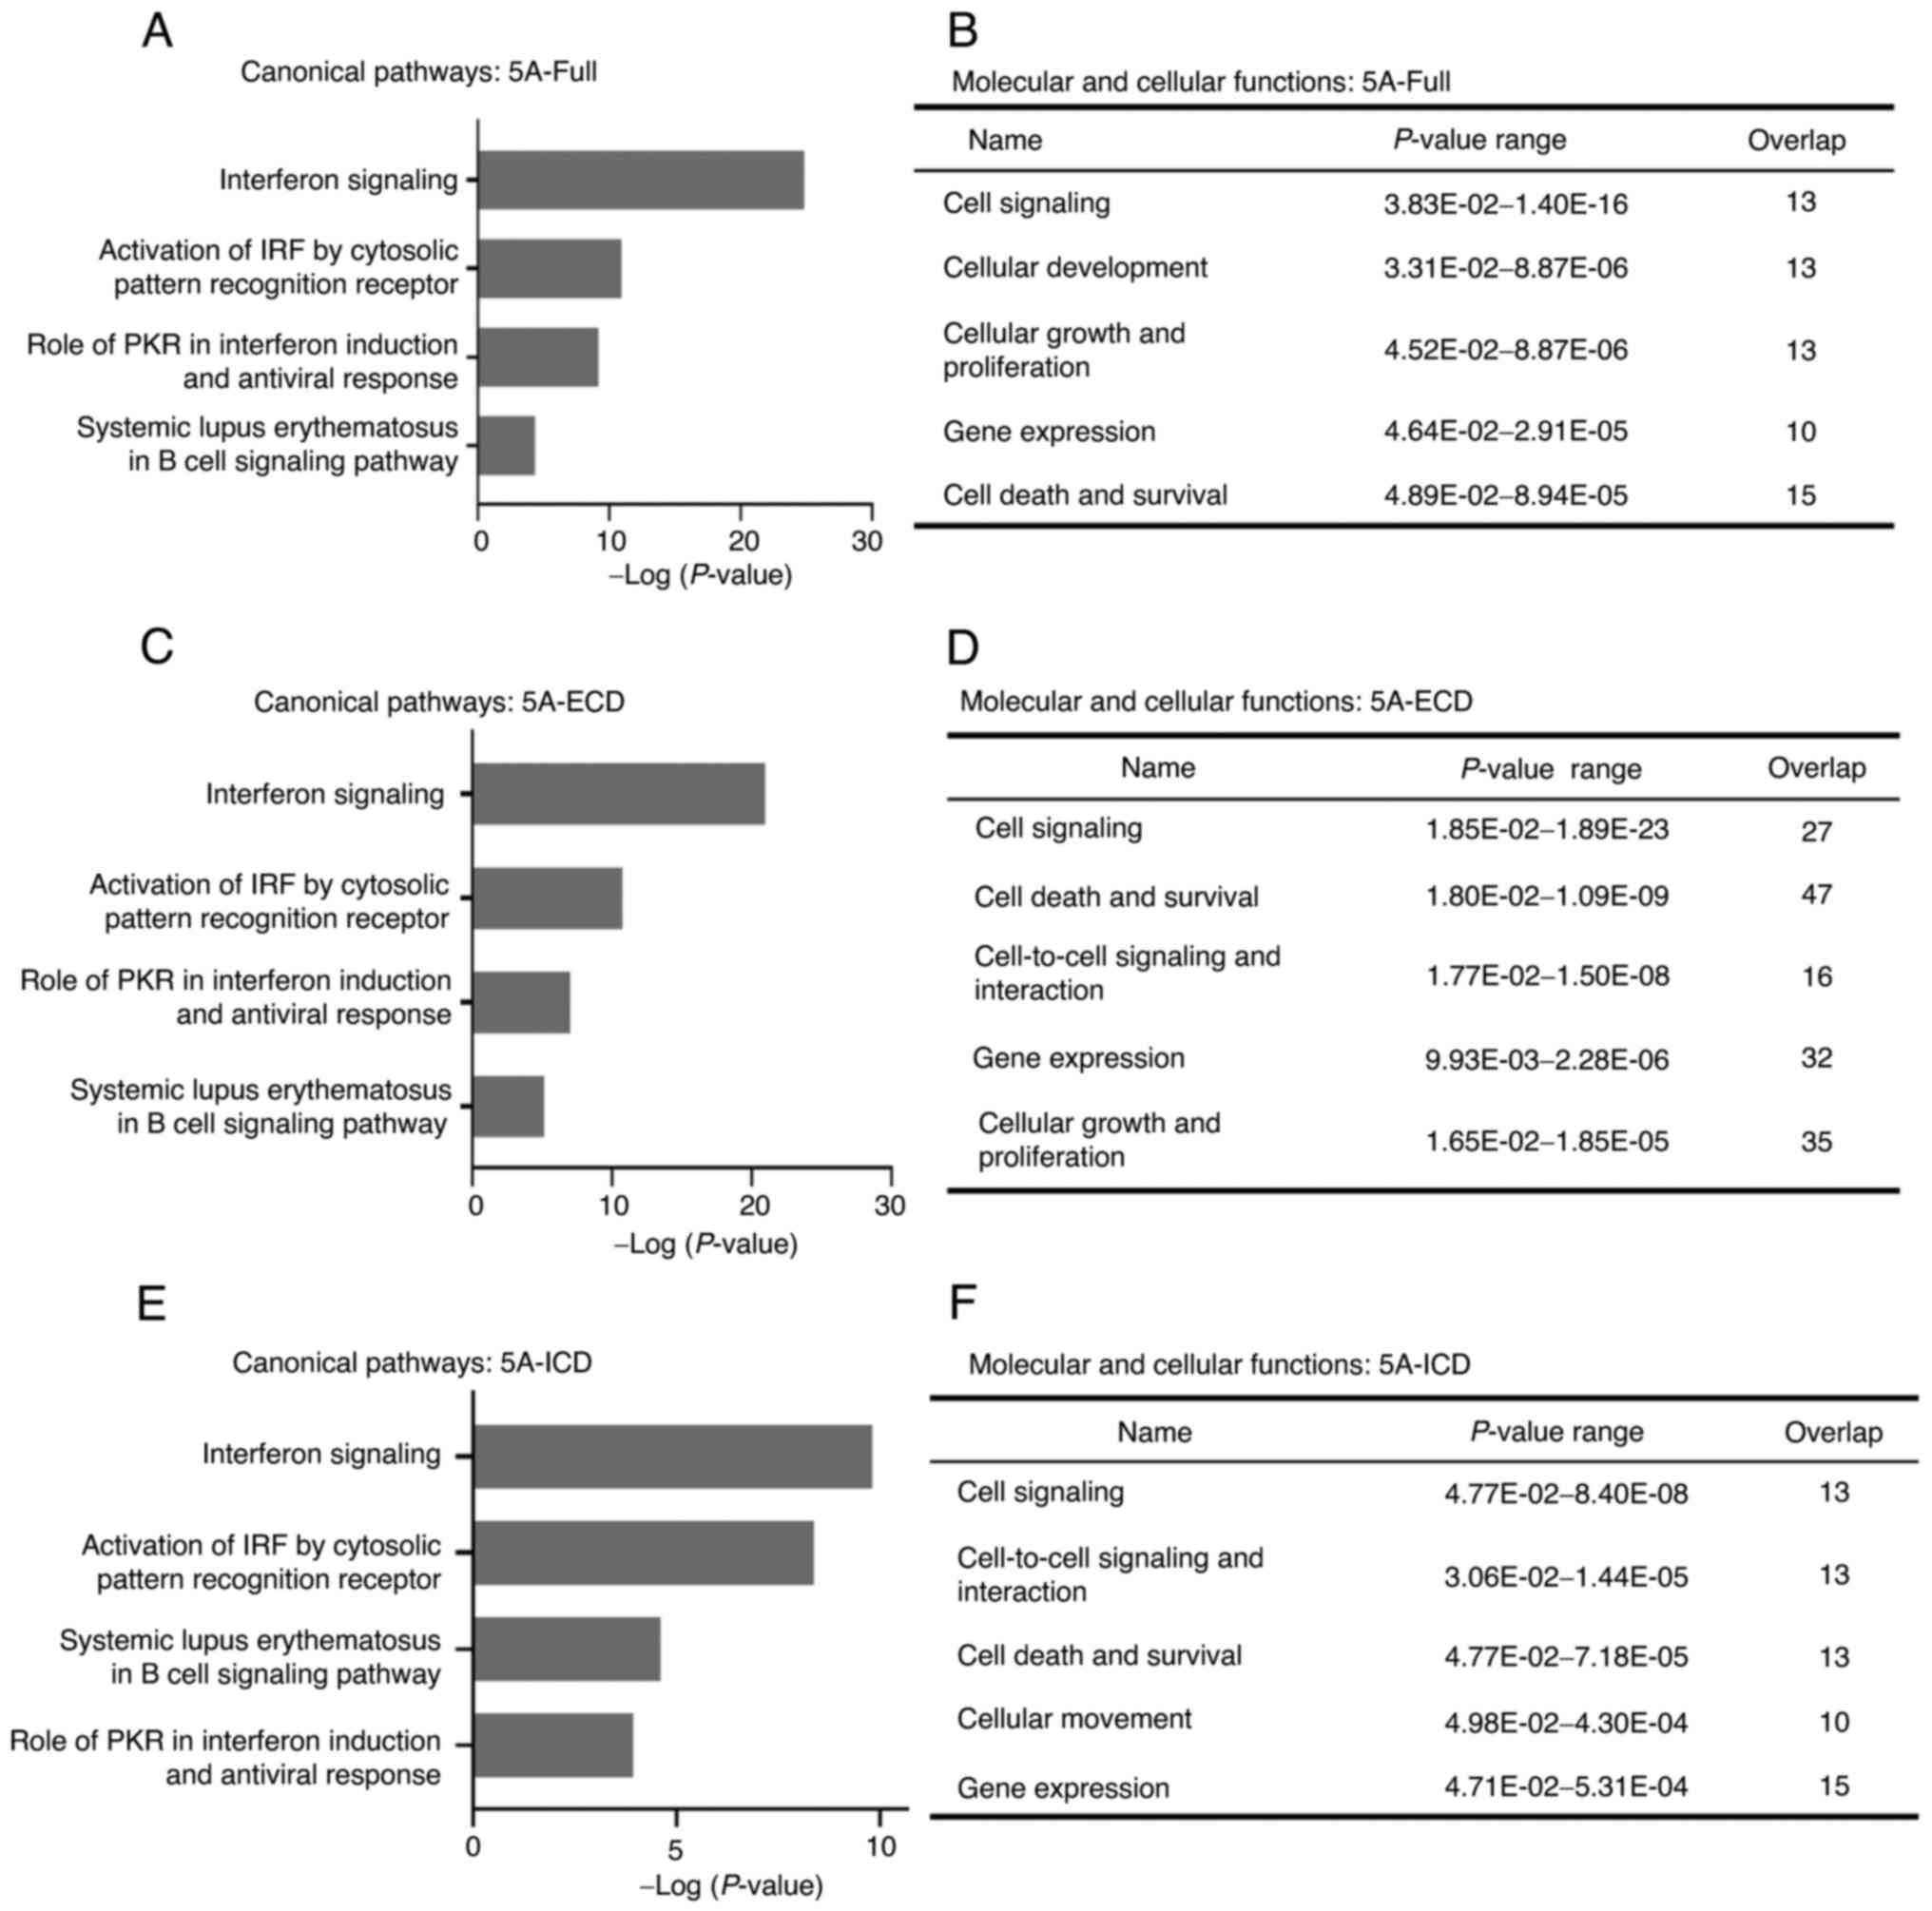 | Figure 3.Ingenuity Pathway Analysis of DEGs
regulated by different SEMA5A domains. (A, C and E) Top four
canonical pathways of DEGs in A549 cells overexpressing (A)
5A-Full, (C) 5A-ECD or (E) 5A-ICD. The significance of pathways was
determined according to Ingenuity's default threshold
(−log(P-value) >1.3). Fisher's Exact test was utilized to
identify canonical pathways that DEGs were enriched(B, D and F)
Molecular and cellular functions of DEGs in A549 cells
overexpressing (B) 5A-Full, (D) 5A-ECD or (F) 5A-ICD. 5A-ECD,
SEMA5A extracellular domain; 5A-Full, SEMA5A full length; 5A-ICD,
SEMA5A intracellular domain; DEGs, differentially expressed genes;
IRF, interferon regulatory factor; PKR, protein kinase R; SEMA5A,
semaphorin 5A. |
Expression levels of tumor suppressor
genes in the interferon signaling pathway are upregulated by
different SEMA5A domains
Since the DEGs were most likely involved in the
interferon signaling pathway, relative expression levels of
selected differentially expressed genes were compiled in Tables II and SIII. Selected genes in the interferon
signaling pathways are also shown in Fig. 2F. The present study further
investigated the DEGs in this pathway and validated their
expression by RT-qPCR. Fig. 4A-C
shows the schematic representation of the interferon signaling
network from the Ingenuity Pathways Analysis canonical pathway. The
DEGs in the 5A-Full group were similar to those in 5A-ECD group. In
contrast to 5A-Full and 5A-ECD, overexpression of 5A-ICD did not
affect STAT2 or a number of the nuclear elements of the interferon
signaling pathway (e.g., STAT1 and IFIT3).
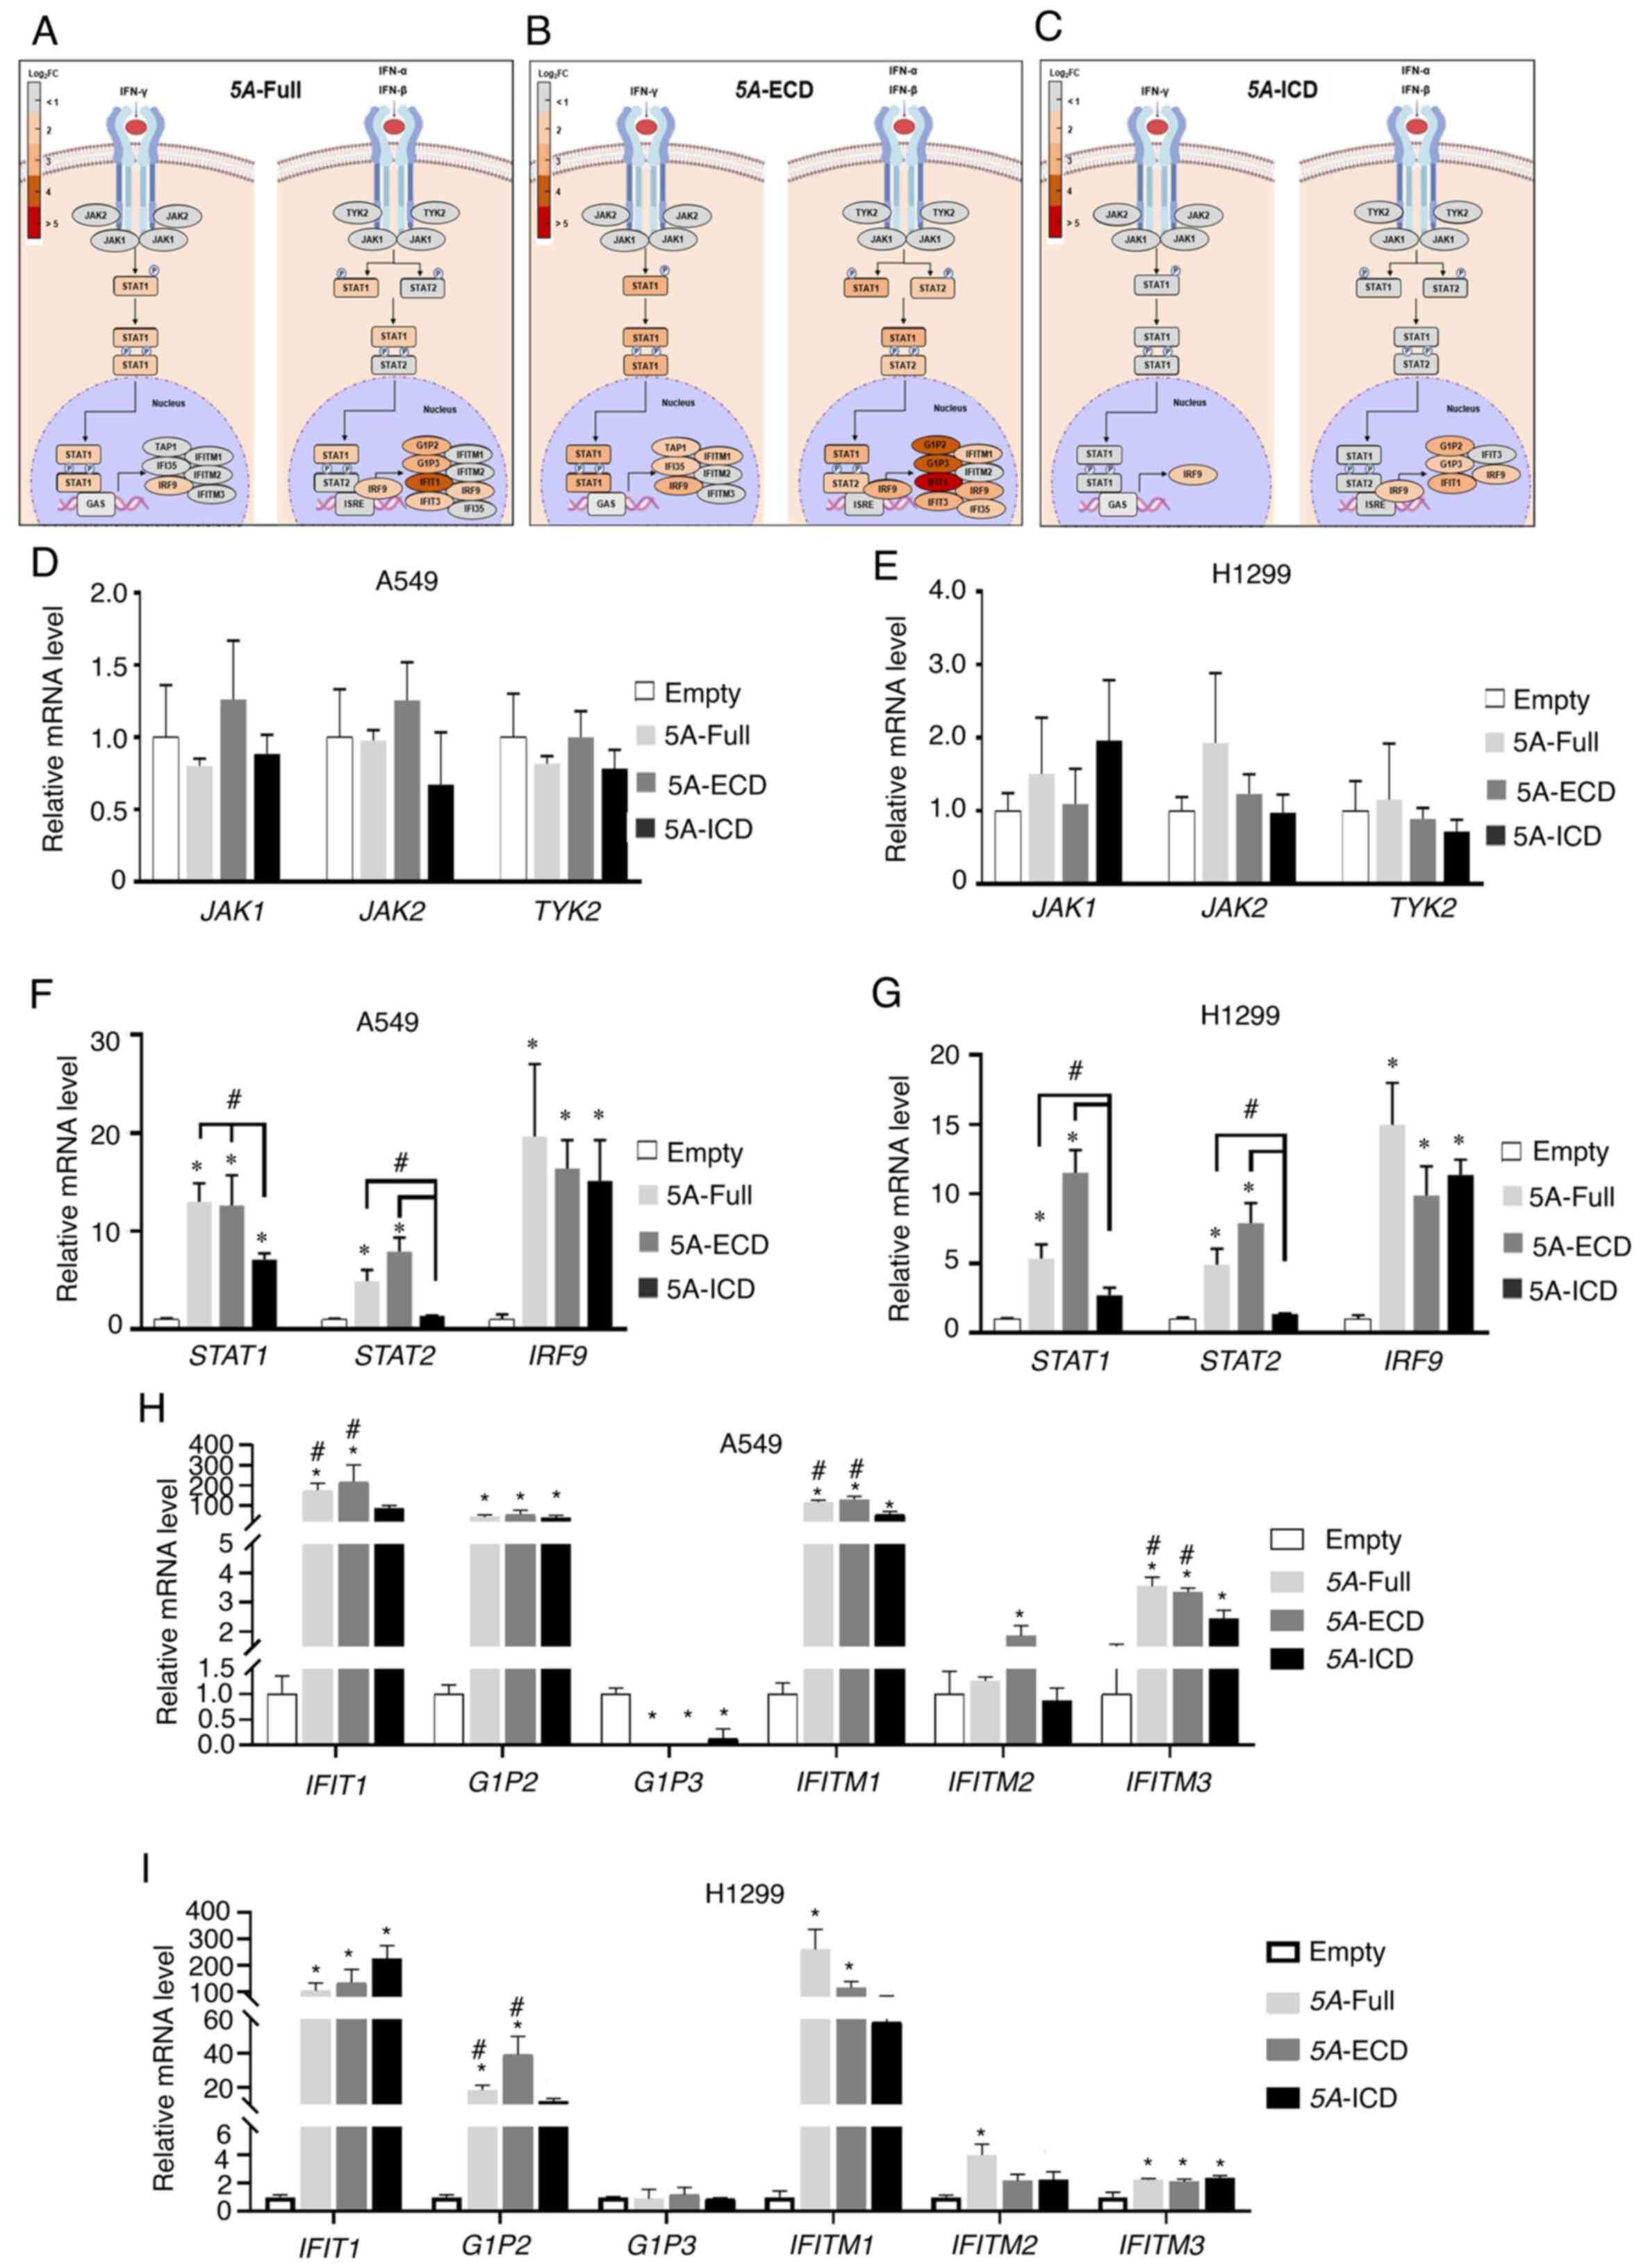 | Figure 4.Expression levels of tumor suppressor
genes in the interferon signaling pathway are upregulated by
different SEMA5A domains. (A) Schematic depiction of the canonical
pathway of interferon signaling, colored according to gene
expression in the presence of 5A-Full. The darkness of red color
indicates the fold change of each gene. (B) Schematic depiction of
the canonical pathway of interferon signaling, colored according to
gene expression in the presence of 5A-ECD. (C) Schematic depiction
of the canonical pathway of interferon signaling, colored according
to gene expression in the presence of 5A-ICD. (D) Relative
expression levels of JAK1, JAK2 and TYK2 examined by
RT-qPCR in A549 cells overexpressing different SEMA5A domains. (E)
Relative expression levels of JAK1, JAK2 and TYK2
examined by RT-qPCR in H1299 cells overexpressing different SEMA5A
domains. (F) Relative expression levels of STAT1, STAT2 and
IRF9 in A549 cells overexpressing different SEMA5A domains.
(G) Relative expression levels of STAT1, STAT2 and
IRF9 in H1299 cells overexpressing different SEMA5A domains.
(H) Relative expression levels of IFIT1, G1P2, G1P3, IFITM1,
IFITM2 and IFITM3 in A549 cells overexpressing different
SEMA5A domains. (I) Relative expression levels of IFIT1, G1P2,
G1P3, IFITM1, IFITM2 and IFITM3 in H1299 cells
overexpressing different SEMA5A domains. GAPDH: internal
control. Experiments were repeated in triplicate, and the results
are presented as the mean ± SD. One-way ANOVA and Bonferroni post
hoc test were performed. *P<0.05 vs. empty control.
#P<0.05 vs. 5A-ICD. 5A-ECD, SEMA5A extracellular
domain; 5A-Full, SEMA5A full length; 5A-ICD, SEMA5A intracellular
domain; G1P, glycogenin 1 pseudogene; IFIT1, interferon induced
protein with tetratricopeptide repeats 1; IFITM, interferon induced
transmembrane protein; IRF9, interferon regulatory factor 9; JAK,
Janus kinase; Log2FC, log2 fold change;
RT-qPCR, reverse transcription-quantitative PCR; SEMA5A, semaphorin
5A; TYK2, tyrosine kinase 2. |
To validate the expression levels of DEGs regulated
by different SEMA5A domains in the interferon signaling pathway,
RT-qPCR was performed to examine mRNA levels focusing on tumor
suppressor genes identified in previous reports (32–39).
The expression levels of interferon receptor-associated genes, such
as Janus kinase 1 (JAK1), Janus kinase 2 (JAK2) and
tyrosine kinase 2, were not significantly different in the various
SEMA5A-expressing cells compared with the empty controls (Fig. 4D and E).
Overexpression of 5A-Full and 5A-ECD
increases the amount of phosphorylated STAT1 in A549 cells
STAT1 and STAT2 have been previously identified to
form heterodimers along with the DNA binding protein interferon
regulatory factor 9 (IRF9) (40),
and the transcription levels of these three proteins were
significantly increased in A549 and H1299 cells overexpressing
5A-Full and 5A-ECD compared with the empty control cells (Fig. 4F and G). In addition, the expression
levels of STAT1 and STAT2 were significantly
different between cells expressing 5A-Full and 5A-ECD and cells
expressing 5A-ICD (Fig. 4F and
G).
Regarding STAT1/2 downstream genes, the expression
levels of tumor suppressor genes interferon induced protein with
tetratricopeptide repeats 1 (IFIT1) and glycogenin 1
pseudogene (G1P2) in A549 and H1299 cells overexpressing
5A-Full and 5A-ECD were significantly increased compared with the
empty control group (Fig. 4H and
I). In A549 cells, IFIT1 expression was significantly
increased in cells overexpressing 5A-Full and 5A-ECD compared with
cells overexpressing 5A-ICD (Fig.
4H). In H1299 cells, G1P2 expression was significantly
increased in cells overexpressing 5A-Full and 5A-ECD compared with
cells overexpressing 5A-ICD (Fig.
4I). In addition, the expression levels of the identified
oncogene G1P3 were significantly decreased in A549 cells
overexpressing the different SEMA5A domains, especially in the
5A-Full and 5A-ECD groups (Fig.
4H). However, no significant differences were observed in H1299
cells (Fig. 4I). Other genes,
including interferon induced transmembrane protein
(IFITM)1 and IFITM3, were significantly
upregulated (Fig. 4H and I) in both
A549 and H1299 cells.
The pattern of differential gene expression in the
presence of different SEMA5A domains indicated that the expression
levels of differentially expressed genes in the presence of 5A-Full
were similar to those in the presence of 5A-ECD, and the expression
levels of STAT1 and STAT2 in the presence of 5A-ICD
were significantly lower compared with those in the 5A-Full and
5A-ECD groups. These results suggested that overexpressing 5A-ECD
may have similar effects to overexpressing 5A-Full in terms of a
tumor-suppressing role in lung adenocarcinoma.
Furthermore, the protein expression levels of the
DEGs were examined by western blotting. The overexpression of
5A-Full and 5A-ECD was validated by western blotting (Fig. 5A and B) and the SEMA5A protein
expression was significantly increased compared with the empty
control group (Fig. 5C and D). The
total and phosphorylated protein expression levels of JAK1, JAK2,
STAT1 and STAT2 were examined in A549 cells (Fig. 5E) and H1299 cells (Fig. 5G). Additionally, IFIT1 and G1P2,
STAT1/2 downstream targets, were examined in A549 cells (Fig. 5E) and H1299 cells (Fig. 5G). Cells overexpressing 5A-Full and
5A-ECD exhibited significantly increased ratios of phosphorylated
STAT1 to total STAT1 in A549 cells, and an increased ratio of
phosphorylated STAT2 to total STAT2 in H1299 cells. Additionally,
the expression levels of its downstream targets IFIT1 and G1P2
increased in both A549 and H1299 cells compared with empty control
cells (Fig. 5E-H), which indicated
that the tumor-suppressive effect of 5A-Full or 5A-ECD was due to
activation of STAT1 in the interferon signaling pathway.
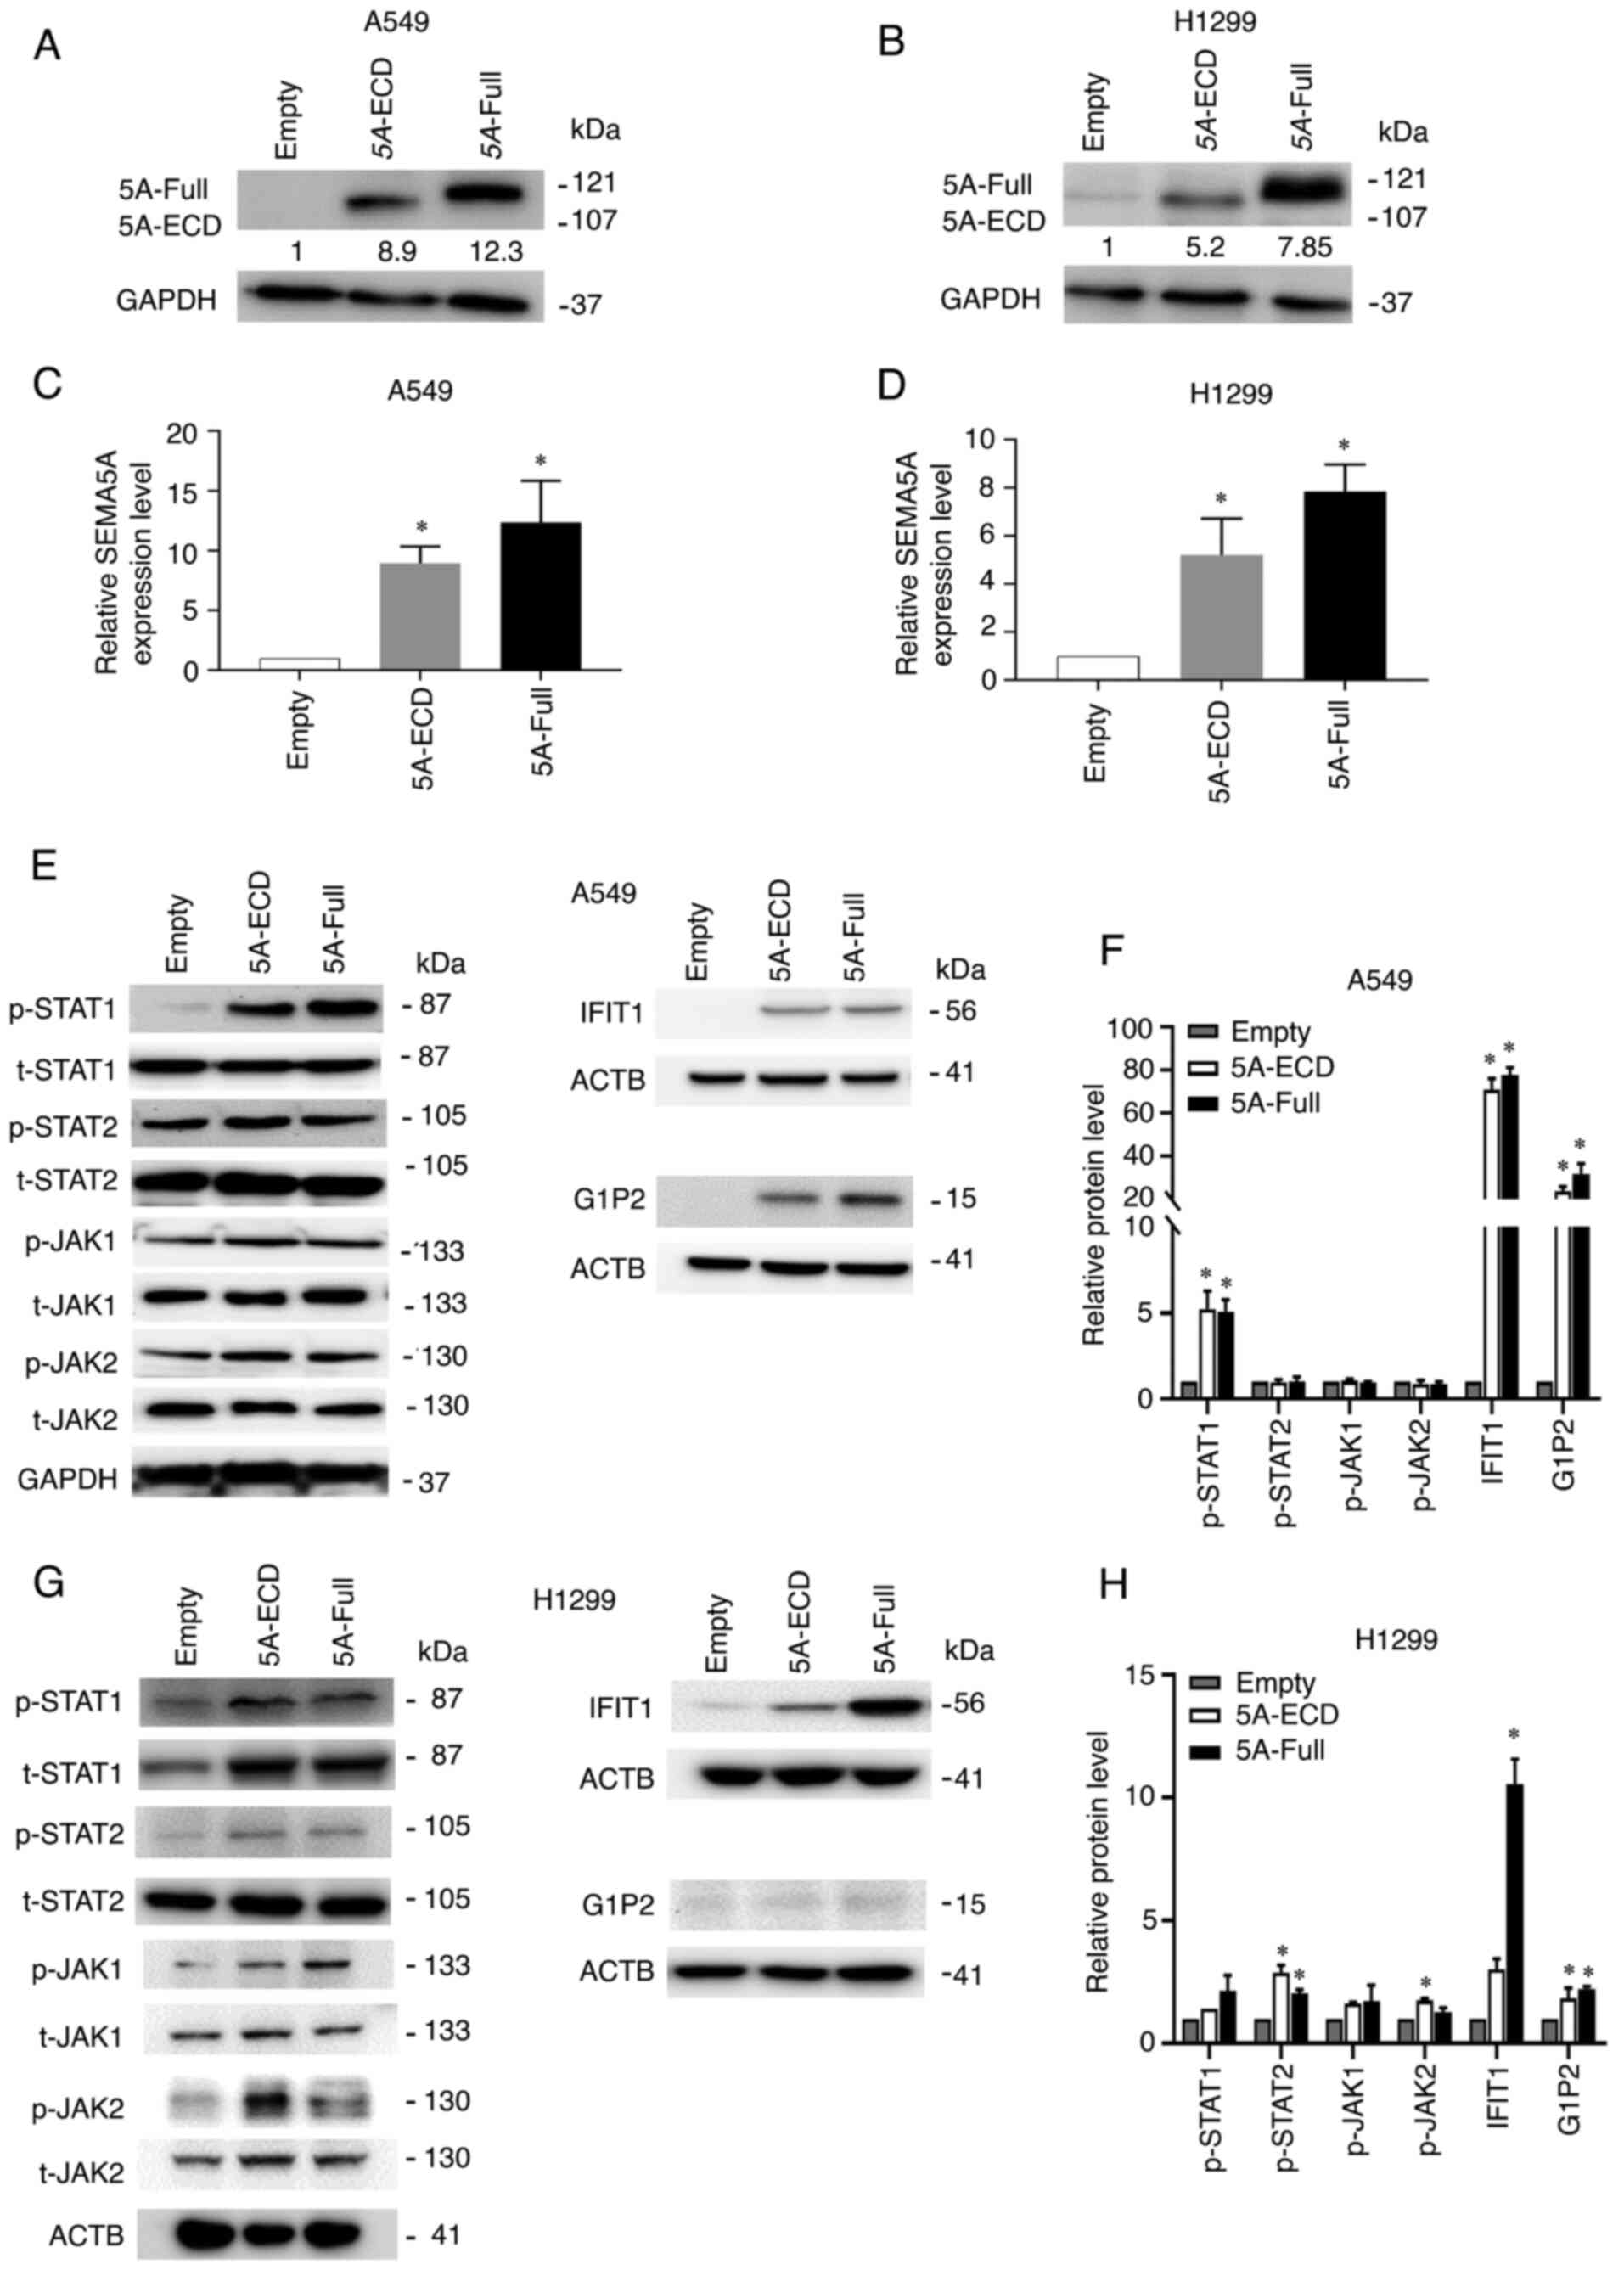 | Figure 5.Overexpression of 5A-Full and 5A-ECD
increases the amount of phosphorylated STAT1 in A549 cells. (A)
Western blotting of total lysates from A549 cells overexpressing
5A-Full. (B) Western blotting of total lysates from H1299 cells
overexpressing 5A-Full or 5A-ECD. (C) Semi-quantification of SEMA5A
from the conditions of (A). (D) Semi-quantification of SEMA5A from
the conditions of (B). (E) Relative protein expression levels of
differentially expressed genes examined by western blotting in A549
cells. GAPDH or ACTB was used as the loading control. (F)
Semi-quantification of p-STAT1, p-STAT2, p-JAK1, p-JAK2, IFIT1 and
G1P2 in A549 cells. Each phosphorylated protein was normalized to
its respective total protein, i.e., p-STAT1 was normalized to
t-STAT1, p-STAT2 to t-STAT2, p-JAK1 to t-JAK1 and p-JAK2 to t-JAK2.
IFIT1 and G1P2 were normalized to ACTB. (G) Relative protein
expression levels of differentially expressed genes examined by
western blotting in H1299 cells. ACTB was used as the loading
control. (H) Semi-quantification of p-STAT1, IFIT1 and G1P2 in
H1299 cells. Each phosphorylated protein was normalized to its
respective total protein, i.e., p-STAT1 was normalized to t-STAT1,
p-STAT2 to t-STAT2, p-JAK1 to t-JAK1 and p-JAK2 to t-JAK2. IFIT1
and G1P2 were normalized to ACTB. Experiments were repeated in
triplicate, and the results are presented as the mean ± SD. One-way
ANOVA and Bonferroni post hoc test were performed. *P<0.05 vs.
Empty. 5A-ECD, SEMA5A extracellular domain; 5A-Full, SEMA5A full
length; ACTB, actin β; G1P2, glycogenin 1 pseudogene 2; IFIT1,
interferon induced protein with tetratricopeptide repeats 1; JAK,
Janus kinase; p, phosphorylated; SEMA5A, semaphorin 5A; t,
total. |
Discussion
The present investigation of the tumor-suppressive
mechanism of SEMA5A in lung adenocarcinoma cells revealed that
overexpression of the full-length protein or the extracellular
domain inhibited the proliferation and migration of both A549 and
H1299 cells. Genes subject to the regulation of different SEMA5A
domains were identified by microarray analysis. Among the DEGs, the
most significant function of these genes was the ‘Interferon
Signaling’ pathway. RT-qPCR demonstrated that the expression levels
of several genes in this pathway, including STAT1, STAT2, IRF9,
IFIT1, G1P2 and IFITM1, were increased in cells
expressing 5A-Full and 5A-ECD compared with the empty control
group. These upregulated suppressors decreased tumor malignancy as
demonstrated by the results of functional assays. Overexpression of
5A-Full or 5A-ECD inhibited the proliferation and migration of lung
adenocarcinoma cells via the interferon signaling pathway.
In previous studies, SEMA5A has been identified as a
tumor suppressor in lung adenocarcinoma (13,14).
The present study investigated the functional role of different
domains of SEMA5A. The extracellular domain has been reported to be
involved in angiogenesis (41). The
expression of the extracellular domain increases both proliferation
and anti-apoptosis abilities in endothelial cells (30). Furthermore, pancreatic cells
transfected with the extracellular domain of SEMA5A exhibit higher
metastatic potential (42). These
results implied that the extracellular domain of SEMA5A has the
potential to initiate carcinogenesis. However, our previous studies
revealed that SEMA5A expression was decreased in lung cancer
cells, suggesting a tumor-suppressive role (13,14).
While most cancer genes are characterized as either oncogenes or
tumor suppressors, some genes, such as BRCA1, enhancer of
zeste 2 polycomb repressive complex 2 subunit, NOTCH1, NOTCH2,
STAT3 and TP53, have been demonstrated to display dual
oncogenic and tumor suppressive functions (43,44).
Therefore, it was hypothesized that SEMA5A has a dual
oncogenic and tumor suppressor role in different types of
cancer.
To further investigate the mechanism of the
suppressive effects of SEMA5A in lung cancer cells, cellular
functional assays were performed in A549 and H1299 cells
overexpressing different SEMA5A domains. The results demonstrated
that overexpressing 5A-ECD had the same effects as overexpressing
5A-Full. These two overexpression groups could inhibit the cell
proliferation, colony formation and migration but had no effect on
apoptosis and cell cycle progression. These results may indicate
that the tumor-suppressive effects of SEMA5A are restricted to cell
proliferation, and it does not have a marked effect on cell death
or the cell cycle. By contrast, overexpression of 5A-ICD did not
have the same tumor-suppressing effects. This demonstrated that the
extracellular domain, not the intracellular domain, of SEMA5A
serves the major role in inhibiting the malignancy of lung
adenocarcinoma.
The present study subsequently explored the
downstream genes regulated by different domains of SEMA5A by
microarray analysis. The DEGs in cells expressing 5A-Full were
almost identical to those in cells expressing 5A-ECD. Most of them
were involved in the ‘Interferon Signaling’ pathway. Of the 19 DEGs
common to cells overexpressing the different SEMA5A domains, 5 of
them, including STAT1, STAT2, IRF9, G1P2 (ISG15) and
IFIT1, were in the interferon signaling pathway. Such The
results of the DEGs of 5A-Full were almost identical to those of
5A-ECD, which was in line with our expectations; because ECD
accounted for almost 90% of the total length, the DEGs were
similar. However, the DEGs between the 5A-Full group and the 5A-ICD
group were less similar. The discrepancy may be due to constructs
of different domains changing the protein structure, which may lead
to activation of different genes. Additionally, interplay of
different domains of SEMA may change the affected genes. For
example, our previous study revealed that the extracellular SEMA
domain could attenuate intracellular apoptotic signaling of SEMA6A
in lung cancer cells (26).
The interferon signaling pathway has been reported
to have anti-proliferative, anti-angiogenic, pro-apoptotic and
immunoregulatory effects in non-small cell lung cancer (37). The increase of IFN-α/β could induce
STAT1/STAT2 heterodimerization with IRF9, leading to the
suppression of tumor growth (45).
STAT1 has been reported to improve therapeutic effects of
interferons on lung cancer cells (32). STAT2 has been demonstrated to share
the anti-viral, immunomodulatory, anti-apoptotic and
anti-proliferative effects of IFN-I (36). IRF9 has been identified to decrease
cell proliferation and inhibit tumor formation (35). In the present study, the expression
levels of STAT1, STAT2 and IRF9 were increased in
cells overexpressing 5A-Full or 5A-ECD in both A549 and H1299
cells, as were the levels of phosphorylated STAT1 in A549 cells,
which revealed a tumor-suppressing mechanism in lung cancer
cells.
Furthermore, IFIT1 has been reported to be a
predictive biomarker, and to suppress proliferation and promote
apoptosis in cancer cells (39),
and G1P2 (ISG15) has been identified to promote
ubiquitin E3 ligase activity and inhibit lung cancer cell
proliferation in response to type I interferon (38). The present results demonstrated that
the mRNA and protein expression levels IFIT1 and G1P2
were increased in cells overexpressing 5A-Full and 5A-ECD. Overall,
these results demonstrated that the extracellular domain of SEMA5A
serves a similar tumor-suppressive role as full length SEMA5A in
regulating the interferon signaling pathway in lung adenocarcinoma.
These results may contribute to the development of a more specific
therapeutic regime to treat lung adenocarcinoma.
Supplementary Material
Supporting Data
Supporting Data
Acknowledgements
The authors would like to thank Dr Melissa Stauffer
for editorial assistance. The authors also benefited from the
technical assistance of Dr Li-Ting Jang (Biomedical Resource Core
at the 1st Core Facility Lab, NTU College of Medicine, Taipei,
Taiwan).
Funding
The present study was supported by grants from the Ministry of
Science and Technology (grant no. MOST 109-2320-B-002-016-MY3) and
National Taiwan University Hospital (grant no. MS441). The funding
source had no role in the design of this study and will not have
any role in its execution or analysis, interpretation of the data,
or the decision to publish the results.
Availability of data and materials
The microarray datasets generated during the current
study are available in the Gene Expression Omnibus repository
(https://www.ncbi.nlm.nih.gov/geo/query/acc.cgi?acc=GSE157062).
All other data generated or analyzed during this study are included
in this published article.
Authors' contributions
MZC, HHH and LCL conceived and designed the
experiments. MZC, LYS and MHH performed the experiments. MZC, PHK,
LLC and TPL analyzed the data. LHC, EYC, LPC and MHT contributed
reagents, materials and/or analysis tools, interpreted data and
revised the manuscript critically for important intellectual
content. MZC, LYS, MHH and LCL confirmed the authenticity of all
the raw data. MZC and LCL wrote the paper. All authors have read
and approved the final manuscript, and agreed to be accountable for
all aspects of the work in ensuring that questions related to the
accuracy or integrity of any part of the work are appropriately
investigated and resolved.
Ethics approval and consent to
participate
The gene recombinant/infectious biological materials
experiments were approved by the Biosafety Committee of the College
of Medicine, National Taiwan University (BG1050086; Taipei,
Taiwan).
Patient consent for publication
Not applicable.
Competing interests
The authors declare that they have no competing
interests.
References
|
1
|
Bray F, Ferlay J, Soerjomataram I, Siegel
RL, Torre LA and Jemal A: Global cancer statistics 2018: GLOBOCAN
estimates of incidence and mortality worldwide for 36 cancers in
185 countries. CA Cancer J Clin. 68:394–424. 2018. View Article : Google Scholar : PubMed/NCBI
|
|
2
|
Torre LA, Siegel RL and Jemal A: Lung
cancer statistics. In: Lung cancer and personalized medicine.
Springer. (New York, NY). 1–19. 2016.
|
|
3
|
Molina JR, Yang P, Cassivi SD, Schild SE
and Adjei AA: Non-small cell lung cancer: Epidemiology, risk
factors, treatment, and survivorship. Mayo Clin Proc. 83:584–594.
2008. View
Article : Google Scholar : PubMed/NCBI
|
|
4
|
Ettinger DS, Akerley W, Bepler G, Blum MG,
Chang A, Cheney RT, Chirieac LR, D'Amico TA, Demmy TL, Ganti AK, et
al: Non-small cell lung cancer. J Natl Compr Canc Netw. 8:740–801.
2010. View Article : Google Scholar : PubMed/NCBI
|
|
5
|
Chang JS, Chen LT, Shan YS, Lin SF, Hsiao
SY, Tsai CR, Yu SJ and Tsai HJ: Comprehensive analysis of the
incidence and survival patterns of lung cancer by histologies,
including rare subtypes, in the era of molecular medicine and
targeted therapy: A nation-wide cancer registry-based study from
Taiwan. Medicine (Baltimore). 94:e9692015. View Article : Google Scholar : PubMed/NCBI
|
|
6
|
Ger LP, Liou SH, Shen CY, Kao SJ and Chen
KT: Risk factors of lung cancer. J Formos Med Assoc. 91 (Suppl
3):S222–S231. 1992.(In Japanese). PubMed/NCBI
|
|
7
|
Hirayasu T, Iwamasa T, Kamada Y, Koyanagi
Y, Usuda H and Genka K: Human papillomavirus DNA in squamous cell
carcinoma of the lung. J Clin Pathol. 49:810–817. 1996. View Article : Google Scholar : PubMed/NCBI
|
|
8
|
Yamamoto H, Shigematsu H, Nomura M,
Lockwood WW, Sato M, Okumura N, Soh J, Suzuki M, Wistuba II, Fong
KM, et al: PIK3CA mutations and copy number gains in human lung
cancers. Cancer Res. 68:6913–6921. 2008. View Article : Google Scholar : PubMed/NCBI
|
|
9
|
Eberhard DA, Johnson BE, Amler LC, Goddard
AD, Heldens SL, Herbst RS, Ince WL, Jänne PA, Januario T, Johnson
DH, et al: Mutations in the epidermal growth factor receptor and in
KRAS are predictive and prognostic indicators in patients with
non-small-cell lung cancer treated with chemotherapy alone and in
combination with erlotinib. J Clin Oncol. 23:5900–5909. 2005.
View Article : Google Scholar : PubMed/NCBI
|
|
10
|
Shigematsu H, Lin L, Takahashi T, Nomura
M, Suzuki M, Wistuba II, Fong KM, Lee H, Toyooka S, Shimizu N, et
al: Clinical and biological features associated with epidermal
growth factor receptor gene mutations in lung cancers. J Natl
Cancer Inst. 97:339–346. 2005. View Article : Google Scholar : PubMed/NCBI
|
|
11
|
Toyooka S, Tsuda T and Gazdar AF: The TP53
gene, tobacco exposure, and lung cancer. Hum Mutat. 21:229–239.
2003. View Article : Google Scholar : PubMed/NCBI
|
|
12
|
Hainaut P and Pfeifer GP: Patterns of p53
G->T transversions in lung cancers reflect the primary mutagenic
signature of DNA-damage by tobacco smoke. Carcinogenesis.
22:367–374. 2001. View Article : Google Scholar : PubMed/NCBI
|
|
13
|
Lu TP, Tsai MH, Lee JM, Hsu CP, Chen PC,
Lin CW, Shih JY, Yang PC, Hsiao CK, Lai LC and Chuang EY:
Identification of a novel biomarker, SEMA5A, for non-small cell
lung carcinoma in nonsmoking women. Cancer Epidemiol Biomarkers
Prev. 19:2590–2597. 2010. View Article : Google Scholar : PubMed/NCBI
|
|
14
|
Ko PH, Lenka G, Chen YA, Chuang EY, Tsai
MH, Sher YP and Lai LC: Semaphorin 5A suppresses the proliferation
and migration of lung adenocarcinoma cells. Int J Oncol.
56:165–177. 2020.PubMed/NCBI
|
|
15
|
Unified nomenclature for the
semaphorins/collapsins. Semaphorin Nomenclature Committee. Cell.
97:551–552. 1999. View Article : Google Scholar : PubMed/NCBI
|
|
16
|
Gherardi E, Love CA, Esnouf RM and Jones
EY: The sema domain. Curr Opin Struct Biol. 14:669–678. 2004.
View Article : Google Scholar : PubMed/NCBI
|
|
17
|
Hota PK and Buck M: Plexin structures are
coming: Opportunities for multilevel investigations of semaphorin
guidance receptors, their cell signaling mechanisms, and functions.
Cell Mol Life Sci. 69:3765–3805. 2012. View Article : Google Scholar : PubMed/NCBI
|
|
18
|
Pasterkamp RJ and Giger RJ: Semaphorin
function in neural plasticity and disease. Curr Opin Neurobiol.
19:263–274. 2009. View Article : Google Scholar : PubMed/NCBI
|
|
19
|
Delaire S, Elhabazi A, Bensussan A and
Boumsell L: CD100 is a leukocyte semaphorin. Cell Mol Life Sci.
54:1265–1276. 1998. View Article : Google Scholar : PubMed/NCBI
|
|
20
|
Bougeret C, Mansur IG, Dastot H, Schmid M,
Mahouy G, Bensussan A and Boumsell L: Increased surface expression
of a newly identified 150-kDa dimer early after human T lymphocyte
activation. J Immunol. 148:318–323. 1992.PubMed/NCBI
|
|
21
|
Gitler AD, Lu MM and Epstein JA: PlexinD1
and semaphorin signaling are required in endothelial cells for
cardiovascular development. Dev Cell. 7:107–116. 2004. View Article : Google Scholar : PubMed/NCBI
|
|
22
|
Hayashi M, Nakashima T, Taniguchi M,
Kodama T, Kumanogoh A and Takayanagi H: Osteoprotection by
semaphorin 3A. Nature. 485:69–74. 2012. View Article : Google Scholar : PubMed/NCBI
|
|
23
|
Roche J, Boldog F, Robinson M,
Varella-Garcia M, Swanton M, Waggoner B, Fishel R, Franklin W,
Gemmill R, Drabkin H, et al: Distinct 3p21.3 deletions in lung
cancer and identification of a new human semaphorin. Oncogene.
12:1289–1297. 1996.PubMed/NCBI
|
|
24
|
Basile JR, Castilho RM, Williams VP and
Gutkind JS: Semaphorin 4D provides a link between axon guidance
processes and tumor-induced angiogenesis. Proc Natl Acad Sci USA.
103:9017–9022. 2006. View Article : Google Scholar : PubMed/NCBI
|
|
25
|
Tomizawa Y, Sekido Y, Kondo M, Gao B,
Yokota J, Roche J, Drabkin H, Lerman MI, Gazdar AF and Minna JD:
Inhibition of lung cancer cell growth and induction of apoptosis
after reexpression of 3p21. 3 candidate tumor suppressor gene
SEMA3B. Proc Natl Acad Sci USA. 98:13954–13959. 2001. View Article : Google Scholar : PubMed/NCBI
|
|
26
|
Shen CY, Chang YC, Chen LH, Lin WC, Lee
YH, Yeh ST, Chen HK, Fang W, Hsu CP, Lee JM, et al: The
extracellular SEMA domain attenuates intracellular apoptotic
signaling of semaphorin 6A in lung cancer cells. Oncogenesis.
7:952018. View Article : Google Scholar : PubMed/NCBI
|
|
27
|
Li X and Lee AY: Semaphorin 5A and
plexin-B3 inhibit human glioma cell motility through
RhoGDIalpha-mediated inactivation of Rac1 GTPase. J Biol Chem.
285:32436–32445. 2010. View Article : Google Scholar : PubMed/NCBI
|
|
28
|
Sadanandam A, Sidhu SS, Wullschleger S,
Singh S, Varney ML, Yang CS, Ashour AE, Batra SK and Singh RK:
Secreted semaphorin 5A suppressed pancreatic tumour burden but
increased metastasis and endothelial cell proliferation. Br J
Cancer. 107:501–507. 2012. View Article : Google Scholar : PubMed/NCBI
|
|
29
|
Saxena S, Purohit A, Varney ML, Hayashi Y
and Singh RK: Semaphorin-5A maintains epithelial phenotype of
malignant pancreatic cancer cells. BMC Cancer. 18:12832018.
View Article : Google Scholar : PubMed/NCBI
|
|
30
|
Livak KJ and Schmittgen TD: Analysis of
relative gene expression data using real-time quantitative PCR and
the 2(−Delta Delta C(T)) method. Methods. 25:402–408. 2001.
View Article : Google Scholar : PubMed/NCBI
|
|
31
|
Sturn A, Quackenbush J and Trajanoski Z:
Genesis: Cluster analysis of microarray data. Bioinformatics.
18:207–208. 2002. View Article : Google Scholar : PubMed/NCBI
|
|
32
|
Chen J, Zhao J, Chen L, Dong N, Ying Z,
Cai Z, Ji D, Zhang Y, Dong L, Li Y, et al: STAT1 modification
improves therapeutic effects of interferons on lung cancer cells. J
Transl Med. 13:2932015. View Article : Google Scholar : PubMed/NCBI
|
|
33
|
Cheriyath V, Kaur J, Davenport A, Khalel
A, Chowdhury N and Gaddipati L: G1P3 (IFI6), a mitochondrial
localised antiapoptotic protein, promotes metastatic potential of
breast cancer cells through mtROS. Br J Cancer. 119:52–64. 2018.
View Article : Google Scholar : PubMed/NCBI
|
|
34
|
Gao M, Lin Y, Liu X, Li Y, Zhang C, Wang
Z, Wang Z, Wang Y and Guo Z: ISG20 promotes local tumor immunity
and contributes to poor survival in human glioma. Oncoimmunology.
8:e15340382019. View Article : Google Scholar : PubMed/NCBI
|
|
35
|
Luker KE, Pica CM, Schreiber RD and
Piwnica-Worms D: Overexpression of IRF9 confers resistance to
antimicrotubule agents in breast cancer cells. Cancer Res.
61:6540–6547. 2001.PubMed/NCBI
|
|
36
|
Park C, Li S, Cha E and Schindler C:
Immune response in Stat2 knockout mice. Immunity. 13:795–804. 2000.
View Article : Google Scholar : PubMed/NCBI
|
|
37
|
Wilderman MJ, Sun J, Jassar AS, Kapoor V,
Khan M, Vachani A, Suzuki E, Kinniry PA, Sterman DH, Kaiser LR and
Albelda SM: Intrapulmonary IFN-β gene therapy using an adenoviral
vector is highly effective in a murine orthotopic model of
bronchogenic adenocarcinoma of the lung. Cancer Res. 65:8379–8387.
2005. View Article : Google Scholar : PubMed/NCBI
|
|
38
|
Yoo L, Yoon AR, Yun CO and Chung KC:
Covalent ISG15 conjugation to CHIP promotes its ubiquitin E3 ligase
activity and inhibits lung cancer cell growth in response to type I
interferon. Cell Death Dis. 9:972018. View Article : Google Scholar : PubMed/NCBI
|
|
39
|
Zhang JF, Chen Y, Lin GS, Zhang JD, Tang
WL, Huang JH, Chen JS, Wang XF and Lin ZX: High IFIT1 expression
predicts improved clinical outcome, and IFIT1 along with MGMT more
accurately predicts prognosis in newly diagnosed glioblastoma. Hum
Pathol. 52:136–144. 2016. View Article : Google Scholar : PubMed/NCBI
|
|
40
|
Ghislain JJ, Wong T, Nguyen M and Fish EN:
The interferon-inducible stat2: Stat1 heterodimer preferentially
binds in vitro to a consensus element found in the promoters of a
subset of interferon-stimulated genes. J Interferon Cytokine Res.
21:379–388. 2001. View Article : Google Scholar : PubMed/NCBI
|
|
41
|
Sadanandam A, Rosenbaugh EG, Singh S,
Varney M and Singh RK: Semaphorin 5A promotes angiogenesis by
increasing endothelial cell proliferation, migration, and
decreasing apoptosis. Microvasc Res. 79:1–9. 2010. View Article : Google Scholar : PubMed/NCBI
|
|
42
|
Sadanandam A, Varney ML, Singh S, Ashour
AE, Moniaux N, Deb S, Lele SM, Batra SK and Singh RK: High gene
expression of semaphorin 5A in pancreatic cancer is associated with
tumor growth, invasion and metastasis. Int J Cancer. 127:1373–1383.
2010. View Article : Google Scholar : PubMed/NCBI
|
|
43
|
Aranko AS, Oeemig JS, Kajander T and Iwaï
H: Intermolecular domain swapping induces intein-mediated protein
alternative splicing. Nat Chem Biol. 9:616–622. 2013. View Article : Google Scholar : PubMed/NCBI
|
|
44
|
Shen L, Shi Q and Wang W: Double agents:
Genes with both oncogenic and tumor-suppressor functions.
Oncogenesis. 7:252018. View Article : Google Scholar : PubMed/NCBI
|
|
45
|
Fink K and Grandvaux N: STAT2 and IRF9:
Beyond ISGF3. JAKSTAT. 2:e275212013.PubMed/NCBI
|


