Introduction
The majority of proliferating tumor cells
preferentially metabolize glucose via glycolysis, even under
aerobic conditions. This process is known as the Warburg effect and
is a primary metabolic hallmark of cancer cells (1-3).
Recently, the molecular mechanisms and relationships associated
with cancer-related genes, including p53, c-myc and
ras, have been investigated (4). The authors reported that the tumor
suppressor, drs/SRPX, which is downregulated by
oncogenes including v-src and K-ras, was involved in
the shift toward glucose metabolism (5). A loss of drs/SRPX induces the
Warburg effect by upregulating lactate dehydrogenase (LDH)-B and
pyruvate dehydrogenase kinase 4 (PDK4), which suggests that these
two enzymes are important in the regulation of glucose metabolism
in malignant cancers (5,6). PDK4 is one of four PDK isoforms
(PDK1-4) that control the pyruvate dehydrogenase (PDH) complex
(7). Phosphorylation of PDH by PDK
inhibits its ability to induce a glycolytic shift, thus promoting
cytoplasmic glycolysis over mitochondrial oxidative
phosphorylation. PDK4 expression is frequently upregulated in
cancer tissues and its elevation is important for the induction of
the Warburg effect (7,8). Trinidad et al (9) report that PDK4 knockdown by specific
small interfering (si)RNAs downregulates mutant Kirsten rat sarcoma
viral oncogene homolog (KRAS) expression and consequently
suppresses the growth of lung and colorectal cancer (CRC) cells.
This finding suggests that PDK4 is an attractive target for cancer
therapy by altering energy metabolism (10,11).
Recently, glutamine has attracted significant interest for its role
in energy metabolism in pancreatic cancer cells (12). The regulation of lipid biosynthesis
also serves a central role in energy metabolism and cancer
progression (13). Furthermore,
lipid metabolism has been found to serve an important role in the
development and progression of pancreatic cancer (12,13).
Specifically, the key mediators of fatty acid metabolic
reprogramming, such as acetyl-CoA carboxylase 1 (ACC1), ATP-citrate
lyase (ACLY) and fatty acid synthase (FASN), are abnormally
expressed in pancreatic cancer (12,14).
These enzymes are considered novel targets for cancer therapy and
the drugs targeting lipid metabolism are undergoing clinical trials
in various cancers, including pancreatic cancer (12,15).
Investigation of the association between this metabolic
reprograming and the action of cryptotanshinone (CPT) in pancreatic
cancer cells is required to elucidate the molecular mechanism of
tumor suppression by CPT.
Tumors driven by mutant KRAS are among the most
aggressive and refractory to treatment (16). Unfortunately, drugs targeting
activated K-Ras protein, either directly or by acting on downstream
signaling molecules, have been largely ineffective (17). However, novel therapeutic
opportunities have emerged based on the effect that this oncogene
exerts in rewiring cancer cell metabolism (18). Cancer cells that become dependent
on KRAS-driven metabolism are sensitive to inhibition via these
metabolic routes, which has provided novel opportunities for
intervention. KRAS is mutated in 90% of pancreatic cancers and is a
major therapeutic target (19).
Mutant KRAS promotes the reprogramming of glutamine metabolism,
lipid biosynthesis and upregulation of antioxidants, such as GSH,
which results in decreased reactive oxygen species (ROS) production
(19). The authors previously
reported that CPT, a novel PDK4 inhibitor derived from plants,
inhibits the formation of 3D spheroids and tumor formation by
reducing the expression of mutant K-Ras protein (20). The present study examined the
pathway through which CPT suppresses glutamine and lipid metabolism
via mutant KRAS to shed light on the mechanism of tumor suppression
by CPT.
Materials and methods
Cell culture
Human pancreatic ductal adenocarcinoma (PDAC) cell
lines, MIAPaCa-2 (mutant KRAS; cat. no. CRL-1420) and BxPC3
(wild-type KRAS; cat. no. CRL-1687) and human CRC cell line DLD1
(mutant KRAS; cat. no. CCL-221) were obtained from the American
Type Culture Collection. The human CRC cell line DKO4 (wild-type
KRAS) cell line was established as previously described (21). MIAPaCa-2, DLD1 and DKO4 were
cultured in Dulbecco's modified Eagle's medium (DMEM; Nakarai
Tesque, Inc.) supplemented with 10% fetal calf serum, penicillin
(100 U/ml) and streptomycin (100 µg/ml), whereas BxPC3 was
cultured in RPMI1640 (Nakarai Tesque, Inc.) supplemented with 10%
fetal calf serum (FCS; Nakarai Tesque, Inc.), penicillin (100 U/ml)
and streptomycin (100 µg/ml) at 37°C in a humidified
incubator containing 5% CO2. In addition, nonadherent
cell culture was performed by coating the dishes with
poly-(2-hydroxyethyl methacrylate) reagent (poly-HEMA;
MilliporeSigma).
Reagents
CPT (cryptotanshinone) was purchased from Cosmo Bio
Co., Ltd. and dissolved in dimethyl sulfoxide (DMSO) to prepare 20
mM stock solutions for the in vitro experiments. The final
concentration of DMSO was adjusted to 0.1%.
Cell proliferation assays
The three-dimensional (3D) spheroid formation assay
was performed using 96-well V plates (PrimeSurface; Sumitomo
Bakelite Co., Ltd.) as described previously (20). A total of 1×10³ cells
were seeded to a 96-well plate and incubated with CPT for 72 h at
37°C in triplicate. To determine the number of viable cells in the
3D spheroid, ATP was quantified using the luminescence-based
CellTiter-Glo 3D cell viability assay (Promega Corporation). The
viability of the adherent cells was determined using the
CellTiter-Glo cell viability assay (Promega Corporation). The
morphology of 3D-spheroid was imaged using a light microscope at ×4
magnification (IX73; Olympus Corporation). More than three randomly
selected were examined.
Measurement of glutamine,
H2O2 and GSH concentration
A total of 5×10⁵ cells were seeded into
poly-HEMA-coated 60 mm dishes and cultured with CPT for 48 h at
37°C under nonadherent conditions for metabolite analyses. The
culture medium was collected and glutamine and
H2O2 concentrations were determined using the
Glutamine/Glutamate-Glo Assay kit (Promega Corporation) and Amplite
fluorimetric H2O2 kit (ATT Bioquest, Inc.),
respectively. The intercellular glutathione-SH/glutathione
disulfide (GSH/GSSG) was determined using the GSH/GSSG-Glo Assay
kit (Promega Corporation). Glutamine and H2O2
concentrations were normalized to cellular protein content, which
was determined using the Bradford method (Bio-Rad protein assay;
Bio-Rad Laboratories, Inc.) based on the manufacturer's
protocol.
siRNA transfection
For siRNA experiments (GeneDesign, Inc.), 100 nM of
siRNA for FASN (siFASN; sense: 5′-AAC CCT GAG ATC CCA GCG CTG-3′,
antisense: 5′-CAG CGC TGG GAT CTC AGG GTT-3′) (22) or 10 nM of siRNA for KRAS (siKRAS;
sense: 5′-CAG CUA AUU CAG AAU CAU U-3′, antisense: 5′-AAU GAU UCU
GAA UUA GCU G-3′) (23) was
transfected with Lipofectamine® RNAiMax (Invitrogen;
Thermo Fisher Scientific, Inc.) reagent according to the
manufacturer's instructions (Lipofectamine® RNAiMax and
siRNA were mixed at room temperature for 5 min and then added to
MIAPaCa-2 cells). A 100 nM or 10 nM of nonspecific siRNA duplex
(sense UUC UCC GAA CGU GUC ACG U, Antisense ACG UGA CAC GUU CGG AGA
A; GeneDesign, Inc.) served as the control. A total of
1×10⁵ cells were treated with siRNA for 24 h, followed
by spheroid culture in a 96-well V-bottom plate for 72 h in
triplicate. For the cell lysate preparation of immunoblot analyses,
the cells were cultured under nonadherent conditions for 48 h at
37°C.
Immunoblotting and antibodies
A total of 5×10⁵ cells were seeded into
poly-HEMA-coated 60 mm dish and cultured with CPT for 48 h under
nonadherent conditions for immunoblot analyses. The cells were
lysed in Laemmli sample buffer containing 62.5 mM Tris-HCl [pH
6.8], 10% glycerol, 5% 2-mercaptoethanol, 2% sodium dodecyl sulfate
(SDS) and 0.01% bromophenol blue. The total proteins were
quantified using Micro BCA Protein Assay Kit (Thermo Fisher
Scientific, Inc.). A 20 µg of the cell lysate sample was
subjected to 6 or 10% SDS-polyacrylamide gel electrophoresis (PAGE)
and the separated proteins were electrotransferred to
polyvinylidene difluoride (PVDF) membrane filters (Immobilon-P;
MilliporeSigma). After blocking of the filters with TBST [10 mM
Tris-HCl (pH 7.6), 150 mM sodium chloride and 0.1% Tween 20]
containing 5% bovine serum albumin (BSA; Nakarai Tesque, Inc.) for
1 h at room temperature, the filters were incubated overnight with
the indicated primary anti-bodies in TBST (0.1% Tween 20)
containing 2% BSA at 4°C. The filters were then washed in TBST and
were incubated for 1 h in horseradish peroxidase-conjugated
anti-mouse (cat. no. NA931, from sheep) or anti-rabbit (cat. no.
NA934, from donkey) immunoglobulin G (IgG; Cytiva) diluted 1:20,000
in TBST containing 2% BSA. After several washes with TBST, the
immunoreactivity was detected using the ECL Western Blotting
Detection System (Cytiva) according to the manufacturer's
instructions. The ECL signal detection was performed using FUSION
SOLO. 6S. EDGE (Vilber Lourmat). Protein expression was quantitated
by band densitometry using ImageJ v1.51 software (National
Institutes of Health). Rabbit monoclonal antibodies for
glutamic-oxaloacetic transaminase (GOT)2 (1:3,000; cat. no.
ab171739) were purchased from Abcam. Rabbit monoclonal antibodies
for GOT1 (1:3,000; cat. no. 14886-1-AP), isocitrate dehydrogenase
(IDH)2 (15932-1-AP) and glutamate transport system permease protein
(GLUD)1 (1:3,000; cat. no. 14299-1AP) and mouse monoclonal
antibodies for GLS (1:3,000; cat. no. 66265-1-Ig) were purchased
from ProteinTech Group, Inc. Mouse monoclonal antibodies for GAPDH
(1:3,000; cat. no. AC002) and rabbit monoclonal antibodies for KRAS
(1:3,000; cat. no. A12704) and IDH1 (1:3,000; cat. no. A13245) were
purchased from ABclonal Biotech Co., Ltd. Rabbit monoclonal
antibodies for FASN (1:1,000; cat. no. #3189S), anti-ACLY rabbit
polyclonal (1:1,000; cat. no. 4332S), anti-phosphorylated (p)ACLY
rabbit polyclonal (1:1,000; p-S445; cat. no. 4331S) and anti-ACC1
rabbit polyclonal (1:1,000; cat. no. 3662) antibodies and
anti-p-ACC1 rabbit polyclonal (1:1,000; p-S79; cat. no. 3661S) were
purchased from Cell Signaling Technology, Inc.
Lipid droplet assay
For lipid droplet staining, the cells were seeded
into culture dishes at a density of 1.0×10⁵ cells. When
the cell density reached ~60%, CPT (0 or 5 µM) was added and
incubated for 24 h. siKRAS and/or siFASN were added and incubated
for 72 h at 37°C. The cells were fixed in 4% paraformaldehyde for
10 min at room temperature and then washed twice with phosphate
buffered saline (PBS) to remove residual paraformaldehyde.
Subsequently, 1 ml of 1 µM LipiDyeII (Funakoshi Co., Ltd.)
was added to the cells and incubated at 37°C for 30 min in the
dark. The samples were washed three times with PBS, 10 µM
DAPI (4′,6-diamidino-2-phenylindole) was added and the cells were
imaged immediately using a fluorescent microscope (IX83; Olympus
Corporation). Cell fluorescence intensity was quantified using
ImageJ v1.51 software (National Institutes of Health). The
experiment was repeated three times, with two replicates each
time.
Statistical analyses
All quantitative data were presented as mean ±
standard deviation. One-way ANOVA test, followed by Tukey's test,
was performed for multiple comparisons and Welch's t-test was used
for simple comparisons. All analyses were performed using the R
statistical software package, version 2.6.2 (https://www.r-project.org/) and P<0.05 was
considered to indicate a statistically significant difference.
Results
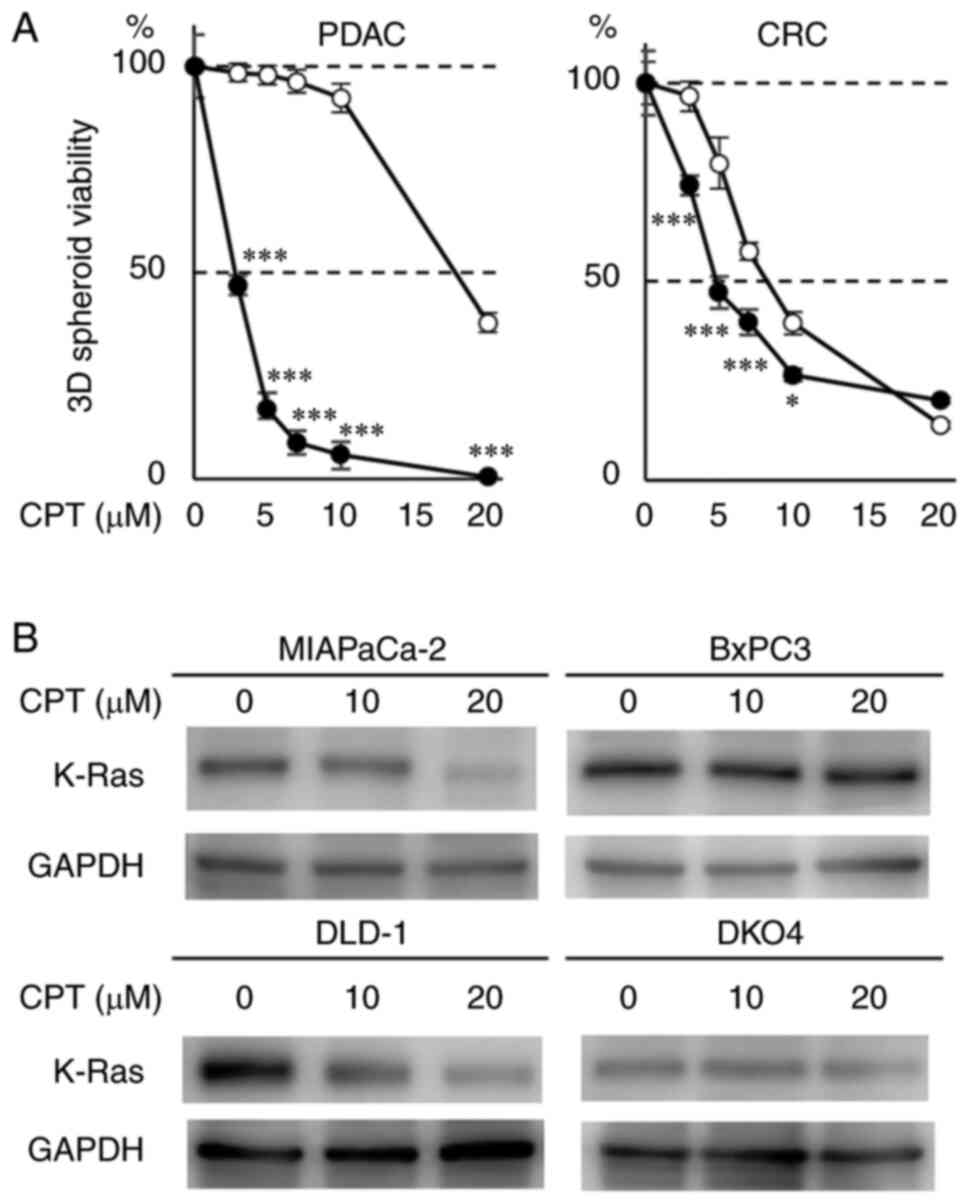
Effect of CPT on the 3D-spheroid
formation and expression of K-Ras protein in pancreatic and CRC
cell lines with or without mutant KRAS
To assess the role of the mutant (activated) KRAS
allele on the antitumor activity of CPT, its effects on 3D-spheroid
formation in two PDAC cell lines (MIAPaCa-2 and BxPC3) with or
without mutant KRAS was determined. The degree of inhibition was
compared between the cancer cells containing mutant KRAS and
wild-type KRAS. The antioncogenic effect of CPT was assessed by
evaluating 3D-spheroid formation, which is frequently used in
cancer research to closely mimic the tumor microenvironment
(20). 3D-spheroid formation was
quantified by using ATP concentration as a surrogate, which is
closely associated with the number of viable cancer cells in the
spheroids. The 3D-spheroid formation of MIAPaCa-2 cells containing
mutant KRAS was strongly inhibited by CPT treatment (3-10
µM) compared with that of the BxPC-3 cells containing
wild-type KRAS (Fig. 1A left). The
effect of CPT on K-Ras protein was also evaluated in these two cell
lines. A 3D-spheroid formation was morphologically altered in these
cell lines by CPT treatment (5-10 µM; Fig. S1A). The results indicated that
10-20 µM of CPT effectively suppressed the level of mutant
K-Ras protein in MIAPaCa-2 cells (mutant KRAS) as previously
described (20), whereas GAPDH an
internal control protein remained unaffected by CPT treatment
(Figs. 1B and S1B). However, K-Ras protein expression
was faintly suppressed by CPT in the BxPC-3 cells (wild-type KRAS).
The same experiments were performed in two CRC cell lines (DLD-1
and DKO4), which had the same genetic background with or without
mutant KRAS. The 3D-spheroid formation of DLD-1 cells (mutant KRAS)
was significantly more inhibited by CPT treatment (3-10 µM)
than that of DKO4 cells (Fig. 1A
right). CPT more effectively decreased mutant K-Ras protein
expression at 10 µM in DLD-1 cells (mutant KRAS) than in
DKO4 cells (wild-type KRAS), whereas Although GAPDH expression was
barely reduced by CPT treatment, the decrease of K-Ras by CPT was
evident (Figs. 1B and S1B). However, K-Ras protein expression
was faintly suppressed by CPT in DKO4 cells (wild-type KRAS). These
results indicated that CPT treatment specifically decreases K-Ras
protein in cancer cells containing mutant KRAS and that the effect
of CPT on the suppression of 3D-spheroid formation is dependent on
mutant KRAS.
Effect of CPT on the expression of
proteins involved in glutamine and lipid metabolism in pancreatic
cancer cell lines containing mutant or wild-type KRAS
Mutant KRAS regulates glutamine and lipid metabolism
during the development of malignant tumors (19). The dependency of 3D-spheroid
formation on glutamine in PDAC (MIAPaCa-2 and BxPC-3) and CRC
(DLD-1 and DKO4) cell lines with or without mutant KRAS was
determined. In the PDAC cell lines, spheroid growth of the
MIAPaCa-2 cells containing mutant KRAS was more dependent on
glutamine concentration compared with BxPC3 cells containing
wild-type KRAS (Fig. S2A). As for
the CRC cell lines (DLD-1 and DKO4), the dependency of spheroid
growth of mutant KRAS on glutamine concentration was not clearly
observed. In the mutant KRAS cells (MIAPaCa-2 and DLD-1), the
dependency of spheroid growth on glucose concentration was lower
compared with that on glutamine concentration, although it was
faintly higher than that on glucose concentration in wild-type KRAS
cells (Fig. S2A and B). These
results indicated that mutant KRAS was associated with the
glutamine-dependent cell growth of pancreatic cancer cells. To
clarify the molecular mechanisms by which CPT suppressed
oncogenesis in a mutant KRAS-dependent manner, alterations in the
proteins associated with glutamine and lipid metabolism were
evaluated in MIAPaCa-2 (mutant KRAS) and BxPC-3 (wild-type KRAS)
cells. As shown in Figs. 2 and
S3, CPT concentrations of 10-20
µM decreased the expression of some proteins involved in
glutamine metabolism, including GOT1, GLS and IDH1, as well as
K-Ras protein in MIAPaCa-2 cells. GOT2, GLUD1 and IDH2 (a protein
associated with glutamine metabolism) remained unaffected by CPT
treatment. Proteins associated with lipid metabolism, such as FASN,
ACC1, P-ACC, ACLY and P-ACLY, were also decreased by CPT treatment
in MIAPaCa-2 cells. By contrast, the expression of these proteins
and K-Ras protein were faintly or moderately influenced by CPT in
BxPC-3. These results suggested that glutamine and lipid metabolism
were affected by CPT in MIAPaCa-2 cells containing mutant KRAS.
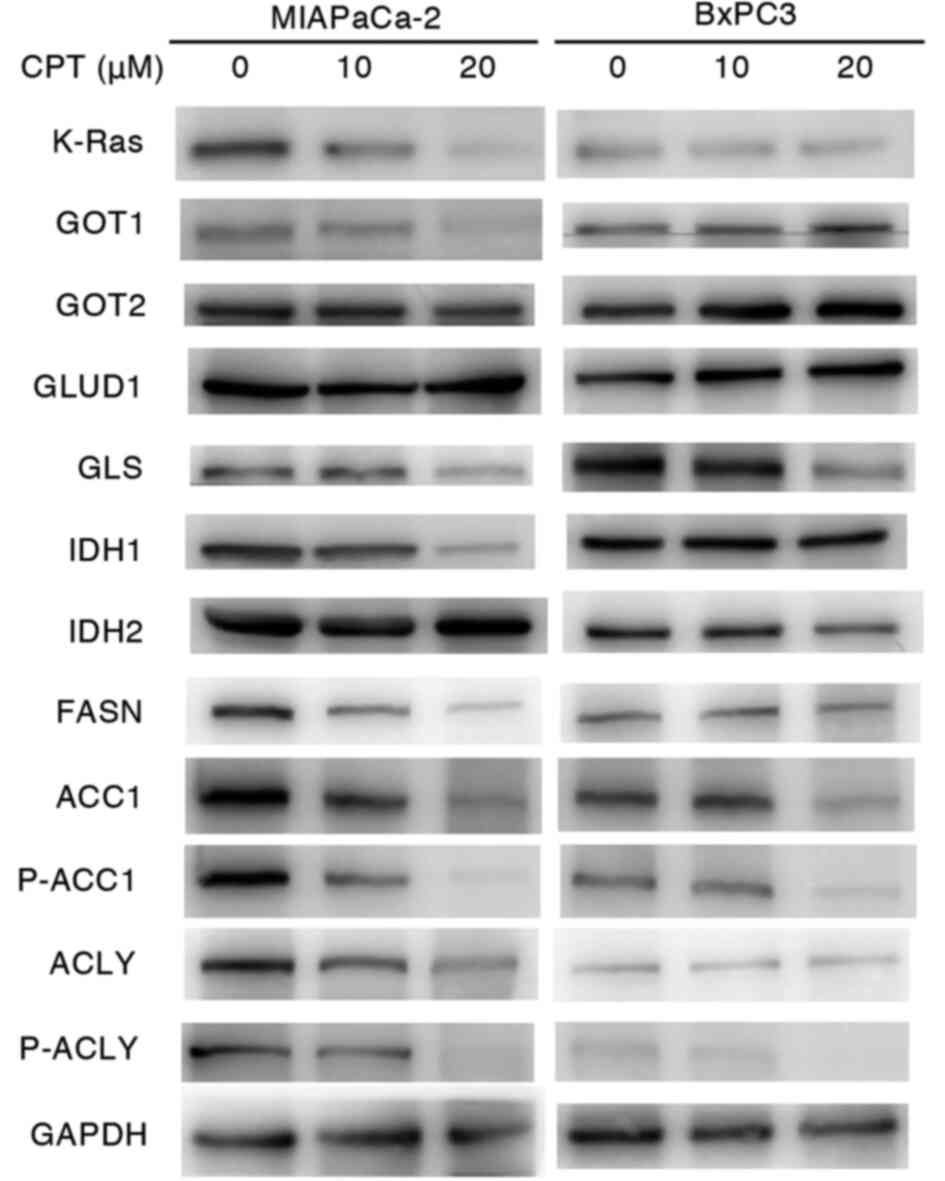 | Figure 2Immunoblot analyses of proteins
regulating glutaminolysis and lipogenesis in nonadherent MIAPaCa-2
(mutant KRAS) and BxPC3 (wild-type KRAS) cancer cells treated with
CPT. A total of 5×10⁵ cells were seeded into
poly-HEMA-coated 60 mm dishes and treated with CPT at 10 and 20
µM for 48 h. GAPDH was used as the internal control. KRAS,
Kirsten rat sarcoma viral oncogene homolog; CPT, cryptotanshinone;
GOT, glutamic-oxaloacetic transaminase; GLUD, glutamate transport
system permease protein; GLS, glutaminase; IDH, isocitrate
dehydrogenase; FASN, fatty acid synthase; ACC1, acetyl-CoA
carboxylase 1; ACLY, ATP-citrate lyase; p-, phosphorylated. |
Effect of CPT on glutamine consumption
and lipid synthesis in pancreatic cancer cell lines containing
mutant or wild-type KRAS
The effects of CPT on glutamine consumption and
lipid synthesis were determined in MIAPaCa-2 and BxPC-3 cells. As
shown in Fig. 3A, glutamine
concentration in the culture medium was significantly increased by
CPT (10 µM), thereby indicating that glutamine consumption
was significantly decreased by CPT in MIAPaCa-2 cells. Lipid
synthesis was monitored via the formation of lipid droplets and was
also decreased by CPT in MIAPaCa-2 cells but not in BxPC-3 cells
(Figs. 3B-F and S4). These results indicated that CPT
treatment suppresses glutamine and lipid metabolism in MIAPaCa-2
cells containing mutant KRAS.
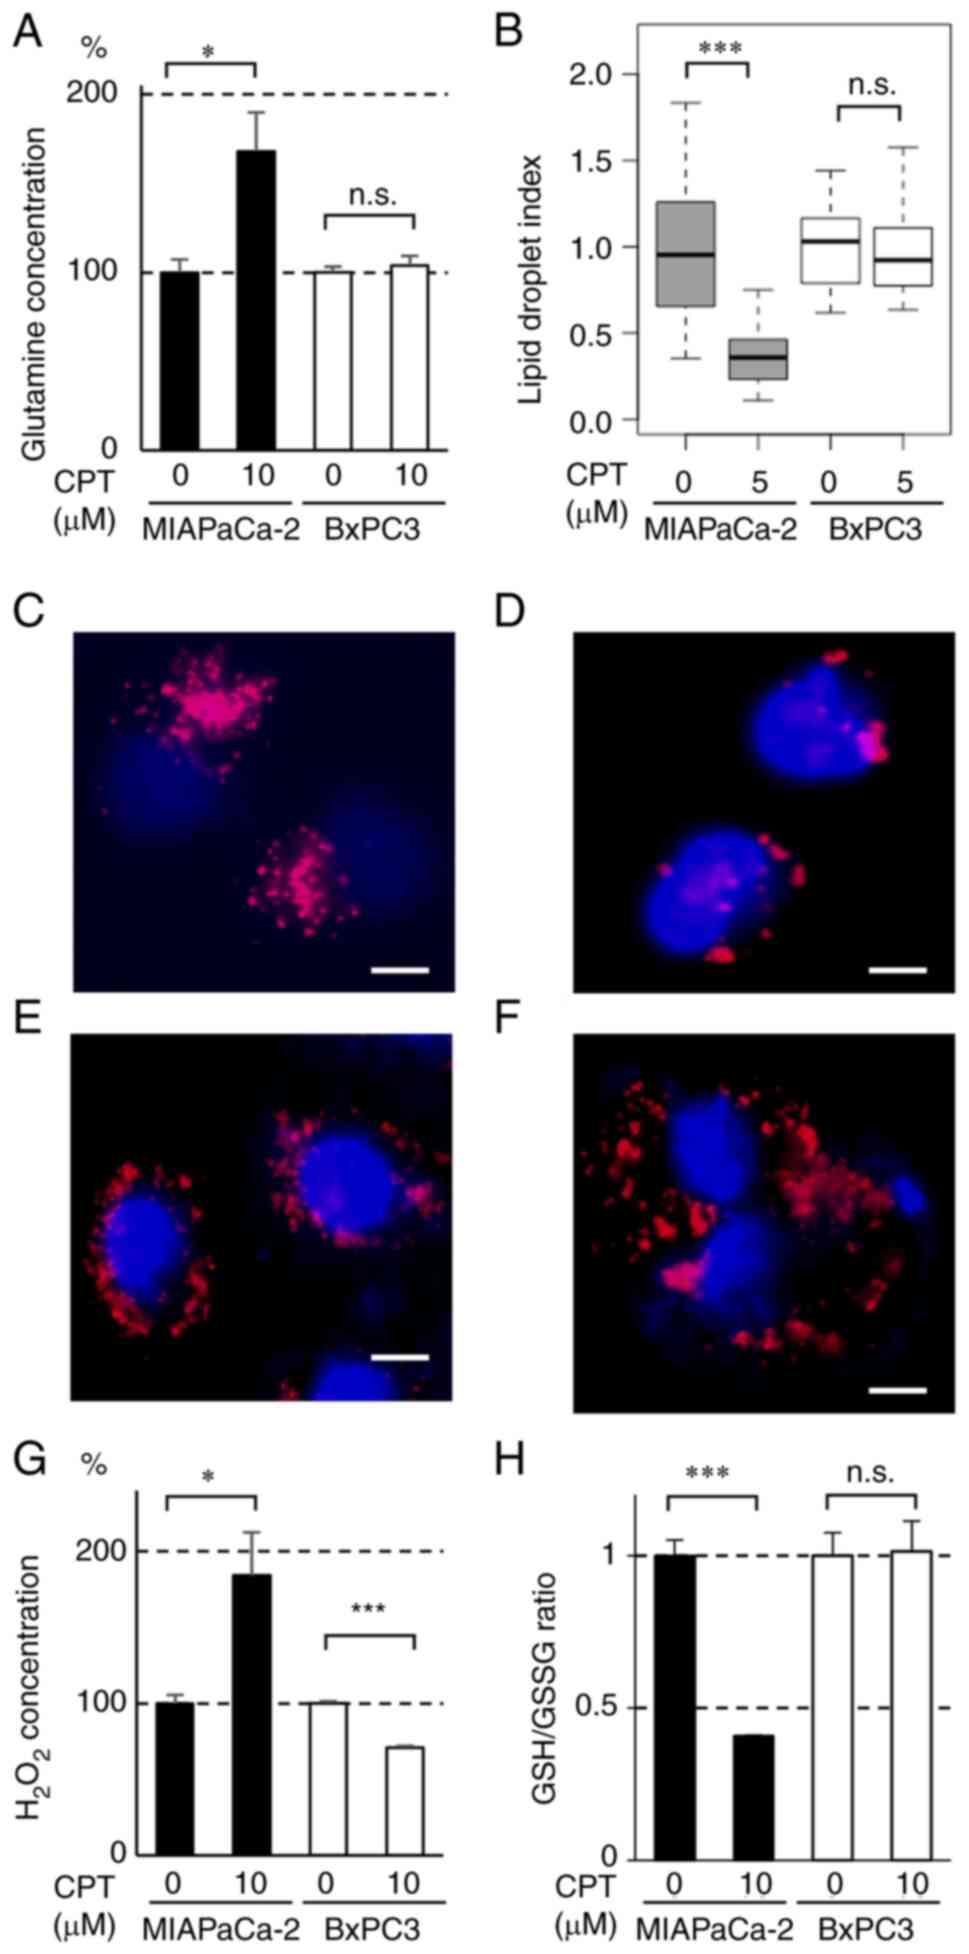 | Figure 3Effect of CPT on (A) glutaminolysis,
(B-F) lipogenesis and (G and H) redox regulation in MIAPaCa-2
(mutant KRAS) and BxPC3 (wild-type KRAS) cancer cell lines. (A)
Glutamine content in the nonadherent culture medium of MIAPaCa-2
(closed bars) and BxPC3 (open bars) cells treated with CPT. A total
of 5×10⁵ cells were seeded into poly-HEMA-coated 60 mm
dishes and incubated with 10 µM CPT for 48 h in triplicate.
Glutamine content in the culture medium was determined using the
Glutamine/Glutamate-Glo Assay kit. The bars indicate mean ±
standard deviation. *P<0.05 using Welch's t-test.
n.s., not significant. (B) Box plot of the areas of lipid droplets
in MIAPaCa-2 (gray boxes) and BxPC3 (white boxes) cells treated
with CPT. The cells were seeded in culture dishes at a density of
1.0×10⁵ cells/dish. When the cell density reached ~60%,
CPT (0 or 5 µM) was added and incubated for 24 h. The cells
were fixed in 4% paraformaldehyde and stained with LipiDyeII and
DAPI. The integrated density of LipiDyeII staining (n=20 for each
group) was measured using ImageJ software and normalized to the
average of each control (0 µM) group. In the plots, the box
indicates the lower and upper quartile, the horizontal bar
represents the median and the whiskers are the highest and lowest
data points that fall within 1.5 times the interquartile range from
the lower and upper quartiles. ***P<0.001 using
Welch's t-test. n.s., not significant. (C-F) Representative images
of lipid droplet formation in (C and D) MIAPaCa-2 and (E and F)
BxPC3 cells. The cells were treated or untreated with 5 µM
CPT for 24 h and then stained with LipiDyeII and DAPI. The nuclei
of the cells were stained with DAPI (blue) and the lipid droplets
were stained with LipiDyeII (red). Scale bars=10 µm. (G)
Hydrogen peroxide content in the nonadherent culture medium of
MIAPaCa-2 (closed bars) and BxPC3 (open bars) cells treated with
CPT. A total of 5×10⁵ cells were seeded into
poly-HEMA-coated 60 mm dishes and treated with 10 µM CPT for
48 h in triplicate. H2O2 contents in the
culture medium were determined using the Amplite fluorimetric
H2O2 kit. The bars indicate the mean ±
standard deviation. * and ***P<0.05 and
P<0.001 using Welch's t-test, respectively. (H) GSH/GSSG in the
nonadherent MIAPaCa-2 (closed bars) and BxPC3 (open bars) cells
treated with CPT. A total of 5×10⁵ cells were seeded
into poly-HEMA-coated 60 mm dishes and treated with 10 µM
CPT for 48 h in triplicate. GSH/GSSG was determined by measuring
GSH and GSSG using the GSH/GSSG-Glo Assay kit. The bars indicate
mean ± standard deviation. ***P<0.001 using Welch's
t-test. n.s., not significant; CPT, cryptotanshinone; KRAS, Kirsten
rat sarcoma viral oncogene homolog; GSH, glutathione-SH; GSSG,
glutathione disulfide. |
Effect of CPT on the redox regulation and
production of ROS in pancreatic cancer cells containing mutant or
wild-type KRAS
ROS exhibits potent antitumor activity by reacting
with DNA, proteins, lipids and enzymes (24). Redox molecules, such as GSH and
GSSG, serve key roles in ROS production (25). Furthermore, glutamine and lipid
metabolism have been shown to be closely associated with redox
regulation (19,26). To determine whether CPT also
affects redox regulation, the effect of CPT treatment on GSH/GSSG
and ROS production was examined in MIAPaCa-2 and BxPC-3 cells. As
shown in Fig. 3G, CPT treatment
(10 µM) significantly increased H2O2
(ROS) production in MIAPaCa-2 cells but not in BxPC-3 cells. GSH is
known to react with ROS to suppress its affects (25). GSH/GSSG was decreased by CPT
treatment (10 µM) in MIAPaCa-2 cells but not in BxPC-3 cells
(Fig. 3H). These results signified
that CPT also affects redox regulation (GSH/GSSG) and ROS
production in MIAPaCa-2 cells containing mutant KRAS, which
suggests that these changes contribute to the suppression of
tumorigenesis by CPT.
Effect of KRAS knockdown on the
expression of proteins involved in glutamine and lipid metabolism,
redox regulation and ROS production in MIAPaCa-2 pancreatic cancer
cells containing mutant KRAS
To clarify the role of K-Ras protein in the
suppression of glutamine and lipid metabolism, KRAS was knocked
down in MIAPaCa-2 cells using specific siRNAs and the changes in
related proteins examined. Introduction of siRNA against KRAS
decreased the expression of FASN, P-ACC1 and ACC1 as well as K-Ras
protein (Figs. 4A and B, 5A and S5A
and B). Expression of GAPDH was unaffected by KRAS siRNA. The
expressions of GOT1, GOT2, IDH1, IDH2, GLUD1, GLS and ACLY were
minimally affected by KRAS siRNA (Figs. 4A and S5A). These results indicated that the
suppression of proteins involved in lipid synthesis, such as FASN
and ACC1, resulted from the downregulation of mutant K-Ras protein.
Knockdown of KRAS also markedly decreased 3D spheroid formation
(~90% decrease; Fig. 5B). The
effect of KRAS siRNA on lipid synthesis, ROS production and
GSH/GSSG in MIAPaCa-2 cells was also determined. KRAS knockdown
decreased the formation of lipid droplets (Figs. 5D and E and S6A and B). It also increased ROS
production (Fig. 5G) and reduced
the GSH/GSSG (Fig. 5H) similar to
CPT treatment (Figs. 3 and
S4). To further investigate the
relationship among lipid synthesis, ROS production and 3D-spheroid
formation, knockdown experiments using siRNA against FASN, a key
enzyme in lipid synthesis, were also performed in MIAPaCa-2 cells.
As shown in Figs. 5D and F and
S6A and C, the formation of lipid
droplets was significantly decreased by FASN knockdown. 3D-spheroid
formation was also decreased by FASN siRNA treatment, although the
degree of suppression (~50%) was less than that observed with KRAS
siRNA (~90%; Fig. 5B). Treatment
with siRNA against FASN also partially increased ROS production
(Fig. 5G) but did not decrease
GSH/GSSG (Fig. 5H). FASN knockdown
barely altered the level of K-Ras protein (Figs. 5A and S5B). These results indicated that the
suppression of lipid synthesis mediated by ACC1 and FASN served an
important role in the antioncogenic activity of CPT via the
downregulation of K-Ras protein, although pathways other than lipid
synthesis may also contribute to this suppression. Collectively,
these results demonstrated that the antioncogenic activity of CPT
via the downregulation of the K-Ras protein is primarily mediated
by the regulation of lipid metabolism. In addition, the enhancement
of ROS production is important for this activity (Fig. 6).
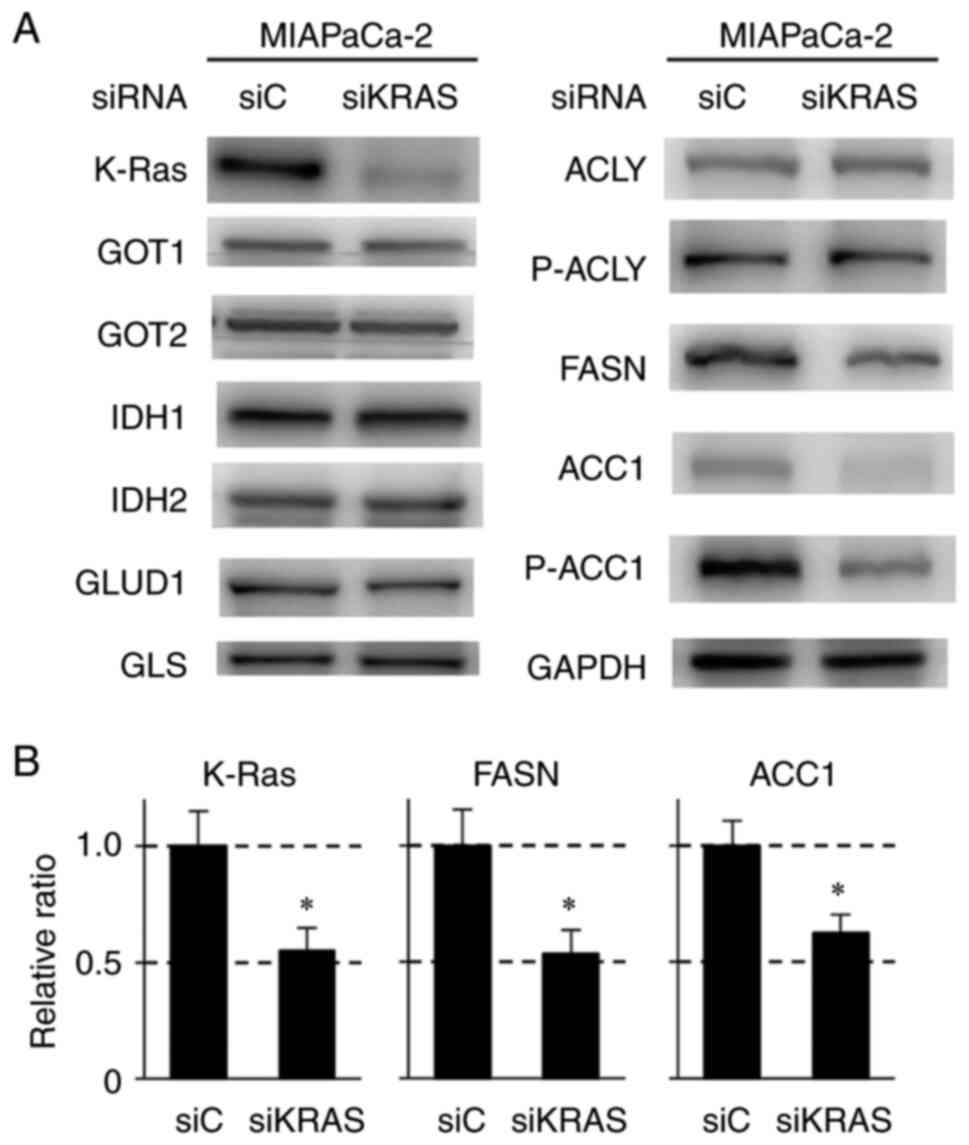 | Figure 4Immunoblot analyses of proteins
regulating glutaminolysis and lipogenesis in MIAPaCa-2 cells
treated with control (siC) and KRAS siRNA (siKRAS). (A) A total of
1×10⁵ cells were treated with siRNA for 24 h, followed
by nonadherent culture (48 h). GAPDH was used as the internal
control. (B) Quantitative analysis of protein expression levels of
K-Ras, FASN and ACC1 after siKRAS treatment in MIAPaCa-2 cells. The
bars indicate the relative expression value normalized to those of
GAPDH and are presented as mean ± standard deviation of three
independent assays. *P<0.05 compared with siC using
Welch's t-test. KRAS, Kirsten rat sarcoma viral oncogene homolog;
si, short interfering; FASN, fatty acid synthase; ACC1, acetyl-CoA
carboxylase 1; ACLY, ATP-citrate lyase; GOT, glutamic-oxaloacetic
transaminase; IDH, isocitrate dehydrogenase; GLUD, glutamate
transport system permease protein; GLS, glutaminase; p-,
phosphorylated. |
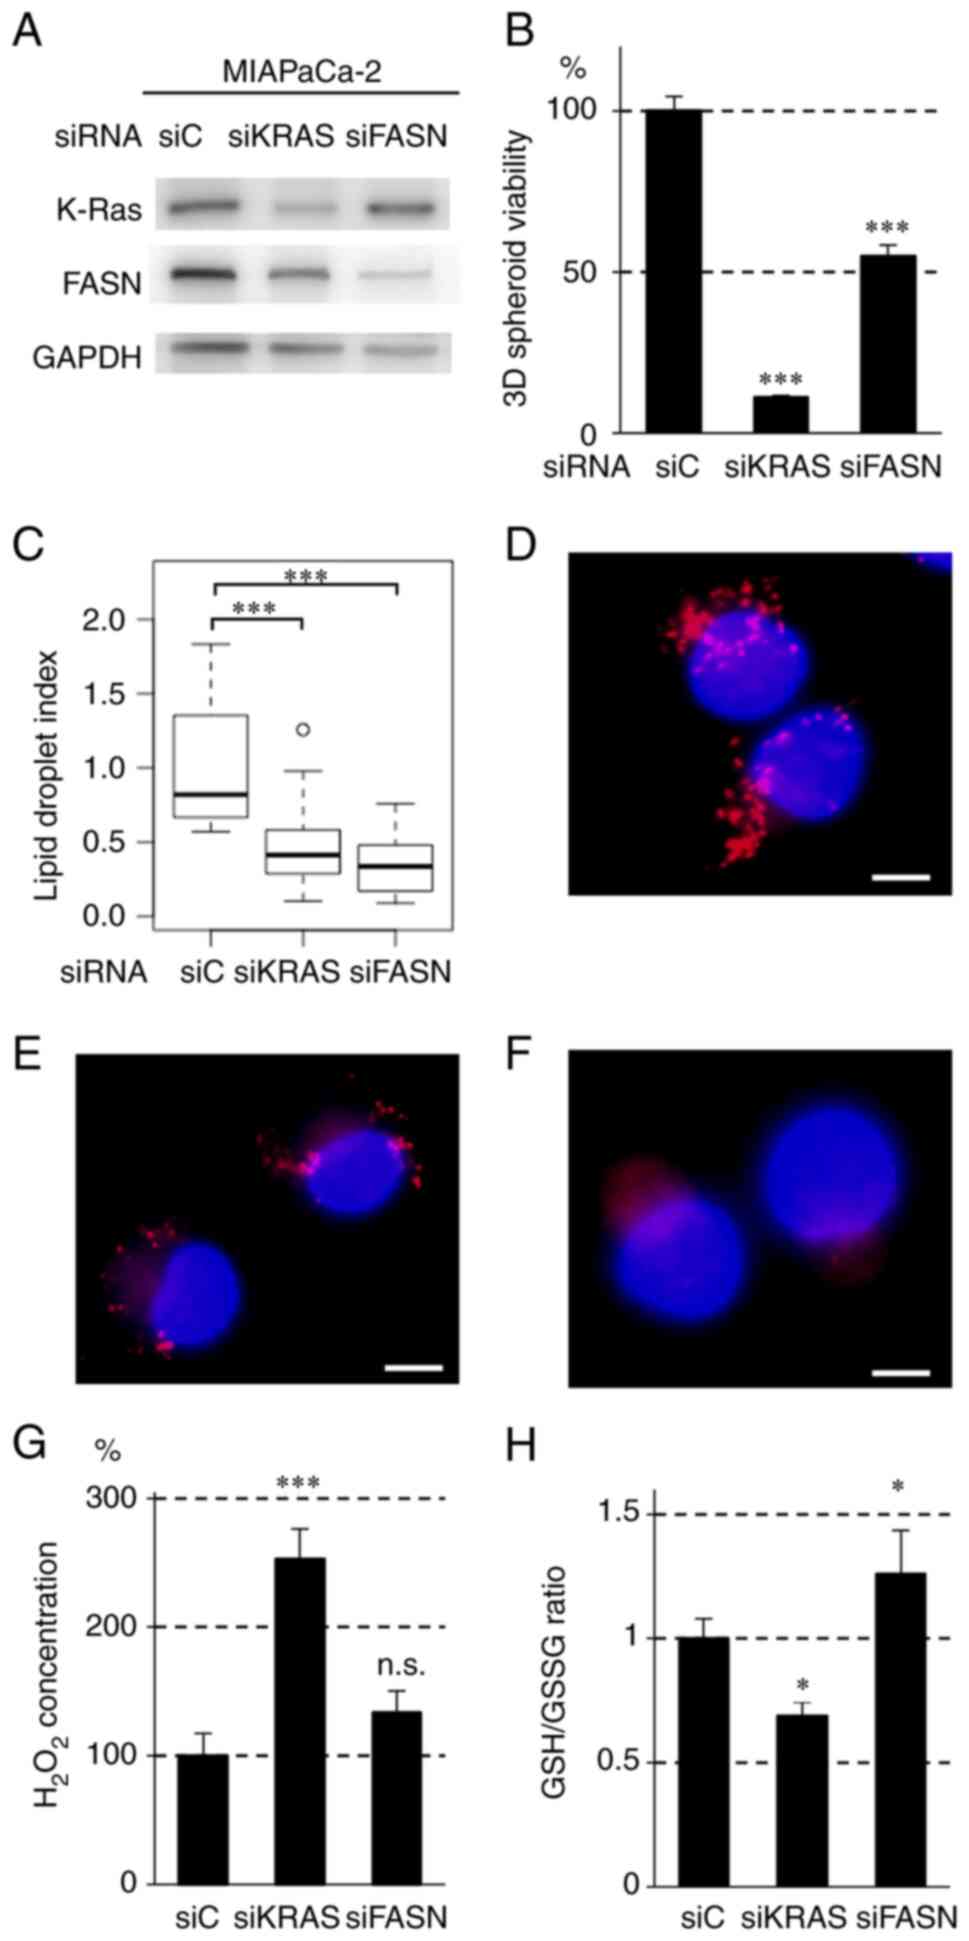 | Figure 5Effect of siRNA against KRAS (siKRAS)
and FASN (siFASN) on (B) 3D-spheroid formation, (C-F) lipogenesis
and (G and H) redox regulation in MIAPaCa-2 cells. (A) Immunoblot
analysis of MIAPaCa-2 cells treated with control (siC), siKRAS and
siFASN. A total of 1×10⁵ cells were treated with the
siRNAs for 24 h, followed by nonadherent culture for 48 h. GAPDH
was used as the internal control. (B) 3D-spheroid viability of cell
lines treated with siC, siKRAS and siFASN. A total of
1×10⁵ cells were treated with siRNA for 24 h, followed
by spheroid culture in a 96-well V-bottom plate for 72 h in
triplicate. 3D-spheroid viability was determined by measuring
adenosine triphosphate (ATP) content using the
CellTiter-Glo® 3D assay. Error bars represent standard
deviation. ***P<0.001 vs. siC using Tukey's test. (C)
Box plot of the areas of lipid droplets in MIAPaCa-2 cells treated
with siC, siKRAS and siFASN. The cells were seeded into culture
dishes at a density of 1.0×10⁵ cells/dish. When the cell
density reached ~60%, siKRAS and siFASN were added and incubated
for 72 h. The cells were fixed in 4% paraformaldehyde and stained
with LipiDyeII and DAPI. The integrated density of LipiDyeII
staining (n=20 for each group) was measured using ImageJ software
and normalized to the average of the control (siC) group. In the
plots, the box indicates the lower and upper quartiles, the
horizontal bar represents the median, the whiskers are the highest
and lowest data points that fall within 1.5 times the interquartile
range from the lower and upper quartiles and the dots are the
outliers. ***P<0.001 compared with siC using Tukey's
test. Representative images of lipid droplet formation treated with
(D) siC, (E) siKRAS and (F) siFASN for 72 h in MIAPaCa-2 cells. The
nuclei of the cells were stained with DAPI (blue) and the lipid
droplets were stained with LipiDyeII (red). Scale bars=10
µm. (G) H2O2 content in MIAPaCa-2
cells treated with siC, siKRAS and siFASN. A total of
1×10⁵ cells were treated with siKRAS and siFASN for 24
h, followed by nonadherent culture for 48 h.
H2O2 concentration in the culture medium was
determined using the Amplite fluorimetric
H2O2 kit and normalized to cellular protein
content. The bars indicate the mean ± standard deviation.
***P<0.001 compared with siC using Tukey's test.
n.s., not significant. (H) GSH/GSSG in MIAPaCa-2 cells treated with
siC, siKRAS and siFASN. A total of 1×10⁵ cells were
treated with siKRAS and siFASN for 24 h, followed by nonadherent
culture for 48 h. GSH/GSSG was determined by measuring GSH and GSSG
using the GSH/GSSG-Glo Assay kit. The bars indicate mean ± standard
deviation. *P<0.05 compared with siC using Tukey's
test. si, short interfering; KRAS, Kirsten rat sarcoma viral
oncogene homolog; FASN, fatty acid synthase; GSH, glutathione-SH;
GSSG, glutathione disulfide. |
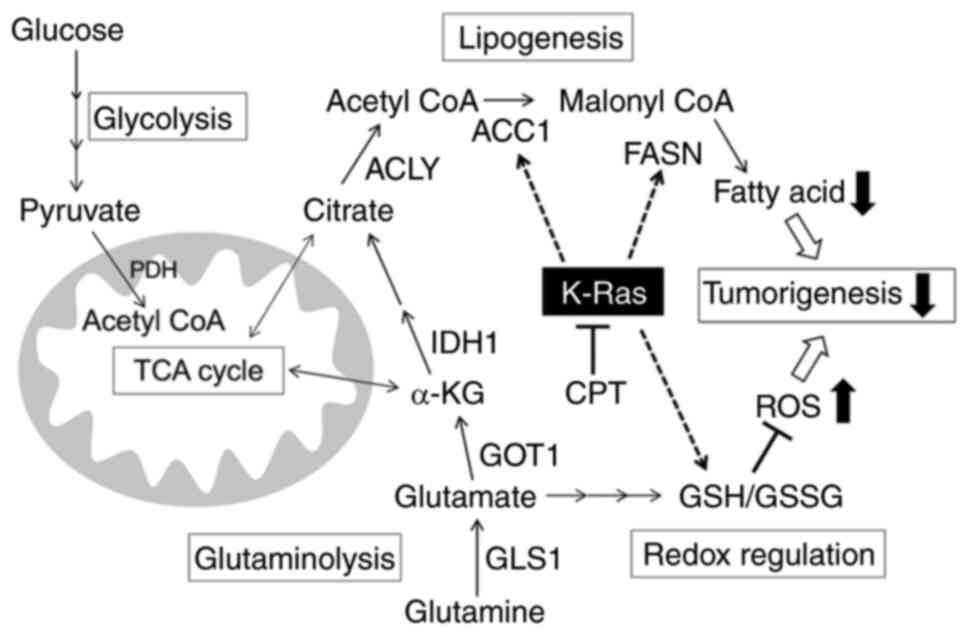 | Figure 6Schematic illustration of the
antioncogenic effect of CPT mediated by mutant K-Ras protein. KRAS,
Kirsten rat sarcoma viral oncogene homolog; CPT, cryptotanshinone;
GOT, glutamic-oxaloacetic transaminase; GLUD, glutamate transport
system permease protein; GLS, glutaminase; IDH, isocitrate
dehydrogenase; FASN, fatty acid synthase; ACC1, acetyl-CoA
carboxylase 1; ACLY, ATP-citrate lyase; ROS, oxygen species. |
Discussion
The present study initially demonstrated that the
antioncogenic effects of CPT were more pronounced in pancreatic and
CRC cells containing mutant KRAS compared with those harboring
wild-type KRAS. The 3D-spheroid growth of the cells containing
mutant KRAS was more dependent on glutamine than glucose. Moreover,
CPT treatment reduced glutamine and lipid metabolism in the
MIAPaCa-2 pancreatic cancer cell line containing mutant KRAS.
Furthermore, CPT affected redox regulation and increased ROS
production. In MIAPaCa-2 cells, CPT treatment decreased the levels
of enzymes involved in glutamine and lipid metabolism, including
GOT1, GLS, IDH1, ACLY, ACC1 and FASN, as well as K-Ras protein.
However, knockdown experiments using siRNA specific for KRAS
revealed that the downregulation of the proteins involved in lipid
metabolism, ACC1 and FASN and enhancement of ROS production was
dependent on the decreased expression of mutant K-Ras protein by
CPT. Based on these results, it was concluded that CPT is able to
suppress oncogenic growth by inhibiting lipid metabolism and
promoting ROS production in a mutant KRAS-dependent manner
(Fig. 6).
Although glucose and glutamine are important
substrates for the major anabolic pathways, glutamine was
predominantly used for cell growth in pancreatic and CRC cells
containing mutant KRAS (Fig. S2)
and the suppressive effect of CPT was also dependent on mutant KRAS
(Fig. 1). The authors previously
demonstrated that the downregulation of K-Ras protein was induced
by CPT treatment at the post-transcriptional level in pancreatic
cells (20). Mutant KRAS exhibits
downstream effects by regulating glucose, glutamine and lipid
metabolism (19). Indeed,
activated mutant KRAS is reported to upregulate GOT1 and
downregulate GLUD1 to shift glutamine metabolism from the
mitochondrial canonical pathway to the noncanonical pathway for
nicotinamide adenine dinucleotide phosphate-reduced (NADPH)
production (25). Lipogenic
enzymes, including ACLY, ACC1 and FASN, are also increased by
mutant KRAS (19), although the
underlying molecular mechanisms have not been elucidated. In the
present study, the expressions of the enzymes involved in glutamine
and lipid metabolism were decreased by CPT treatment in MIAPaCa-2
cells. However, siRNA specific for KRAS suppressed the levels of
only ACC1 and FASN, which are involved in fatty acid biosynthesis
(Figs. 4A and B and S5A). FASN knockdown did not affect the
expression of the K-Ras protein (Figs.
5A and S5B), which indicated
that KRAS regulates FASN expression upstream but that its
expression is not affected by FASN. ACC1 and FASN are involved in
fatty acid synthesis and were attenuated by mutant K-Ras protein in
this pancreatic cancer cell line. Other proteins suppressed by CPT
treatment are also regulated in a KRAS-independent manner in
MIAPacCa-2 cells, which alludes that both KRAS-dependent and
-independent pathways regulate glutamine and lipid metabolism via
CPT exposure. Although KRAS siRNA markedly suppressed (90%)
3D-spheroid formation, the degree of suppression for FASN was lower
(50%) compared with that by KRAS siRNA (Fig. 5B). With respect to ROS production,
the effect of KRAS knockdown was significantly higher than that of
FASN. Although the KRAS-dependent suppression of lipogenesis
contributes to antitumor activity and increased ROS production, its
effect is limited. In addition to K-Ras protein activity, other
KRAS-independent function(s) of CPT is considered to be required
for the complete suppression of tumorigenicity. The upregulation of
fatty acid synthesis is a classically described metabolic
alteration in cancer (15). This
process occurs via the upregulation of various lipogenic enzymes,
such as ACLY, ACC1 and FASN. FASN is a multienzyme protein that
catalyzes the synthesis of fatty acids from acetyl-CoA and
malonyl-CoA in an NADPH-dependent reaction. Increased expression of
FASN has been associated with a variety of cancers and an
association exists between higher levels of FASN and later stages
of disease as well as prognosis (25). FASN inhibitors have attracted
interest as a novel therapeutic target for cancer treatment
(15). Although a number of FASN
inhibitors have been preclinically tested, the antitumor effects of
most are pharmacologically limited and exhibit some side effects,
with only TVB-2640 entering clinical study (15). As CPT inhibits the expression of
FASN and exhibits additional antitumor effects in mouse models
(5), favorable clinical activity
is expected. CPT treatment also suppressed the expression of IDH1
and other enzymes that regulate glutamine metabolism (Figs. 2 and S3), although downregulation was
independent of K-Ras protein suppression (Figs. 4A and S5A). IDH1 is mutated or highly expressed
in a number of cancers (27).
Diminished IDH1 activity results in reduced α-ketoglutarate (αKG)
and NADPH production (25), which
results in the exhaustion of reduced glutathione and increased ROS
levels (25). Pharmacological
inhibition of IDH1 has also been reported to be effective against
certain cancers, such as glioblastoma (27). IDH1 may be a target for the
KRAS-independent antitumor effect of CPT.
The reduced form of glutathione (GSH) inhibits ROS
production (24). GSH/GSSG was
reduced and ROS production was increased following CPT treatment
and knockdown of KRAS in MIAPaCa-2 cells, which indicated that
redox and the ROS axis contributed to the mutant KRAS-dependent
antioncogenic effects of CPT (Fig.
6). FASN knockdown resulted in the suppression of lipogenesis
but did not reduce GSH/GSSG and minimally increased ROS production
(Fig. 5G and H). This finding
suggested that the KRAS-dependent suppression of lipid synthesis by
CPT was not directly involved in the promotion of ROS production in
MIAPaCa-2 cells, although reduced lipogenesis is important for the
KRAS-dependent antioncogenic effects of CPT. The KRAS-independent
function of CPT, such as the suppression of glutamine metabolism,
may serve an additional role in enhanced ROS production by
decreasing GSH/GSSG. Metabolic reprogramming and the regulation of
ROS production are closely correlated with the malignant
progression of cancer (26). To
prevent oxidative damage, cancer cells modulate metabolic
adaptation to maintain redox balance (24). The present study demonstrated that
CPT can alter the reprogrammed metabolic adaptation, including
glutamine and lipid metabolisms, to decrease GSH/GSSG and promote
ROS production. This process is detrimental to cancer cells and
suppresses 3D-spheroid formation in malignant pancreatic cancer
cells containing mutant KRAS. Previously, we showed that CPT
suppresses cancer cell invasiveness and metastasis in a mouse model
(28). Thus, CPT is expected to be
a potent therapeutic drug for KRAS-driven intractable cancers.
Supplementary Data
Availability of data and materials
All data generated or analyzed during this study are
included in this published article.
Authors' contributions
TokT, HT and HI designed the study. TokT, CJK, KM,
AU, YT and HI performed the experiments. TokT, YT and HI analyzed
and interpreted of data and also confirm the authenticity of all
the raw data. YT and HI were responsible for the statistical
analyses. TosT and SS provided the colorectal cancer cell lines.
TosT, SS, SK and AK were involved in conceiving the project and
provided several important suggestions for the research plan. TokT,
HT, YT and HI wrote the paper. All authors read and approved the
final manuscript.
Ethics approval and consent to
participate
Not applicable.
Patient consent for publication
Not applicable.
Competing interests
The authors declare that they have no competing
interests.
Acknowledgments
Not applicable.
Funding
This study was supported by the Japan Society for the Promotion
of Scientific KAKENHI (Grants-in-Aid for Scientific Research from
the Japan Society for the Promotion of Science; grant nos.
19K09687, 19K07480 and 19K07663).
Abbreviations:
|
CPT
|
cryptotanshinone
|
|
CRC
|
colorectal cancer
|
|
PDAC
|
pancreatic ductal adenocarcinoma
|
|
PDH
|
pyruvate dehydrogenase
|
|
PDK
|
pyruvate dehydrogenase kinase
|
|
siRNA
|
short interfering RNA
|
|
ROS
|
reactive oxygen species
|
|
ACC1
|
acetyl-CoA carboxylase 1
|
|
FASN
|
fatty acid synthase
|
|
ACLY
|
ATP-citrate lyase
|
|
GSH
|
glutathione-SH
|
|
GSSG
|
glutathione disulfide
|
|
NADH
|
nicotinamide adenine dinucleotide
phosphate
|
|
NADPH
|
nicotinamide adenine dinucleotide
phosphate-reduced
|
References
|
1
|
Hanahan D and Weinberg RA: Hallmarks of
cancer: The next generation. Cell. 144:646–674. 2011. View Article : Google Scholar : PubMed/NCBI
|
|
2
|
Hsu PP and Sabatini DM: Cancer cell
metabolism: Warburg and beyond. Cell. 134:703–707. 2008. View Article : Google Scholar : PubMed/NCBI
|
|
3
|
Vander Heiden MG, Cantley LC and Thompson
CB: Understanding the warburg effect: The metabolic requirements of
cell proliferation. Science. 324:1029–1033. 2009. View Article : Google Scholar : PubMed/NCBI
|
|
4
|
Sugden MC and Holness MJ: Mechanisms
underlying regulation of the expression and activities of the
mammalian pyruvate dehydrogenase kinases. Arch Physiol Biochem.
112:139–149. 2006. View Article : Google Scholar : PubMed/NCBI
|
|
5
|
Tambe Y, Hasebe M, Kim CJ, Yamamoto A and
Inoue H: The drs tumor suppressor regulates glucose metabolism via
lactate dehydrogenase-B. Mol Carcinog. 55:52–63. 2016. View Article : Google Scholar
|
|
6
|
Kinnaird A, Dromparis P, Saleme B, Gurtu
V, Watson K, Paulin R, Zervopoulos S, Stenson T, Sutendra G, Pink
DB, et al: Metabolic modulation of clear-cell renal cell carcinoma
with dichloroacetate, an inhibitor of pyruvate dehydrogenase
kinase. Eur Urol. 69:734–744. 2016. View Article : Google Scholar
|
|
7
|
Saunier E, Benelli C and Bortoli S: The
pyruvate dehydrogenase complex in cancer: An old metabolic
gatekeeper regulated by new pathways and pharmacological agents.
Int J Cancer. 138:809–817. 2016. View Article : Google Scholar
|
|
8
|
Leclerc D, Pham DN, Lévesque N, Truongcao
M, Foulkes WD, Sapienza C and Rozen R: Oncogenic role of PDK4 in
human colon cancer cells. Br J Cancer. 116:930–936. 2017.
View Article : Google Scholar : PubMed/NCBI
|
|
9
|
Trinidad AG, Whalley N, Rowlinson R,
Delpuech O, Dudley P, Rooney C and Critchlow SE: Pyruvate
dehydrogenase kinase 4 exhibits a novel role in the activation of
mutant KRAS, regulating cell growth in lung and colorectal tumour
cells. Oncogene. 36:6164–6176. 2017. View Article : Google Scholar : PubMed/NCBI
|
|
10
|
Stacpoole PW: Therapeutic targeting of the
pyruvate dehydrogenase complex/pyruvate dehydrogenase kinase
(PDC/PDK) axis in cancer. J Natl Cancer Inst. 109:2017. View Article : Google Scholar : PubMed/NCBI
|
|
11
|
Sutendra G and Michelakis ED: Pyruvate
dehydrogenase kinase as a novel therapeutic target in oncology.
Front Oncol. 3:382013. View Article : Google Scholar : PubMed/NCBI
|
|
12
|
Qin C, Yang G, Yang J, Ren B, Wang H, Chen
G, Zhao F, You L, Wang W and Zhao Y: Metabolism of pancreatic
cancer: Paving the way to better anticancer strategies. Mol Cancer.
19:502020. View Article : Google Scholar : PubMed/NCBI
|
|
13
|
Faubert B, Solmonson A and DeBerardinis
RJ: Metabolic reprogramming and cancer progression. Science.
368:eeaw54732020. View Article : Google Scholar
|
|
14
|
Chen M and Hang J: The expanded role of
fatty acid metabolism in cancer: New aspects and targets. Precis
Clin Med. 2:183–191. 2019. View Article : Google Scholar : PubMed/NCBI
|
|
15
|
Wang W, Bai L, Li W and Cui J: The lipid
metabolic landscape of cancers and new therapeutic perspectives.
Front Oncol. 10:6051542020. View Article : Google Scholar : PubMed/NCBI
|
|
16
|
Mustachio LM, Chelariu-Raicu A, Szekvolgyi
L and Roszik J: Targeting KRAS in cancer: Promising therapeutic
strategies. Cancers (Basel). 13:10242021. View Article : Google Scholar
|
|
17
|
Han CW, Jeong MS and Jang SB: Understand
KRAS and the quest for anti-cancer drugs. Cells. 10:8422021.
View Article : Google Scholar : PubMed/NCBI
|
|
18
|
Kaek SA, Papagiannakopoulos T, Shah YM and
Lyssiotis CA: Metabolic networks in mutant KRAS-driven tumours:
Tissue specificities and the microenvironment. Nat Rev Cancer.
21:510–525. 2021. View Article : Google Scholar
|
|
19
|
Muyinda IJ, Park JG, Jang EJ and Yoo BC:
KRAS, A prime mediator in pancreatic lipid synthesis through extra
mitochondrial glutamine and citrate metabolism. Int J Mol Sci.
22:50702021. View Article : Google Scholar : PubMed/NCBI
|
|
20
|
Tambe Y, Terado T, Kim CJ, Mukaisho K,
Yoshida S, Sugihara H, Tanaka H, Chida J, Kido H, Yamaji K, et al:
Antitumor activity of potent pyruvate dehydrogenase kinase 4
inhibitors from plants in pancreatic cancer. Mol Carcinog.
58:1726–1737. 2019. View Article : Google Scholar : PubMed/NCBI
|
|
21
|
Shirasawa S, Furuse M, Yokoyama A and
Sasazuki T: Altered growth of human colon cancer cell lines
disrupted at activated Ki-ras. Science. 260:85–88. 1993. View Article : Google Scholar : PubMed/NCBI
|
|
22
|
Chang L, Fang S, Chen Y, Yang Z, Yuan Y,
Zhang J, Ye L and Gu W: Inhibition of FASN suppresses the malignant
biological behavior of non-small cell lung cancer cells via
deregulating glucose metabolism and AKT/ERK pathway. Lipids Health
Dis. 18:1182019. View Article : Google Scholar : PubMed/NCBI
|
|
23
|
Pecot CV, Wu SY, Bellister S, Filant J,
Rupaimoole R, Hisamatsu T, Bhattacharya R, Maharaj A, Azam S,
Rodriguez-Aguayo C, et al: Therapeutic silencing of KRAS using
systemically delivered siRNAs. Mol Cancer Ther. 13:2876–2885. 2014.
View Article : Google Scholar : PubMed/NCBI
|
|
24
|
Hayes JD, Dinkova-Kostova AT and Tew KD:
Oxidative stress in cancer. Cancer Cell. 38:167–197. 2020.
View Article : Google Scholar : PubMed/NCBI
|
|
25
|
Sang-Min J, Navdeep SC and Nissim H: AMPK
regulates NADPH homeostasiss to promote tumour cell survival during
energy stress. Nature. 485:661–665. 2012. View Article : Google Scholar
|
|
26
|
Bueno MJ and Quintela-Fandino M: Emerging
role of fatty acid synthase in tumor initiation: Implications for
cancer prevention. Mol Cell Oncol. 7:e17093892020. View Article : Google Scholar
|
|
27
|
Molenaar RJ, Maciejewski JP, Wilmink JW
and van Noorden CJ: Wild-type and mutated IDH1/2 enzymes and
therapy responses. Oncogene. 37:1949–1960. 2018. View Article : Google Scholar : PubMed/NCBI
|
|
28
|
Kim CJ, Terado T, Tambe Y, Mukaisho K,
Kageyama S, Kawauchi A and Inoue H: Cryptotanshinone, a novel PDK4
inhibitor, suppresses bladder cancer cell invasiveness via the
mTOR/β-catenin/N-cadherin axis. Int J Oncol. 59:402021. View Article : Google Scholar
|