Introduction
Malignant glioma is the most common and severe
primary malignant intracranial tumor in adults with higher
morbidity and recurrence. The current standard of care for newly
diagnosed glioma is maximal safe resection followed by radiotherapy
along with concomitant and adjuvant temozolomide (1). Relatively poor prognosis, fast
recurrence and multi-drug resistance are some of the main
challenges in combating brain tumors (2,3).
Therefore, there is an urgent need to determine novel molecular
targets in gliomas to develop more potent and effective therapies
for patients. Although large-scale genome sequencing efforts have
defined oncogenes and tumor suppressor genes mutation in glioma,
most of these mutations have not been subjected to targeted therapy
(4). Thus, a deeper insight into
the biology properties and vulnerabilities of these tumor can
potentially yield therapeutic impact.
Metabolic reprogramming is one of the hallmarks of
cancer because tumors can alter metabolic pathways to meet the
biosynthetic, bioenergetic and redox requirements of malignancy. In
addition, elevated lipid metabolism is a common pathophysiological
characteristic of metabolic diseases and cancer (5-7).
Alterations in the metabolism of fatty acids has received renewed
interest in cancer research because, in addition to their main
function as structural components of the membrane matrix, they are
important secondary messengers and can serve as fuel sources for
energy production (7). In these
processes, sterol regulatory element-binding proteins (SREBPs) have
a critical regulatory function. SREBPs are a family of
transcription factors that control the expression of genes
important for the uptake and synthesis of cholesterol, fatty acids
and phospholipids (8,9). The activity of these genes is
regulated by SREBP cleavage-activating protein (SCAP), which is a
polytopic membrane protein that forms complexes with membrane-bound
SREBPs in the endoplasmic reticulum (ER) (10).
Several researchers investigating metabolism
reprogramming in tumor tissue have attempted to elucidate the
interactions between oncogenic signaling and cell metabolic
processes. In this context, glial-derived neurotrophic factor
(GDNF) is highly expressed in a number of human cancers without
mutation (11,12). The ligand-binding component of GDNF
is a glycosyl-phosphatidylinositol-anchored GDNF family receptor a
1 (GFRa1), which is a well-characterized oncogene that only
associates with its transmembrane co-receptor rearranged during
transfection (RET) following ligand binding (13,14).
Elevated GDNF expression enhances RET activation, which is crucial
for the development and progression of gliomas (12,15-18).
The ERK pathway is one the most important signaling cascades among
all MAPK signal transduction pathways, which is required for RET
induced proliferation (19) and
lipid metabolism (20). Previous
studies have indicated that elevated GDNF/RET signaling is
associated with additional glucose absorption or lipid metabolism
in tumorigenesis (21,22). However, the molecular mechanisms
underlying the correlation between GDNF/RET/ERK signaling and
dysregulated glycolipid-metabolism in glioma have remained largely
unknown. In the present study, the activation of GDNF/RET/ERK
signaling promoted the hexosamine biosynthetic pathway (HBP) and
cascade-induced lipid metabolism. In addition, HBP was crucial for
the correlation between oncogenic signaling and fuel availability
to SREBP-1-dependent lipid metabolism.
Materials and methods
Reagents and samples
Sodium pyruvate (cat. no. P5280), lactate (cat. no.
1614308), D-glucose (cat. no. NIST917C), GlcNAc (cat. no. A3286),
RPI-1 (cat. no. R8907), azaserine (cat. no. A4142), tunicamycin
(cat. no. T7765) and OSMI-1 (cat. no. SML1621) were purchased from
MilliporeSigma. Glioma and normal brain tissue samples were
collected from the Department of Neurosurgery, First Affiliated
Hospital of Zhengzhou University between August 2019 and September
2021. Tumors were classified histopathologically according to the
2016 World Health Organization classification (23). The study was approved by the ethics
committee of the First Affiliated Hospital of Zhengzhou University
(approval no. 2020-KY-155).
Cell culture
U251 and U87 human glioma cell lines were purchased
from the American Type Culture Collection, the cell lines were
authenticated by short tandem repeat (STR) analysis (HKGENE, Inc.).
All cell lines were normally cultured in complete Dulbecco's
modified eagle medium (DMEM; Thermo Fisher Scientific, Inc.)
supplemented with 10 mM glucose, 10% fetal bovine serum (HyClone;
Cytiva), 100 U/ml penicillin-streptomycin (HyClone; Cytiva) and 2
mM glutamine in a humidified atmosphere of 5% CO2 at
37°C. Cells in the mid-log phase of growth were used for the
experiments.
Transfection of siRNA
U251 and U87 human glioma cells were transfected at
80% confluence with SCAP siRNA (cat. no. sc-36462; Santa Cruz
Biotechnology, Inc.), hypoxia-inducible factor 1 (HIF-1) siRNA
(cat. no. sc-35561; Santa Cruz Biotechnology, Inc.), SREBP-1 siRNA
(cat. no. sc-36557; Santa Cruz Biotechnology, Inc.) and control
siRNA (cat. no. sc-37007; Santa Cruz Biotechnology, Inc.) using
Lipofectamine® 2000 (Invitrogen; Thermo Fisher
Scientific, Inc.) according to the manufacturer's instructions.
Briefly, prior to treatment, Lipofectamine® 2000
(Invitrogen; Thermo Fisher Scientific, Inc.)/siRNA complexes were
prepared in Opti-MEM medium, at the ratio of 1 μl
Lipofectamine 2000 per 20 pmole siRNA. Cells then were then treated
at 37°C for 48 h before being replaced with complete medium for the
desired duration. The transfection efficiency of the cells was
verified by western blotting.
Cell proliferation assays
Cell proliferation assays was performed as
previously described (24).
Briefly, U251 (1×10⁴/cells/200 μl), U87
(1×10⁴/cells/200 μl) glioma cells were seeded
onto 96-well microplate and cultured at 37°C for 24 h and then
treated with target compounds at given concentrations at 37°C for
indicated periods. The cytotoxicity to glioma cells was determined
with an MTT assay. Viability was expressed as a ratio to the
absorbance value at 490 nm of the control cells, and the OD value
was measured using a microplate reader (BioTek Instruments,
Inc.).
Synergy analysis
A synergy analysis was performed as previously
described (24). Briefly, the
Chou-Talalay method and CalcuSyn software (version 1.0) (25) were used to determine the dose
effect of combination therapy. For this synergy analysis, RPI-1 was
combined with Fatostatin at a constant ratio for glioma cells at a
dosage determined by the IC50 of each drug. Interaction
was quantified based on a combination index (CI) to assess
synergism (CI <1), additive effect (CI=1), and antagonism (CI
>1).
Western blotting
The collected U251, U87 glioma cells and tissue
lysates were prepared using RIPA buffer (Beyotime Institute of
Biotechnology) and total protein concentration was quantified using
a bicinchoninic acid (BCA) assay kit. For the SCAP glycosylation
analysis, the protein samples were treated with PNGase F according
to the manufacturer's instructions (MilliporeSigma). Equal protein
amounts (30–50 μg) were electrophoresed on 10% sodium
dodecyl-sulfate polyacrylamide gel electrophoresis gels and the
separated proteins were transferred to polyvinylidene difluoride
membranes. After blocking with 5% skim milk at room temperature for
2 h, the membranes were probed with primary antibodies against
acetyl CoA carboxylase (ACC; 1:1,000; cat. no. 3662, Cell Signaling
Technology, Inc.), HIF-1 (1:1,000; cat. no. 36169, Cell Signaling
Technology, Inc.), SCAP (1:1,000; cat. no. 13102, Cell Signaling
Technology, Inc.), SREBP-1 (1:1,000; cat. no. sc-365513, Santa Cruz
Biotechnology, Inc.), fatty acid synthase (FASN) (1:1,000; cat. no.
3180, Cell Signaling Technology, Inc.), RET (1:1,000; cat. no.
14556, Cell Signaling Technology, Inc.), phosphorylated (p)-RET
(1:1,000; cat. no. SAB4504530, MilliporeSigma), ERK (1:1,000; cat.
no. 5013, Cell Signaling Technology, Inc.), p-ERK (1:1,000; cat.
no. 4370, Cell Signaling Technology, Inc.), stearoylCoA
desaturase-1 (SCD1) (1:1,000; cat. no. 2794, Cell Signaling
Technology, Inc.), β-tubulin (1:1,000; cat. no. 2128, Cell
Signaling Technology, Inc.) and lamin B (1:1,000; cat. no. 13435,
Cell Signaling Technology, Inc.), at 4°C for 12 h. Subsequently,
the membranes were incubated with HRP-conjugated goat anti-rabbit
IgG (1:5,000; cat. no. ZB-2301; OriGene Technologies, Inc.) or
HRP-conjugated goat anti-mouse IgG (1:5,000; cat. no. ZB-2305,
ZSGB-BIO; OriGene Technologies, Inc.) secondary antibodies at room
temperature for 2 h. Immunoreactivity was visualized using the
Odyssey Infrared Imaging System (LI-COR Biosciences).
Reverse transcription-quantitative (RT-q)
PCR
RT-qPCR assays was performed as previously described
(24). Briefly, U251
(1×10⁶/cells/5 ml) and U87 (1×10⁶/cells/5 ml)
glioma cells were plated in 60 mm dishes and allowed to grow to
60–70% confluence and then treated with target compounds at given
concentrations at 37°C for 24 h. Total RNA from the U251 and U87
glioma cells was extracted using a TRIzol® reagent
(Invitrogen, Thermo Fisher Scientific, Inc.). Following which, the
RNA was reverse-transcribed to cDNA using Trans-Script First-Strand
cDNA Synthesis SuperMix (TransGen Biotech Co. AT301); both
procedures were performed according to the manufacturer's
instructions. RT-qPCR reactions were performed using a SYBR green
PCR master mix (TransGen Biotech, China) on a MxPro-Mx3005P
real-time PCR system (Agilent Technologies, USA) and β-tubulin was
used as the control. The qPCR conditions were as follows: Initial
denaturation at 95°C for 30 sec; followed by 40 cycles of
denaturation at 95°C for 15 sec, annealing at 60°C for 30 sec and
extension at 72°C for 30 sec. The relative expression of target
genes was calculated using the 2-ΔΔCq method (26). The following primers were used:
β-tubulin, F: 5′-GTG GTA CGG AAG GAG GCA GAG A-3′, R: 5′-AAC GGA
GGC AGG TGG TGA CA-3′; GDNF, F: 5′-TCA CTG ACT TGG GTC TGG G-3′, R:
5′-TCA AAG GCG ATG GGT CTG C-3′; SREBP-1, F: 5′-CCA TGG ATT GCA CTT
TCG AA-3′, R: 5′-CCA GCA TAG GGT GGG TCA AA-3′; SCD1, F: 5′-CAC TTG
GGA GCC CTG TAT GG-3′, R: 5′-TGA GCT CCT GCT GTT ATG CC-3′; FASN,
F: 5′-TGA GCA CAG ACG AGA GCA CCT T-3′, R: 5′-CGA TGT TGT AGA TGG
CGG CTG AG-3′; ACC, F: 5′-TTC ACT CCA CCT TGT CAG CGG A-3′, R:
5′-GTC AGA GAA GCA GCC CAT CAC T-3′.
Immunof luorescence and
immunohistochemistry
Immunofluorescence analysis was performed as
previously described (24).
Briefly, the treated cells were immunostained with an antibody to
SREBP-1 (1:100; cat. no. sc-365513, Santa Cruz Biotechnology, Inc.)
at 4°C overnight and subsequently incubated with
fluorochrome-conjugated secondary antibody (1:100; cat. no.
ZF-0311; OriGene Technologies, Inc.) for 0.5 h at room temperature
in darkness. The nuclei were counterstained with DAPI at room
temperature for 20 min. The SREBP-1 expression was monitored by
confocal microscopy. Quantitative evaluation of SREBP-1 nuclear
intensity was performed with ImageJ (v 1.8, National Institutes of
Health).
Glucose uptake assay
U251 (1×10⁵/cells/500 μl) and U87
(1×10⁵/cells/500 μl) glioma cells were plated in
48-well microplate and cultured at 37°C for 24 h and then treated
with target compounds at given concentrations at 37°C for 24, 48 or
72 h. Subsequently, 50 μM 2-NBDG (cat. no. 72987;
MilliporeSigma) was added to the cells at 37°C for 1 h and the U251
and U87 glioma cells were washed in Hank's balanced salt solution
buffer for three times. The fluorescent intensity was then measured
using laser confocal microscopy at excitation and emission
wavelengths of 467 and 542 nm, respectively.
Comparative expression and survival
analysis
The preprocessed level 3 RNA-seq data and
corresponding clinical information of cancer patients were
collected from The Cancer Genome Atlas (TCGA) database (http://cancergenome.nih.gov/) and the normal samples
RNA data were acquired from the Genotype-Tissue Expression (GTEx)
databases (https://www.gtexportal.org/).
Statistical analysis
The experiments were independently performed in
triplicate and the results were presented as mean values ± standard
deviation. Unpaired student's t-test was used to analyze the
differences between two groups and one-way analysis of variance
(ANOVA) followed by Tukey's test was used for the comparison among
multiple groups. Patients were divided into high and low groups
according to the 50% cut off point of GDNF and SREBP-1 expression
and Kaplan-Meier survival analysis was used to analyzed
significance between groups. All statistical analyses and
experimental graphs were performed by GraphPad Prism version 8.0
software (GraphPad Software, Inc.). P<0.05 was considered to
indicate a statistically significant difference.
Results
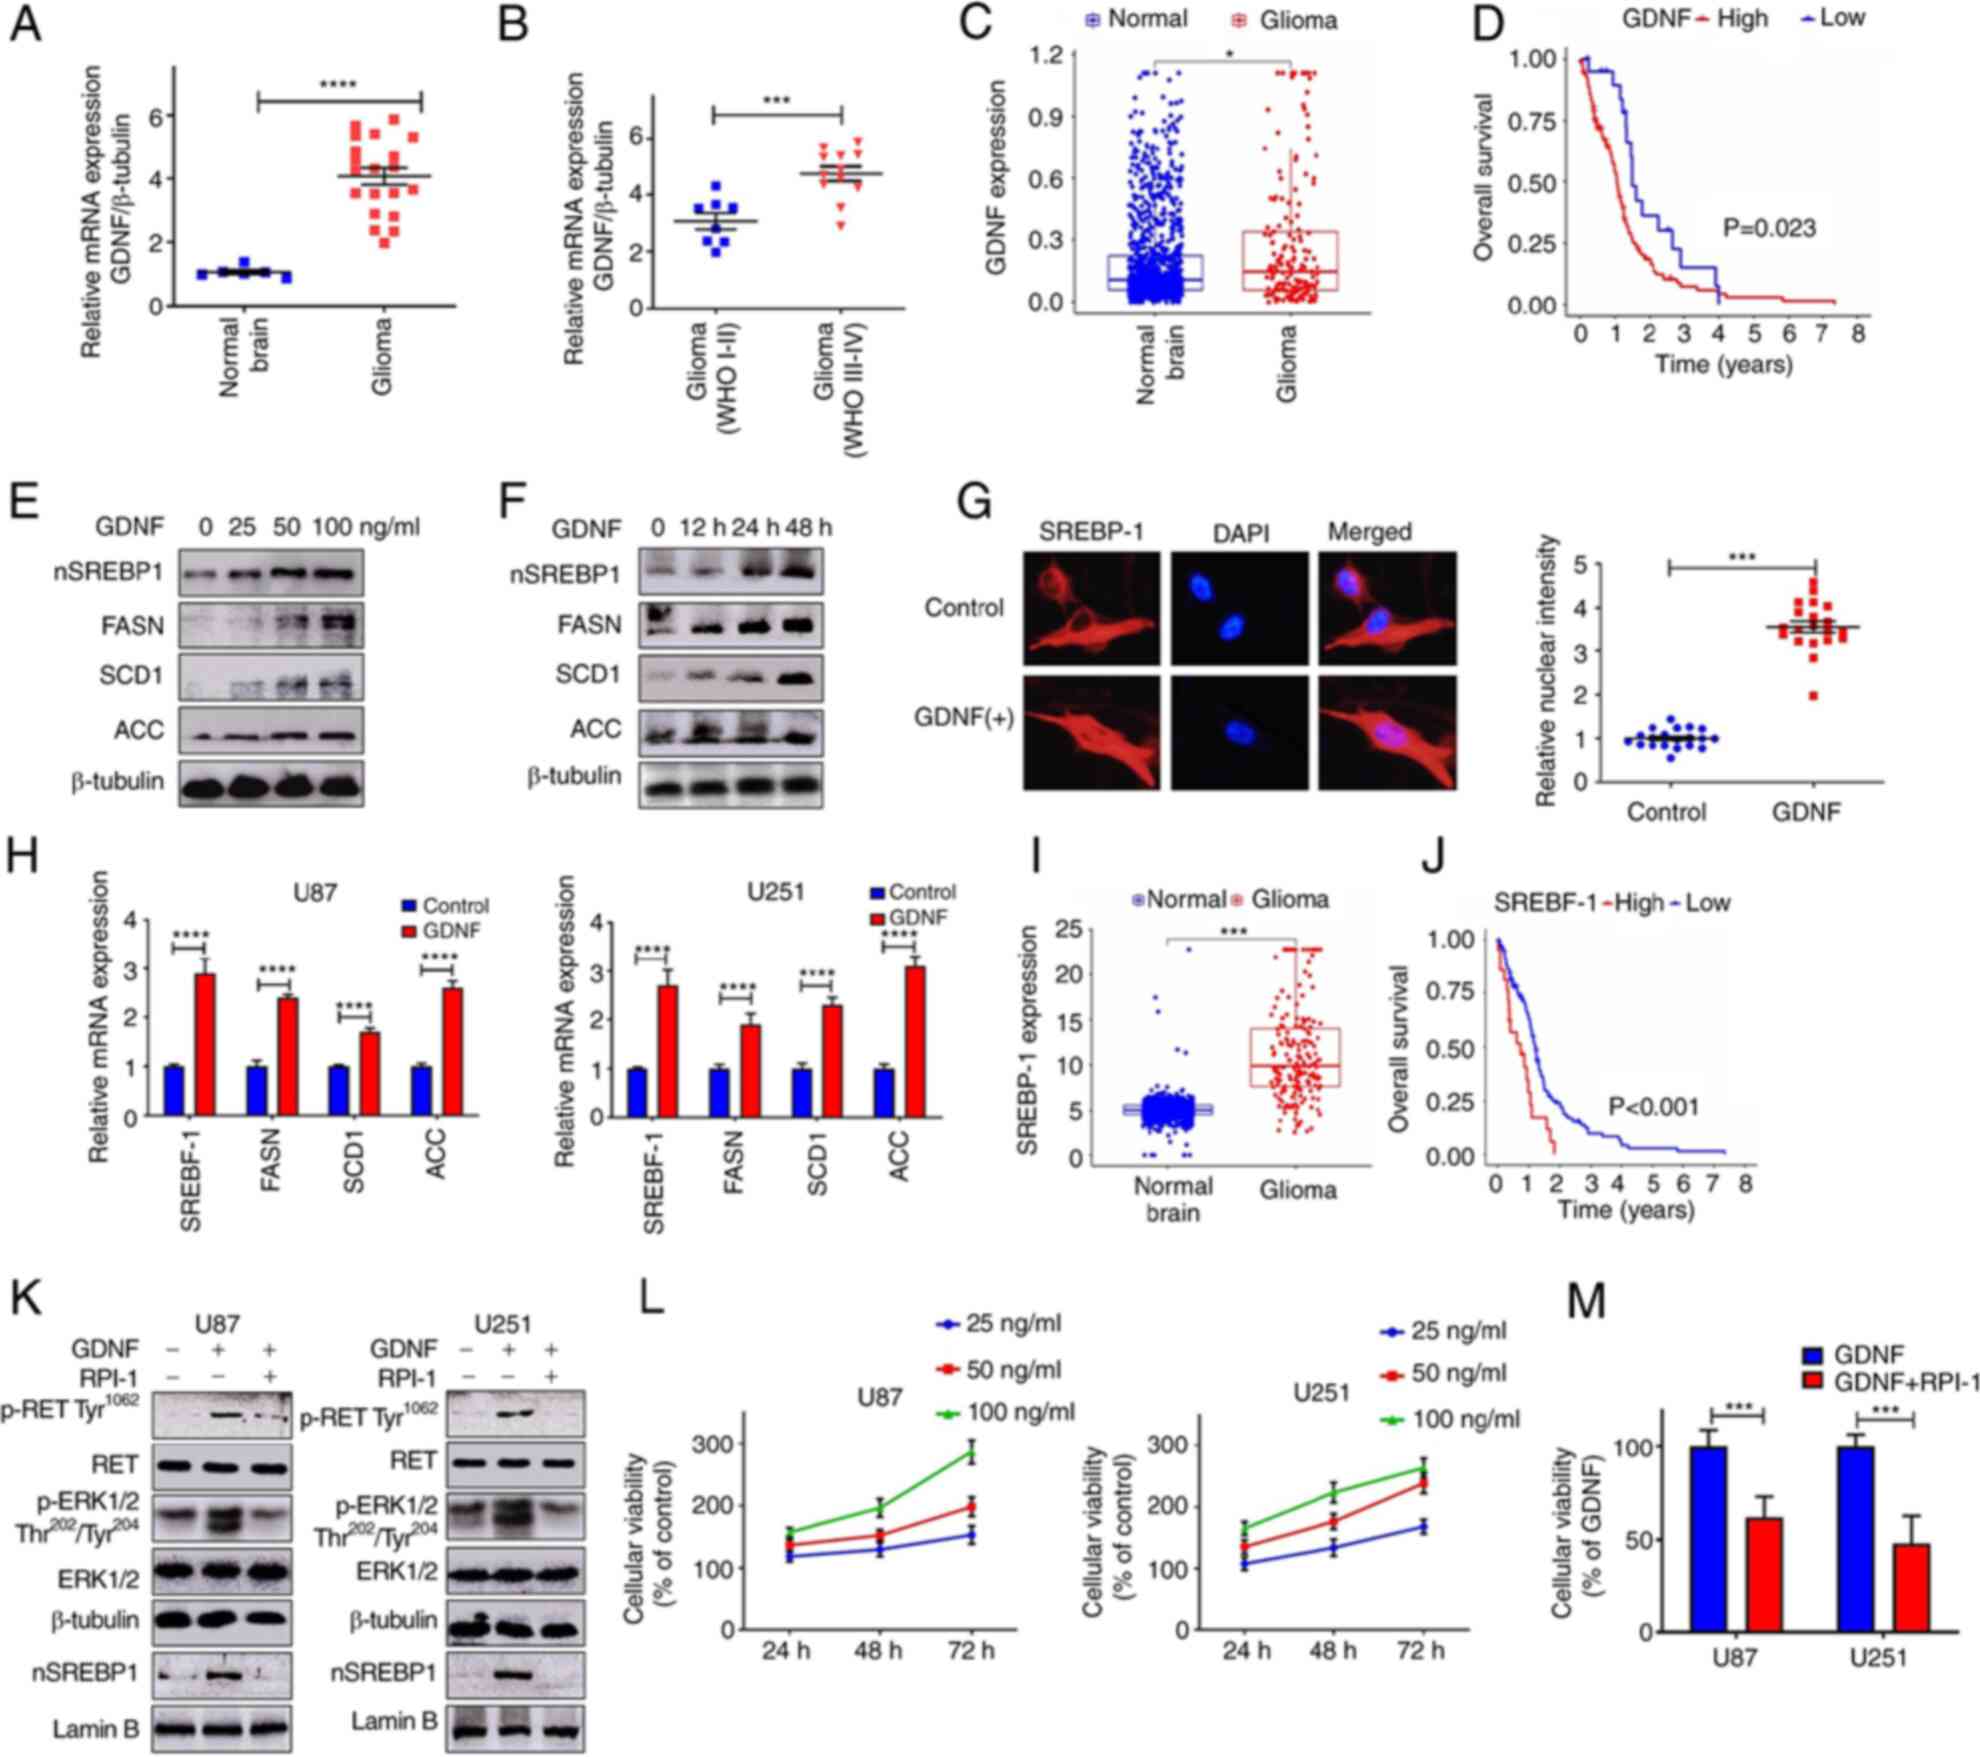
GDNF/RET signaling is upregulated in
glioma and promotes lipid metabolism
The relative expression level of GDNF mRNA in normal
brain and in low- and high-grade glioma tissues was determined by
RT-qPCR. The results indicated that GDNF mRNA expression was
upregulated in glioma compared to normal tissue (Fig. 1A). In addition, GDNF mRNA levels
increased with pathological grade of glioma tissue (Fig. 1B). The GDNF mRNA levels between
normal brain tissue and glioma tissue were then compared using RNA
sequencing (RNA-seq) data from the GTEx database and The Cancer
Genome Atlas (TCGA) database (http://cancergenome.nih.gov/). The results also showed
that GDNF expression were upregulated in glioma compared to normal
human tissue (Fig. 1C) and high
GDNF gene expression was associated with poor prognosis in glioma
(Fig. 1D).
 | Figure 1GDNF/RET signaling is upregulated in
glioma and promote lipid metabolism. mRNA expression of GDNF normal
brain tissues and glioma (A) RT-qPCR and (C) TCGA data analysis.
(B) Association between GDNF expression and degree of malignancy
(RT-qPCR). (D) Survival curves for patients with low and high GDNF
mRNA expression levels in glioma (TCGA database). Western blot
analysis of total cell lysates (FASN, SCD1, ACC) or nuclear
extracts (nSREBP-1) from U251 and U87 glioma cells cultured in DMEM
complete medium with (E) different dose of GDNF for 48 h or (F)
with 50 ng/ml GDNF at indicated times. (G) Immunofluorescence
staining of SREBP-1 (red) and DAPI (blue) from U251 glioma cells
were cultured in DMEM complete medium and treated with 50 ng/ml
GDNF for 48 h. Quantitative evaluation of SREBP-1 nuclear intensity
with ImageJ (n=20). Images were captured at x200 magnification. (H)
RT-qPCR analysis of mRNA levels in U251 and U87 glioma cells
cultured in DMEM complete medium with or without GDNF (50 ng/ml)
for 24 h. (I) SREBP-1 mRNA expression in normal brain tissues and
glioma (TCGA data analysis). (J) Survival curves for patients with
low and high SREBP-1 mRNA expression levels in glioma (TCGA
database). (K) Western blot analysis of p-RET, p-ERK and nSREBP-1
levels in U251 and U87 glioma cells that were cultured in DMEM
complete medium with or without 50 ng/ml GDNF in the presence or
absence of 20 μM RPI-1 (GDNF/RET inhibitor) for 48 h. (L)
U251 and U87 glioma cells cultured in DMEM complete medium with
different dose of GDNF for 48 h or with 50 ng/ml GDNF at indicated
times. Relative viability of glioma cells detected by MTT assay.
(M) Relative viability of glioma cell cultured in DMEM complete
medium with 50 ng/ml GDNF in the presence or absence of 20
μM RPI-1 for 48 h. Significance was determined by unpaired
Student's t test (*P<0.01, ***P<0.001,
****P<0.0001). GDNF, glial-derived neurotrophic
factor; RET, rearranged during transfection; RT-qPCR, reverse
transcription-quantitative PCR; TCGA, The Cancer Genome Atlas;
FASN, fatty acid synthase; SCD1, stearoylCoA desaturase-1; ACC,
acetyl CoA carboxylase; SREBP-1, sterol regulatory element-binding
protein-1; p-, phosphorylated. |
In the presence of GDNF, SREBP-1 was activated
(nSREBP-1) in a dose- and time-dependent manner. In addition, there
was an increase in the protein levels of FASN, SCD1 and ACC, which
are downstream targets genes of SREBP-1 (Fig. 1E and F). The immunofluorescence
analysis showed that the nuclear fluorescence intensity of the
SREBP-1 signal was significantly higher in U251 glioma cells
treated with GDNF than in control cells (Fig. 1G). The RT-qPCR results showed that
GDNF stimulation enhanced the SREBP-1 expression and activated the
expression of SREBP-1 regulated genes involved in lipid metabolism
(Fig. 1H). However, SREBP-1
expression in gliomas and its relationship with tumor malignancy
remains to be elucidated.
The mRNA expression of SREBP-1 was more enriched in
glioma than in normal human brain tissues, according to the RNA-seq
data from the GTEx database and The Cancer Genome Atlas (TCGA)
database (Fig. 1I). Therefore, it
was decided to explore the prognostic value of SREBP-1 in gliomas
based on the TCGA datasets. The results showed that glioma patients
with higher SREBP-1 expression presented worse overall survival
than those with lower SREBP-1 expression (Fig. 1J). Furthermore, the results of the
present study showed that GDNF activates SREBP-1 through the
RET/ERK signaling pathway (Fig.
1K). Therefore, GDNF pharmacologically blocked the activity of
RET/ERK signaling with RPI-1 (GDNF/RET inhibitor), which
significantly reduced the SREBP-1 activity (nSREBP-1; Fig. 1K). The MTT assay demonstrated that
GDNF significantly promoted glioma cell proliferation in a dose-
and time-dependent manner and that the inhibition of RET/ERK
signaling could significantly reverse this biological effect
(Fig. 1L and M).
GDNF was overexpressed in glioma and was associated
with poor clinical outcome and highly expressed GDNF promoted the
expression of SREBP-1, which is a transcription factor with a
central role in lipid metabolism. Accordingly, patients with high
expression of SREBP-1 presented poor prognosis. Although the
present study revealed that SREBP-1 was activated by the
GDNF/RET/ERK signaling pathway, the mechanisms underlying the
oncogenic signaling to the SREBP-1 function remains to be
elucidated.
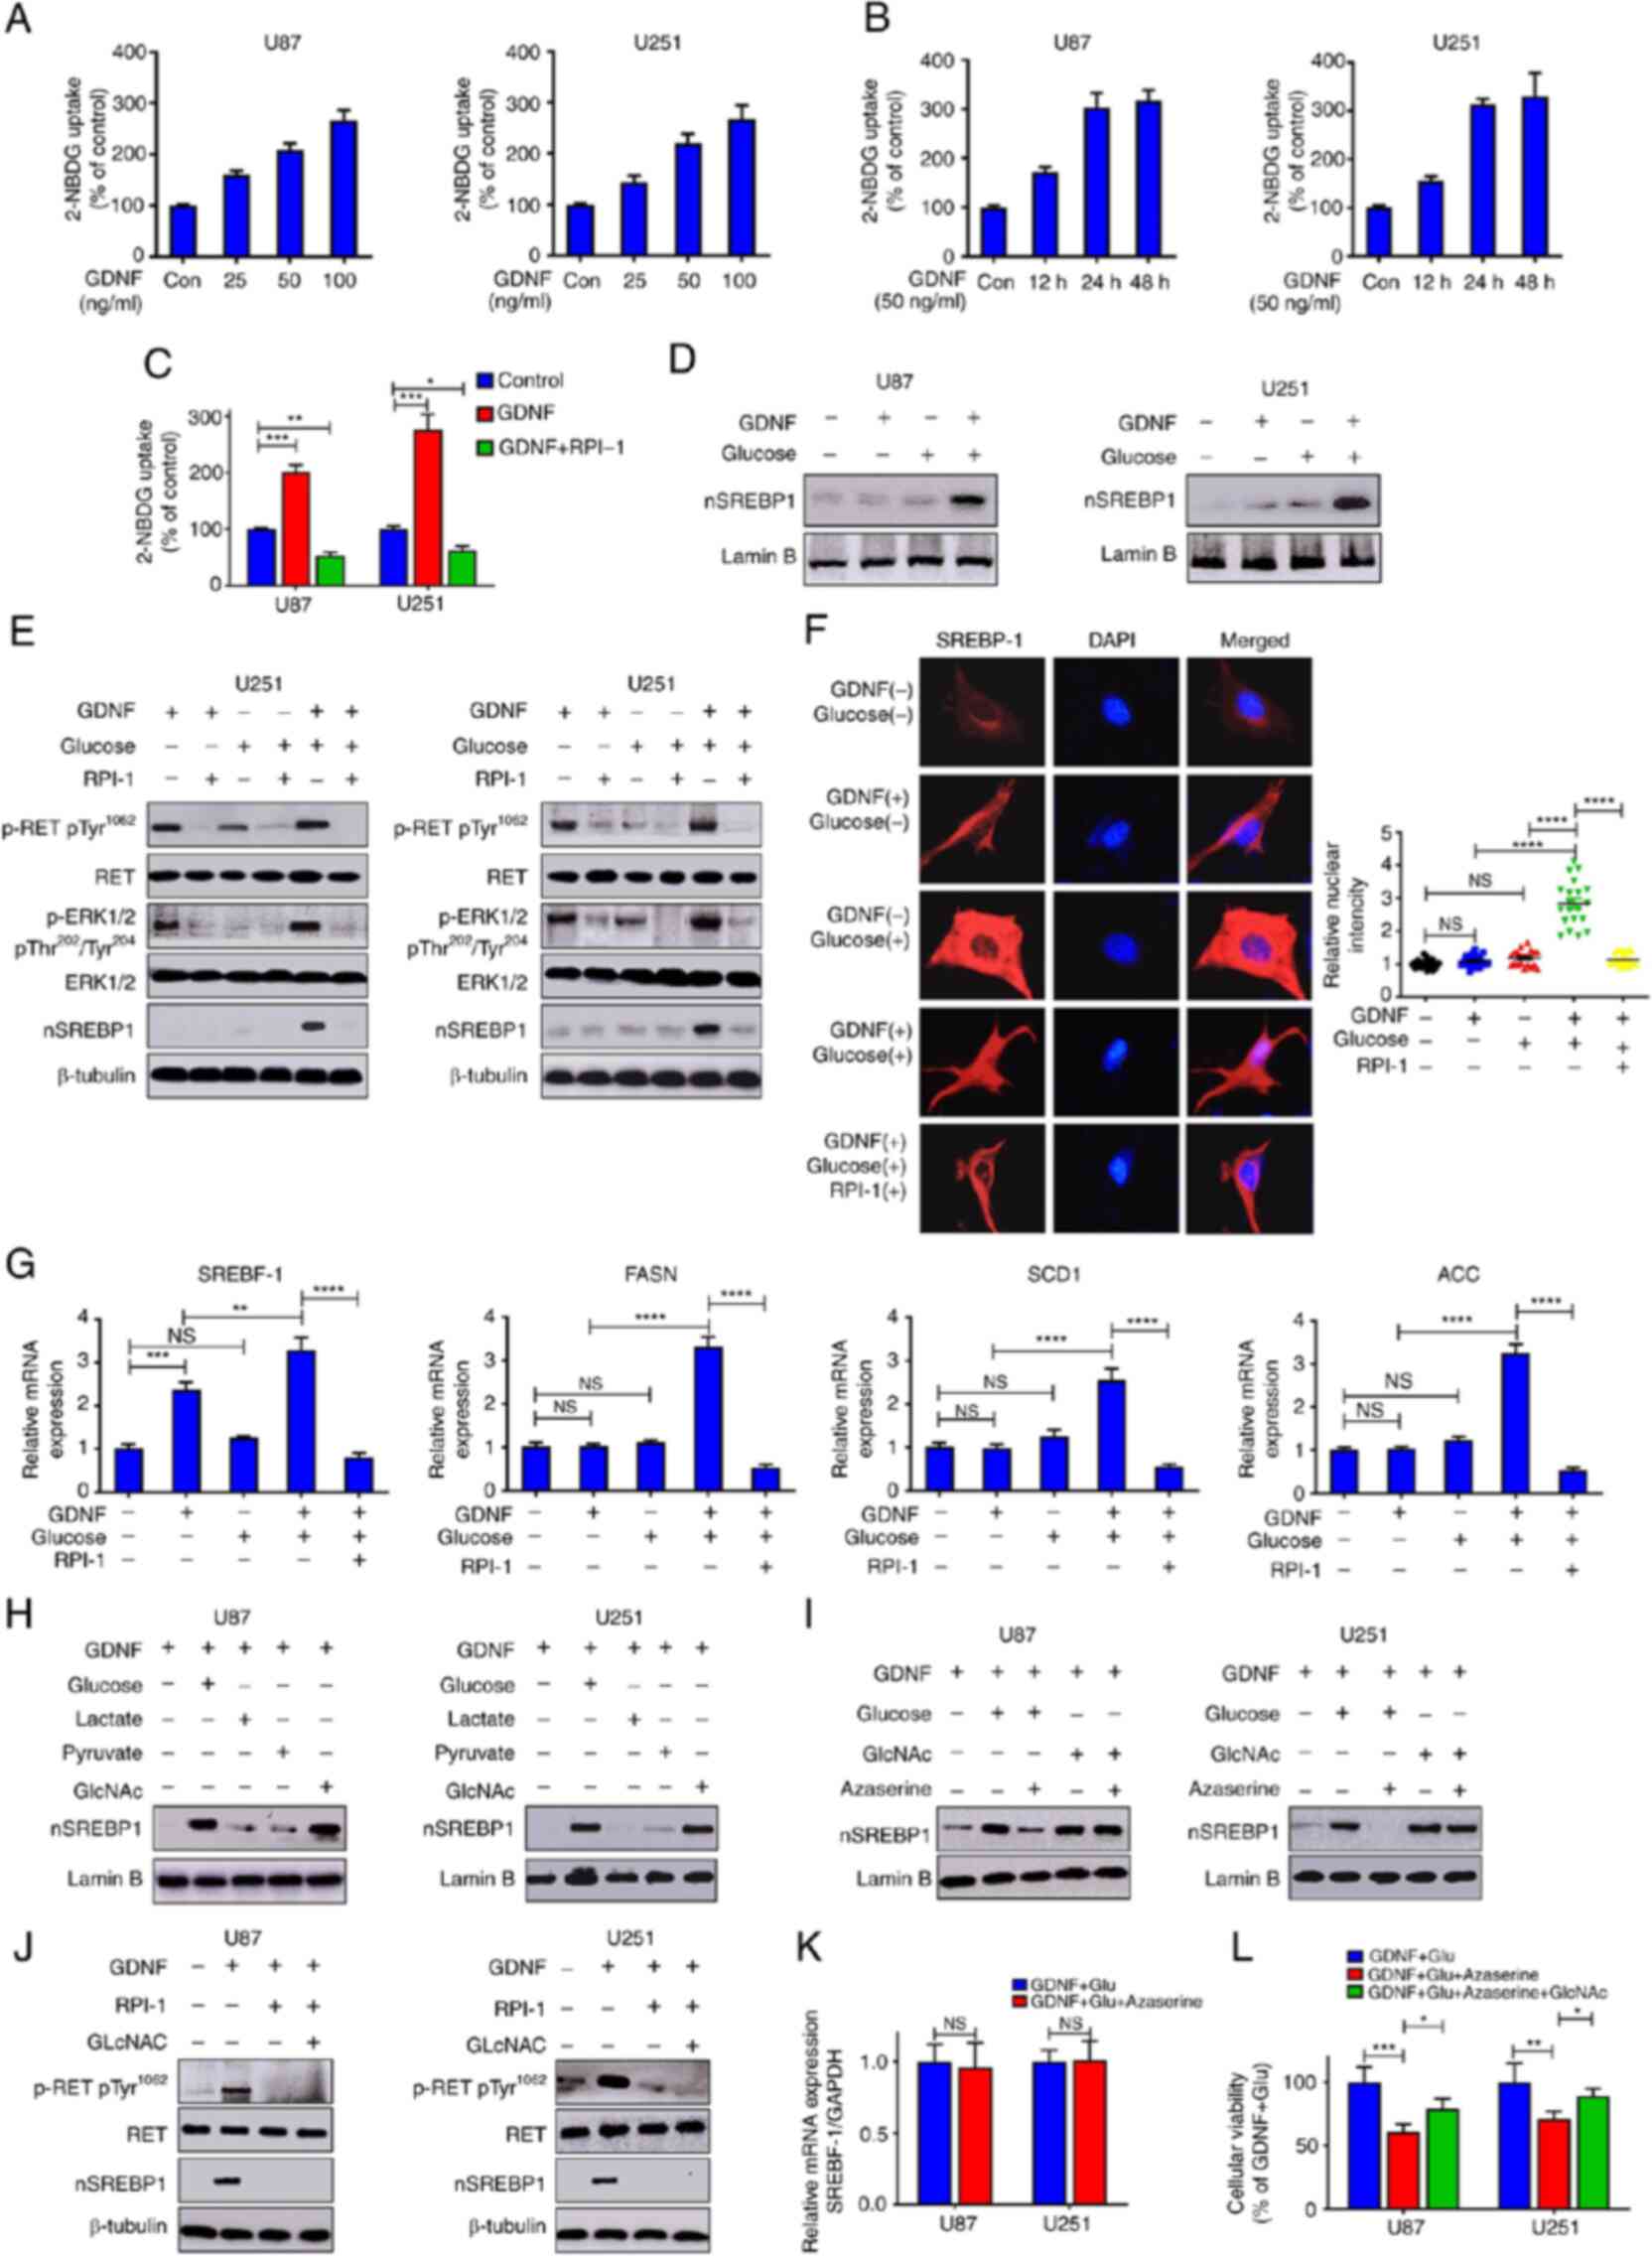
GDNF/RET activates SREBP-1 via
glucose-mediated hexosamine biosynthetic pathway
Tumorigenesis is associated with increased glucose
consumption and lipogenesis. Studies have suggested that elevated
GDNF/RET signaling is associated with enhanced glucose uptake or
lipogenesis in tumorigenesis (21,22).
The present study demonstrated that GDNF promoted lipid metabolism
by upregulating SREBP-1. GDNF also promoted glucose absorption
(Fig. 2A and B) in a dose- and
time-dependent manner and it pharmacologically blocked the activity
of RET/ERK signaling with RPI-1, thereby significantly preventing
glioma cells to absorb glucose (Fig.
2C). To investigate whether glucose was involved in SREBP-1
activation, U87 and U251 glioma cells were plated with GDNF with
and without glucose and SREBP processing was analyzed by RT-qPCR,
western blot and immunofluorescence microscopy. As shown in
Fig. 2 D and E, GDNF stimulation
presented no effect on the activation of SREBP-1 in a glucose-free
medium, despite the strong activation of the RET/ERK signaling
pathway. By contrast, GDNF stimulation promoted SREBP-1 activity in
the presence of glucose and it pharmacologically blocked the
activity of RET/ERK signaling with RPI-1, which completely
abolished the GDNF-mediated activation of SREBP-1 expression. The
fluorescence imaging indicated that GDNF stimulation was unable to
promote the nuclear translocation of SREBP-1 in the absence of
glucose and the addition of glucose restored the GDNF-mediated
SREBP-1 nuclear translocation (Fig.
2F). Although GDNF did not elevate SREBP-1 activity without
glucose, RT-qPCR analysis showed that it still promoted SREBP-1
mRNA expression and was inhibited by the RET inhibitor RPI-1.
However, there was no change in the downstream target gene
expression of SREBP-1 (Fig. 2G).
Combined with the results described above, this suggested that
GDNF/RET/ERK promoted SREBP-1 mRNA, protein expression and glucose
absorption and that glucose is important for the activation of
SREBP-1.
 | Figure 2GDNF/RET signaling pathway promotes
glucose absorption and subsequently activates SREBP-1 through HBP.
U251 and U87 glioma cells cultured in DMEM complete medium with (A)
different dose of GDNF for 48 h or with (B) 50 ng/ml GDNF at
indicated times and (C) in the presence or absence of 20 μM
RPI-1 (GDNF/RET inhibitor). Glucose uptake ability of glioma cells
evaluated by fluorescent glucose 2-NBDG. (D and E) Western blot
analysis of total cell lysates (RET/p-RET, ERK/p-RET) or nuclear
extracts (nSREBP-1) from U251 and U87 glioma cells cultured in DMEM
glucose-free medium, treated with 50 ng/ml GDNF, 10 mM glucose or
in combination with 20 μM RPI-1 for 48 h. (F)
Immunofluorescence staining of SREBP-1 (red) and DAPI (blue) from
U251 glioma cells cultured in DMEM glucose-free medium and treated
with 50 ng/ml GDNF or 25 mM glucose or in combination with 20
μM RPI-1 for 48 h. Quantitative evaluation of SREBP-1
nuclear intensity using ImageJ (n=20). Images were captured at x200
magnification. (G) RT-qPCR analysis of mRNA levels in U251 and U87
glioma cells cultured in DMEM glucose-free medium and treated with
50 ng/ml GDNF, 10 mM glucose, or 20 μM RPI-1 for 24 h. (H
and I) Western blot analysis of nuclear extracts (nSREBP-1) from
U251 and U87 glioma cells cultured in DMEM glucose-free medium with
or without 10 mM glucose, 10 mM lactate, 10 mM pyruvate, or 20 mM
HBP or in combination with 20 μM azaserine (HBP inhibitor)
for 48 h. (J) Western blot analysis of total cell lysates
(RET/p-RET) or nuclear extracts (nSREBP-1) from U251 and U87 glioma
cells cultured in DMEM glucose-free medium, treated with or without
GDNF or in combination with 20 μM RPI-1 or 20 mM HBP for 48
h. (K) RT-qPCR analysis of mRNA levels in U251 and U87 glioma cells
cultured in DMEM complete medium and treated with 50 ng/ml GDNF and
in the presence or absence of 20 μM azaserine for 24 h. (L)
U251 and U87 glioma cells cultured in DMEM complete medium treated
with 50 ng/ml GDNF and in combination with 20 μM azaserine
or 20 mM HBP for 48 h. Relative viability of glioma cells detected
by MTT assay. (*P<0.05; **P<0.01;
***P<0.001; ****P<0.0001; NS:
not significant). GDNF, glial-derived neurotrophic factor; RET,
rearranged during transfection; SREBP-1, sterol regulatory
element-binding protein-1; HBP, N-acetylglucosamine; p-,
phosphorylated; RT-qPCR, reverse transcription-quantitative
PCR. |
To investigate the glucose function in SREBP-1
activation, glucose and its intermediate metabolites, namely
N-acetylglucosamine (GlcNAc; HBP), lactate or pyruvate (glycolysis
pathway), were added in a glucose-free medium to U251 and U87
glioma cells, respectively. The results showed that GlcNAc was as
effective as glucose in enhancing SREBP-1 activity, whereas lactate
and pyruvate presented no effect (Fig.
2H). GFPT is the rate-limiting enzyme of HBP and glioma cells
were treated with azaserine (GFPT inhibitor). As expected,
azaserine inhibited the glucose-mediated SREBP-1 activity, but did
not inhibit the SREBP-1 activity mediated by GlcNAc (Fig. 2I). The addition of GlcNAc, which
has been widely used to increase HBP production, restored SREBP-1
protein activity in U87 and U251 glioma cells, which was previously
reduced by the azaserine treatment (Fig. 2J). However, HBP inhibition
presented no effect on the expression of SREBP-1 mRNA (Fig. 2K). In addition, in both glioma cell
lines tested, the toxicity of azaserine was at least partially
reversed by GlcNAc supplementation (Fig. 2L). These results demonstrated that
GDNF/RET can promote glucose absorption and subsequently activate
SREBP-1 by accelerating HBP synthesis.
HBP promotes SCAP N-glycosylation and
consequent activation of SREBP-1
Proteases cleaving SREBPs are activated by SCAP
(10). In the present study, the
knockdown of SCAP using siRNA reduced the GDNF- and
glucose-mediated activation of SREBP-1 (Fig. 3A). Nohturfft et al (27) and Cheng et al (28) show that the N-glycosylation status
of SCAP affects its protein function. However the NetNGlyc server
prediction of glycosylation sites using artificial neural networks
(http://www.cbs.dtu.dk/services/NetNGlyc/) showed that
SCAP presented both N- and O-glycosylation sites (Fig. 3B). UDP-N-acetyl glucosamine
(UDP-GlcNAc), which is the end product of HBP, is the substrate for
O- and N-glycosylations (29).
Therefore, whether GDNF regulated SCAP levels by regulating its N-
or O-glycosylation was investigated. Tunicamycin (inhibitor of
N-glycosylation) and OSMI-1 (inhibitor of O-glycosylation) were
added to U251 and U87 glioma cells, respectively, in a GNDF/glucose
medium. As shown in Fig. 3C,
tunicamycin inhibited the protein activity of SREBP-1, whereas
OSMI-1 did not. Immunofluorescence analysis showed that in U251
glioma cells treated with tunicamycin, the nuclear fluorescence
intensity of the SREBP-1 signal was significantly lower than in
control cells and there was no clear change in the OSMI-1 group
(Fig. 3D). To further confirm the
function of SCAP N-glycosylation for the regulation of SREBP-1
activity, U251 glioma cells were cultured with GDNF with and
without glucose. The N-glycosylation was investigated using PNGase
F and the differences between glycosylated and deglycosylated
proteins were evaluated by western blot tests. As shown in Fig. 3E, the treatment combining GDNF and
glucose induced more total SCAP proteins and its glycosylated
forms, which was associated with elevated SREBP-1 activation. As
expected, GDNF- and glucose-mediated SCAP N-glycosylation and
SREBP-1 activity were simultaneously inhibited by the RET inhibitor
(RPI-1), GFPT inhibitor (azaserine) and N-glycosylation inhibitor
(tunicamycin) (Fig. 3F-H). These
results demonstrated that GDNF elevated the SREBP-1 activity
through mechanisms involving the upregulation of SCAP
N-glycosylation.
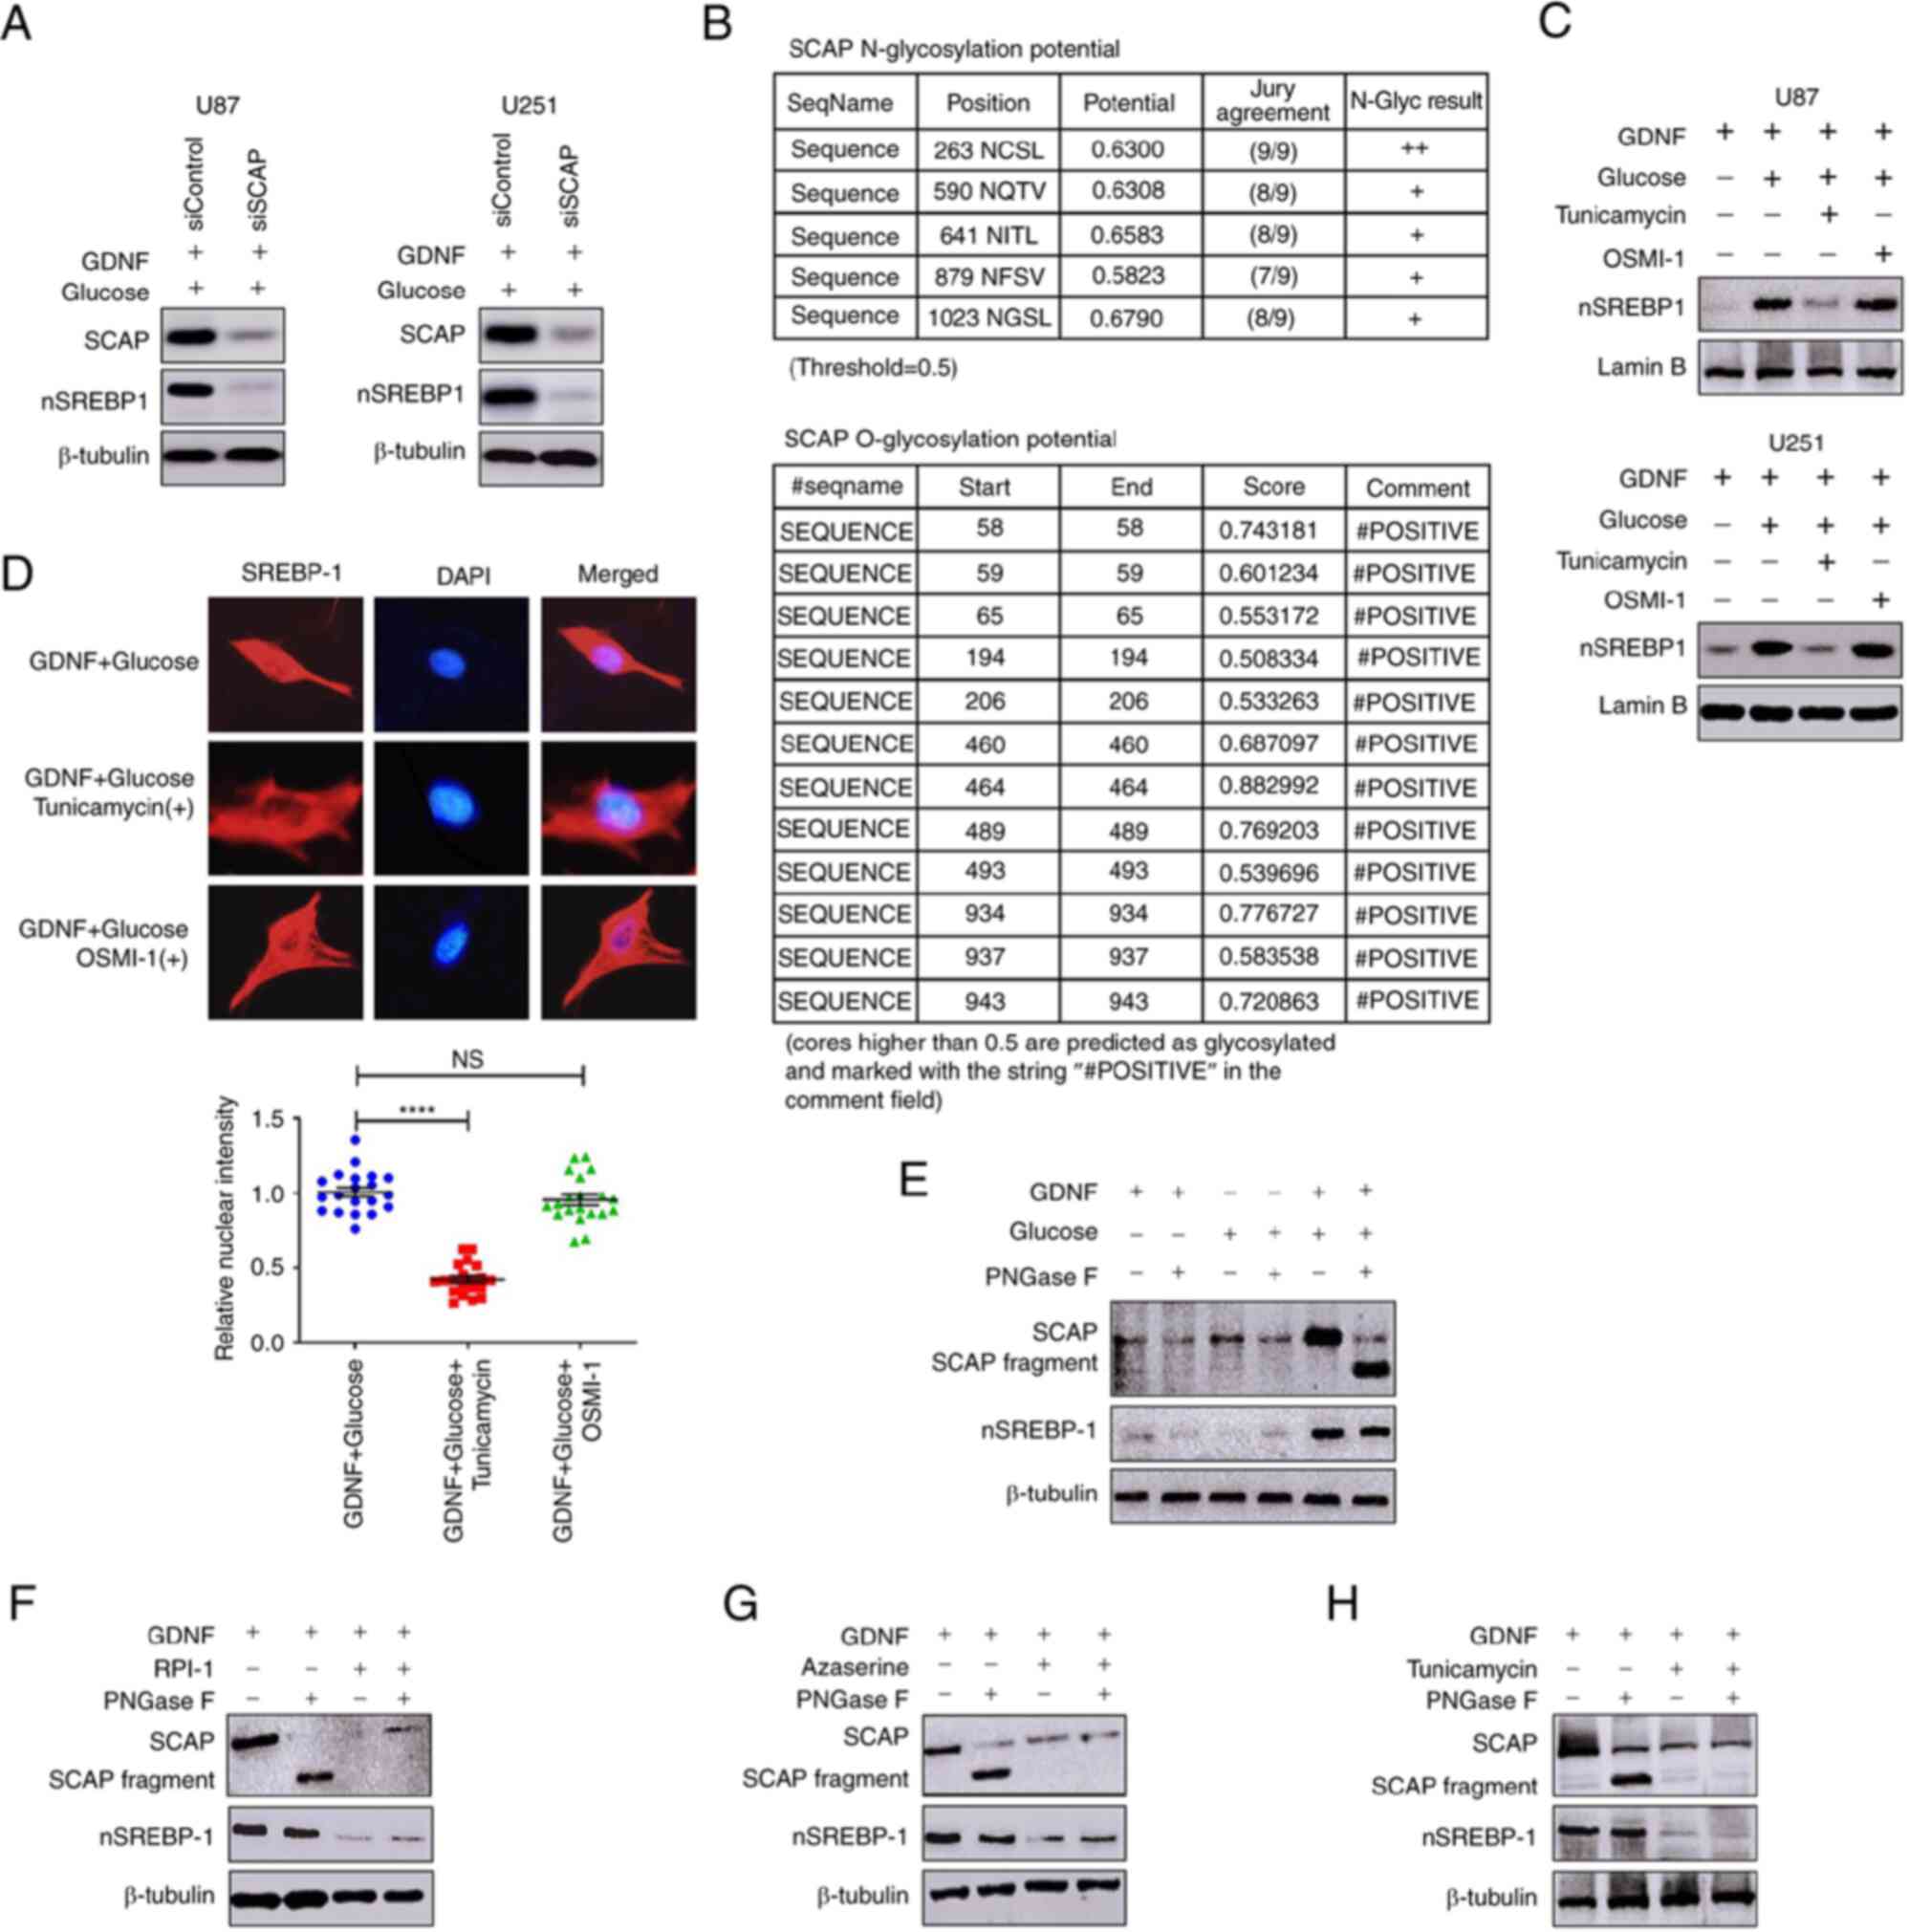 | Figure 3HBP regulates SREBP-1 activity by
promoting SCAP N-glycosylation. (A) Western blot analysis of SCAP
and nuclear SREBP-1 levels in U251 and U87 glioma cells after SCAP
gene silenced by siRNA, cultured in DMEM complete medium treated
with 50 ng/ml GDNF for 48 h. (B) NetNGlyc server showed that SCAP
presents both N- and O-glycosylation. (C) Western blot analysis of
nuclear extracts from U251 and U87 glioma cells cultured in DMEM
glucose-free medium, treated with or without 50 ng/ml GDNF or in
combination with tunicamycin (N-glycosylation inhibitor) (2
μg/ml) or 20 μM OSMI-1 (O-glycosylation inhibitor)
for 48 h. (D) Immunofluorescence staining of SREBP-1 (red) and DAPI
(blue) from U251 glioma cells cultured in DMEM complete medium,
treated with 50 ng/ml GDNF or in combination with 2 μg/ml
tunicamycin or 20 μM OSMI-1 for 48 h. Quantitative
evaluation of SREBP-1 nuclear intensity using ImageJ (n=20). Images
were captured at x200 magnification. (E) Western blot analysis of
total cell lysates (SCAP N-glycosylation levels) or nuclear
extracts (nSREBP-1) from U251 glioma cells cultured in DMEM
glucose-free medium, treated with 50 ng/ml GDNF or/and 10 mM
glucose for 48 h. Western blot analysis of total cell lysates (SCAP
N-glycosylation levels) or nuclear extracts (nSREBP-1) from U251
glioma cells cultured in DMEM complete medium, treated with 50
ng/ml GDNF or in combination with (F) 20 mM RPI-1 (GDNF/RET
inhibitor), (G) 20 μM azaserine (HBP inhibitor) and/or (H) 2
μg/ml tunicamycin (N-glycosylation inhibitor) for 48 h.
Significance was determined by unpaired Student's t test
(****P<0.0001; NS: not significant). HBP,
N-acetylglucosamine; SREBP-1, sterol regulatory element-binding
protein-1; SCAP, SREBP cleavage-activating protein; GDNF,
glial-derived neurotrophic factor. |
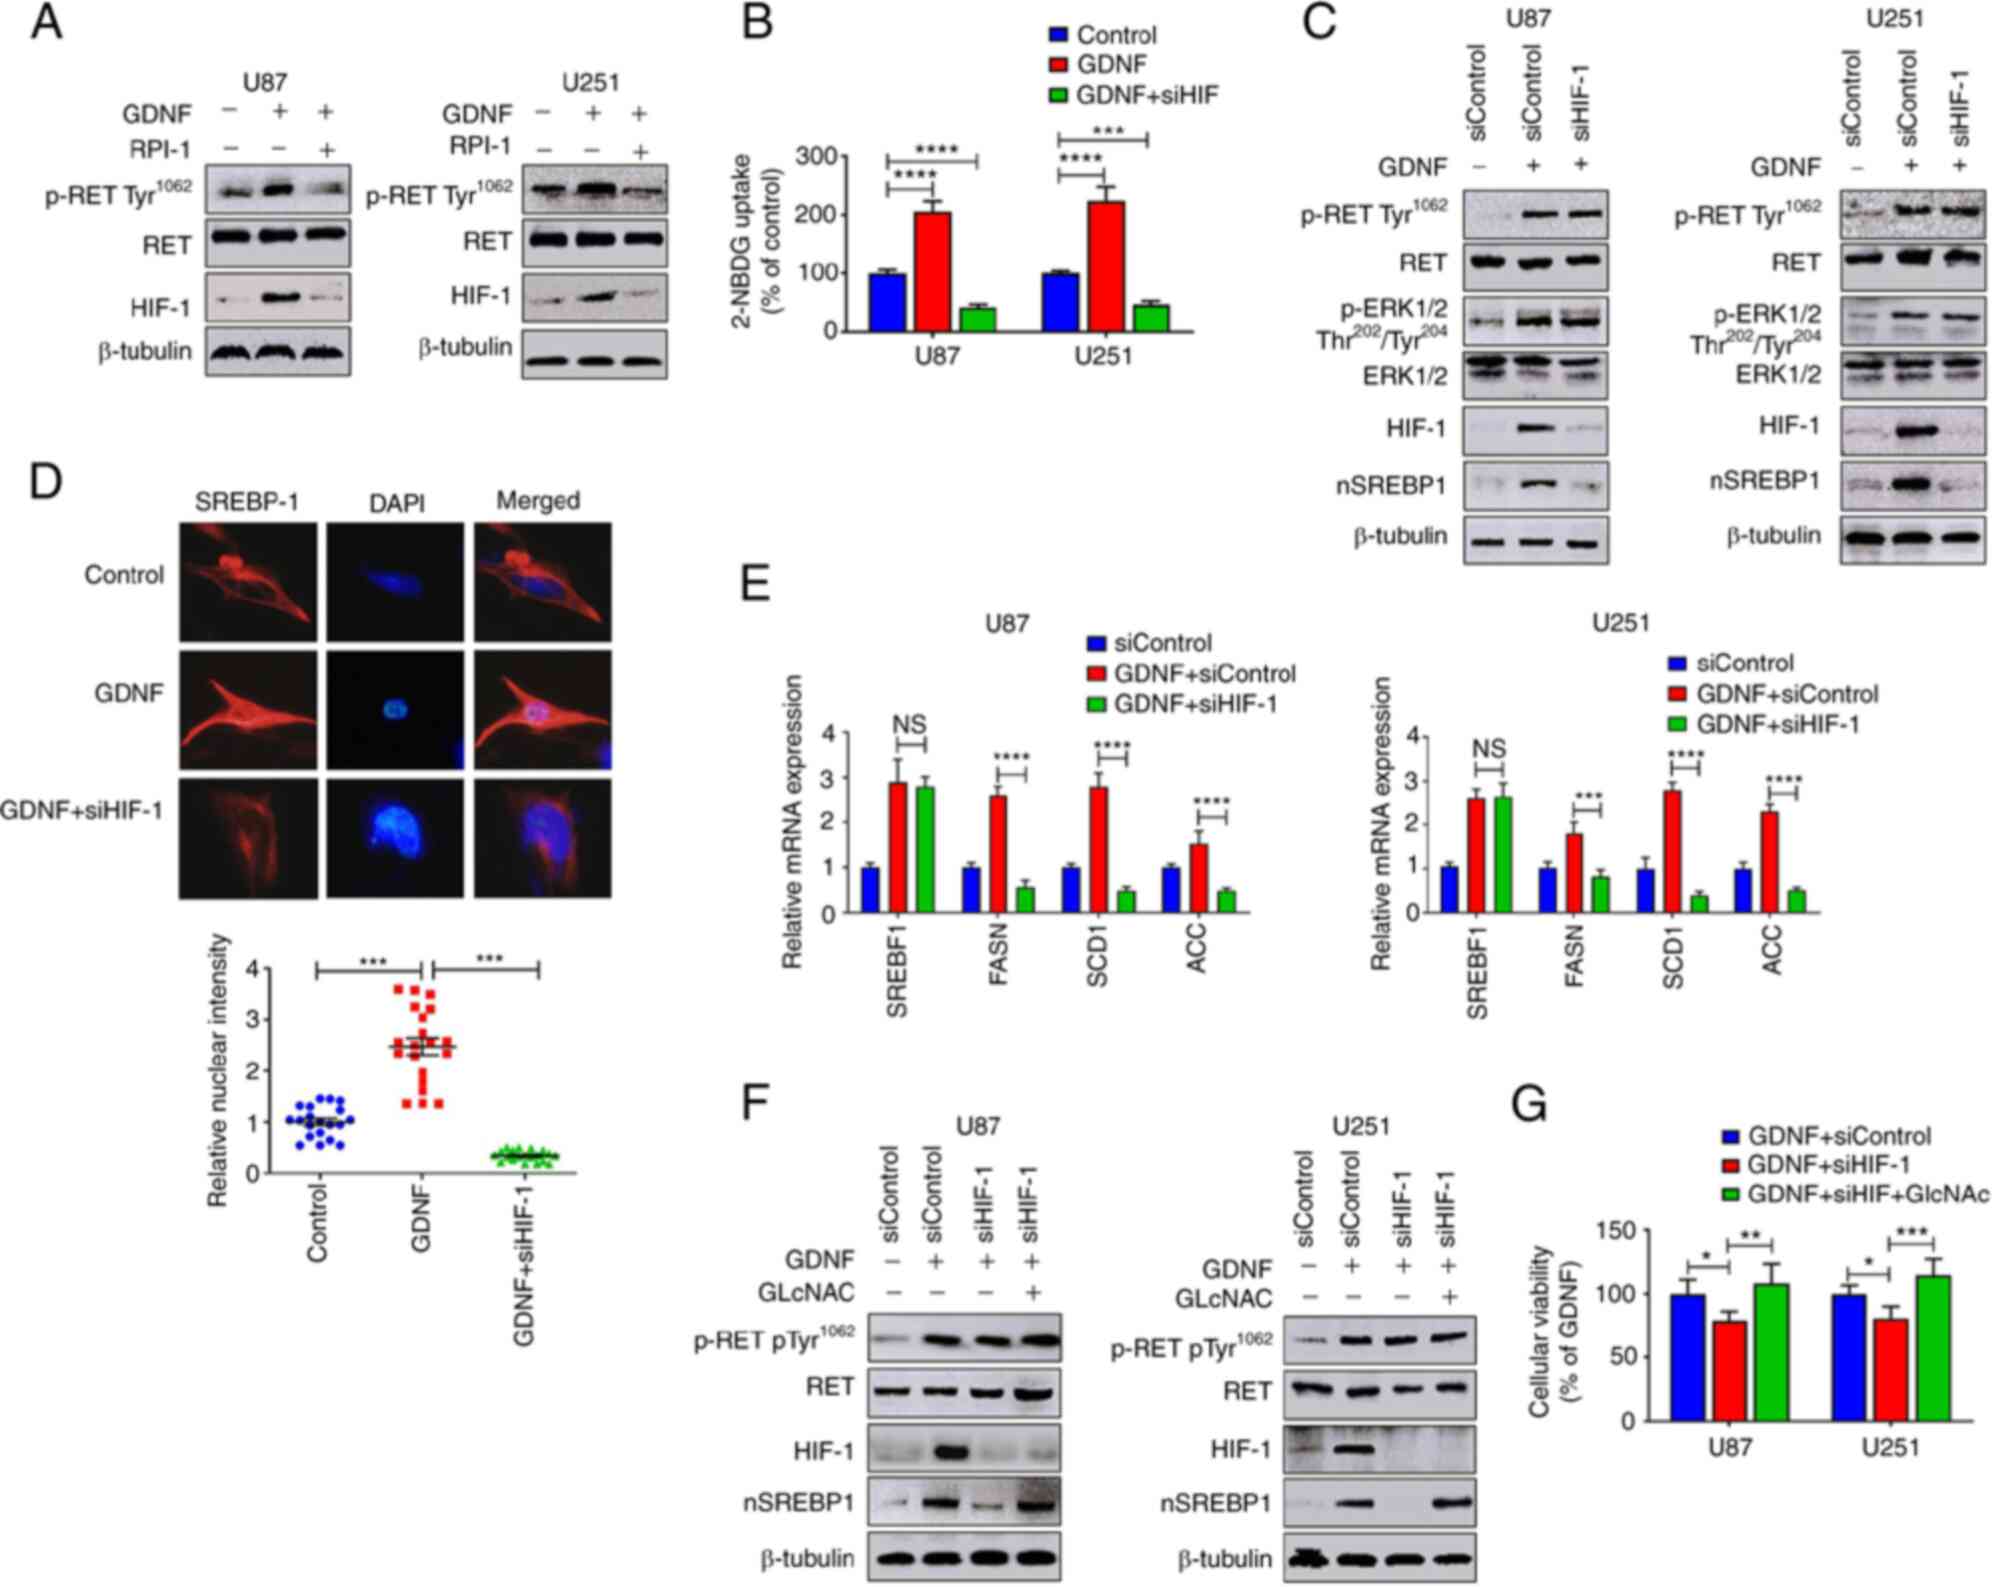
GDNF/RET signaling promotes glucose
absorption by upregulating HIF-1
Although the results indicated that GDNF/RET/ERK
signaling promotes glucose absorption and SREBP-1activation, the
mechanisms through which GDNF/RET promotes glucose absorption are
still unknown. The western blot results showed that the
hypoxia-inducible factor 1 (HIF-1) protein levels increased
significantly when U251 and U87 glioma cells were treated with GDNF
in glucose medium and the GDNF-induced changes in HIF-1 expression
were associated with SREBP-1 activation (Fig. 4A). HIF-1 is crucial for the
reprogramming of cancer metabolism as it activates the
transcription of genes that encode glucose transporters and
glycolytic enzymes (30). In the
present study, the knock- down of HIF-1 using siRNA reduced the
GDNF-mediated glucose absorption (Fig.
4B), which was associated with the terminated SREBP-1
activation (Fig. 4C). Although the
present study showed again that GDNF induced SREBP-1 activation
depended on upregulated RET/ERK/HIF-1 signaling pathway, but
knockdown of HIF-1 using siRNA had no effect on GDNF induced
RET/ERK expression (Fig. 4C).
Immunofluorescence analysis also showed that the nuclear
fluorescence intensity of the SREBP-1 signal was significantly
lower in U251 glioma cells treated with siHIF-1 than in the cells
of the GDNF group (Fig. 4D).
RT-qPCR analysis showed that knockdown of HIF-1 using siRNA reduced
the SREBP-1 downstream target gene expression, but presented no
apparent effect on SREBP-1 mRNA expression (Fig. 4E). In addition, GlcNAc
supplementation restored the SREBP-1 protein activity (Fig. 4F) and cell toxicity (Fig. 4G) in U251 and U87 glioma cells,
which were previously reduced by the siHIF-1 treatment. Therefore,
it was hypothesized that the GDNF/RET/ERK signaling pathway
regulated the expression of SREBP-1 and HIF-1, whereas the SREBP-1
activity is regulated by HIF-mediated glucose absorption (Fig. 5A).
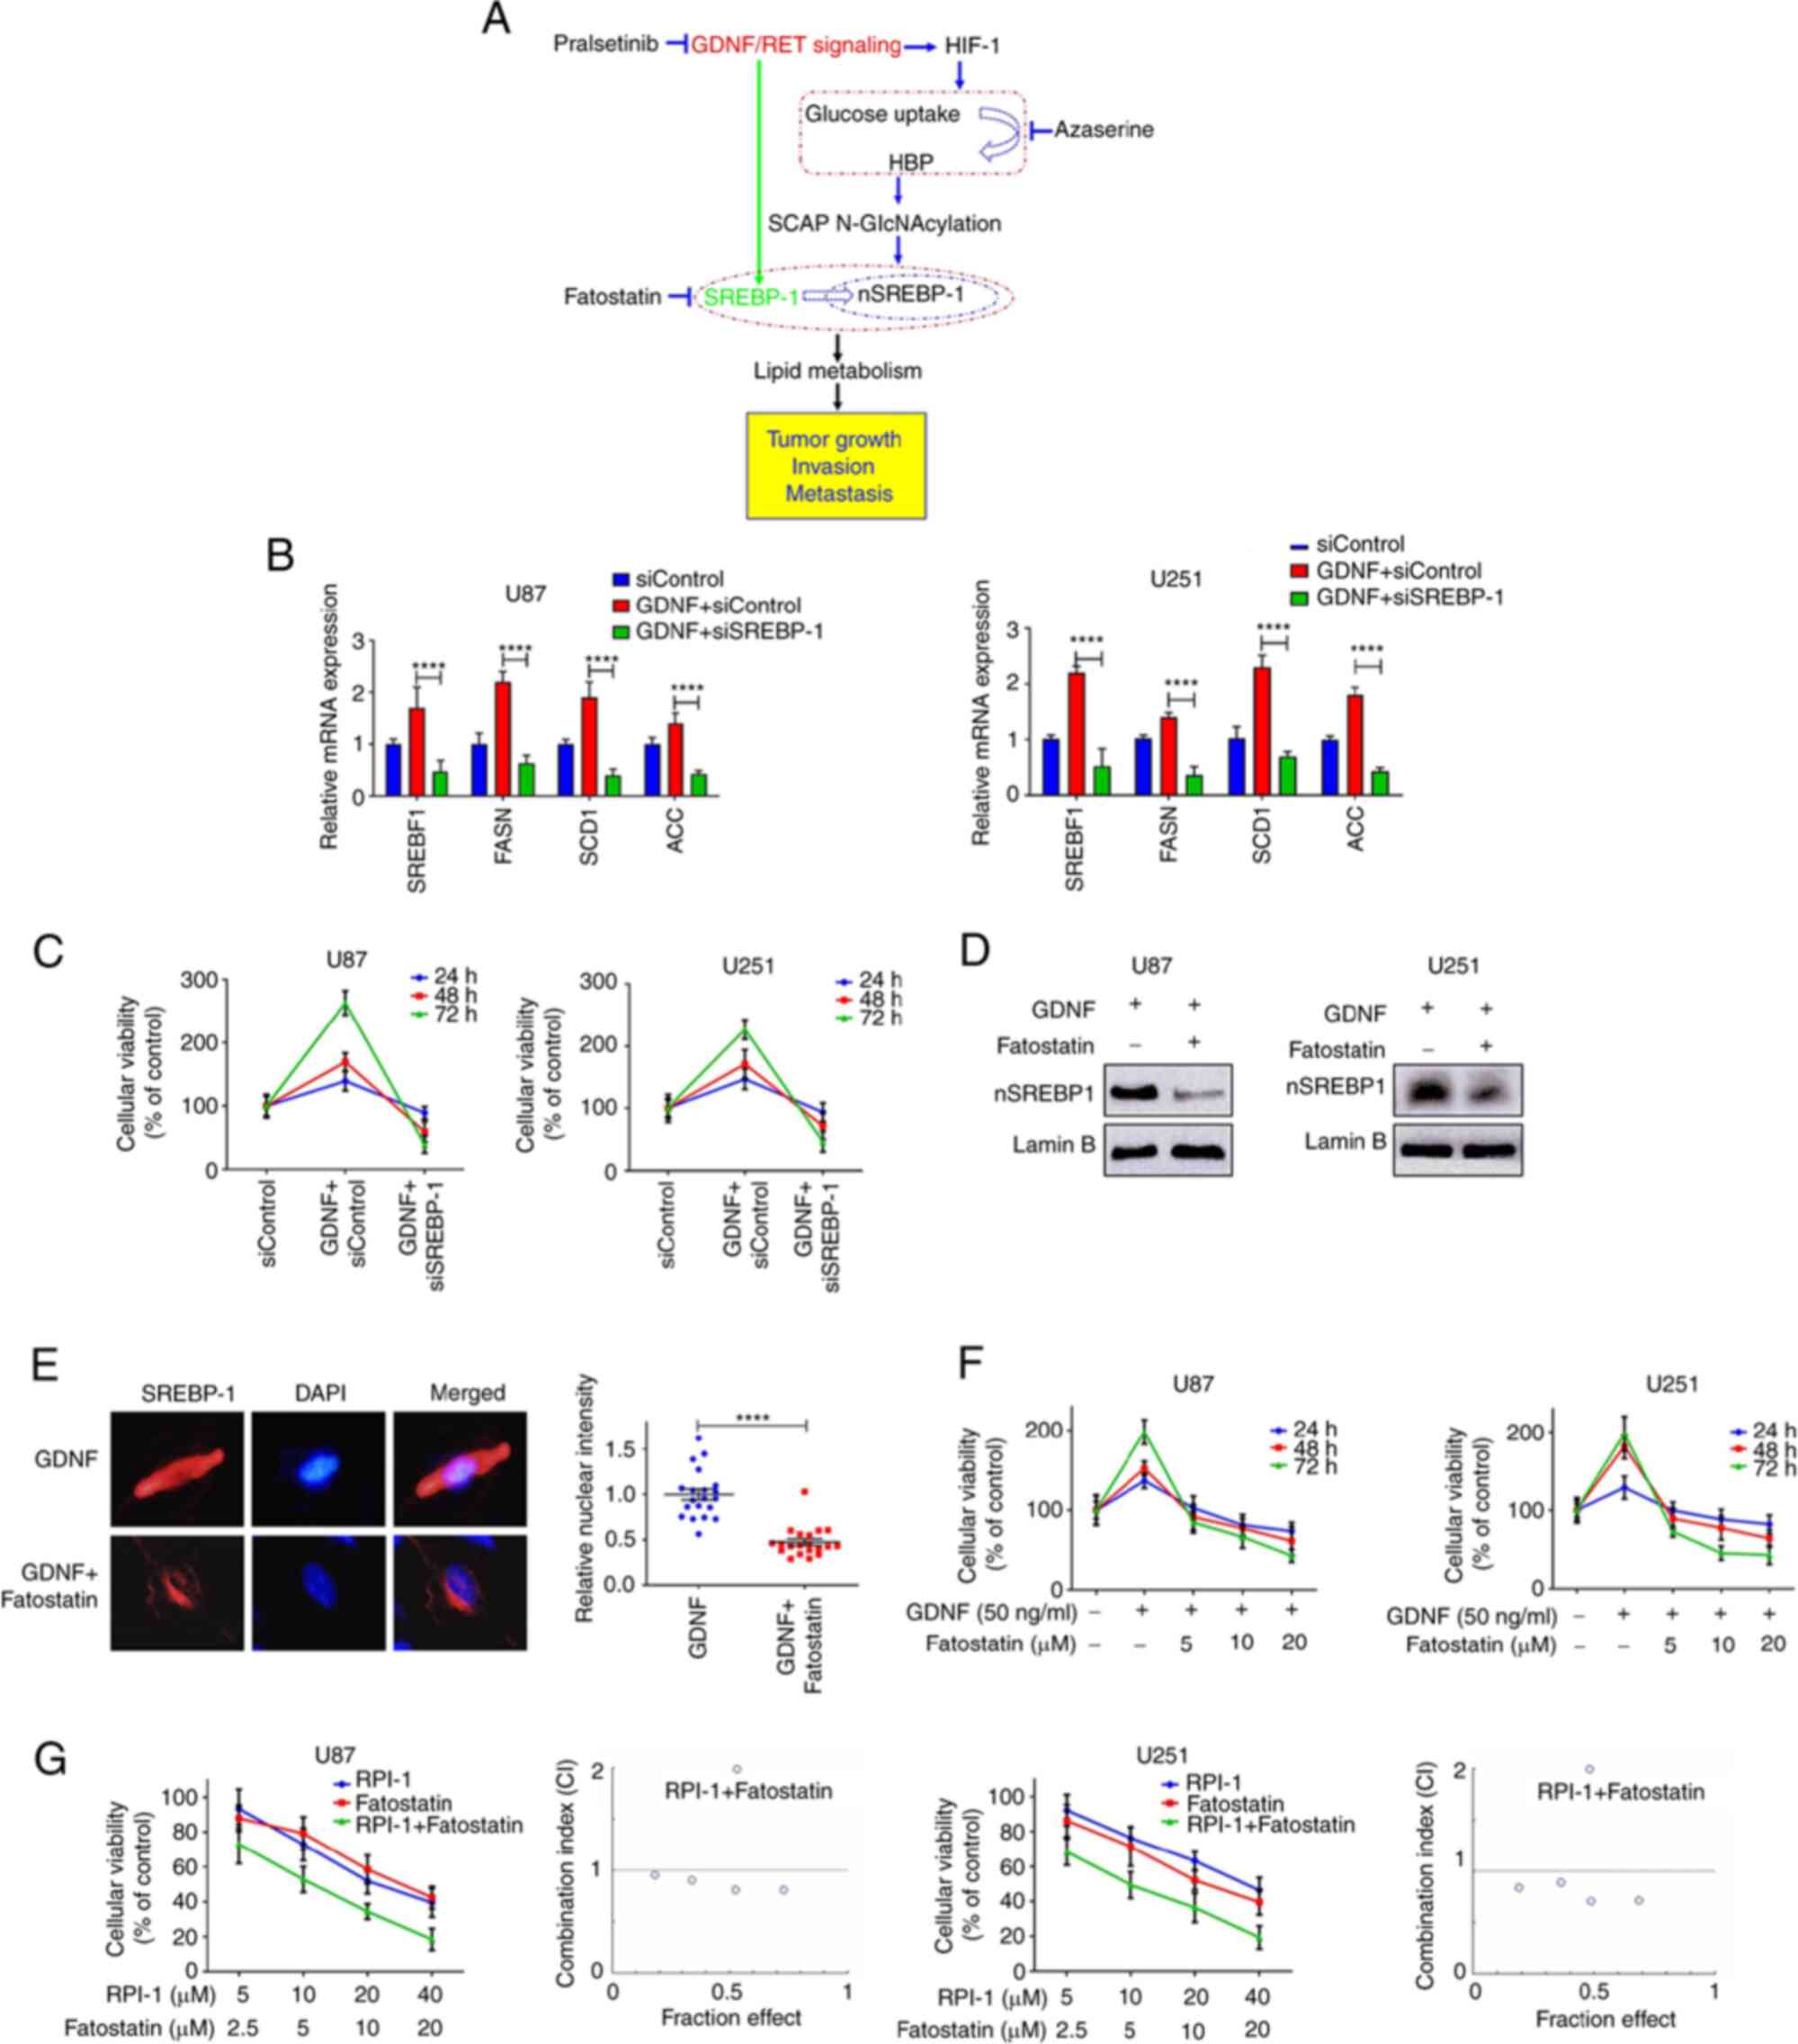
SREBP-1 suppression inhibits GDNF-induced
glioma cell growth
SREBP-1 functions as a transcription factor that
activates specific genes involved in cholesterol and fatty acid
metabolism. SREBP-1 and its downstream target gene can be
effectively regulated by GDNF and the knockdown of SREBP-1 can
reduce GDNF-mediated SREBP-1 and its downstream target gene
expression (Fig. 5B) and it can
completely reverse the GDNF-induced cell proliferation (Fig. 5C). Fatostatin, a chemical inhibitor
of the SREBP pathway (31), shows
high antitumor activity for a number of cancers (32,33),
but its effects on glioma cells are largely unknown. The present
study showed that fatostatin reversed the GDNF induced SREBP-1
activity (Fig. 5D). The nuclear
fluorescence intensity of the SREBP-1 signal was significantly
lower in U251 glioma cells treated with GDNF and fatostatin than in
GDNF-treated cells (Fig. 5E). In
addition, in both glioma cell lines, GDNF-induced cell activity was
completely reversed by the supplementation with fatostatin, which
inhibited the growth of glioma cells in a dose- and time-dependent
manner (Fig. 5F).
It is often ineffective to treat cancer only using
traditional methods involving the inhibition of a single oncogene
pathway or enzyme (7). Therefore,
the combination of drugs and chemotherapeutic agents is becoming a
popular therapeutic option. Accordingly, because GDNF/RET regulates
SREBP-1 activity, the present study investigated if the GDNF/RET
inhibitor could enhance the cytotoxicity of the SREBP-1 inhibitor.
A proliferation assay was performed in which glioma cells were
treated with RPI-1 and fatostatin at a constant ratio according to
their respective IC50. The combination of RPI-1 and
fatostatin provided a antiproliferative effect stronger than that
of single agents and showed synergistic effect when they were used
in combination [combination index (CI)<1.0; Fig. 5G]). These results suggest that the
inhibition of SREBP-1 combined with GDNF/RET signaling pathway
might be a new therapeutic method for glioma.
Discussion
Despite the increase in life expectancy for patients
with GBM under optimal treatment, current therapy options are
considered palliative and GBM is essentially an incurable disease.
Therefore, new treatments for GBM have been widely investigated. It
is unlikely that inhibiting single oncogene pathways or enzymes is
sufficient to harness the full potential of a targeted therapy
because of the heterogeneity of cancer cells. A common feature of
cancer cells is their ability to rewire their metabolism to sustain
the production of adenosine triphosphate and macromolecules needed
for cell growth, division and survival (5). Particularly, the importance of
altered lipid metabolism in cancer patients has received renewed
interest because, in addition to their main role as structural
components of the membrane matrix, they are important secondary
messengers and can serve as fuel sources for energy production
(7,34). Therefore, research focusing on the
complex correlation between oncogenic signaling and dysregulated
lipid-metabolism has a great potential to uncover novel metabolic
vulnerabilities and improve the efficacy of targeted therapies.
GDNF is a family of neurotrophins with similarities
to the transforming growth factor β regulatory proteins (11,35)
and it has been identified as a potent neurotrophic factor for a
variety of neuronal cell populations (36). GDNF is biosynthesized in glial
cells and might be relevant to the development of gliomas (37). The present study showed that GDNF
highly expressed in glioma is associated with poor clinical outcome
and promoted glioma cell proliferation through RET/ERK signaling
pathway. Cruceru et al (38) show that high expression of ERK can
also promote the differentiation and metastasis of glioma. A
previous study shows that ERK promotes lipid metabolism (20) and SREBPs are key transcriptional
regulators of lipid metabolism and cellular growth (39,40)
The results of the present study showed that there was a clear
correlation between GDNF/RET/ERK signaling and SREBP-1 expression
in glioma cells and revealed that patients with high SREBP-1
expression also have a poor prognosis. Therefore, it is important
to clarify the relationship and mechanism between oncogenic
signaling (GDNF/RET/ERK) and glioma cell lipid metabolism.
The inactive precursors of SREBPs reside in ER
membranes bound with SACP, the present study showed that GDNF/RET
signaling pathway contributed SREBP-1 transfer to the cell nucleus
and the activated SREBP-1 promoted FASN, SCD1 and ACC expression.
However, the regulation mechanism of the SREBP-1 activity in glioma
remains to be elucidated. The GDNF upregulation and RET
ligand-receptor interaction might participate in the
glucose-induced cancer progression (21). Cheng et al (28) suggest that glycosylation stabilizes
SCAP and reduces its association with Insig-1, thereby allowing the
movement of SCAP/SREBP to the Golgi bodies and the consequent
proteolytic activation of SREBP. Although NetNGlyc server predicted
that SCAP presented both N- and O-glycosylation sites, the results
of the present study showed that only SCAP N-glycosylation plays a
critical role in SREBP-1 activity. UDP-GlcNAc, the end product of
glucose metabolism via HBP, is the substrate for O- and
N-glycosylations. In order to study how GDNF regulates SCAP
N-glycosylation, further research was conducted. The study showed
that GDNF promoted glucose absorption through RET/ERK signaling
pathway and that GDNF had no effect on the activation of SREBP in
glucose-free medium, suggesting that glucose served a crucial role
in the GDNF-mediated SREBP-1 activation. GDNF/RET/ERK signaling was
highly expressed in glioma cells and promoted the expression of
HIF-1, which has been shown to play a crucial role in the
reprogramming of cancer metabolism by activating transcription of
genes encoding glycolytic enzymes and glucose transporters
(30,41). Although the results of the present
study do not confirm this, it determined that HIF-1 serves an
important role in the glucose-mediated SREBP-1 activation and
knockdown of HIF-1 using siRNA reduced the GDNF- and
glucose-mediated SREBP-1 activation. Highly expressed HIF-1
accelerated HBP and promoted N-glycosylation of SCAP and consequent
activation of SREBP-1. GDNF-mediated SREBP-1 activity was
simultaneously inhibited by the RET inhibitor (RPI-1), GFPT
inhibitor (azaserine) and N-glycosylation inhibitor (tunicamycin).
Although the present study helped clarify the relationship between
GDNF/RET/ERK signaling and dysregulated glycolipid-metabolism, the
regulatory pathways responsible for the activation of these
processes remain unclear because the established carcinogenesis
mechanisms cannot fully explain multiple metabolic rearrangements
in glioma cells, such as how GDNF/RET/ERK promotes SREBP-1 mRNA
expression and whether GDNF mediated HIF-1 expression is associated
with glioma cell microenvironment such as hypoxia.
Due to the high number of genetic alterations
observed in glioma, a number of which occur concurrently, combining
anticancer drugs can lead to a synergistic toxic effect against
tumor cells and reduce damage to normal cells. GDNF/RET and SREBP-1
are both crucial for cancer growth (8,11,34).
The results of the present study showed that the combination of
GDNF/RET inhibitor RPI-1 treatment and SREBP-1 inhibitor fatostatin
induced a synergistic anti-tumoral response in glioma cells.
Current therapy options for glioma patients are considered
palliative and the results of the present study provided a
background to improve the efficacy of targeted therapies for these
patients. The development of such therapies are important
especially considering the heterogeneity and mutability of cancer
cells and the current inhibition of a single oncogene pathway or
enzyme by traditional treatments.
Availability of data and materials
All data generated or analyzed during this study are
included in this published article.
Authors' contributions
ZYY and YKX conceived the project and planned the
experiments. ZYY, MW and HJL performed experiments. ZYY, WZL and
YKX analyzed results. ZYY and WZL wrote the paper and edited the
manuscript. ZYY, HJL and YKX confirmed the authenticity of all
data. All authors reviewed and approved the final manuscript.
Ethics approval and consent to
participate
The study was approved by the ethics committee of
the First Affiliated Hospital of Zhengzhou University (approval no.
2020-KY-155).
Patient consent for publication
Not applicable.
Competing interests
The authors declare that they have no competing
interests.
Acknowledgements
Not applicable.
Funding
The present study was supported by the Young Scientists Fund of
the National Natural Science Foundation of China (grant no.
81702459).
References
|
1
|
Stupp R, Mason WP, van den Bent MJ, Weller
M, Fisher B, Taphoorn MJ, Belanger K, Brandes AA, Marosi C, Bogdahn
U, et al: Radiotherapy plus concomitant and adjuvant temozolomide
for glioblastoma. N Engl J Med. 352:987–996. 2005.
|
|
2
|
Yu Z, Zhao G, Xie G, Zhao L, Chen Y, Yu H,
Zhang Z, Li C and Li Y: Metformin and temozolomide act
synergistically to inhibit growth of glioma cells and glioma stem
cells in vitro and in vivo. Oncotarget. 6:32930–32943. 2015.
|
|
3
|
Yu Z, Xie G, Zhou G, Cheng Y, Zhang G, Yao
G, Chen Y, Li Y and Zhao G: NVP-BEZ235, a novel dual PI3K-mTOR
inhibitor displays anti-glioma activity and reduces chemoresistance
to temozolomide in human glioma cells. Cancer Lett. 367:58–68.
2015.
|
|
4
|
Chen R, Smith-Cohn M, Cohen AL and Colman
H: Glioma subclassifications and their clinical significance.
Neurotherapeutics. 14:284–297. 2017.
|
|
5
|
Korshunov DA, Kondakova IV and Shashova
EE: Modern perspective on metabolic reprogramming in malignant
neoplasms. Biochemistry (Mosc). 84:1129–1142. 2019.
|
|
6
|
Tarrado-Castellarnau M, de Atauri P and
Cascante M: Oncogenic regulation of tumor metabolic reprogramming.
Oncotarget. 7:62726–62753. 2016.
|
|
7
|
Koundouros N and Poulogiannis G:
Reprogramming of fatty acid metabolism in cancer. Br J Cancer.
122:4–22. 2020.
|
|
8
|
Cheng X, Li J and Guo D: SCAP/SREBPs are
central players in lipid metabolism and novel metabolic targets in
cancer therapy. Curr Top Med Chem. 18:484–493. 2018.
|
|
9
|
Williams KJ, Argus JP, Zhu Y, Wilks MQ,
Marbois BN, York AG, Kidani Y, Pourzia AL, Akhavan D, Lisiero DN,
et al: An essential requirement for the SCAP/SREBP signaling axis
to protect cancer cells from lipotoxicity. Cancer Res.
73:2850–2862. 2013.
|
|
10
|
Nohturfft A, Yabe D, Goldstein JL, Brown
MS and Espenshade PJ: Regulated step in cholesterol feedback
localized to budding of SCAP from ER membranes. Cell. 102:315–323.
2000.
|
|
11
|
Mulligan LM: GDNF and the RET receptor in
cancer: New insights and therapeutic potential. Front Physiol.
9:18732019.
|
|
12
|
Zhang L, Wang D, Han X, Tang F and Gao D:
Mechanism of methylation and acetylation of high GDNF transcription
in glioma cells: A review. Heliyon. 5:e019512019.
|
|
13
|
Shabtay-Orbach A, Amit M, Binenbaum Y,
Na'ara S and Gil Z: Paracrine regulation of glioma cells invasion
by astrocytes is mediated by glial-derived neurotrophic factor. Int
J Cancer. 137:1012–1020. 2015.
|
|
14
|
Kawai K and Takahashi M: Intracellular RET
signaling pathways activated by GDNF. Cell Tissue Res. 382:113–123.
2020.
|
|
15
|
Wiesenhofer B, Stockhammer G, Kostron H,
Maier H, Hinterhuber H and Humpel C: Glial cell line-derived
neurotrophic factor (GDNF) and its receptor (GFR-alpha 1) are
strongly expressed in human gliomas. Acta Neuropathol. 99:131–137.
2000.
|
|
16
|
Zhang BL, Dong FL, Guo TW, Gu XH, Huang LY
and Gao DS: MiRNAs Mediate GDNF-induced proliferation and migration
of glioma cells. Cell Physiol Biochem. 44:1923–1938. 2017.
|
|
17
|
Liu XF, Tang CX, Zhang L, Tong SY, Wang Y,
Abdulrahman AA, Ji GQ, Gao Y, Gao DS and Zhang BL: Down-Regulated
CUEDC2 Increases GDNF expression by stabilizing CREB through
reducing its ubiquitination in glioma. Neurochem Res. 45:2915–2925.
2020.
|
|
18
|
Ng WH, Wan GQ, Peng ZN and Too HP: Glial
cell-line derived neurotrophic factor (GDNF) family of ligands
confer chemoresistance in a ligand-specific fashion in malignant
gliomas. J Clin Neurosci. 16:427–436. 2009.
|
|
19
|
Guo YJ, Pan WW, Liu SB, Shen ZF, Xu Y and
Hu LL: ERK/MAPK signalling pathway and tumorigenesis. Exp Ther Med.
19:1997–2007. 2020.
|
|
20
|
Knebel B, Lehr S, Hartwig S, Haas J, Kaber
G, Dicken HD, Susanto F, Bohne L, Jacob S, Nitzgen U, et al:
Phosphorylation of sterol regulatory element-binding protein
(SREBP)-1c by p38 kinases, ERK and JNK influences lipid metabolism
and the secretome of human liver cell line HepG2. Arch Physiol
Biochem. 120:216–227. 2014.
|
|
21
|
Liu H, Ma Q and Li J: High glucose
promotes cell proliferation and enhances GDNF and RET expression in
pancreatic cancer cells. Mol Cell Biochem. 347:95–101. 2011.
|
|
22
|
Ruan M, Liu M, Dong Q and Chen L: Iodide-
and glucose-handling gene expression regulated by sorafenib or
cabozantinib in papillary thyroid cancer. J Clin Endocrinol Metab.
100:1771–1779. 2015.
|
|
23
|
Louis DN, Perry A, Reifenberger G, von
Deimling A, Figarella-Branger D, Cavenee WK, Ohgaki H, Wiestler OD,
Kleihues P and Ellison DW: The 2016 World Health Organization
classification of tumors of the central nervous system: A summary.
Acta Neuropathol. 131:803–820. 2016.
|
|
24
|
Yu Z, Chen Y, Wang S, Li P, Zhou G and
Yuan Y: Inhibition of NF-κB results in anti-glioma activity and
reduces temozolomide-induced chemoresistance by down-regulating
MGMT gene expression. Cancer Lett. 428:77–89. 2018.
|
|
25
|
Chou TC: Drug combination studies and
their synergy quantification using the Chou-Talalay method. Cancer
Res. 70:440–446. 2010.
|
|
26
|
Livak KJ and Schmittgen TD: Analysis of
relative gene expression data using real-time quantitative PCR and
the 2(-Delta Delta C(T)) Method. Methods. 25:402–408. 2001.
|
|
27
|
Nohturfft A, Brown MS and Goldstein JL:
Topology of SREBP cleavage-activating protein, a polytopic membrane
protein with a sterol-sensing domain. J Biol Chem. 273:17243–17250.
1998.
|
|
28
|
Cheng C, Ru P, Geng F, Liu J, Yoo JY, Wu
X, Cheng X, Euthine V, Hu P, Guo JY, et al: Glucose-Mediated
N-glycosylation of SCAP Is Essential for SREBP-1 activation and
tumor growth. Cancer Cell. 28:569–581. 2015.
|
|
29
|
Akella NM, Ciraku L and Reginato MJ:
Fueling the fire: Emerging role of the hexosamine biosynthetic
pathway in cancer. BMC Biol. 17:522019.
|
|
30
|
Semenza GL: HIF-1: Upstream and downstream
of cancer metabolism. Curr Opin Genet Dev. 20:51–56. 2010.
|
|
31
|
Kamisuki S, Mao Q, Abu-Elheiga L, Gu Z,
Kugimiya A, Kwon Y, Shinohara T, Kawazoe Y, Sato S, Asakura K, et
al: A small molecule that blocks fat synthesis by inhibiting the
activation of SREBP. Chem Biol. 16:882–892. 2009.
|
|
32
|
Gholkar AA, Cheung K, Williams KJ, Lo YC,
Hamideh SA, Nnebe C, Khuu C, Bensinger SJ and Torres JZ: Fatostatin
inhibits cancer cell proliferation by affecting mitotic microtubule
spindle assembly and cell division. J Biol Chem. 291:17001–17008.
2016.
|
|
33
|
Xue L, Qi H, Zhang H, Ding L, Huang Q,
Zhao D, Wu BJ and Li X: Targeting SREBP-2-regulated mevalonate
metabolism for cancer therapy. Front Oncol. 10:15102020.
|
|
34
|
Cheng C, Geng F, Cheng X and Guo D: Lipid
metabolism reprogramming and its potential targets in cancer.
Cancer Commun (Lond). 38:272018.
|
|
35
|
Ayanlaja AA, Zhang B, Ji G, Gao Y, Wang J,
Kanwore K and Gao D: The reversible effects of glial cell
line-derived neurotrophic factor (GDNF) in the human brain. Semin
Cancer Biol. 53:212–222. 2018.
|
|
36
|
Mu P, Liu Y, Jiang S, Gao J, Sun S, Li L
and Gao D: Glial cell line-derived neurotrophic factor alters lipid
composition and protein distribution in MPP+-injured differentiated
SH-SY5Y cells. J Cell Physiol. 235:9347–9360. 2020.
|
|
37
|
Yu ZQ, Zhang BL, Ren QX, Wang JC, Yu RT,
Qu DW, Liu ZH, Xiong Y and Gao DS: Changes in transcriptional
factor binding capacity resulting from promoter region methylation
induce aberrantly high GDNF expression in human glioma. Mol
Neurobiol. 48:571–580. 2013.
|
|
38
|
Cruceru ML, Enciu AM, Popa AC, Albulescu
R, Neagu M, Tanase CP and Constantinescu SN: Signal transduction
molecule patterns indicating potential glioblastoma therapy
approaches. Onco Targets Ther. 6:1737–1749. 2013.
|
|
39
|
McPherson R and Gauthier A: Molecular
regulation of SREBP function: The Insig-SCAP connection and
isoform-specific modulation of lipid synthesis. Biochem Cell Biol.
82:201–211. 2004.
|
|
40
|
Zhu Z, Zhao X, Zhao L, Yang H, Liu L, Li
J, Wu J, Yang F, Huang G and Liu J: p54(nrb)/NONO regulates lipid
metabolism and breast cancer growth through SREBP-1A. Oncogene.
35:1399–1410. 2016.
|
|
41
|
Nagao A, Kobayashi M, Koyasu S, Chow CCT
and Harada H: HIF-1-dependent reprogramming of glucose metabolic
pathway of cancer cells and its therapeutic significance. Int J Mol
Sci. 20:2382019.
|