Introduction
Ewing sarcoma (ES), the second most common malignant
bone tumor, is an aggressive cancer that primarily affects children
and young adults (1). ES arises
predominantly in the pelvis, long bones and ribs (2,3).
Recently, a multimodal treatment approach consisting of surgery
and/or radiotherapy with intensive chemotherapy has markedly
improved the survival of patients with localized ES. Thus, the
current 5-year overall survival rate of patients with localized ES
ranges from 65 to 75% (4,5). However, the rates of local recurrence
and distant metastasis have been reported to be 6.2 to 7% and 12.9
to 31%, respectively (6,7), and the 5-year overall survival rate
for patients with local recurrence and/or distant metastasis has
been reported to be <25% (8-10).
Hence, obtaining a better understanding of the mechanisms
underlying local recurrence and distant metastasis following
curative therapies is a time-sensitive matter of critical
importance for patients with ES.
Human malignancies display intratumoral
heterogeneity in phenotypic features, as regards cellular
morphology, gene expression, metabolism, motility and angiogenic,
proliferative, immunogenic, and metastatic potential (11). This phenotypic heterogeneity is
considered to be one of the major causes of treatment failure when
implementing state-of-the-art cancer therapies (12).
As one example, in heterogeneous tumor cell
populations, there is generally a small subpopulation of
slow-cycling cells (SCCs), defined as non-proliferating
quiescent/dormant cells (13,14).
Previous research has demonstrated the existence of SCCs, and has
described their properties in various human cancer cell cultures
and xenograft models. For example, a small subpopulation of SCCs
was identified in a study evaluating melanoma cells, and these
cells demonstrated chemoresistance (15). The high invasive ability of SCCs in
melanoma has also been reported in prior research (16). Similarly, chemoresistance and the
tumorigenic potential of SCCs have been observed in colon cancer
and breast cancer cell lines (17), and SCCs in glioblastoma have
demonstrated resistance to both chemotherapy and radiotherapy
(18). However, to the best of our
knowledge, SCCs have not been previously studied in ES, and their
characteristics are unknown. Therefore, investigating the
characteristics of SCCs in ES is a highly understudied topic of
substantial clinical importance and has the potential to provide
meaningful information for improving existing ES treatment
regimens.
Several label-retaining systems have been reported
to effectively identify SCCs/quiescent cells in both normal and
cancer cell lines (13,16-21).
Using these label-retaining systems, SCCs or quiescent cells can be
distinguished from other cell populations by the slowed cell
division of SCCs as compared to other cells. Moreover, among these
systems, the use of carboxyfluorescein diacetate succinimidyl ester
(CFSE) green fluorescent dye is a well-established method (13), and has been applied in studies
investigating SCCs in several types of cancer (17,19-21).
More specifically, in the CFSE labeling system, once
the cells are labeled with CFSE, the fluorescence in the cells is
equally distributed between the daughter cells upon division. Since
the fluorescence in the cells is gradually diluted by cell
proliferation and only non-dividing cells or SCCs can retain strong
fluorescent staining via CFSE for a long period of time,
researchers can effectively distinguish SCCs (with strong
fluorescence) from non-slow-cycling cells (non-SCCs) (with weak
fluorescence).
According to previous studies (17,19-21),
the present study hypothesized the existence of SCCs in ES. The
present study therefore applied a label-retaining system based on
CFSE to ES cell lines, and succeeded in identifying and isolating
SCCs, in the first study of its kind conducted to date, to the best
of our knowledge. Moreover, the distinctive properties of SCCs in
ES were comprehensively described by evaluating their sphere
formation ability, cell cycle distribution and chemoresistance. In
addition, RNA sequencing revealed differentially expressed genes in
SCCs as compared with non-SCCs, that not only inhibited cell cycle
progression, but also supported malignant properties, including
invasive capacity and metastatic potential.
Materials and methods
Cells and cell culture
In total, three ES cell lines were used in the
present study. The SK-ES-1 (HTB-86) and A673 (CRL-1598) cells were
purchased from the American Type Culture Collection (ATCC), and the
TC71 (ACC 516) cells were obtained from the Leibniz Institute
DSMZ-German Collection of Microorganisms and Cell Cultures GmbH.
The SK-ES-1 cells were cultured in McCoy's 5A medium
(MilliporeSigma) supplemented with 15% fetal bovine serum (FBS;
MilliporeSigma). The A673 cells were cultured in Dulbecco's
modified Eagle's medium (MilliporeSigma) supplemented with 15% FBS.
The TC71 cells were cultured in Iscove's modified Dulbecco's medium
(Thermo Fisher Scientific, Inc.) supplemented with 10% FBS. All
cell culture media were supplemented with 100 U/ml penicillin
(MilliporeSigma) and 100 µg/ml streptomycin
(MilliporeSigma). The cells were maintained in a humidified
atmosphere with 5% CO2 at 37°C.
Labeling of ES cells with CFSE
The CellTrace CFSE Cell Proliferation kit (cat. no.
C34554; Thermo Fisher Scientific, Inc.) was used to label the ES
cells. Briefly, both a cell suspension (1×10⁶ cells/ml)
and a solution of 4 µM CFSE was prepared in
phosphate-buffered saline (PBS) supplemented with 1% FBS. Equal
amounts of the cell suspension and CFSE solution were mixed, and
the cells were incubated at a final concentration of 2 µM by
incubation at 37°C for 10 min under dark conditions. The cells were
quenched three times with cold PBS supplemented with 10% FBS. These
cells were then used as CFSE-labeled cells for the experiments
described below. CFSE fluorescence was confirmed using an
all-in-one fluorescence microscope (BZ-X700; Keyence
Corporation).
Definition of SCCs and the sorting of
cells into SCCs and non-SCCs
CFSE fluorescence in ES cells was preliminarily
evaluated in both sphere and adherent cultures, and it was
confirmed that the CFSE fluorescence intensity was more
heterogeneous in the sphere cultures (Fig. S1). These findings indicated that
cell division was more variable in spheres than in adherent
cultures; therefore, sphere cultures were used in all the
experiments in the present study. Since the cells retaining a
strong CFSE fluorescence decreased in a culture period of >5
days in the preliminary study (data not shown), the cells were
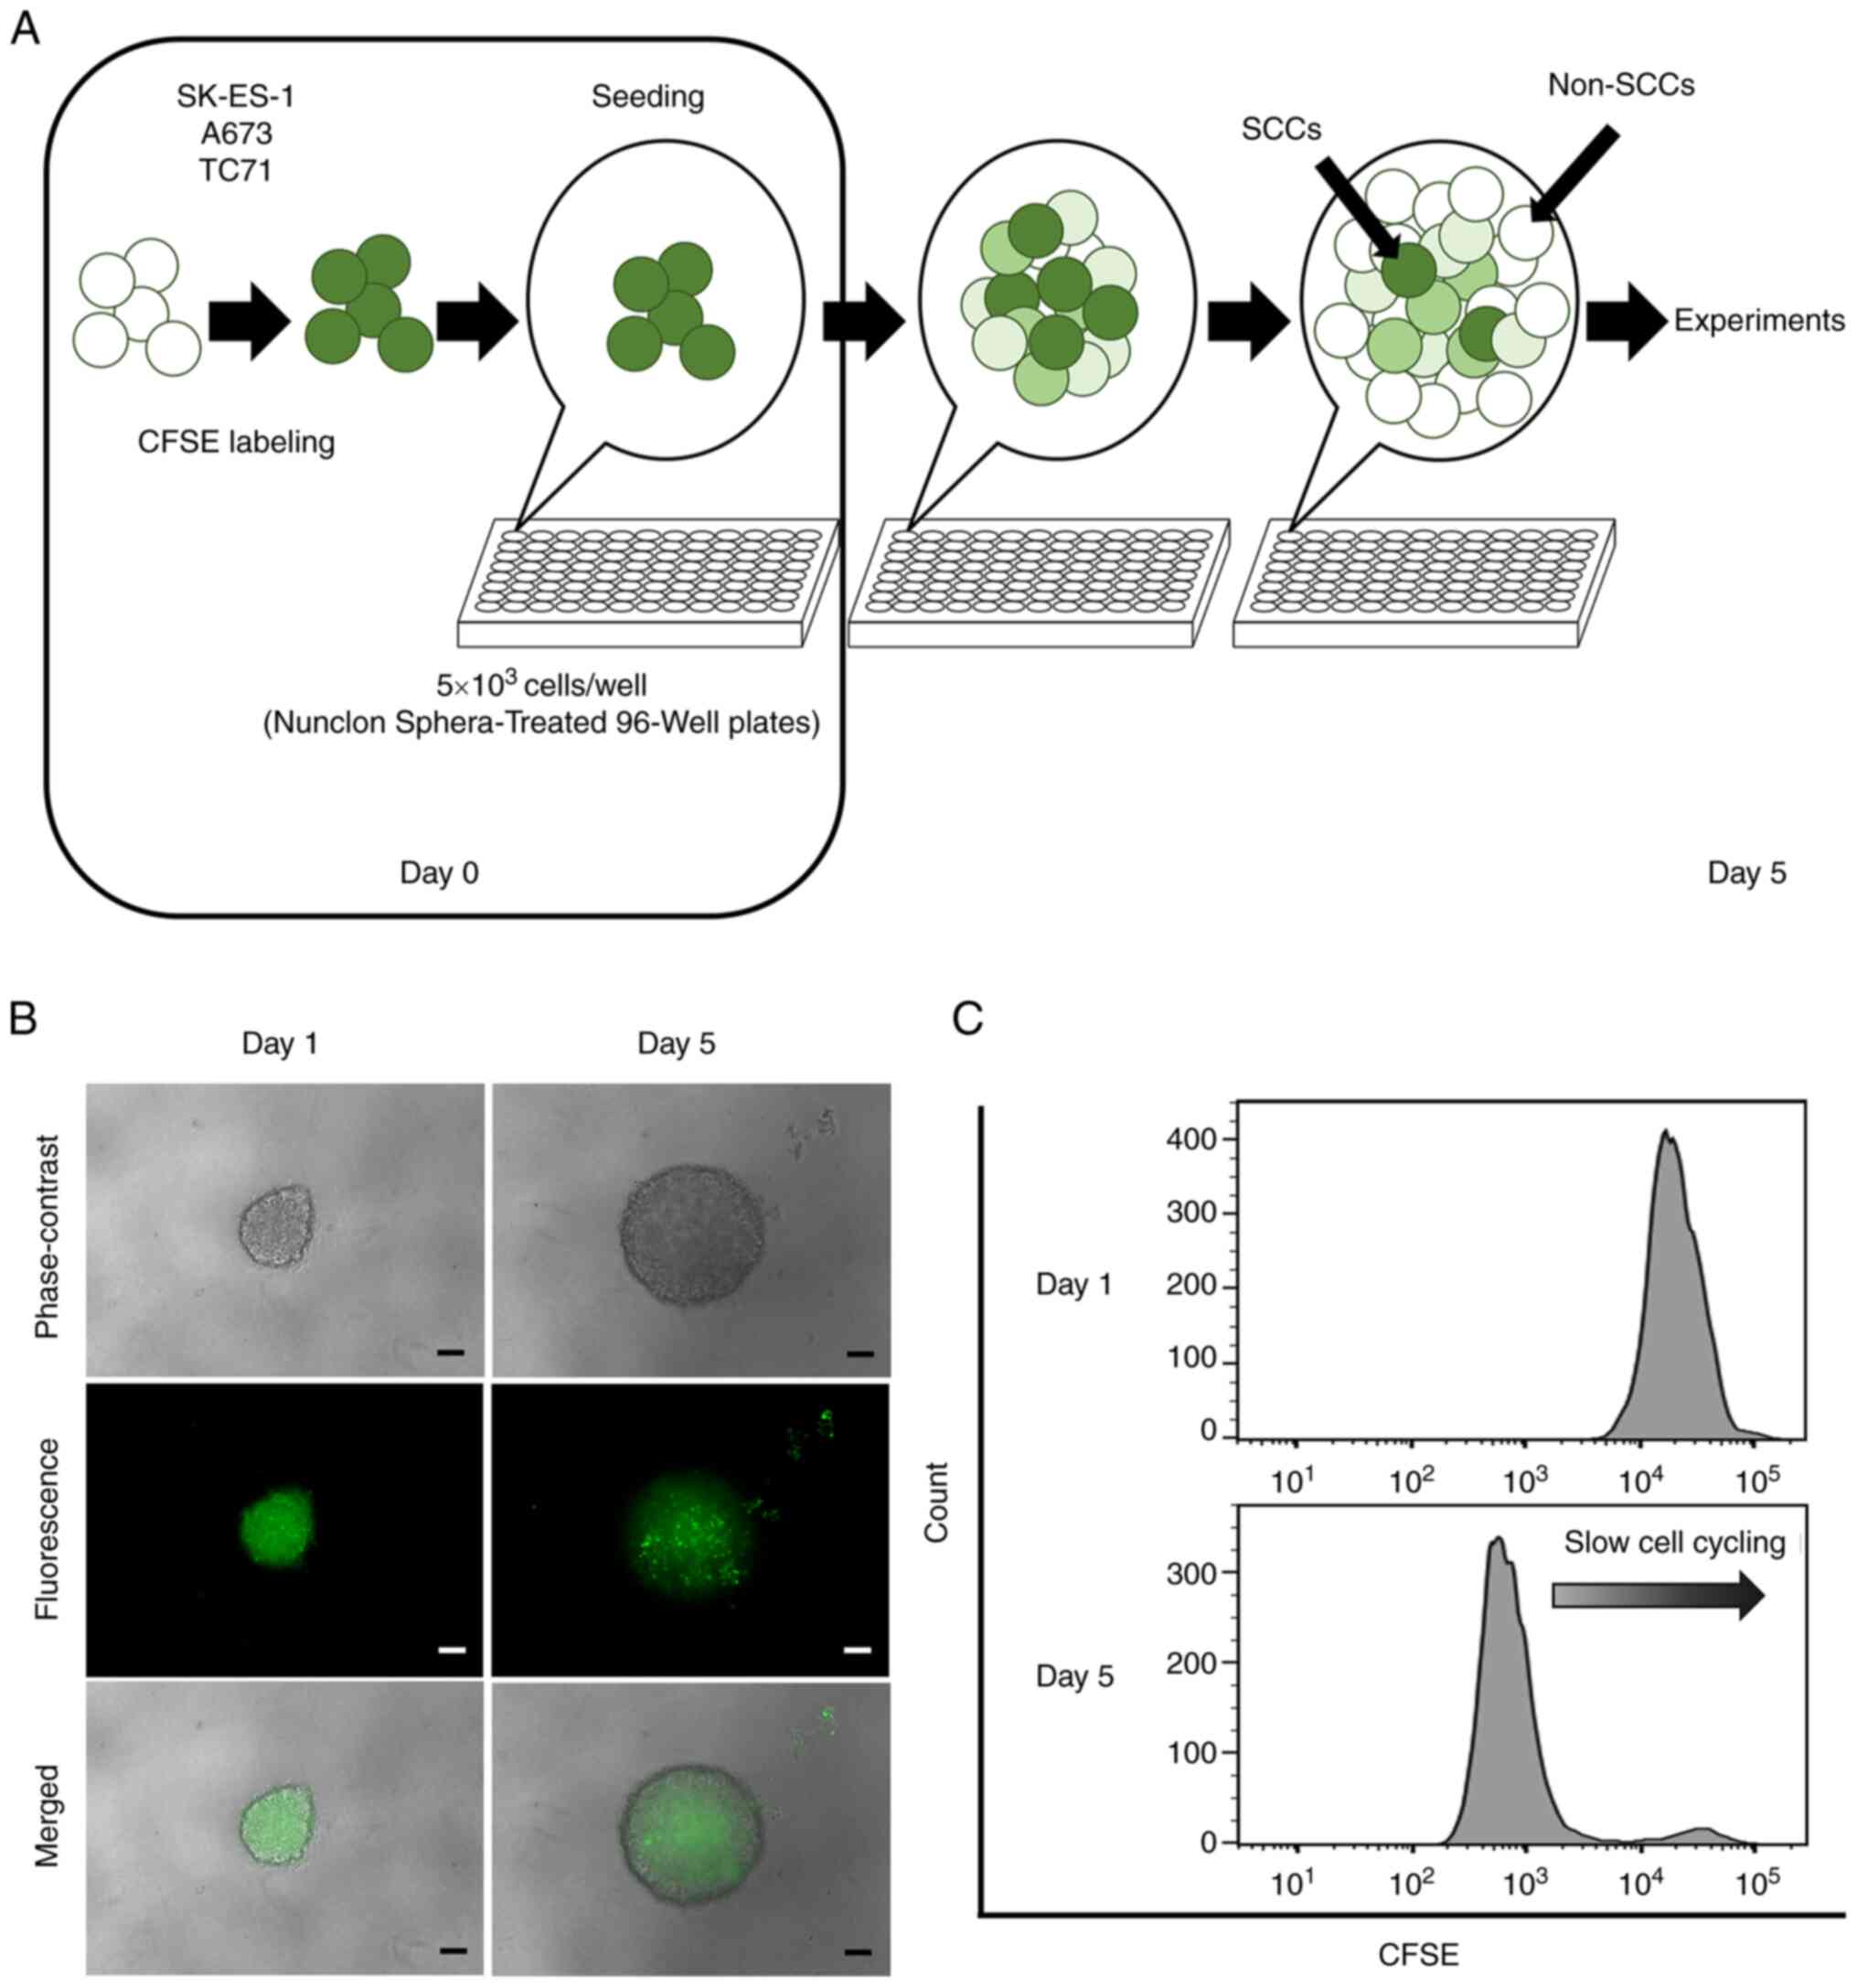
collected at day 5 after seeding for the experiments.
CFSE-labeled cells (5×10³ cells/well)
were seeded into Nunclon Sphera 96-well, Nunclon Sphera-treated,
U-shaped-bottom Microplates (cat. no. 174929; Thermo Fisher
Scientific, Inc.). The plates were centrifuged at 228 × g for 3 min
at room temperature. Following 5 days of culture, the CFSE-labeled
cells formed a single sphere in each well (Fig. 1A). The spheres were confirmed under
a fluorescence microscope (BZ-X700; Keyence Corporation).
For the flow cytometric analysis, each sphere was
collected and dissociated using Accumax (cat. no. AM105; Nacalai
Tesque, Inc.) to prepare single-cell suspensions, and the CFSE
fluorescence of each cell was evaluated using a BD LSRFortessa cell
analyzer (BD Biosciences). In the present study, cells retaining a
strong CFSE fluorescence (i.e., in the top 10%) were defined as
SCCs and other cells as non-SCCs on day 5 after seeding. For
sorting, single cells obtained from each sphere were resuspended in
Hank's Balanced Salt Solution (HBSS; cat. no. 14175079; Thermo
Fisher Scientific, Inc.) containing 1 mM UltraPure 0.5 M
ethylenediaminetetraacetic acid (EDTA; pH 8.0; cat. no. 15575020;
Thermo Fisher Scientific, Inc.), and 25 mM
4-[2-hydroxyethyl]-1-piperazineethanesulfonic acid (HEPES; cat. no.
H3375; MillporeSigma), 2% FBS, 100 U/ml penicillin and 100
µg/ml streptomycin. The sorting of cells into SCCs and
non-SCCs was conducted using a BD FACS Aria III cell sorter (BD
Biosciences) with the exclusion of doublets and dead cells.
Sphere formation assay
The sorted SCCs (1×10⁵ cells/well) and
non-SCCs (1×10⁵ cells/well) from the SK-ES-1 cells were
seeded into Costar 24-well Clear Flat Bottom Ultra-low Attachment
Multiple Well Plates (Corning, Inc.) in serum-free McCoy's 5A
medium containing 10 ng/ml basic fibroblast growth factor (cat. no.
062-06661; FUJIFILM Wako Pure Chemical Corporation), 10
µg/ml human insulin (cat. no. 0105; Cell Science &
Technology Institute, Inc.), 100 µg/ml human transferrin
(cat. no. 10652202; MillporeSigma) and 100 µg/ml bovine
serum albumin (cat. no. 019-21272; Nacalai Tesque, Inc.) and were
incubated at 37°C for 6 days in order to form spheres, as
previously described (22). Formed
spheres ≥50 µm in size in each well were manually counted
under a fluorescence microscope (BZ-X700; Keyence Corporation) by
two examiners blinded to the sorting conditions.
Cell cycle analysis
Single cells (1×10⁶ cells) obtained from
spheres were fixed with cold 70% ethanol for 30 min on ice under
dark conditions and washed twice with PBS. The cells were then
centrifuged at 130 × g for 5 min at room temperature and
resuspended in 0.5 ml propidium iodide (PI, in PI/RNase Staining
Buffer; cat. no. 550825; BD Biosciences). Following incubation for
15 min on ice under dark conditions, the DNA content of the samples
was analyzed using PI and flow cytometry (BD LSRFortessa cell
analyzer; BD Biosciences). Data were analyzed using FlowJo analysis
software (version 10.7.2; BD Biosciences), and the cell cycle
distribution was determined by applying the Dean-Jett-Fox
cell-cycle modeling algorithm to the PI fluorescence intensity
profile of the cells.
Drug treatment of CFSE-labeled ES
cells
Drug treatment assays were performed in the sphere
culture of CFSE-labeled SK-ES-1 cells, not using sorted SCCs and
non-SCCs. The assays were performed in a similar environment as the
in vivo conditions, and using a sphere culture known to be
possible to create the in vivo conditions (23). In addition, the process of the cell
sorting may affect the condition of the cells during the drug
treatment assays, and the affect should be avoided. CFSE-labeled
SK-ES-1 cells (5×10³ cells/well) were seeded in each
well of Nunclon Sphera-Treated 96-Well Plates (Thermo Fisher
Scientific, Inc.) and cultured for 3 days in order to form single
spheres. The medium was then replaced with medium containing no
drug (i.e., the control medium), 30 nM doxorubicin (Dox; cat. no.
D1515; MilliporeSigma), or 5 nM vincristine (Vin; cat. no. V8879;
MilliporeSigma) followed by incubation for 2 days at 37°C. To
evaluate the CFSE fluorescence intensity following drug treatment,
Z-stack images of the spheres were captured under a fluorescence
microscope (BZ-X700; Keyence Corporation). The area with CFSE
fluorescence (%) in each sphere was quantitatively calculated using
a hybrid cell count application available in the BZ-X Analyzer
software (BZ-H4A; Keyence Corporation).
The apoptotic analysis of drug-treated cells was
performed using flow cytometry with dual staining with APC Annexin
V (Annexin V; cat. no. 550475; BD Biosciences) and PI (cat. no.
556463; BD Biosciences). Briefly, single cells obtained from each
sphere after 2 days of drug treatment were washed twice with cold
PBS and resuspended in 1X Annexin V binding buffer (cat. no.
556454; BD Biosciences) at a concentration of 2×10⁶
cells/ml. The cell solution (2×10⁵ cells in 100
µl) was then transferred into a 1.5-ml tube, and 5 µl
Annexin V and 2 µl PI were added. The tubes were vortexed
gently and incubated for 15 min at room temperature under dark
conditions. Following this, 400 µl 1X Annexin V binding
buffer was added to each tube, and the samples were analyzed using
a flow cytometer (BD LSRFortessa cell analyzer; BD Biosciences).
Data were analyzed using FlowJo analysis software (version 10.7.2;
BD Biosciences).
RNA sequencing
For RNA sequencing, total RNA was extracted from the
cells using TRIzol® reagent according to the
manufacturer's instructions (cat. no. 15596026; Thermo Fisher
Scientific, Inc.). After sorting the SK-ES-1 cells into SCCs and
non-SCCs, 2×10⁵ cells from each cell fraction were lysed
and homogenized in 1 ml TRIzol® reagent in a tube. The
samples were incubated for 5 min at room temperature to permit the
complete dissociation of the nucleoprotein complexes. Following
this, 200 µl chloroform (cat. no. 038-02606; FUJIFILM Wako
Pure Chemical Corporation) were added, and the tubes were shaken
vigorously for 15 sec. This was followed by incubation at room
temperature for 3 min. The samples were transferred to phasemaker
tubes (Thermo Fisher Scientific, Inc.) and centrifuged at 12,000 ×
g for 15 min at 4°C. The aqueous phase in the phasemaker tube was
transferred to a fresh tube and mixed with 500 µl isopropyl
alcohol. Following 10 min of incubation at room temperature, the
mixture was washed once with 75% ethanol and centrifuged at 7,500 ×
g for 5 min at 4°C. The supernatant liquid was discarded, and the
RNA pellets were air-dried and dissolved in distilled water. For
RNA quality control, the concentration and purity were examined
using a NanoDrop 1000 Spectrophotometer (Thermo Fisher Scientific,
Inc.). Total RNA samples from SCCs and non-SCCs were submitted to
Macrogen for library preparation using the TruSeq Stranded mRNA LT
Sample Prep kit (Illumina, Inc.). Paired-end RNA sequencing was
performed using the Illumina NovaSeq6000 System (Illumina, Inc.).
Reads were aligned to human transcriptome (hg38) reference
sequences using the Strand NGS software program (Strand Life
Sciences). The aligned reads were normalized to transcripts per
million (TPM) and the normalized counts were set to 1. TPM values
(log2) were used to compare gene expression levels between SCCs and
non-SCCs. Gene expression data were visualized using scatter plots,
and pathway analyses were conducted using WikiPathways (https://wikipathways.org/) within the Strand NGS
software program (https://www.strand-ngs.com/).
Statistical analysis
Statistical analyses were conducted using EZR
statistical software (Saitama Medical Centre, Jichi Medical
University; http://www.jichi.ac.jp/saitama-sct/SaitamaHP.files/statmedEN.html;
Kanda, 2012). All values are presented as the mean ± standard error
of the mean. Comparisons between two groups were performed using
unpaired t-tests. Comparisons between multiple groups were
determined using one-way analysis of variance (ANOVA) followed by
post-hoc testing using the Tukey procedure (i.e., Tukey's honest
significant difference test). A two-sided P-value <0.05 was
considered to indicate a statistically significant difference.
Results
Identification of SCCs in ES
The formation of a single sphere with CFSE
fluorescence in each well was confirmed under a fluorescence
microscope at 1 day after seeding (Fig. 1B). Microscopic evaluation and flow
cytometric analyses performed on day 5 revealed that the detected
CFSE fluorescence gradually weakened in the majority of the cells,
and that only a small number of cells retained strong CFSE
fluorescence (Fig. 1B and C).
Cells that retained a strong fluorescence (top 10%) as of day 5
were defined as SCCs, and other cells were categorized as
non-SCCs.
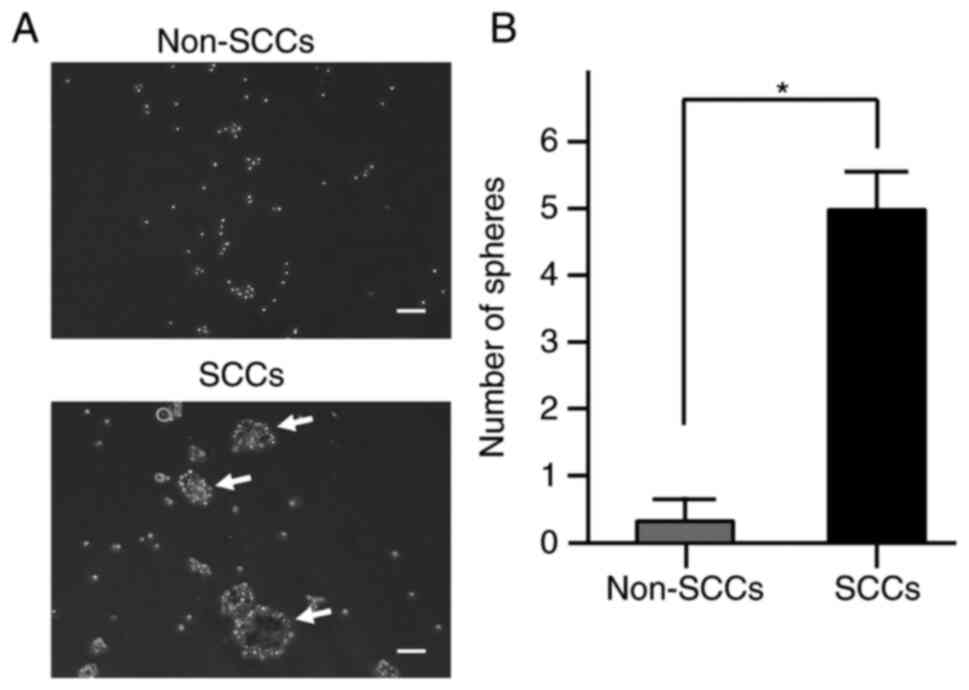
Sphere formation ability of SCCs as
compared to non-SCCs
Previous research has reported that sphere formation
ability is one of the characteristics of SCCs in cancer cell lines
(18), and that this ability is
also associated with tumorigenicity in ES (24). Therefore, the present study
examined the sphere formation ability of SCCs within ES cells in
comparison with that of non-SCCs. Sphere formation assays
demonstrated that the number of spheres was significantly higher in
SCCs than in non-SCCs (P<0.05; Fig.
2A and B). These results indicated that the sphere formation
ability was enhanced in SCCs within ES.
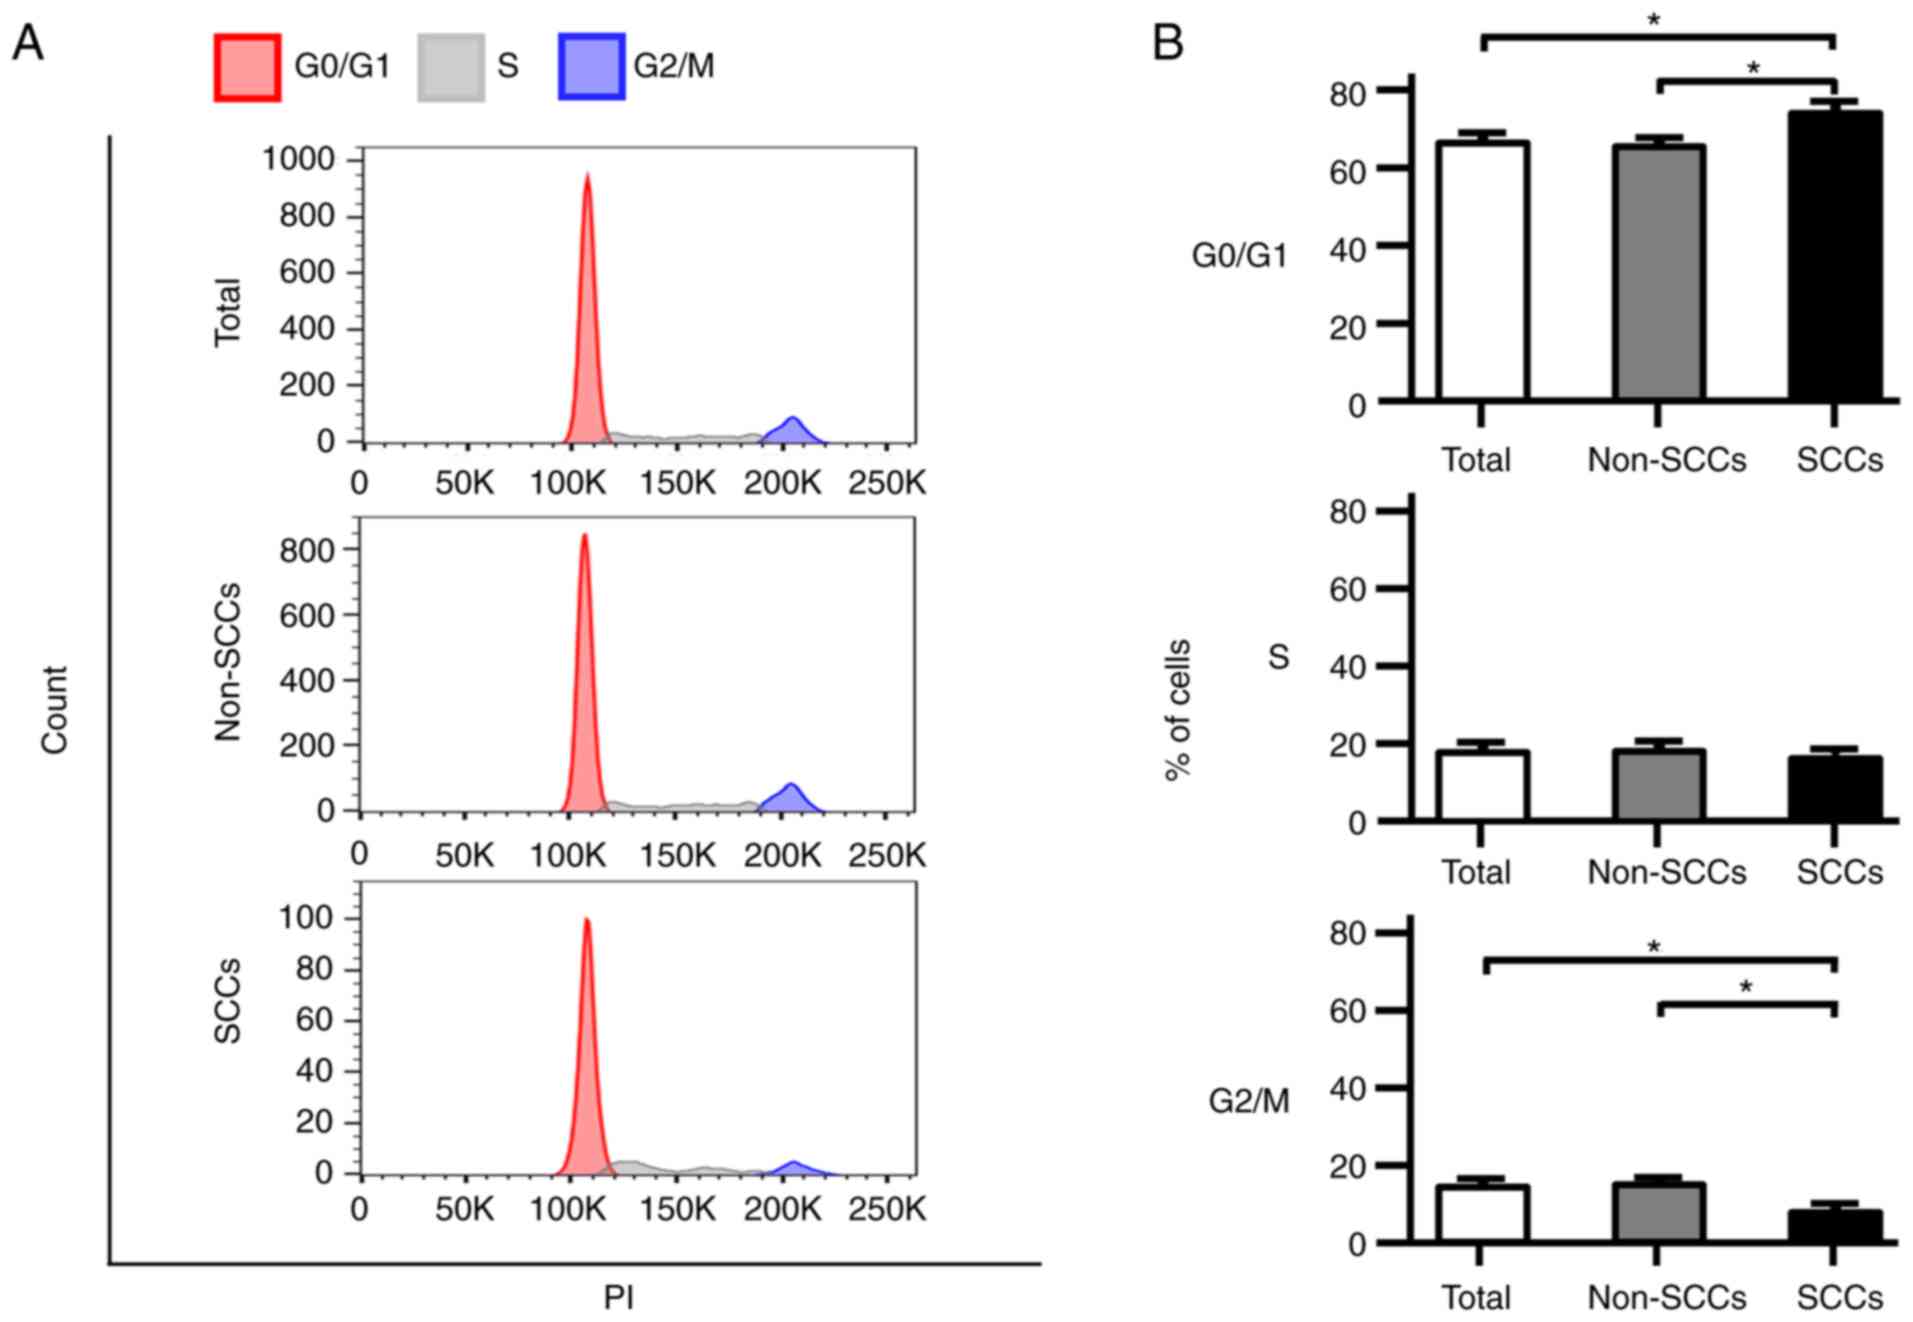
Proportion of cells in the G0/G1 phase in
SCCs vs. non-SCCs
Cell cycle analyses were performed using flow
cytometry, and the phase distribution of the cell cycle was
compared among total cells, non-SCCs and SCCs in the SK-ES-1 cell
line. Notably, the proportion of cells in the G0/G1 phase was
significantly higher in the SCCs than in both total cells and
non-SCCs (P<0.05; Fig. 3A and
B). In addition, the number of cells in the G2/M phase in SCCs
was significantly lower than that in both total cells and non-SCCs
(P<0.05). Analyses were also performed using the A673 and TC71
ES cell lines; similarly, an increased number of cells in the G0/G1
phase and a decreased number of cells in the G2/M phase were
observed in both cell lines for SCCs as compared with non-SCCs
(Fig. S2A and B).
Resistance to doxorubicin and vincristine
in SCCs vs. non-SCCs
As previously reported, SCCs exhibit chemoresistance
within several types of cancer (17,18).
The present study thus assessed the chemoresistance of SCCs found
in ES to Dox and Vin using spheres formed by CFSE-labeled cells
(Fig. 4A). Following 2 days of
drug treatment, CFSE fluorescence was observed in the evaluated
spheres under a fluorescence microscope (Fig. 4B). The area with CFSE fluorescence
was significantly greater in the spheres treated with Dox and Vin
than in the spheres subjected to the control treatment (no drugs)
(P<0.05; Fig. 4C).
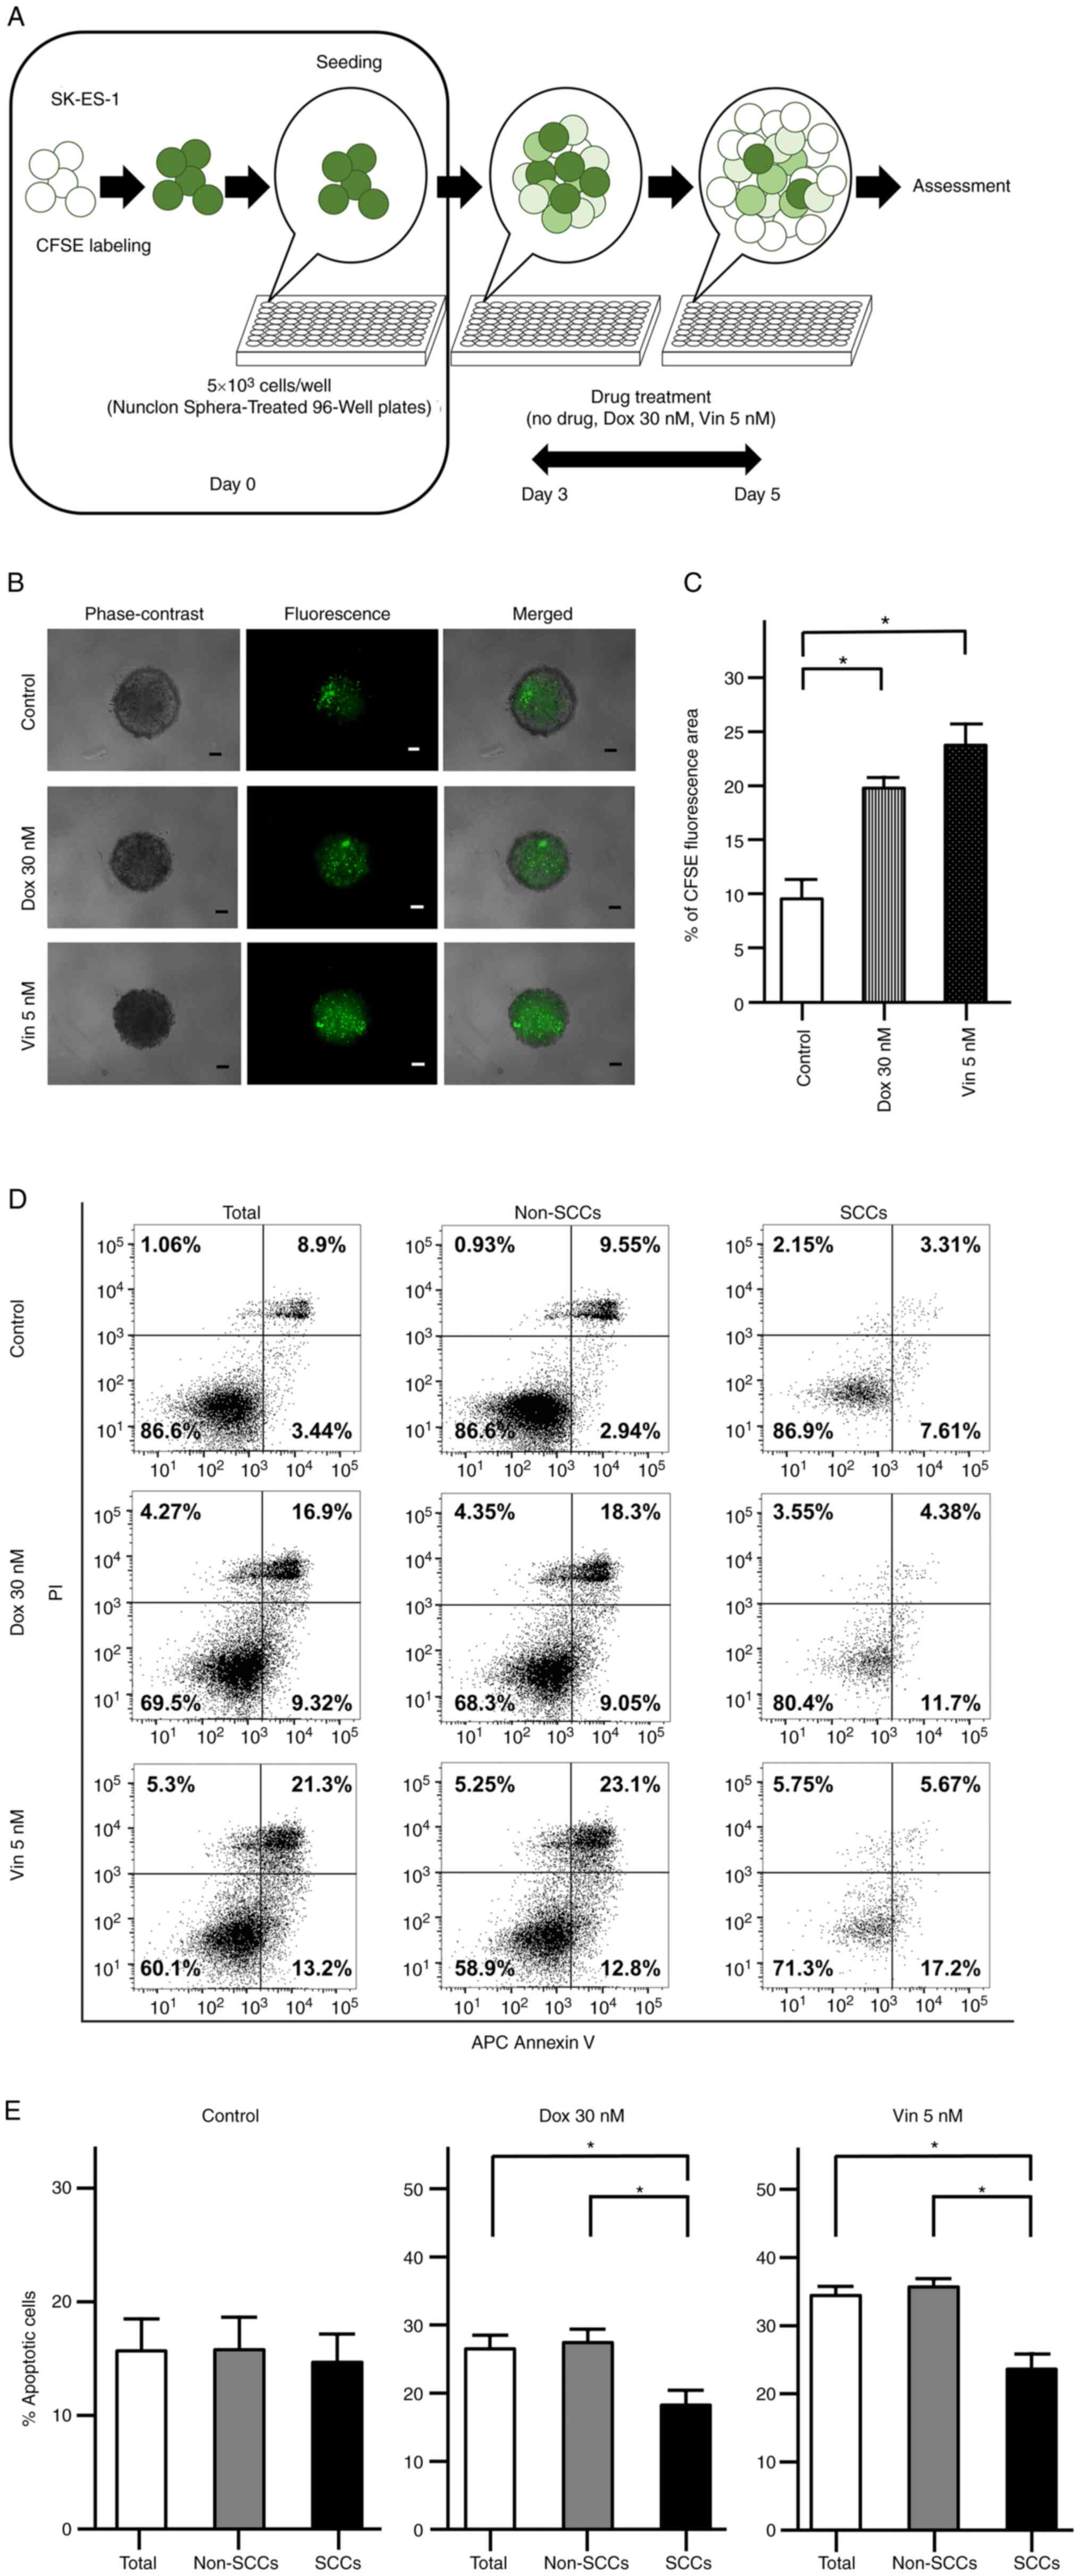 | Figure 4Chemoresistance of CFSE-labeled
SK-ES-1 cells. (A) Schematic diagram evaluating the chemoresistance
of CFSE-labeled SK-ES-1 cells. (B) Representative phase-contrast,
fluorescence and merged images of spheres derived from CFSE-labeled
SK-ES-1 cells. Scale bars, 100 µm. (C) Percentage of the
CFSE fluorescence area following 2 days of drug treatment. The
error bars indicate the standard error of the mean.
*P<0.05. (D) Apoptosis assays by dual staining with
APC Annexin V and PI using flow cytometry. The percentage of the
cells was calculated after 2 days of drug treatment in each
fraction: Left lower panel, APC Annexin V-negative/PI-negative;
right lower panel, APC Annexin V-positive/PI-negative; left upper
panel, APC Annexin V-negative/PI-positive; right upper panel, APC
Annexin V-positive/PI-positive. (E) Percentage of apoptotic cells
after 2 days of drug treatment in total cells, non-SCCs and SCCs in
the SK-ES-1 cell line. The error bars indicate the standard error
of the mean. *P<0.05. CFSE, carboxyfluorescein
diacetate succinimidyl ester; Dox, doxorubicin; PI, propidium
iodide; SCCs, slow-cycling cells; Vin, vincristine. |
The apoptotic cells were further examined following
drug treatment using flow cytometry with dual staining with Annexin
V and PI (Fig. 4D). In the control
group, there were no significant differences in the percentages of
Annexin V-positive cells among the total cells, non-SCCs and SCCs.
OF note, the percentages of Annexin V-positive cells were
significantly decreased in the SCCs as compared with both the total
cells and non-SCCs when the spheres were treated with Dox or Vin
(P<0.05; Fig. 4E).
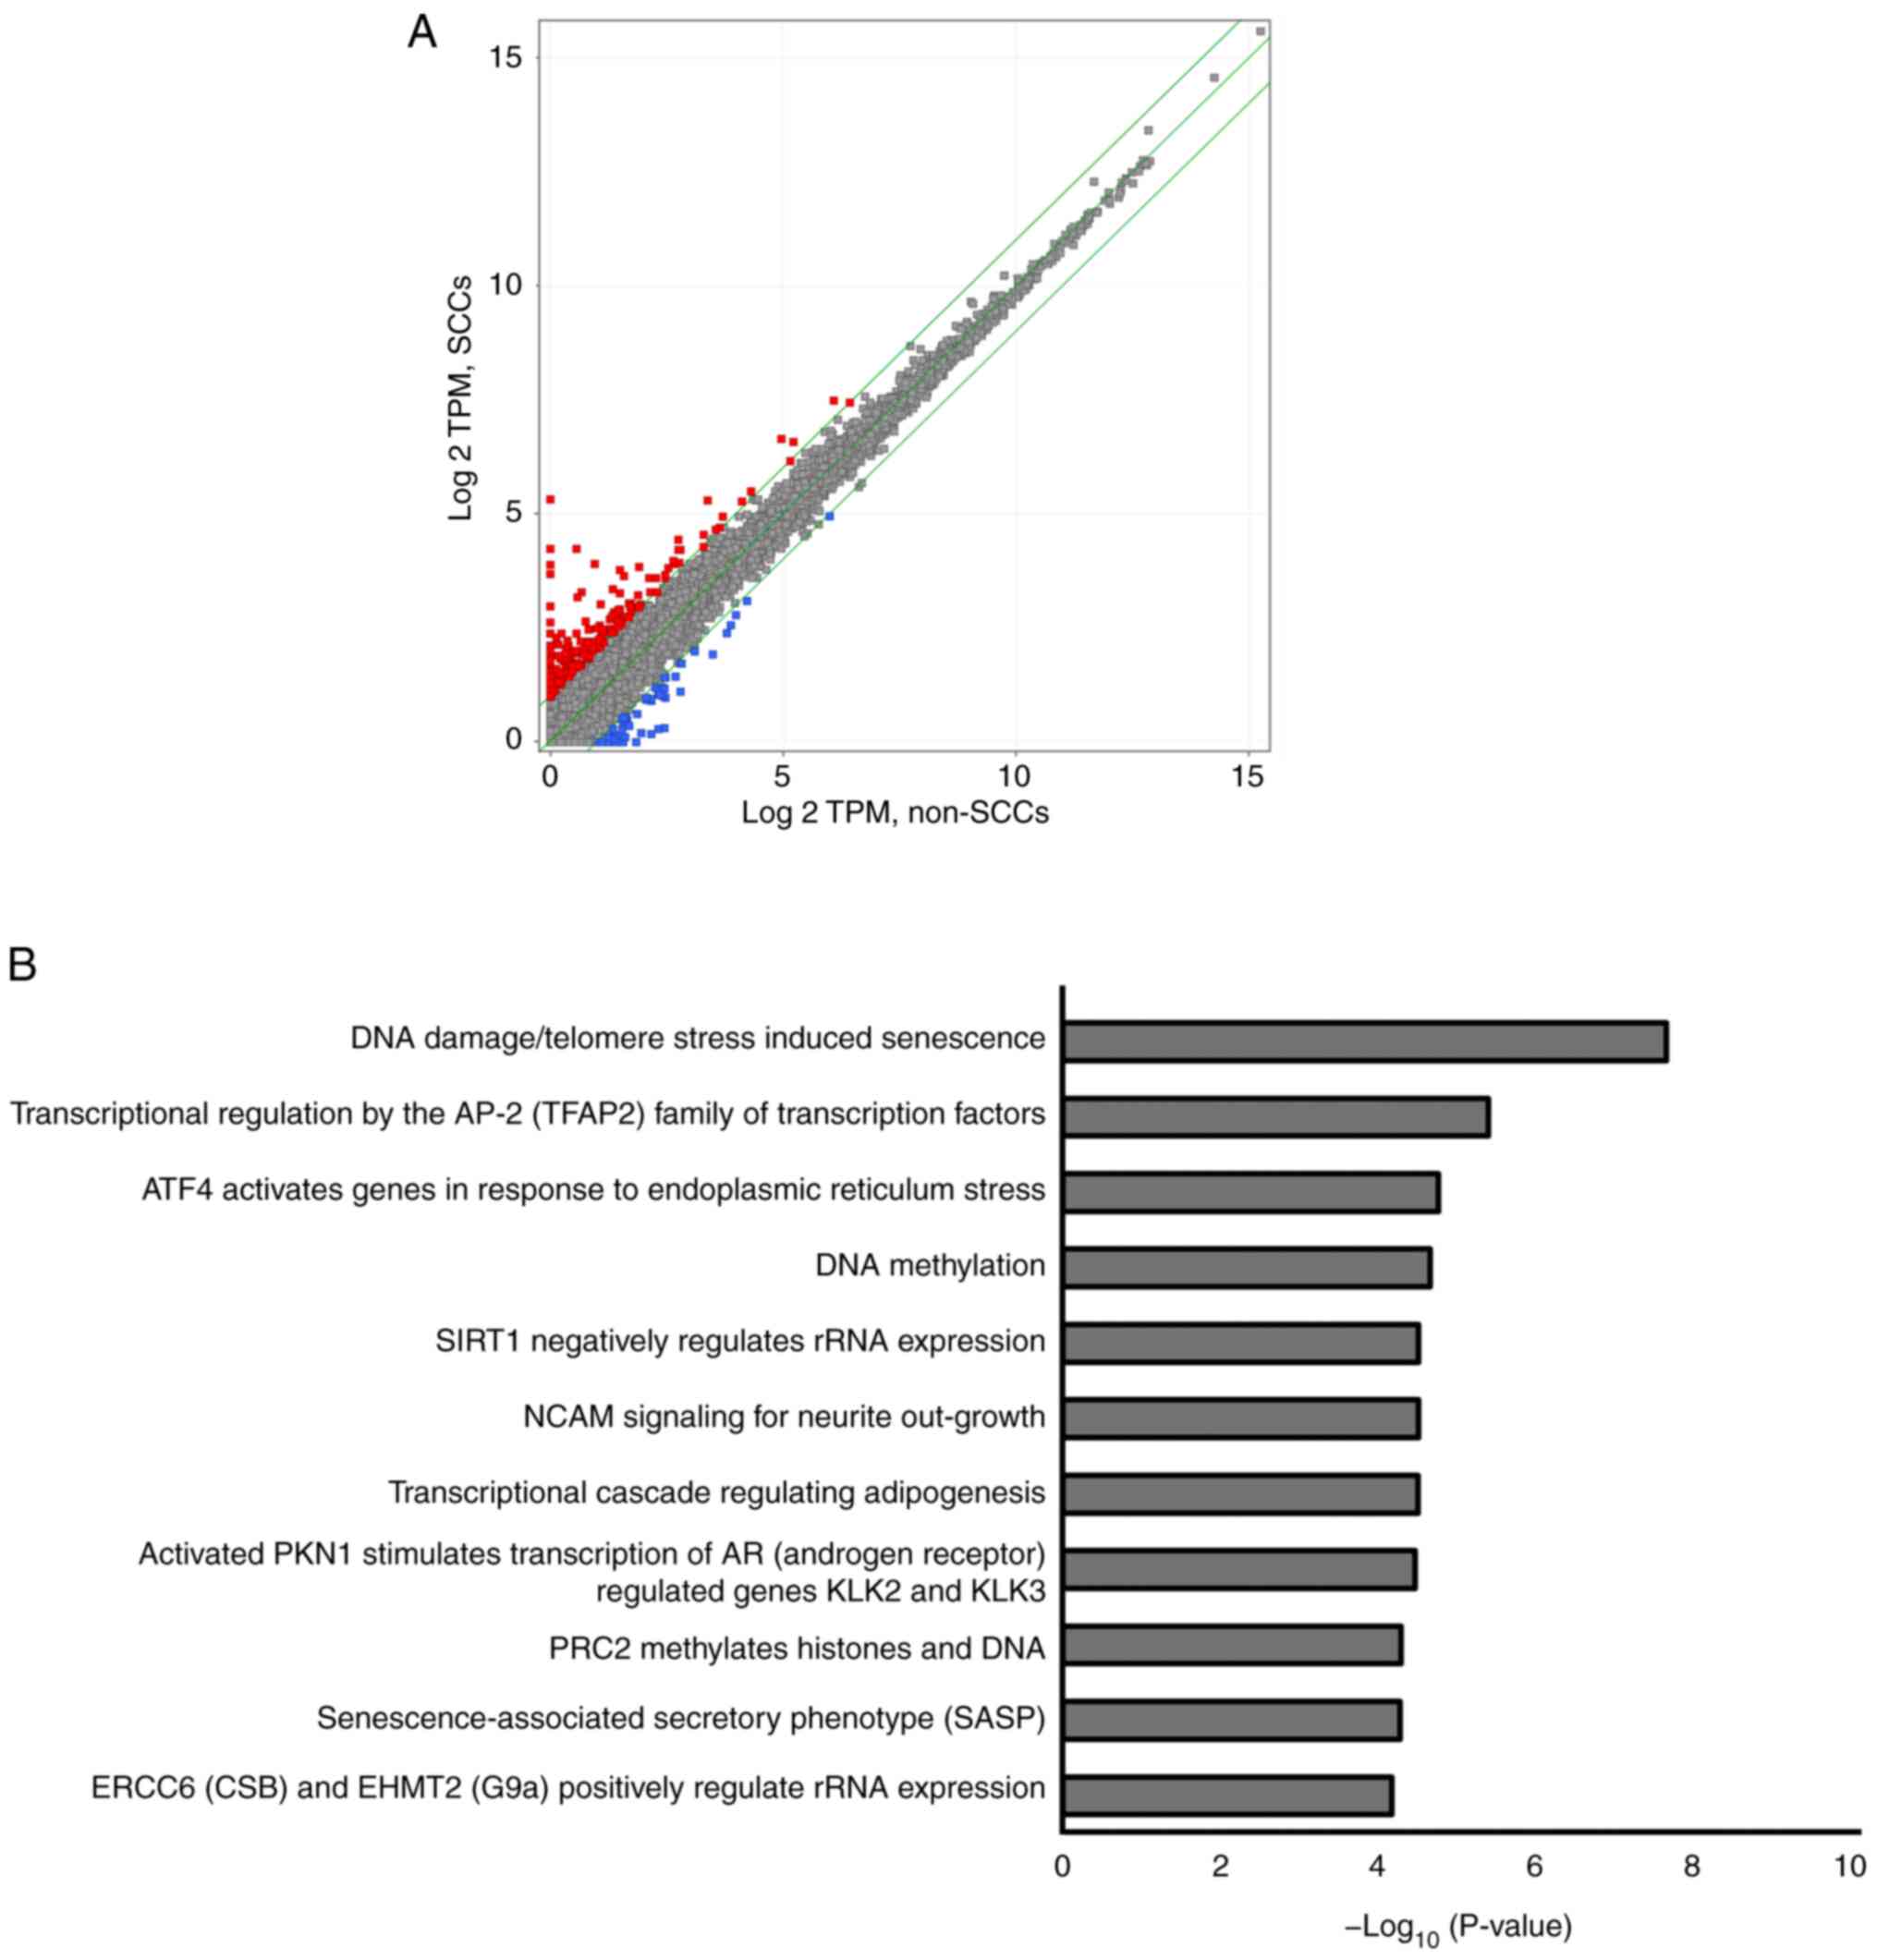
Upregulated expression of various genes
and involved pathways in RNA sequencing
RNA sequencing was performed using the SK-ES-1 cells
to evaluate differences in gene expression patterns between SCCs
and non-SCCs. As illustrated in Fig.
5A, 255 genes were upregulated by >2-fold in the SCCs as
compared to the non-SCCs (red dots), whereas 58 genes were
downregulated by ≤2-fold in SCCs as compared to the non-SCCs (blue
dots).
A total of 11 pathways were detected using pathway
analysis, including 'DNA damage/telomere stress induced
senescence', 'Transcriptional regulation by the AP-2 (TFAP2) family
of transcription factors', and 'ATF4 activates genes in response to
endoplasmic reticulum stress'. Each detected pathway was associated
with a P-value <10−5, and these pathways were
associated with the aforementioned 255 upregulated genes found in
SCCs (Fig. 5B). Genes involved in
each pathway included cyclin-dependent kinase inhibitor 1A
(CDKN1A), activating transcription factor 3 (ATF3)
and DNA damage-inducible transcript 3 (DDIT3) (Table I). Pathway analyses of the
aforementioned downregulated genes did not reveal any statistically
significant pathways (data not shown).
 | Table IGenes involved in the 11 pathways
detected using pathway analyses. |
Table I
Genes involved in the 11 pathways
detected using pathway analyses.
| Pathway | Genes |
|---|
| DNA damage/telomere
stress Induced Senescence | CDKN1A, HIST1H2BC,
HIST1H2AC, HIST1H1E, HIST1H2BJ, HIST2H2BE |
| Transcriptional
regulation by the AP-2 (TFAP2) family of transcription factors | CDKN1A, APOE,
KCTD15 |
| ATF4 activates
genes in response to endoplasmic reticulum stress | ATF3, DDIT3 |
| DNA
methylation | HIST1H2BC,
HIST1H2AC, HIST1H2BJ, HIST2H2BE |
| SIRT1 negatively
regulates rRNA expression | HIST1H2BC,
HIST1H2AC, HIST1H2BJ |
| NCAM signaling for
neurite out-growth | 3x4Hyp-5Hyl-COL6A2,
NCAN, SPTBN4 |
| Transcriptional
cascade regulating adipogenesis | KLF2, EGR2,
DDIT3 |
| Activated PKN1
stimulates transcription of AR (androgen receptor) regulated genes
KLK2 and KLK3 | HIST1H2BC,
HIST1H2AC, HIST1H2BJ, HIST2H2BE |
| PRC2 methylates
histones and DNA | HIST1H2BC,
HIST1H2AC, HIST1H2BJ, HIST2H2BE |
|
Senescence-associated secretory phenotype
(SASP) | CDKN1A, HIST1H2BC,
HIST1H2AC, HIST1H2BJ, HIST2H2BE |
| ERCC6 (CSB) and
EHMT2 (G9a) positively regulate rRNA expression | HIST1H2BC,
HIST1H2AC, HIST1H2BJ, HIST2H2BE |
Discussion
In recent years, SCCs have been studied and are
presently considered to be associated with local recurrence and/or
distant metastasis in various types of cancer (13-21).
However, to the best of our knowledge, SCCs have not been
investigated in ES to date, and the present study was the first to
successfully identify and isolate SCCs from ES cell lines. As
specific markers for SCCs are currently unknown, a label-retaining
system was employed using CFSE; this system is relatively easy to
manage and has been widely used in the research field in previous
studies evaluating SCCs (17,19-21).
Moreover, the distinctive properties of SCCs in ES were elucidated,
such as a higher sphere formation ability, an increased cell
proportion in the G0/G1 phase, and chemoresistance to doxorubicin
and vincristine. These results are consistent with the properties
of SCCs previously reported for other types of cancer (13-15,17-21).
The present study revealed that SCCs in ES exhibited
a higher sphere-formation ability than non-SCCs. Previously, Zeng
et al (18) reported a high
sphere-forming ability of SCCs in glioblastoma cell lines, and Wahl
et al (24) reported that
single cells derived from spheres exhibited a high tumorigenicity
in ES cell lines. These studies strongly suggest that SCCs in ES
have a high tumorigenicity associated with a high sphere-formation
ability. In addition, the sphere formation ability has previously
been used to evaluate anchorage-independent growth (25), a critical step in metastasis
(26). Thus, the high sphere
formation ability evidenced in the present study may also reflect
the metastatic potential of SCCs in ES.
SCCs/quiescent cells are considered to be in a
particular phase of the cell cycle (16,17,27-29).
However, the cell cycle phases of SCCs remain controversial. Bleau
et al (27) found that SCCs
were enriched in the G0/G1 phase in a sphere culture of a non-small
cell lung cancer cell line, and Carcereri de Prati et al
(28) reported that breast cancer
cells entered the quiescent state in the G0/G1 phase under hypoxic
conditions. By contrast, a high proportion of SCCs in the G2/M
phase has been reported in melanoma (16) and colon cancer cell lines (17); Gao et al (29) demonstrated that SCCs were enriched
in the S phase in ovarian cancer cells derived from a patient. In
the present study, it was revealed that SCCs in ES cell lines were
enriched in the G0/G1 phase, and these findings indicated an
extended G0/G1 phase in ES SCCs. Moreover, as regards the cell
cycle, RNA sequencing detected CDKN1A as one of the
upregulated genes in SCCs in ES cells; this gene is involved in
three of the detected pathways (Table
I). Moreover, CDKN1A encodes p21, which is a widely
known inhibitor of the G1/S transition (30,31).
Therefore, CDKN1A may play a crucial role in the extension
of the G0/G1 phase in ES SCCs.
Previous studies have indicated the chemoresistance
of SCCs in various types of cancer, including glioblastoma
(32), and colon (17) and breast cancer (17). In addition, Moore et al
(17) demonstrated that SCCs in
colon and breast cancer cells could re-enter the cell cycle and
actively proliferate following the removal of anticancer drugs. In
the present study, a statistically significant increase was
observed in the percentage of the CFSE fluorescence area in ES
spheres, and a statistically significant decrease in the apoptotic
activity of ES SCCs under treatment with both Dox and Vin (i.e.,
the drugs used in conventional chemotherapeutic regimens for ES)
(33).
The main mechanism underlying the anticancer effects
of Dox is the cessation of the DNA replication process (34), which occurs at the S phase. Thus,
SCCs in ES likely evade the effects of Dox by extending the G0/G1
phase. Moreover, SCCs, which are enriched in the G0/G1 phase, may
be less susceptible to Vin as this drug functions as an inhibitor
in the M phase (35). The findings
of the present study strongly suggest that resistance to Dox and
Vin in SCCs within ES is caused by the enrichment of cells in the
G0/G1 phase, and that the effects of anticancer agents may be
improved by promoting re-entry into the cell cycle.
Using RNA sequencing, the present study identified a
pathway 'ATF4 activates genes in response to endoplasmic reticulum
stress', by the pathway analysis of upregulated genes in SCCs.
Endoplasmic reticulum stress has previously been reported to play a
critical role in cell cycle arrest and chemoresistance in leukemia
and squamous carcinoma (36,37).
Moreover, ATF3 and DDIT3 are upregulated in SCCs and
are each involved in this pathway. Li et al (38) previously reported that ATF3
knockdown impaired the invasion of lung cancer cells. Bandyopadhyay
et al (39) revealed that
ATF3 overexpression promoted invasiveness in vitro, as well
as that the nuclear expression of ATF3 was positively associated
with metastases in prostate cancer. As regards the cell cycle, both
ATF3 and DDIT3 are known to block the G1/S transition (40-42),
thereby potentially resulting in the enrichment of cells in the
G0/G1 phase of SCCs in ES. Therefore, ATF3 and DDIT3 may be
involved in mechanisms relevant to SCCs and, pending confirmation,
may be attractive therapeutic targets specific to SCCs within
ES.
Several limitations of the present study should be
acknowledged. First, all the experiments were performed in
vitro without any in vivo experimentation. As SCCs
comprise a very small population of total cells, it was difficult
to collect a sufficient number of SCCs for in vivo
experiments. Second, the present study did not attempt to confirm
the existence of cells with a molecular signature similar to that
of the SCCs identified in the present study in tumor tissues from
patients with ES. It is thus recommended that future research
investigations build on these efforts in order to elucidate these
questions more comprehensively.
In conclusion, in the present study, SCCs were
identified in ES cell lines using a label-retaining system with
CFSE. It was found that SCCs in ES exhibited an enhanced sphere
formation ability, a distinctive cell cycle distribution in the
G0/G1 phase, and chemoresistance to Dox and Vin. To the best of our
knowledge, the present study was the first to identify SCCs in ES
and demonstrate their characteristics. Moreover, RNA sequencing
identified 255 genes upregulated by >2-fold in SCC, and 11
pathways were detected by pathway analysis using the 255 genes. The
genes and the pathways may be used to develop biomarkers or as
therapeutic targets for SCCs and/or Ewing sarcoma. Although
additional studies are required to elucidate the characteristics of
SCCs in ES, exploring SCCs using the employed label-retaining
system with CFSE may be useful in revealing molecular mechanisms
and identifying effective therapeutic targets in ES.
Supplementary Data
Availability of data and materials
The datasets used and/or analyzed during the current
study are available from the corresponding author on reasonable
request. The RNA sequencing data have been deposited in NCBI GEO
under accession no. GSE204671.
Authors' contributions
SY and SF wrote the manuscript, collected and
assembled the data, and performed the data analysis and
interpretation. HH, NF, RS, TT, TMiyamoto, YM, KK, YH, SH,
TMatsumoto and TMatsuhita collected and/or assembled the data. MKA
performed the data analysis and interpretation. TK, TaA, RK and ToA
designed, collected and/or assembled the data, performed the data
analysis and interpretation, and gave the final approval of the
manuscript. SY, TK and SF confirm the authenticity of all the raw
data. All authors have read and approved the final manuscript.
Ethics approval and consent to
participate
Not applicable.
Patient consent for publication
Not applicable.
Competing interests
The authors declare that they have no competing
interests.
Acknowledgments
The authors would like to thank Ms. Minako Nagata,
Ms. Maya Yasuda and Ms. Kyoko Tanaka (Department of Orthopaedic
Surgery, Kobe University Graduate School of Medicine, Kobe, Japan)
for their expert technical assistance.
Funding
The present study was supported by JSPS KAKENHI grant no.
22K15527.
References
|
1
|
Balamuth NJ and Womer RB: Ewing's sarcoma.
Lancet Oncol. 11:184–192. 2010. View Article : Google Scholar : PubMed/NCBI
|
|
2
|
Damron TA, Ward WG and Stewart A:
Osteosarcoma, chondrosarcoma, and Ewing's sarcoma: National cancer
data base report. Clin Orthop Relat Res. 459:40–47. 2007.
View Article : Google Scholar : PubMed/NCBI
|
|
3
|
Potratz J, Dirksen U, Jürgens H and Craft
A: Ewing sarcoma: Clinical state-of-the-art. Pediatr Hematol Oncol.
29:1–11. 2012. View Article : Google Scholar : PubMed/NCBI
|
|
4
|
Gaspar N, Hawkins DS, Dirksen U, Lewis IJ,
Ferrari S, Le Deley MC, Kovar H, Grimer R, Whelan J, Claude L, et
al: Ewing sarcoma: Current management and future approaches through
collaboration. J Clin Oncol. 33:3036–3046. 2015. View Article : Google Scholar : PubMed/NCBI
|
|
5
|
Rodríguez-Galindo C, Liu T, Krasin MJ, Wu
J, Billups CA, Daw NC, Spunt SL, Rao BN, Santana VM and Navid F:
Analysis of prognostic factors in Ewing sarcoma family of tumors:
Review of St. Jude children's research hospital studies. Cancer.
110:375–384. 2007. View Article : Google Scholar : PubMed/NCBI
|
|
6
|
Paulussen M, Ahrens S, Dunst J, Winkelmann
W, Exner GU, Kotz R, Amann G, Dockhorn-Dworniczak B, Harms D,
Müller-Weihrich S, et al: Localized Ewing tumor of bone: Final
results of the cooperative Ewing's sarcoma study CESS 86. J Clin
Oncol. 19:1818–1829. 2001. View Article : Google Scholar : PubMed/NCBI
|
|
7
|
Granowetter L, Womer R, Devidas M, Krailo
M, Wang C, Bernstein M, Marina N, Leavey P, Gebhardt M, Healey J,
et al: Dose-intensified compared with standard chemotherapy for
nonmetastatic Ewing sarcoma family of tumors: A children's oncology
group study. J Clin Oncol. 27:2536–2541. 2009. View Article : Google Scholar : PubMed/NCBI
|
|
8
|
Bacci G, Ferrari S, Longhi A, Donati D, De
Paolis M, Forni C, Versari M, Setola E, Briccoli A and Barbieri E:
Therapy and survival after recurrence of Ewing's tumors: The
Rizzoli experience in 195 patients treated with adjuvant and
neoadjuvant chemotherapy from 1979 to 1997. Ann Oncol.
14:1654–1659. 2003. View Article : Google Scholar : PubMed/NCBI
|
|
9
|
Barker LM, Pendergrass TW, Sanders JE and
Hawkins DS: Survival after recurrence of Ewing's sarcoma family of
tumors. J Clin Oncol. 23:4354–4362. 2005. View Article : Google Scholar : PubMed/NCBI
|
|
10
|
Stahl M, Ranft A, Paulussen M, Bölling T,
Vieth V, Bielack S, Görtitz I, Braun-Munzinger G, Hardes J, Jürgens
H and Dirksen U: Risk of recurrence and survival after relapse in
patients with Ewing sarcoma. Pediatr Blood Cancer. 57:549–553.
2011. View Article : Google Scholar : PubMed/NCBI
|
|
11
|
Marusyk A and Polyak K: Tumor
heterogeneity: Causes and consequences. Biochim Biophys Acta.
1805:105–117. 2010.
|
|
12
|
Shen S, Vagner S and Robert C: Persistent
cancer cells: The deadly survivors. Cell. 183:860–874. 2020.
View Article : Google Scholar : PubMed/NCBI
|
|
13
|
Basu S, Dong Y, Kumar R, Jeter C and Tang
DG: Slow-cycling (dormant) cancer cells in therapy resistance,
cancer relapse and metastasis. Semin Cancer Biol. 78:90–103. 2022.
View Article : Google Scholar
|
|
14
|
Davis JE Jr, Kirk J, Ji Y and Tang DG:
Tumor dormancy and slow-cycling cancer cells. Adv Exp Med Biol.
1164:199–206. 2019. View Article : Google Scholar : PubMed/NCBI
|
|
15
|
Roesch A, Fukunaga-Kalabis M, Schmidt EC,
Zabierowski SE, Brafford PA, Vultur A, Basu D, Gimotty P, Vogt T
and Herlyn M: A temporarily distinct subpopulation of slow-cycling
melanoma cells is required for continuous tumor growth. Cell.
141:583–594. 2010. View Article : Google Scholar : PubMed/NCBI
|
|
16
|
Perego M, Maurer M, Wang JX, Shaffer S,
Müller AC, Parapatics K, Li L, Hristova D, Shin S, Keeney F, et al:
A slow-cycling subpopulation of melanoma cells with highly invasive
properties. Oncogene. 37:302–312. 2018. View Article : Google Scholar :
|
|
17
|
Moore N, Houghton J and Lyle S:
Slow-cycling therapy-resistant cancer cells. Stem Cells Dev.
21:1822–1830. 2012. View Article : Google Scholar :
|
|
18
|
Zeng L, Zhao Y, Ouyang T, Zhao T, Zhang S,
Chen J, Yu J and Lei T: Label-retaining assay enriches
tumor-initiating cells in glioblastoma spheres cultivated in
serum-free medium. Oncol Lett. 12:815–824. 2016. View Article : Google Scholar : PubMed/NCBI
|
|
19
|
Ebinger S, Özdemir EZ, Ziegenhain C, Tiedt
S, Castro Alves C, Grunert M, Dworzak M, Lutz C, Turati VA, Enver
T, et al: Characterization of rare, dormant, and therapy-resistant
cells in acute lymphoblastic leukemia. Cancer Cell. 30:849–862.
2016. View Article : Google Scholar : PubMed/NCBI
|
|
20
|
Cho J, Min HY, Pei H, Wei X, Sim JY, Park
SH, Hwang SJ, Lee HJ, Hong S, Shin YK and Lee HY: The ATF6-EGF
pathway mediates the awakening of slow-cycling chemoresistant cells
and tumor recurrence by stimulating tumor angiogenesis. Cancers
(Basal). 12:17722020. View Article : Google Scholar
|
|
21
|
Cho J, Min HY, Lee HJ, Hyun SY, Sim JY,
Noh M, Hwang SJ, Park SH, Boo HJ, Lee HJ, et al: RGS2-mediated
translational control mediates cancer cell dormancy and tumor
relapse. J Clin Invest. 131:e1367792021. View Article : Google Scholar :
|
|
22
|
Oshima N, Yamada Y, Nagayama S, Kawada K,
Hasegawa S, Okabe H, Sakai Y and Aoi T: Induction of cancer stem
cell properties in colon cancer cells by defined factors. PLoS One.
9:e1017352014. View Article : Google Scholar : PubMed/NCBI
|
|
23
|
Nath S and Devi GR: Three-dimensional
culture systems in cancer research: Focus on tumor spheroid model.
Pharmacol Ther. 163:94–108. 2016. View Article : Google Scholar : PubMed/NCBI
|
|
24
|
Wahl J, Bogatyreva L, Boukamp P, Rojewski
M, van Valen F, Fiedler J, Hipp N, Debatin KM and Beltinger C:
Ewing's sarcoma cells with CD57-associated increase of
tumorigenicity and with neural crest-like differentiation capacity.
Int J Cancer. 127:1295–1307. 2010. View Article : Google Scholar : PubMed/NCBI
|
|
25
|
Song IS, Jeong YJ, Jeong SH, Kim JE, Han
J, Kim TH and Jang SW: Modulation of mitochondrial ERβ expression
inhibits triple-negative breast cancer tumor progression by
activating mitochondrial function. Cell Physiol Biochem.
52:468–485. 2019. View Article : Google Scholar
|
|
26
|
Simpson CD, Anyiwe K and Schimmer AD:
Anoikis resistance and tumor metastasis. Cancer Lett. 272:177–185.
2008. View Article : Google Scholar : PubMed/NCBI
|
|
27
|
Bleau AM, Zandueta C, Redrado M,
Martínez-Canarias S, Larzábal L, Montuenga LM, Calvo A and Lecanda
F: Sphere-derived tumor cells exhibit impaired metastasis by a
host-mediated quiescent phenotype. Oncotarget. 6:27288–27303. 2015.
View Article : Google Scholar : PubMed/NCBI
|
|
28
|
Carcereri de Prati A, Butturini E, Rigo A,
Oppici E, Rossin M, Boriero D and Mariotto S: Metastatic breast
cancer cells enter into dormant state and express cancer stem cells
phenotype under chronic hypoxia. J Cell Biochem. 118:3237–3248.
2017. View Article : Google Scholar : PubMed/NCBI
|
|
29
|
Gao MQ, Choi YP, Kang S, Youn JH and Cho
NH: CD24+ cells from hierarchically organized ovarian cancer are
enriched in cancer stem cells. Oncogene. 29:2672–2680. 2010.
View Article : Google Scholar : PubMed/NCBI
|
|
30
|
Abass T and Dutta A: p21 in cancer:
Intricate networks and multiple activities. Nat Rev Cancer.
9:400–414. 2009. View Article : Google Scholar
|
|
31
|
Karimian A, Ahmadi Y and Yousefi B:
Multiple functions of p21 in cell cycle, apoptosis and
transcriptional regulation after DNA damage. DNA Repair (Amst).
42:63–71. 2016. View Article : Google Scholar
|
|
32
|
Hoang-Minh LB, Siebzehnrubl FA, Yang C,
Suzuki-Hatano S, Dajac K, Loche T, Andrews N, Schmoll Massari M,
Patel J, Amin K, et al: Infiltrative and drug-resistant
slow-cycling cells support metabolic heterogeneity in glioblastoma.
EMBO J. 37:e987722018. View Article : Google Scholar : PubMed/NCBI
|
|
33
|
Van Mater D and Wagner L: Management of
recurrent Ewing sarcoma: Challenges and approaches. Onco Targets
Ther. 12:2279–2288. 2019. View Article : Google Scholar : PubMed/NCBI
|
|
34
|
Rivankar S: An overview of doxorubicin
formulations in cancer therapy. J Cancer Res Ther. 10:853–858.
2014. View Article : Google Scholar
|
|
35
|
Martino E, Casamassima G, Castiglione S,
Cellupica E, Pantalone S, Papagni F, Rui M, Siciliano AM and
Collina S: Vinca alkaloids and analogues as anti-cancer agents:
Looking back, peering ahead. Bioorg Med Chem Lett. 28:2816–2826.
2018. View Article : Google Scholar : PubMed/NCBI
|
|
36
|
Liu BQ, Gao YY, Niu XF, Xie JS, Meng X,
Guan Y and Wang HQ: Implication of unfolded protein response in
resveratrol-induced inhibition of K562 cell proliferation. Biochem
Biophys Res Commun. 391:778–782. 2010. View Article : Google Scholar
|
|
37
|
Ranganathan AC, Zhang L, Adam AP and
Aguirre-Ghiso JA: Functional coupling of p38-induced up-regulation
of BiP and activation of RNA-dependent protein kinase-like
endoplasmic reticulum kinase to drug resistance of dormant
carcinoma cells. Cancer Res. 66:1702–1711. 2006. View Article : Google Scholar : PubMed/NCBI
|
|
38
|
Li X, Zhou X, Li Y, Zu L, Pan H, Liu B,
Shen W, Fan Y and Zhou Q: Activating transcription factor 3
promotes malignance of lung cancer cells in vitro. Thorac Cancer.
8:181–191. 2017. View Article : Google Scholar : PubMed/NCBI
|
|
39
|
Bandyopadhyay S, Wang Y, Zhan R, Pai SK,
Watabe M, Iiizumi M, Furuta E, Mohinta S, Liu W, Hirota S, et al:
The tumor metastasis suppressor gene Drg-1 down-regulates the
expression of activating transcription factor 3 in prostate cancer.
Cancer Res. 66:11983–11990. 2006. View Article : Google Scholar : PubMed/NCBI
|
|
40
|
Fan F, Jin S, Amundson SA, Tong T, Fan W,
Zhao H, Zhu X, Mazzacurati L, Li X, Petrik KL, et al: ATF3
induction following DNA damage is regulated by distinct signaling
pathways and over-expression of ATF3 protein suppresses cells
growth. Oncogene. 21:7488–7496. 2002. View Article : Google Scholar : PubMed/NCBI
|
|
41
|
Li X, Zang S, Cheng H, Li J and Huang A:
Overexpression of activating transcription factor 3 exerts
suppressive effects in HepG2 cells. Mol Med Rep. 19:869–876.
2019.
|
|
42
|
Barone MV, Crozat A, Tabaee A, Philipson L
and Ron D: CHOP (GADD153) and its oncogenic variant, TLS-CHOP, have
opposing effects on the induction of G1/S arrest. Genes Dev.
8:453–464. 1994. View Article : Google Scholar : PubMed/NCBI
|