Introduction
Programmed death ligand 1 (PD-L1), also known as
CD274 or B7-H1, is a transmembrane protein expressed on the tumor
surface that is a ligand for programmed cell death protein 1
(PD-1), which plays a critical role in immune escape mechanisms
(1). PD-L1 on tumors binds to
PD-1, a receptor on activated T cells, inhibiting T cell activation
and causing immune evasion that neutralizes immune surveillance
function against tumor cells (2,3).
Immune checkpoint inhibitors (ICIs), particularly PD-1 and PD-L1
inhibitors, target immune evasion functions triggered by the
binding of ligands and receptors on tumor and immune cells and have
exhibited clinical efficacy against breast cancer and various solid
malignancies (4). PD-L1
inhibitors provide a novel therapeutic paradigm by blocking immune
evasion to enhance antitumor immunity (5).
Triple-negative breast cancer (TNBC) is a subtype of
breast cancer that lacks an estrogen receptor, a progesterone
receptor and HER2/neu (6).
Patients with TNBC have a short overall survival time compared with
other breast cancer subtypes; it is very aggressive and has a high
rate of distant metastasis (6).
TNBC is treated with chemotherapy as it cannot be treated with
targeted therapy. Even with the application of these standard
treatments, there are limits to improving the progression-free
survival and overall survival rates; thus, new treatment strategies
are needed for patients with TNBC (7). To overcome these limitations, the
application of ICIs in recent years has made significant progress
as a new treatment type for TNBC (8). Compared with other subtypes, TNBC
has higher levels of PD-L1 expression and more immune cell
infiltration in the tumor microenvironment (TME), making it a
suitable candidate for ICI application (9). However, whether ICI therapy
targeting PD-L1 improves the efficacy of TNBC treatment in actual
clinical trials is controversial (10). While some studies suggest that a
higher PD-L1 expression level correlates with improved therapeutic
outcomes (11-13), other evidence indicates that
excessive PD-L1 expression may contribute to therapeutic resistance
(14).
The presence of tumor-infiltrating lymphocytes
(TILs) in the TME is an essential factor in predicting the response
to immunotherapy (15).
Immune-high tumors exhibit high expression of TILs and PD-L1, which
has provided a basis for the application of ICIs in TNBC (16,17). Types of TILs include
CD8+ T cells, CD4+ T cells, B cells, natural
killer (NK) cells and macrophages (18,19). High levels of TILs have been
associated with improved responses to ICIs, as they enhance the
antitumor immune response (20).
Anti-PD-L1, used in therapy for targeting PD-L1, is
associated with a complex relationship between PD-L1 expression and
the TME in TNBC. Therefore, the present study investigated whether
the difference in the efficacy of anti-PD-L1 treatment is caused by
the intra-tumoral expression of PD-L1. To understand the cause of
the difference, the directionality of the genes related to the
tumor infiltration of immune cells were investigated through bulk
RNA sequencing. Based on these results, it was explored whether the
difference in the TME according to the expression of PD-L1 affects
the therapeutic efficacy of anti-PD-L1.
Materials and methods
PD-L1 expression and survival analysis in
clinical data of breast cancer cohorts
In the present study, two publicly available
datasets, namely the Molecular Taxonomy of Breast Cancer
International Consortium (METABRIC) cohort and The Cancer Genome
Atlas (TCGA)-BRCA provisional cohort, were used. The METABRIC
dataset on breast cancer (21,22) and the TCGA dataset on breast
invasive carcinoma [TCGA, PanCancer Atlas (23)] were obtained from cBioportal
(https://www.cbioportal.org/) in August
2023. PD-L1 expression analysis was conducted on the METABRIC
(total n=1,905, basal n=296) and TCGA (total n=1,084, basal n=171)
datasets according to subtype and TN [tumor size (T) and lymph node
status (N)] stage. Subsequently, survival analysis was performed on
patients with TNBC (METABRIC, n=233; TCGA, n=163) by dividing them
into high and low-PD-L1 expression groups. PD-L1 mRNA expression
was quantified using z-scores, which represent the number of
standard deviations a value is from the mean expression across all
samples. Patients were classified as high (z-score ≥0) or low
(z-score <0) PD-L1 expression accordingly. Overall survival was
estimated using the Kaplan-Meier method, and statistical
differences between groups were assessed using the log-rank
test.
Cell lines and culture
The mouse TNBC cell line, 4T1 [cat. no. CRL-2539;
American Type Culture Collection (ATCC®)], and the mouse
colon carcinoma cell line, CT26 (cat. no. CRL-2638;
ATCC®), were used in this study. CT26 cells were used as
a source of mouse wild-type PD-L1 cDNA, which was amplified by PCR
for subsequent cloning and overexpression in 4T1 cells. The cells
were cultured in RPMI 1640 medium (Welgene, Inc.) and Dulbecco's
Modified Eagle's Medium (Welgene, Inc.) supplemented with 10% fetal
bovine serum (FBS; Welgene, Inc.) and 1% penicillin-streptomycin
(10,000 U/ml; Gibco; Thermo Fisher Scientific, Inc.). The cells
were maintained at 37°C in a humidified atmosphere of 95% air and
5% CO2.
Establishment of an PD-L1 overexpressing
stable cell line
The murine colorectal carcinoma cancer cell, CT26,
derived from BALB/C mice, was used to establish the PD-L1
overexpressing stable cell line. Mouse PD-L1 RNA was extracted from
the CT26 cells with TRIzol (FAVORGEN Biotech Corp.), and the mouse
PD-L1 gene (RefSeq: NM_021893.3) was amplified through reverse
transcription-polymerase chain reaction (RT-PCR). Reverse
transcription was performed using PrimeScript™ RT Reagent Kit (cat.
no. RR037A; Takara Bio, Inc.) according to the manufacturer's
instructions. The following two primers, incorporating a Kozak
sequence for efficient translation and NheI and NotI
restriction sites for cloning, were used:
5′-GCTAGCGCCACCATGAGGATATTTGCTGGCATT-3′ (forward) and
5′-GCGGCCGCTTACGTCTCCTCGAATTGTGT-3′ (reverse). The PCR product was
ligated into the pMD20-T vector (Takara Korea Biomedical Inc.) to
create restriction enzyme sites. The pMD20-T vector was transformed
into Escherichia coli DH5α competent cells (cat. no. CP011;
Enzynomics, Inc.). The amplified PD-L1 gene with restriction enzyme
sites was inserted using the NheⅠ and NotⅠ sites in a
PiggyBac vector (System Biosciences, LLC). The constructed PiggyBac
vector containing the mouse PD-L1 gene and an empty PiggyBac
control vector were transfected into 4T1 cells using JetPrime
(Polyplus-transfection SA). Transfection was performed in 100 mm
dishes using 10 μg of plasmid DNA per dish at 37°C for 24 h,
according to the manufacturer's instructions. After transfection,
stable PD-L1 overexpressing cell lines were established by treating
the cells with 5 μg/ml puromycin starting 48 h later.
Puromycin was used at 5 μg/ml for selection and 1
μg/ml for maintenance in both PD-L1-overexpressing and
control (empty PiggyBac vector) 4T1 cells. Following antibiotic
selection, GFP-positive cells were collected and PD-L1
overexpression was confirmed by both surface staining using
APC-conjugated anti-mouse PD-L1 antibody (1:100; cat. no. 124312;
BioLegend, Inc.) and western blot analysis with anti-PD-L1 antibody
(1:1,000; cat. no. 60475; Cell Signaling Technology, Inc.). To
isolate a subpopulation of cells with intermediate PD-L1
expression, cells were subsequently sorted using a FACSAria III
cell sorter (BD Biosciences) operated with FACSDiva software
(version 9.2; BD Biosciences), based on GFP and PD-L1 fluorescence
intensity. For surface PD-L1 staining, cells were incubated with
APC-conjugated anti-mouse PD-L1 antibody (1:100; cat. no. 124312;
BioLegend, Inc.) in FACS buffer (PBS containing 2% FBS) for 30 min
at 4°C in the dark. After staining, cells were washed twice with
PBS and filtered through a 40 μm cell strainer prior to
sorting. Cells were gated into subpopulations with low, medium or
high PD-L1 expression levels based on GFP and PD-L1 fluorescence
intensity. The sorted sublines were subsequently expanded, and
PD-L1 expression levels were validated by western blot analysis
using an anti-PD-L1 antibody (1:1,000; cat. no. 60475; Cell
Signaling Technology, Inc.) as described below. For experimental
consistency, the 4T1 control population with no PD-L1
overexpression was designated as 4T1-Ctl, the PD-L1 overexpression
medium-expression group as 4T1-PD-L1 O/E (Medium level) and the
highest-expression group as 4T1-PD-L1 O/E.
Immunoblotting
Cells were lysed in RIPA buffer (MilliporeSigma)
mixed with a protease inhibitor cocktail (Thermo Fisher Scientific,
Inc.) and 0.5 M Tris-EDTA (Thermo Fisher Scientific, Inc.). Protein
concentrations were determined using the BCA Protein Assay Kit
(Thermo Fisher Scientific, Inc.), and 20 μg of total protein
was loaded per lane. The prepared proteins were separated by 10%
sodium dodecyl sulfate/polyacrylamide gel electrophoresis and
transferred onto Immobilon-P transfer membranes (Merck KGaA).
Membranes were blocked with 5% skim milk in TBST (TBS containing
0.1% Tween-20) for 1 h at room temperature. Membranes were
incubated with the following primary antibodies overnight at 4°C:
Anti-PD-L1 (1:1,000; cat. no. 60475, Cell Signaling Technology,
Inc.) and anti-β-actin (1:5,000; cat. no. sc-4778, Santa Cruz
Biotechnology, Inc.). After washing, membranes were incubated with
the following HRP-conjugated secondary antibodies for 1 h at room
temperature: Goat anti-rabbit IgG-HRP (1:5,000; cat. no. sc-2004,
Santa Cruz Biotechnology, Inc.) and goat anti-mouse IgG-HRP
(1:5,000; cat. no. sc-2005, Santa Cruz Biotechnology, Inc.). After
membrane incubation with specific antibodies, the signal was
enhanced with chemiluminescence reagents (Thermo Fisher Scientific,
Inc.) and measured using an Amersham Imager 680 (GE Healthcare).
The relative values of the bands observed by western blotting were
analyzed using ImageJ software (version 1.53j; National Institutes
of Health).
RT-quantitative PCR (RT-qPCR)
Total RNA was extracted from the cells using the
Tri-RNA reagent (FAVORGEN Biotech Corp.). cDNA was synthesized from
the extracted RNA using the PrimeScript™ RT Reagent kit (cat. no.
RR037A; Takara Korea Biomedical Inc.; Takara Bio Inc.), according
to the manufacturer's instructions. qPCR was conducted on a
QuantStudio™ 3 Real-Time PCR System (Applied Biosystems; Thermo
Fisher Scientific, Inc.) using SYBR Green PCR master mix (cat. no.
4367659; Applied Biosystems; Thermo Fisher Scientific, Inc.). The
thermocycling conditions were as follows: Initial denaturation at
95°C for 10 min, followed by 40 cycles of denaturation at 95°C for
15 sec and annealing/extension at 60°C for 1 min. The relative mRNA
levels were measured using the 2−ΔΔCq method (24), with Gapdh as the control.
The following primer sequences were used: Pd-l1, (forward)
5′-GCGGACTACAAGCGAATCACG-3′ and (reverse)
5′-CTCAGCTTCTGGATAACCCTCG-3′; Gapdh, (forward)
5′-CATCACTGCCACCCAGAAGACTG-3′ and (reverse),
5′-ATGCCAGTGAGCTTCCCGTTCAG-3′.
Flow cytometry
The cells were harvested using 0.25% trypsin and
washed with PBS. The prepared cells were suspended in 1% BSA or
PBS. Staining was conducted using a mouse PD-L1 antibody conjugated
to phycoerythrin (cat. no. 124307; BioLegend, Inc.) and 7-AAD (cat.
no. 00-6993-50; Invitrogen; Thermo Fisher Scientific, Inc.) for 20
min at room temperature in the dark. The mean fluorescence
intensity was detected using a BD FACSCanto™ Flow Cytometer (BD
Bioscience)., and the data were analyzed using BD FACSDiva software
(version 8.0.1; BD Biosciences; https://www.bdbiosciences.com/).
Migration, invasion and gap closure
assays
For migration assays, 1×10⁵ cells were
seeded in an 8.0-μm pore size insert (Falcon®;
Corning Life Sciences) with serum-free medium. For invasion
assessment, an insert pre-coated with 1 mg/ml Matrigel (by
incubation for 20 min at 37°C) was used, with 1×10⁵
cells in serum-free medium. A medium containing 10% FBS was added
to the lower chambers. After incubating for 12 h at 37°C, cells
that migrated were fixed with 4% paraformaldehyde for 10 min at
room temperature and stained with a 0.1% crystal violet for 2 min
at room temperature. Stained cells were imaged using a light
microscope equipped with a CCD camera (Leica Microsystems, Inc.)
and quantified with ImageJ software.
For the gap closure assay, 5×10⁴ cells
were seeded in a culture-insert in a 2-well μ-dish (Ibidi
GmbH) and incubated overnight at 37°C. After reaching confluency, a
gap was made by removing the insert, the plate was washed with PBS
and 500 μl medium containing 10% FBS (25) was added. Gap closure was observed
from 0 to 12 h using a light microscope equipped with a CCD camera
(Leica Microsystems, Inc.).
Cell proliferation assay
The CellTiter-Glo® Luminescent Cell
Viability Assay Kit (Promega Corporation) was used to assess cell
proliferation. A total of 3×10³ cells were seeded into
each well of a 96-well plate and incubated at 37°C for 24, 48 and
72 h. Afterward, 100 μl of the CellTiter-Glo solution was
added to the cells following the manufacturer's guidelines.
Luminescence was measured using a Luminiskan ascent (Thermo Fisher
Scientific, Inc.).
Analysis of immune cell populations
Tumors were digested in collagenase and
hyaluronidase for 30 min in a 37°C shaking incubator, followed by
an RBC lysis buffer treatment (Thermo Fisher Scientific, Inc.). The
cells were filtered through 40- and 75-μm cell strainers,
and 1×10⁶ cells were suspended in the staining buffer
(BioLegend, Inc.). Cells were pre-incubated with 0.25 μg of
the TruStain FcX™ PLUS (anti-mouse CD16/32) antibody (BioLegend,
Inc.) for 5-10 min. Antibodies were then incubated on ice for 20
min in the dark. Fluorescence intensity was detected using a BD
FACSCanto™ Flow Cytometer (BD Bioscience), and the data were
analyzed using BD FACSDiva software (version 8.0.1; BD Biosciences;
https://www.bdbiosciences.com/). The
following antibodies from BioLegend, Inc. were used for lymphoid
panel staining: PE anti-mouse CD3 (cat. no. 100206), Brilliant
Violet 421 anti-mouse CD4 antibody (cat. no. 100437), Brilliant
Violet 510 anti-mouse CD45 antibody (cat. no. 103137) and
PerCP/Cyanine5.5 anti-mouse CD8a antibody (cat. no. 100733).
Syngeneic mouse model and antibody
treatment
In vivo experiments were conducted at the
animal facility of Seoul National University Hospital (Seoul, South
Korea), following guidelines and obtaining prior approval from the
Institutional Animal Care and Use Committee (IACUC; approval no.
23-0157-S1A0). Animals were maintained in the facility-accredited
AAALAC International (no. 001169) in accordance with Guide for the
Care and Use of Laboratory Animals 8th edition, NRC (2010). In
total, 54 6-week-old female BALB/c mice (body weight, 18-22 g) were
obtained from Koatech. Mice were housed under specific
pathogen-free conditions at 22±2°C with 55±10% humidity, under a 12
h light/dark cycle, with ad libitum access to food and
water. Animal health and behavior were monitored daily. Syngeneic
mouse models were established by injecting 1×10⁵ control
4T1, PD-L1-overexpressing 4T1 (medium level), or PD-L1
overexpressed 4T1 cells into the mammary gland fat pads. Tumor size
was measured twice weekly using digital calipers and calculated
with a modified ellipsoidal formula [volume=1/2 (length x
width2)]. In this experiment, two groups of 4T1
tumor-bearing mice were used: One injected with control 4T1 cells
and the other with 4T1 cells overexpressing PD-L1 at a high level.
In a subsequent analysis, an additional group bearing 4T1 tumors
with moderate PD-L1 overexpression was included, resulting in three
experimental groups: Control, medium PD-L1 expression and high
PD-L1 expression. Each group was treated with either control IgG or
anti-PD-L1. The PD-L1 inhibitor, a monoclonal anti-PD-L1 antibody
(cat. no. BP0101; 150 μg/100 μl) and immunoglobulin G
(IgG; cat. no. BP0090; 150 μg/100 μl) were
administered intraperitoneally a total of three times, starting
when tumor volumes reached ~100 mm3. The experiments
were concluded after three intraperitoneal injections of either IgG
or anti-PD-L1, on days 6, 9 and 12. Additionally, any mouse with a
tumor volume reaching 1,000 mm3 was scheduled for
immediate euthanasia. The study was designed with an appropriate
sample size to account for biological variability in accordance
with IACUC guidelines, and the animal was included in the analysis.
The experiments lasted for a total of 17 or 13 days, with the
shorter duration resulting from earlier tumor progression in some
mice necessitating humane endpoint euthanasia (tumor volume reached
1,000 mm3). At the end of the study, mice were
euthanized following deep anesthesia using isoflurane (2-5% for
induction, 1-3% for maintenance). CO2 inhalation was
used to complete euthanasia at a displacement rate of 30-70% of the
chamber volume per minute, following NIH and AVMA (2020)
guidelines. Death was confirmed by the cessation of respiration,
which was monitored continuously for at least 10 min following
CO2 exposure to ensure complete loss of vital signs.
After euthanasia, tumors, lungs and spleens were resected and then
preserved in 4% paraformaldehyde at 4°C overnight or Bouin's
solution at room temperature overnight for further analysis.
Immunocytochemistry
Control and PD-L1-overexpressing 4T1 murine breast
cancer cells were seeded on 8-well chamber slides (cat. no. 154534;
Nunc; Thermo Fisher Scientific, Inc.) and cultured in RPMI-1640
medium supplemented with 10% FBS and 1% penicillin-streptomycin at
37°C in a humidified incubator with 5% CO2. Cells were
fixed with 4% paraformaldehyde in PBS for 15 min at room
temperature and permeabilized with 0.2% Tween-20 in PBS for 10 min.
Non-specific binding was blocked with 1% BSA (cat. no.
AC1025-100-00; Biosesang) in PBS for 1 h at room temperature. Cells
were incubated overnight at 4°C with a fluorescence-conjugated
anti-PD-L1 antibody (1:200; cat. no. MAB90782AF647; Novus
Biologicals, LLC) diluted in blocking buffer. The next day, cells
were washed three times with PBS. Nuclei were counterstained with
DAPI (1 μg/ml; cat. no. S7113; Merck KGaA) for 5 min at room
temperature. Slides were mounted using fluorescence mounting medium
(cat. no. S3023; Dako; Agilent Technologies), and representative
images were captured using a fluorescence microscope (ECLIPSE Ni-E;
Nikon Corporation).
Immunohistochemistry
The primary tumors were fixed in 4% buffered
paraformaldehyde at 4°C overnight, embedded in paraffin and
sectioned into 4-μm slices. After being deparaffinized in
xylene and rehydrated in graded ethanol and water solutions,
antigen retrieval was performed using citrate (pH 6.0) or 10 mM
Tris/1 mM EDTA (pH 9.0) at 95°C for 20 min. Endogenous peroxidase
activity was blocked with 3% H2O2 for 20 min
at room temperature. The sections were then blocked with 10% normal
goat serum (cat. no. S-1000; Vector Laboratories, Inc.) for 1 h at
room temperature to prevent non-specific binding, followed by
overnight incubation at 4°C with primary antibodies. The antibodies
used were as follows: CD45 (1:100; cat. no. AF114; R&D Systems,
Inc.), CD4 (1:200; cat. no. ab183685; Abcam), CD8 (1:200; cat. no.
ab209775; Abcam) or PD-L1 (rabbit polyclonal; 1:200; cat. no.
ab10558; Abcam). After washing, the sections were incubated with
species-appropriate HRP-conjugated secondary antibodies for 1 h at
room temperature. For rabbit and mouse primary antibodies, a
ready-to-use EnVision+ System-HRP (Rabbit/Mouse) (cat. no. K5007;
Dako; Agilent Technologies) was used. For the goat-derived CD45
antibody, rabbit anti-goat IgG(H+L)-HRP (1:500; cat. no. SA007-500;
GenDEPOT, LLC) was used. Immunoreaction was visualized using a DAB
chromogen kit included in the EnVision system (cat. no. K5007;
Dako; Agilent Technologies, Inc.). Nuclei were counterstained with
hematoxylin (cat. no. S330930-2; Dako; Agilent Technologies, Inc.)
for 2 min at room temperature. Histological images were captured
using a light microscope equipped with a CCD camera (Leica
Microsystems, Inc.).
Identification of differentially
expressed genes (DEGs) and functional enrichment analysis
RNA was extracted from tumors with confirmed PD-L1
inhibitory effects, and transcriptome sequencing was performed by
Macrogen, Inc. (Seoul, Korea). RNA quality and integrity were
assessed using the 2100 Bioanalyzer System (cat. no. G2939BA,
Agilent Technologies, Inc.) with a DNA 1000 Kit (cat. no.
5067-1504, Agilent Technologies, Inc.). The SureSelectXT RNA Direct
Library Preparation Kit (cat. no. G7550A; Agilent Technologies,
Inc.) was used for library preparation, followed by quality control
of the raw sequencing reads. Sequencing was carried out on the
NovaSeq 6000 platform (cat. no. 20012850, Illumina, Inc.) using
paired-end 101-bp reads. Raw sequencing data were first evaluated
using FastQC (version 0.11.7; http://www.bioinformatics.babraham.ac.uk/projects/fastqc/)
to assess read quality. Adapter sequences and low-quality bases
were trimmed using Trimmomatic (version 0.38; http://www.usadellab.org/cms/?page=trimmomatic). The
cleaned reads were aligned to the Mus musculus reference
genome (mm10) using HISAT2 (version 2.1.0; https://ccb.jhu.edu/software/hisat2/), with internal
use of Bowtie2 (version 2.3.4.1). Transcript assembly was performed
using StringTie (version 2.1.3b; https://ccb.jhu.edu/software/stringtie/). Differential
expression analysis was conducted using DESeq2 (version 1.36.0;
https://bioconductor.org/packages/release/bioc/html/DESeq2.html).
Expression profiles were generated, and DEGs were identified based
on a |fold-change|>2 and raw P<0.05. The P-values were
adjusted for multiple testing using the Benjamini-Hochberg method,
with a false discovery rate threshold of 0.05. DEGs were then
functionally annotated using the Database for Annotation,
Visualization and Integrated Discovery (https://david.ncifcrf.gov). Gene Ontology (https://geneontology.org/) and Kyoto Encyclopedia of
Genes and Genomes (KEGG) pathway (https://www.genome.jp/kegg/) analyses were
subsequently performed.
Statistical analysis
To evaluate the data, graphs were constructed to
display the mean ± standard deviation derived from a minimum of
three independent experiments. Statistical comparisons between two
groups were performed using unpaired t-tests and the Mann-Whitney U
test. For experiments involving two independent variables (such as
treatment, expression status or time), data were analyzed using
two-way ANOVA followed by Tukey's post hoc test. In survival
analysis, the Kaplan-Meier method with a two-sided log-rank test
was used. Statistical analyses were performed using GraphPad Prism
v9.2.0 (Dotmatics). P<0.05 was considered to indicate a
statistically significant difference.
Results
Survival rate of patients with TNBC
according to PD-L1 expression and clinicopathologic
characteristics
To understand the relationship between PD-L1
expression and clinicopathology in breast cancer subtypes, TCGA and
METABRIC datasets were analyzed. It was observed that TNBC had a
high level of PD-L1 expression in both TCGA and METABRIC datasets,
similar to the HER2 subtype in TCGA dataset (Fig. 1A). The difference in overall
survival between patients with TNBC divided into the high and low
PD-L1 mRNA expression groups in the TCGA and METABRIC datasets was
not statistically significant (Fig.
1B). Similarly, PD-L1 expression was not significantly
associated with T stage and nodal involvement (Fig. S1). These results confirm that,
although PD-L1 expression is elevated in TNBC, it may not be
directly associated with poor patient prognosis based on public
datasets.
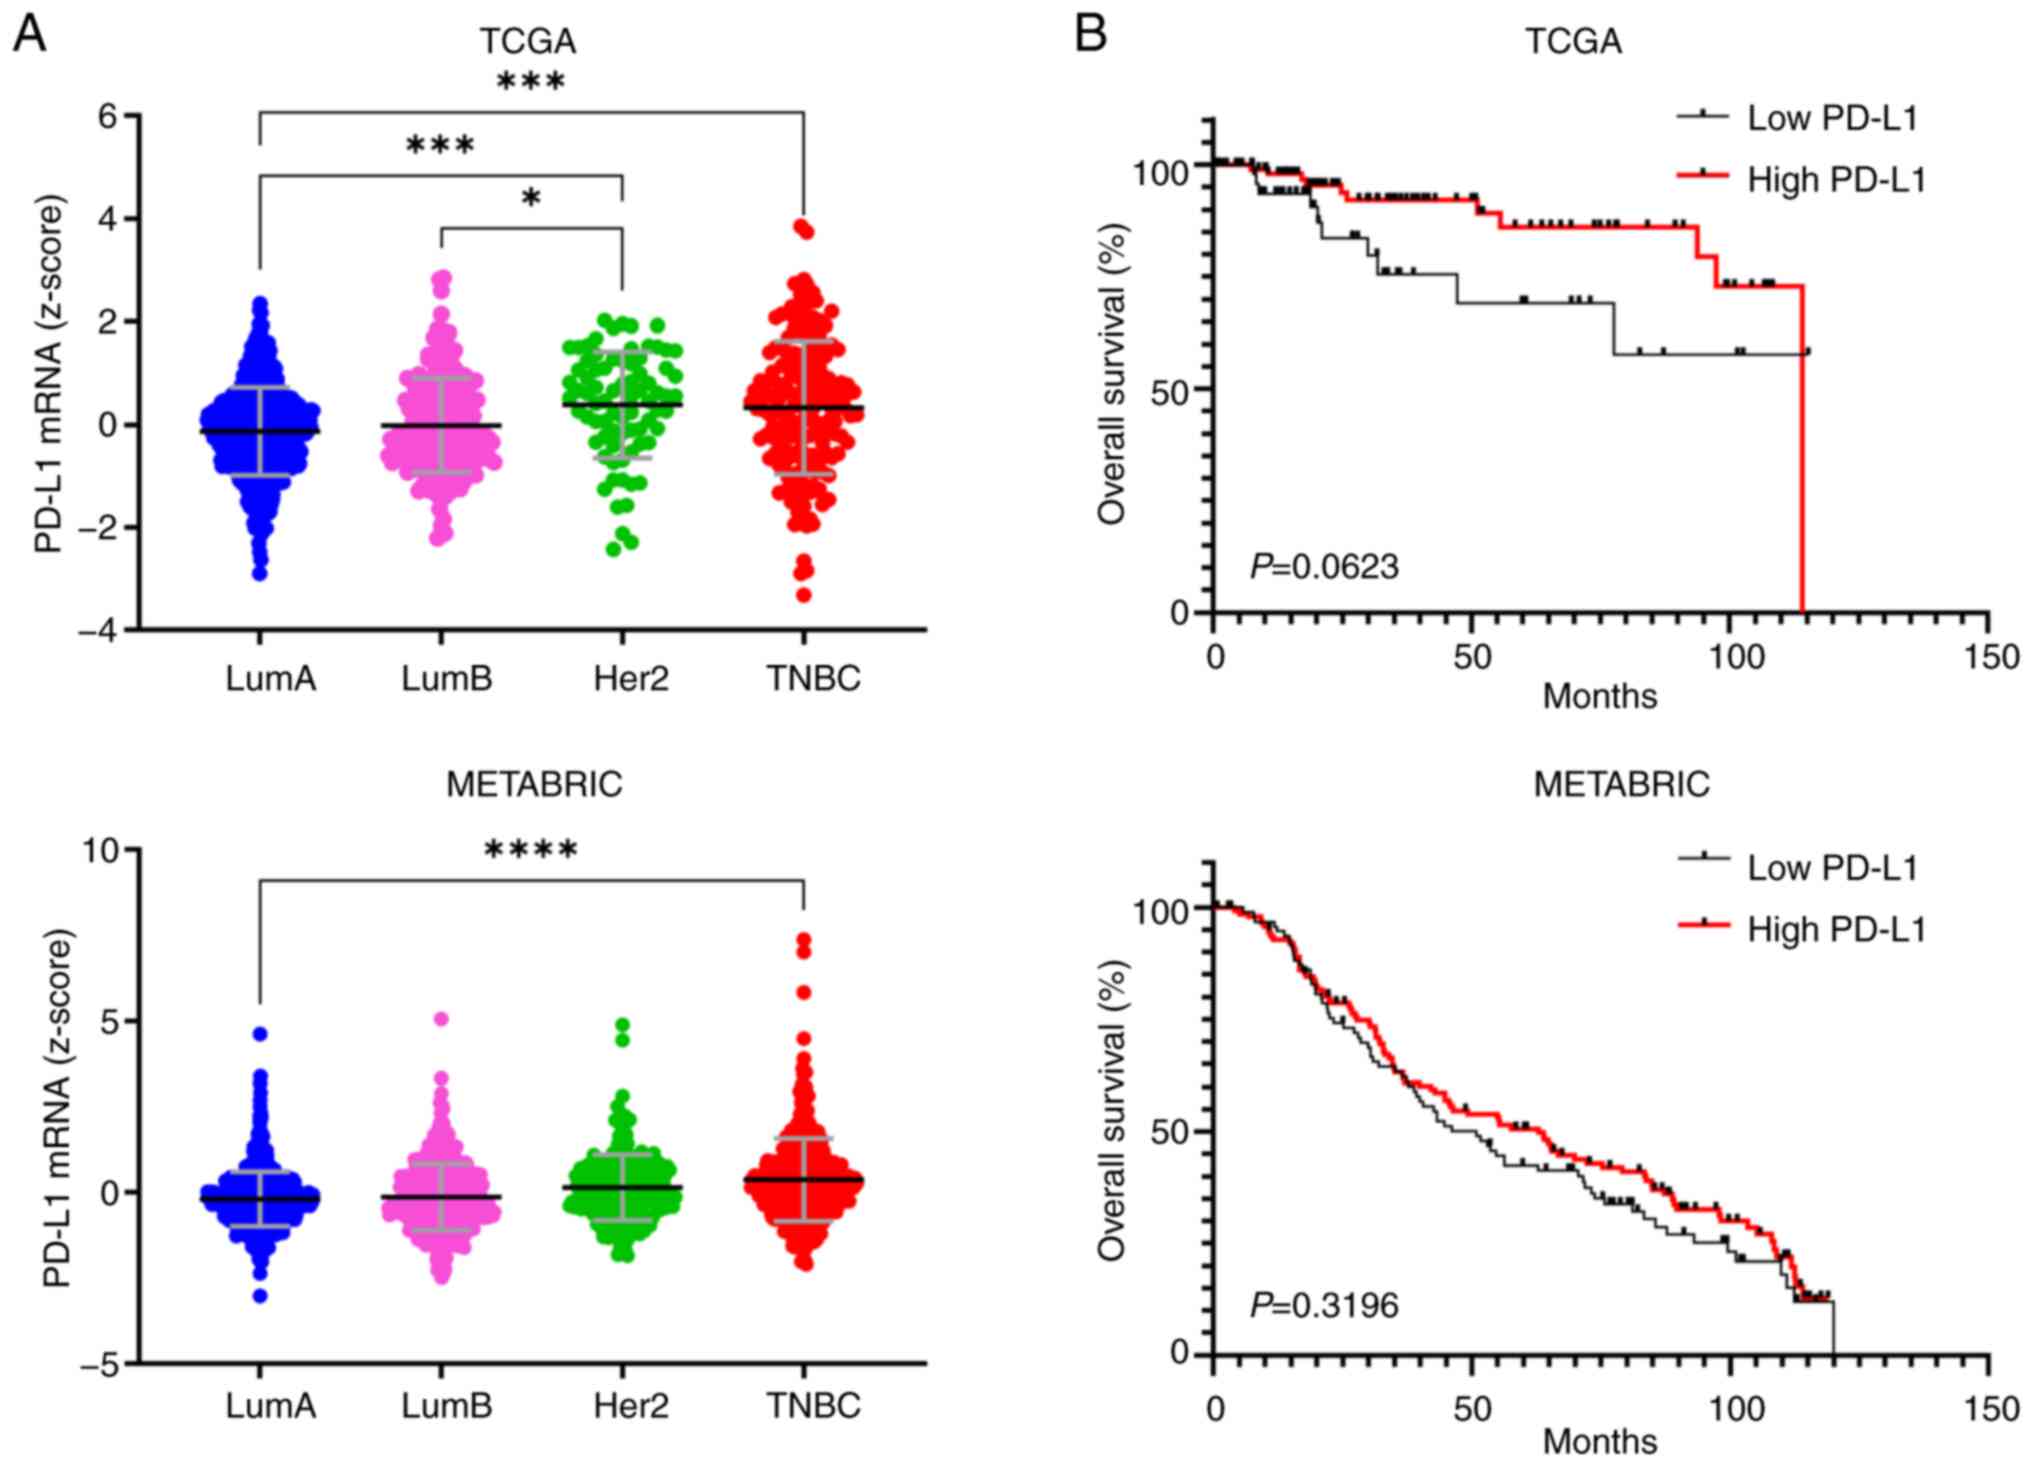 | Figure 1PD-L1 expression and survival
analysis in the TCGA and METABRIC datasets. (A) Expression levels
of PD-L1 in breast cancer subtypes (TCGA, n=1,084; METABRIC,
n=1,905). (B) Kaplan-Meier curves according to PD-L1 expression in
TNBC (TCGA, n=163; METABRIC, n=233; two-sided log-rank test).
*P<0.05, ***P<0.001,
****P<0.0001 by one-way ANOVA with Tukey's post hoc
test. PD-L1, programmed death-ligand 1; TCGA, The Cancer Genome
Atlas; METABRIC, Molecular Taxonomy of Breast Cancer International
Consortium; TNBC, triple-negative breast cancer; LumA/B, Luminal A
and Luminal B subtypes. |
PD-L1 overexpression and its impact on
4T1 breast cancer cells
To further elucidate the role of PD-L1 upregulation
in breast cancer, a 4T1 murine breast cancer cell line that stably
overexpressed PD-L1 was established. PD-L1 overexpression was
confirmed at the protein and mRNA levels in the 4T1 PD-L1
overexpressed cell line (Fig. S2A
and B). The cell surface expression of PD-L1 was further
validated using flow cytometry and immunocytochemistry (Fig. S2C and D). To determine the
phenotypic importance of PD-L1-overexpression, the proliferation,
migration and invasion of the cells was examined. The result showed
that PD-L1 O/E induced enhanced the proliferative capacity of 4T1
cells compared with the control cells (Fig. 2A). Additionally, the
overexpression of PD-L1 led to significant increases in the
migratory and invasive capabilities, as evidenced by the migration,
invasion and gap closure assays (Fig.
2B and C). To investigate the therapeutic implications of PD-L1
overexpression, PD-L1-overexpressing 4T1 cells were treated with
anti-PD-L1 antibodies. The effects of anti-PD-L1 treatment were not
pronounced, with only modest changes in cell proliferation
observed. Specifically, there was a slight reduction in
proliferation at 24 h, followed by an increase at 48 h, though
these changes were not statistically significant (Fig. 2D). This suggests that the
interaction between PD-L1 signaling and tumor cell survival
mechanisms may be complex, potentially involving compensatory
pathways that mitigate the effects of PD-L1 blockade.
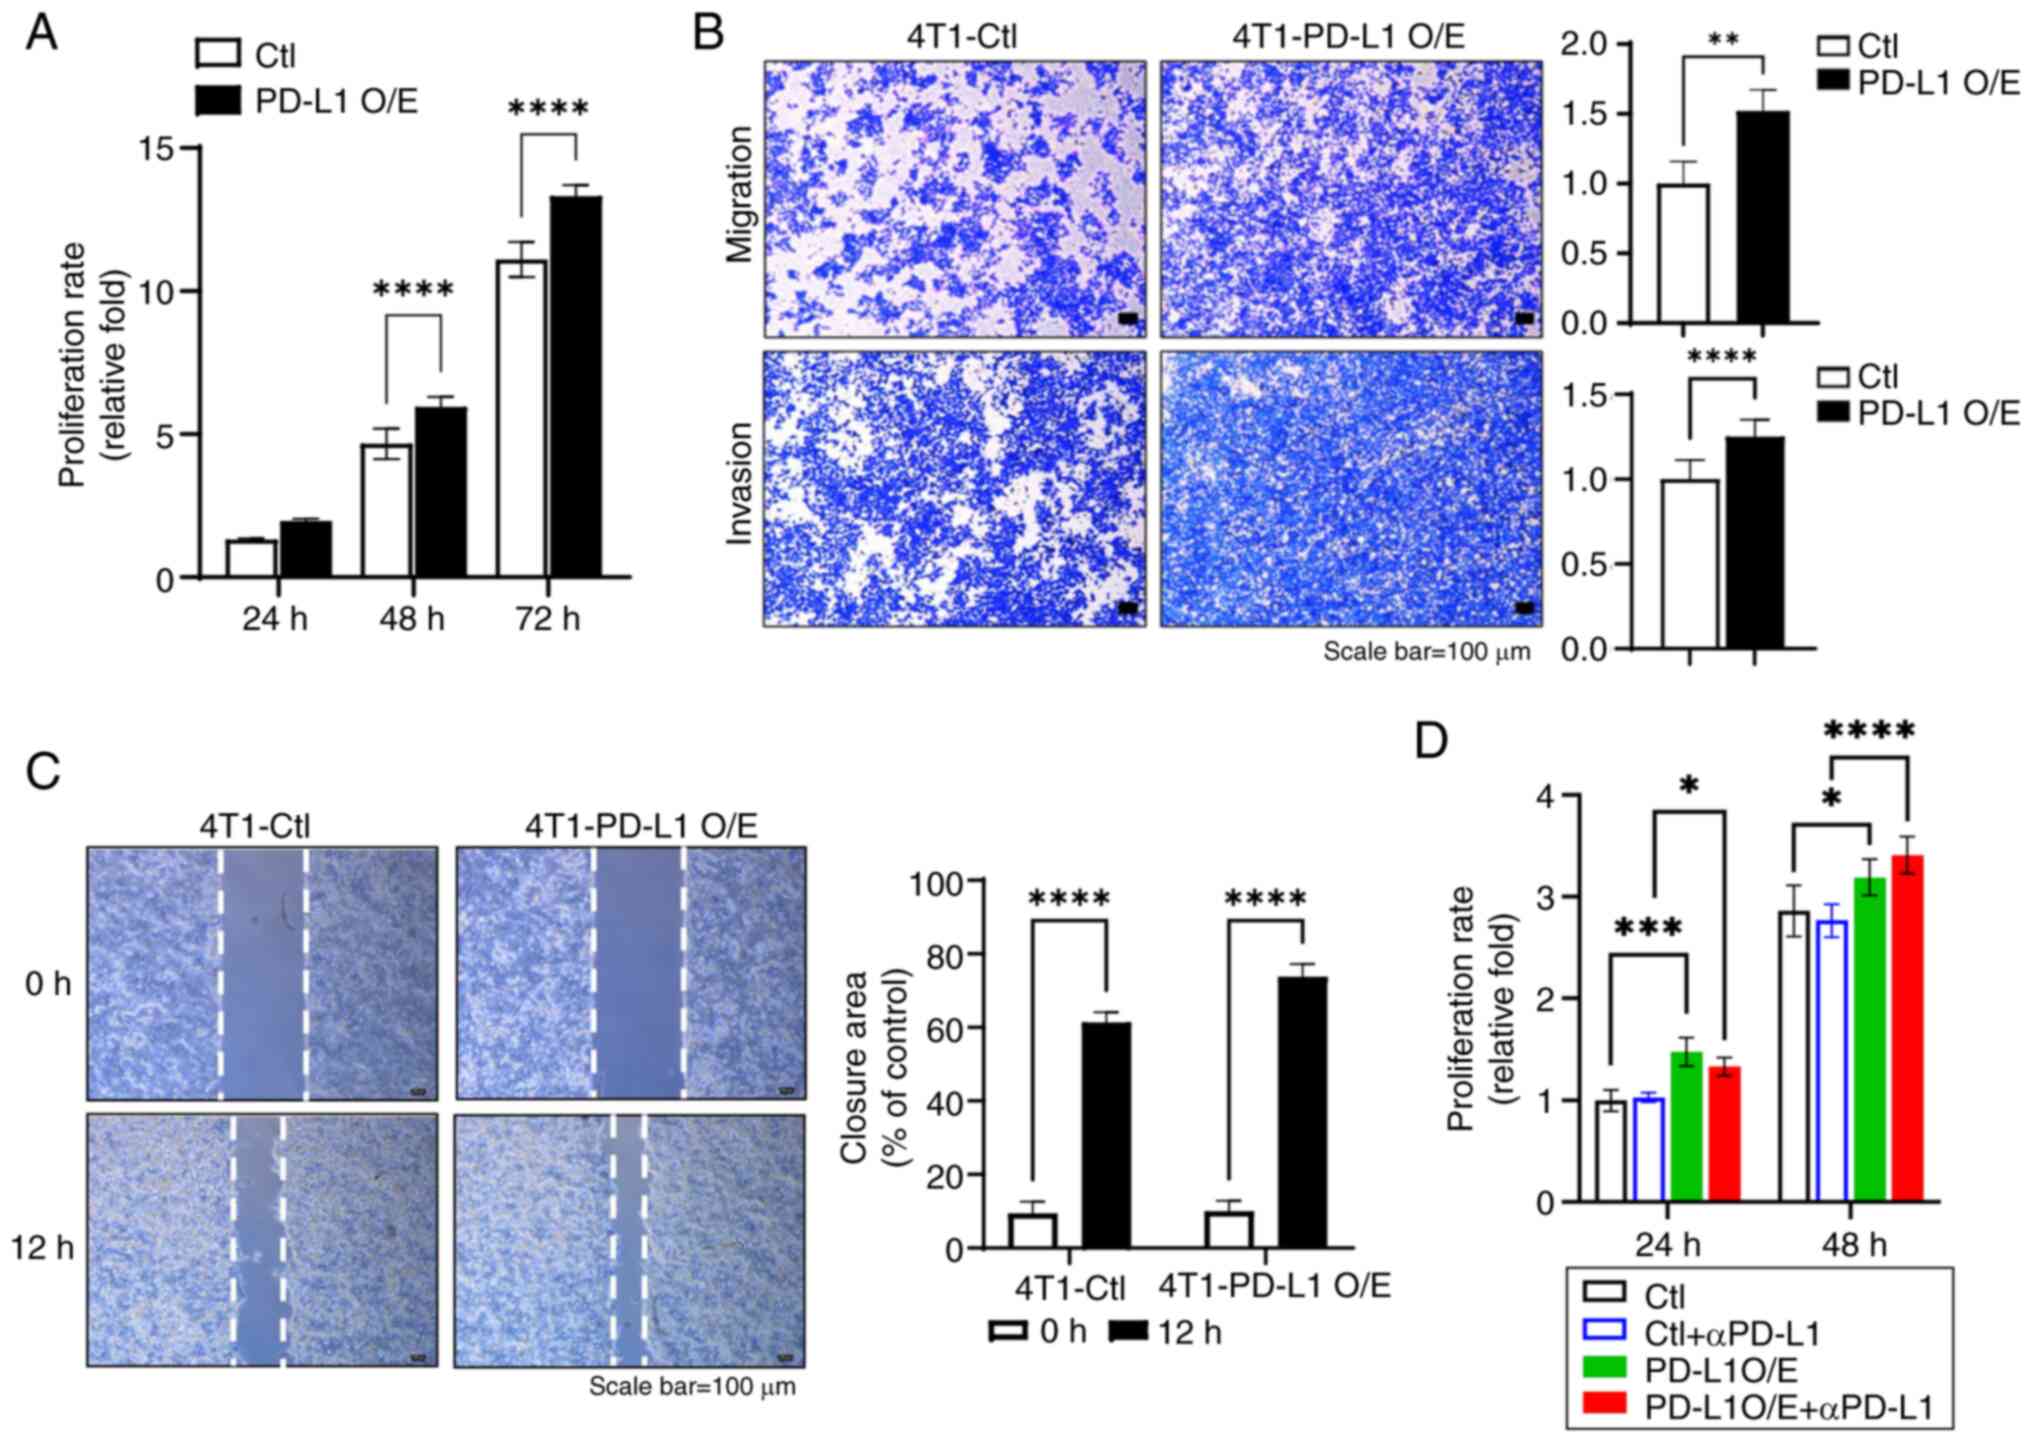 | Figure 2Effect of PD-L1 overexpression on
phenotypic changes and the impact of αPD-L1 treatment on
proliferation. (A) Relationship between the proliferation rate and
overexpression of PD-L1 in the 4T1 cell line (n=3, mean ± SEM;
****P<0.0001 by two-way ANOVA with Tukey's post hoc
test). (B) Images and quantification data examined in the migration
and invasion of PD-L1-overexpressed 4T1 cells (n=3, mean ± SEM;
**P<0.01 and ****P<0.0001 by
Mann-Whitney U test). (C) Images and quantification data examined
in the gap closure assay of PD-L1-overexpressed 4T1 cells (n=3,
mean ± SEM; ****P<0.0001 two-way ANOVA with Tukey's
post hoc test). (D) Proliferation rate in response to αPD-L1
treatment in 4T1 cells with PD-L1 overexpression (n=3, mean ± SEM;
*P<0.05, ***P<0.001,
****P<0.0001 by two-way ANOVA with Tukey's post hoc
test). αPD-L1, anti-PD-L1; PD-L1, programmed death-ligand 1; O/E,
overexpression; Ctl, control. |
PD-L1 expression is crucial for the
antitumor efficacy of anti-PD-L1 therapy in TNBC
ICIs targeting PD-L1 could be applied when the PD-L1
expression level on tumor or immune cells in the tumor tissue is
above a specific value. Most clinical benefits occur in patients
with high levels of PD-L1 expression (12). However, not all patients with high
PD-L1 levels show consistent treatment effects, suggesting that the
relationship between PD-L1 expression and treatment efficacy is not
yet fully understood (12). To
further investigate the efficacy of anti-PD-L1 depending on PD-L1
expression level, 4T1 breast cancer cell lines with different PD-L1
expression levels were established and transplanted into syngeneic
breast tumor mouse models to observe the effect of anti-PD-L1 on
tumors. It was observed that anti-PD-L1 treatment had no antitumor
effect on tumors generated from 4T1-PD-L1 O/E cell lines. In the
4T1-Ctl group with a very low PD-L1 expression level, an antitumor
effect of anti-PD-L1 (Fig. 3A and
B) was observed. Tumor weight measurements confirmed that PD-L1
overexpression reduced the anti-PD-L1 antitumor effect compared
with the 4T1-Ctl group (Fig. 3C).
Notably, in the control + anti-PD-L1 group, 1 animal died on day 10
of the study. Necropsy revealed no apparent abnormalities, and the
animal was included in the analysis. Compared with tumors derived
from 4T1 control cells with low PD-L1 expression, tumors with high
PD-L1 expression exhibited a markedly weaker response to anti-PD-L1
treatment, indicating that PD-L1 overexpression reduced the
antitumor efficacy of the therapy (Fig. 3A-C).
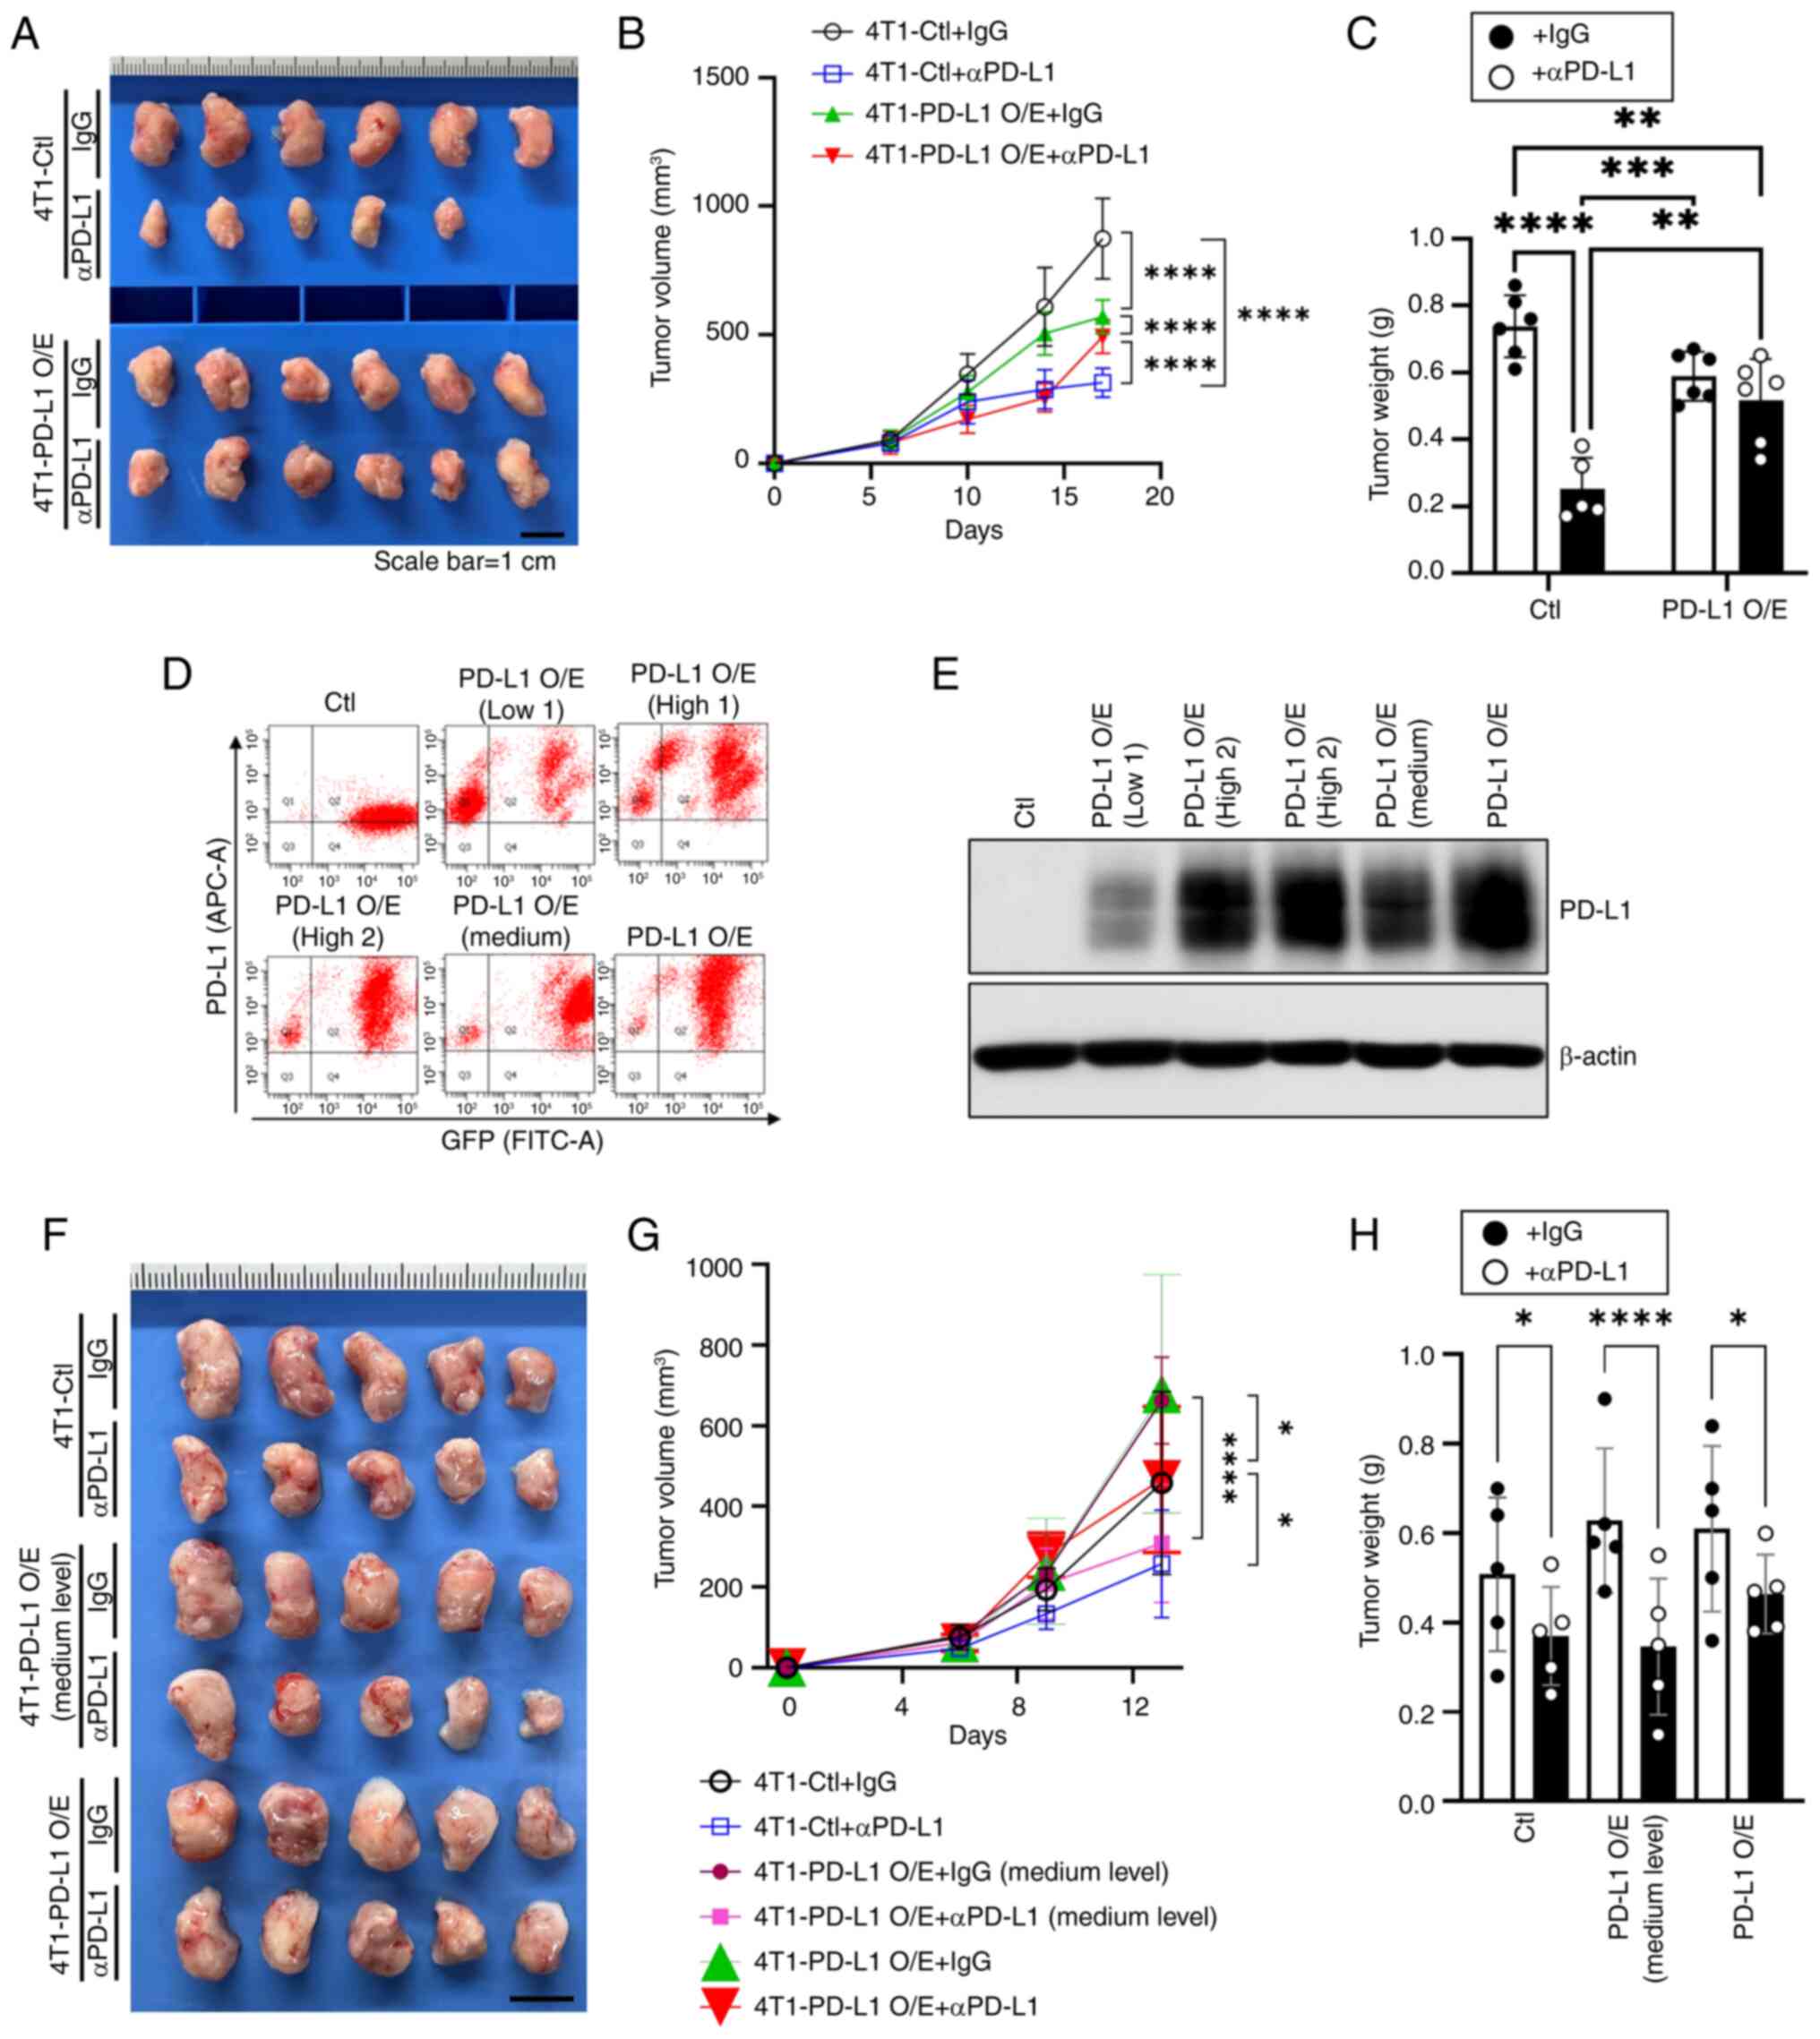 | Figure 3Differential effectiveness of αPD-L1
treatment on 4T1 breast tumors depending on the PD-L1 expression
levels. (A) Images of the tumor tissues (scale bar, 1 cm) and the
(B) volume and (C) weight of tumors treated with IgG or αPD-L1 with
or without high levels of PD-L1 overexpression (n=6, mean ± SEM;
**P<0.01, ***P<0.001,
****P<0.0001 by two-way ANOVA with Tukey's post hoc
test). (D) Flow cytometric sorting of 4T1 cells based on GFP
expression and PD-L1 levels and (E) immunoblot validation of PD-L1
expression in the sorted cell lines. (F) Images of tumor tissues
(scale bar, 1 cm) and the tumor (G) volume and (H) weight of mice
treated with IgG or αPD-L1 with or without medium or high levels of
PD-L1 overexpression (n=5, mean ± SEM; *P<0.05,
****P<0.0001 by multiple t-two-way ANOVA with Tukey's
post hoc test). αPD-L1, anti-PD-L1. αPD-L1, anti-PD-L1 antibody;
PD-L1, programmed death-ligand 1; IgG, immunoglobulin G; GFP, green
fluorescent protein; Ctl, control; O/E, overexpression. |
To clarify this observation, the anti-PD-L1 effect
was further tested by additionally including a group with
medium-PD-L1-expression [PD-L1 O/E (Medium)], which had a lower
PD-L1 expression level than the previously described overexpression
group. The medium-level group was collected and confirmed by GFP
sorting and immunoblotting (Fig. 3D
and E). Of note, anti-PD-L1 treatment was most effective in the
4T1-PD-L1 O/E (Medium level) group and the treatment outcomes were
similar to those observed in the 4T1-Ctl group; in some tumors,
treatment exhibited improved antitumor effects (Fig. 3F and G). The improved antitumor
effect in the 4T1-PD-L1 O/E (Medium level) group was also reflected
in the final tumor weight measurements (Fig. 3H).
These findings demonstrate that PD-L1 expression is
essential in determining the efficacy of anti-PD-L1 therapies.
Excessive PD-L1 levels diminish treatment response, while the
medium-level exhibited the greatest sensitivity to tumor treatment.
This suggests that there may be an optimal PD-L1 expression range
to maximize the effect of anti-PD-L1 therapy. This research
emphasizes the need to further refine patient selection criteria
for anti-PD-L1 therapy, as PD-L1 expression levels above a certain
level alone may not be sufficient to predict treatment success.
PD-L1 overexpression modulates immune
cell infiltration and T cell activation following anti-PD-L1
treatment
PD-L1 expression and treatment responses are related
to T cell infiltration into tumors (26). In this regard, based on the
aforementioned results, it was evaluated whether there was a
difference in immune cell infiltration according to anti-PD-L1
treatment between the control group and the PD-L1-overexpressing
tumor group. It was first confirmed whether PD-L1 was expressed at
a high level in tumors overexpressing PD-L1 (Fig. 4A). To understand the relationship
between the anti-PD-L1 effect and immune cell infiltration,
immunohistochemistry staining was performed for CD45, a total
immune cell marker, on tumor sections. It was observed that the
control tumors, in which anti-PD-L1 treatment exhibited a notable
antitumor effect, were infiltrated with immune cells (Fig. 4B). By contrast, the
PD-L1-overexpressing group, in which anti-PD-L1 treatment exhibited
a weak antitumor effect, had fewer infiltrated immune cells than
the control tumors (Fig. 4B).
Additionally, high levels of immune cell infiltration were also
observed in PD-L1 overexpressing tumors treated with IgG. This
result suggests that PD-L1 overexpression was not related to total
immune cell infiltration.
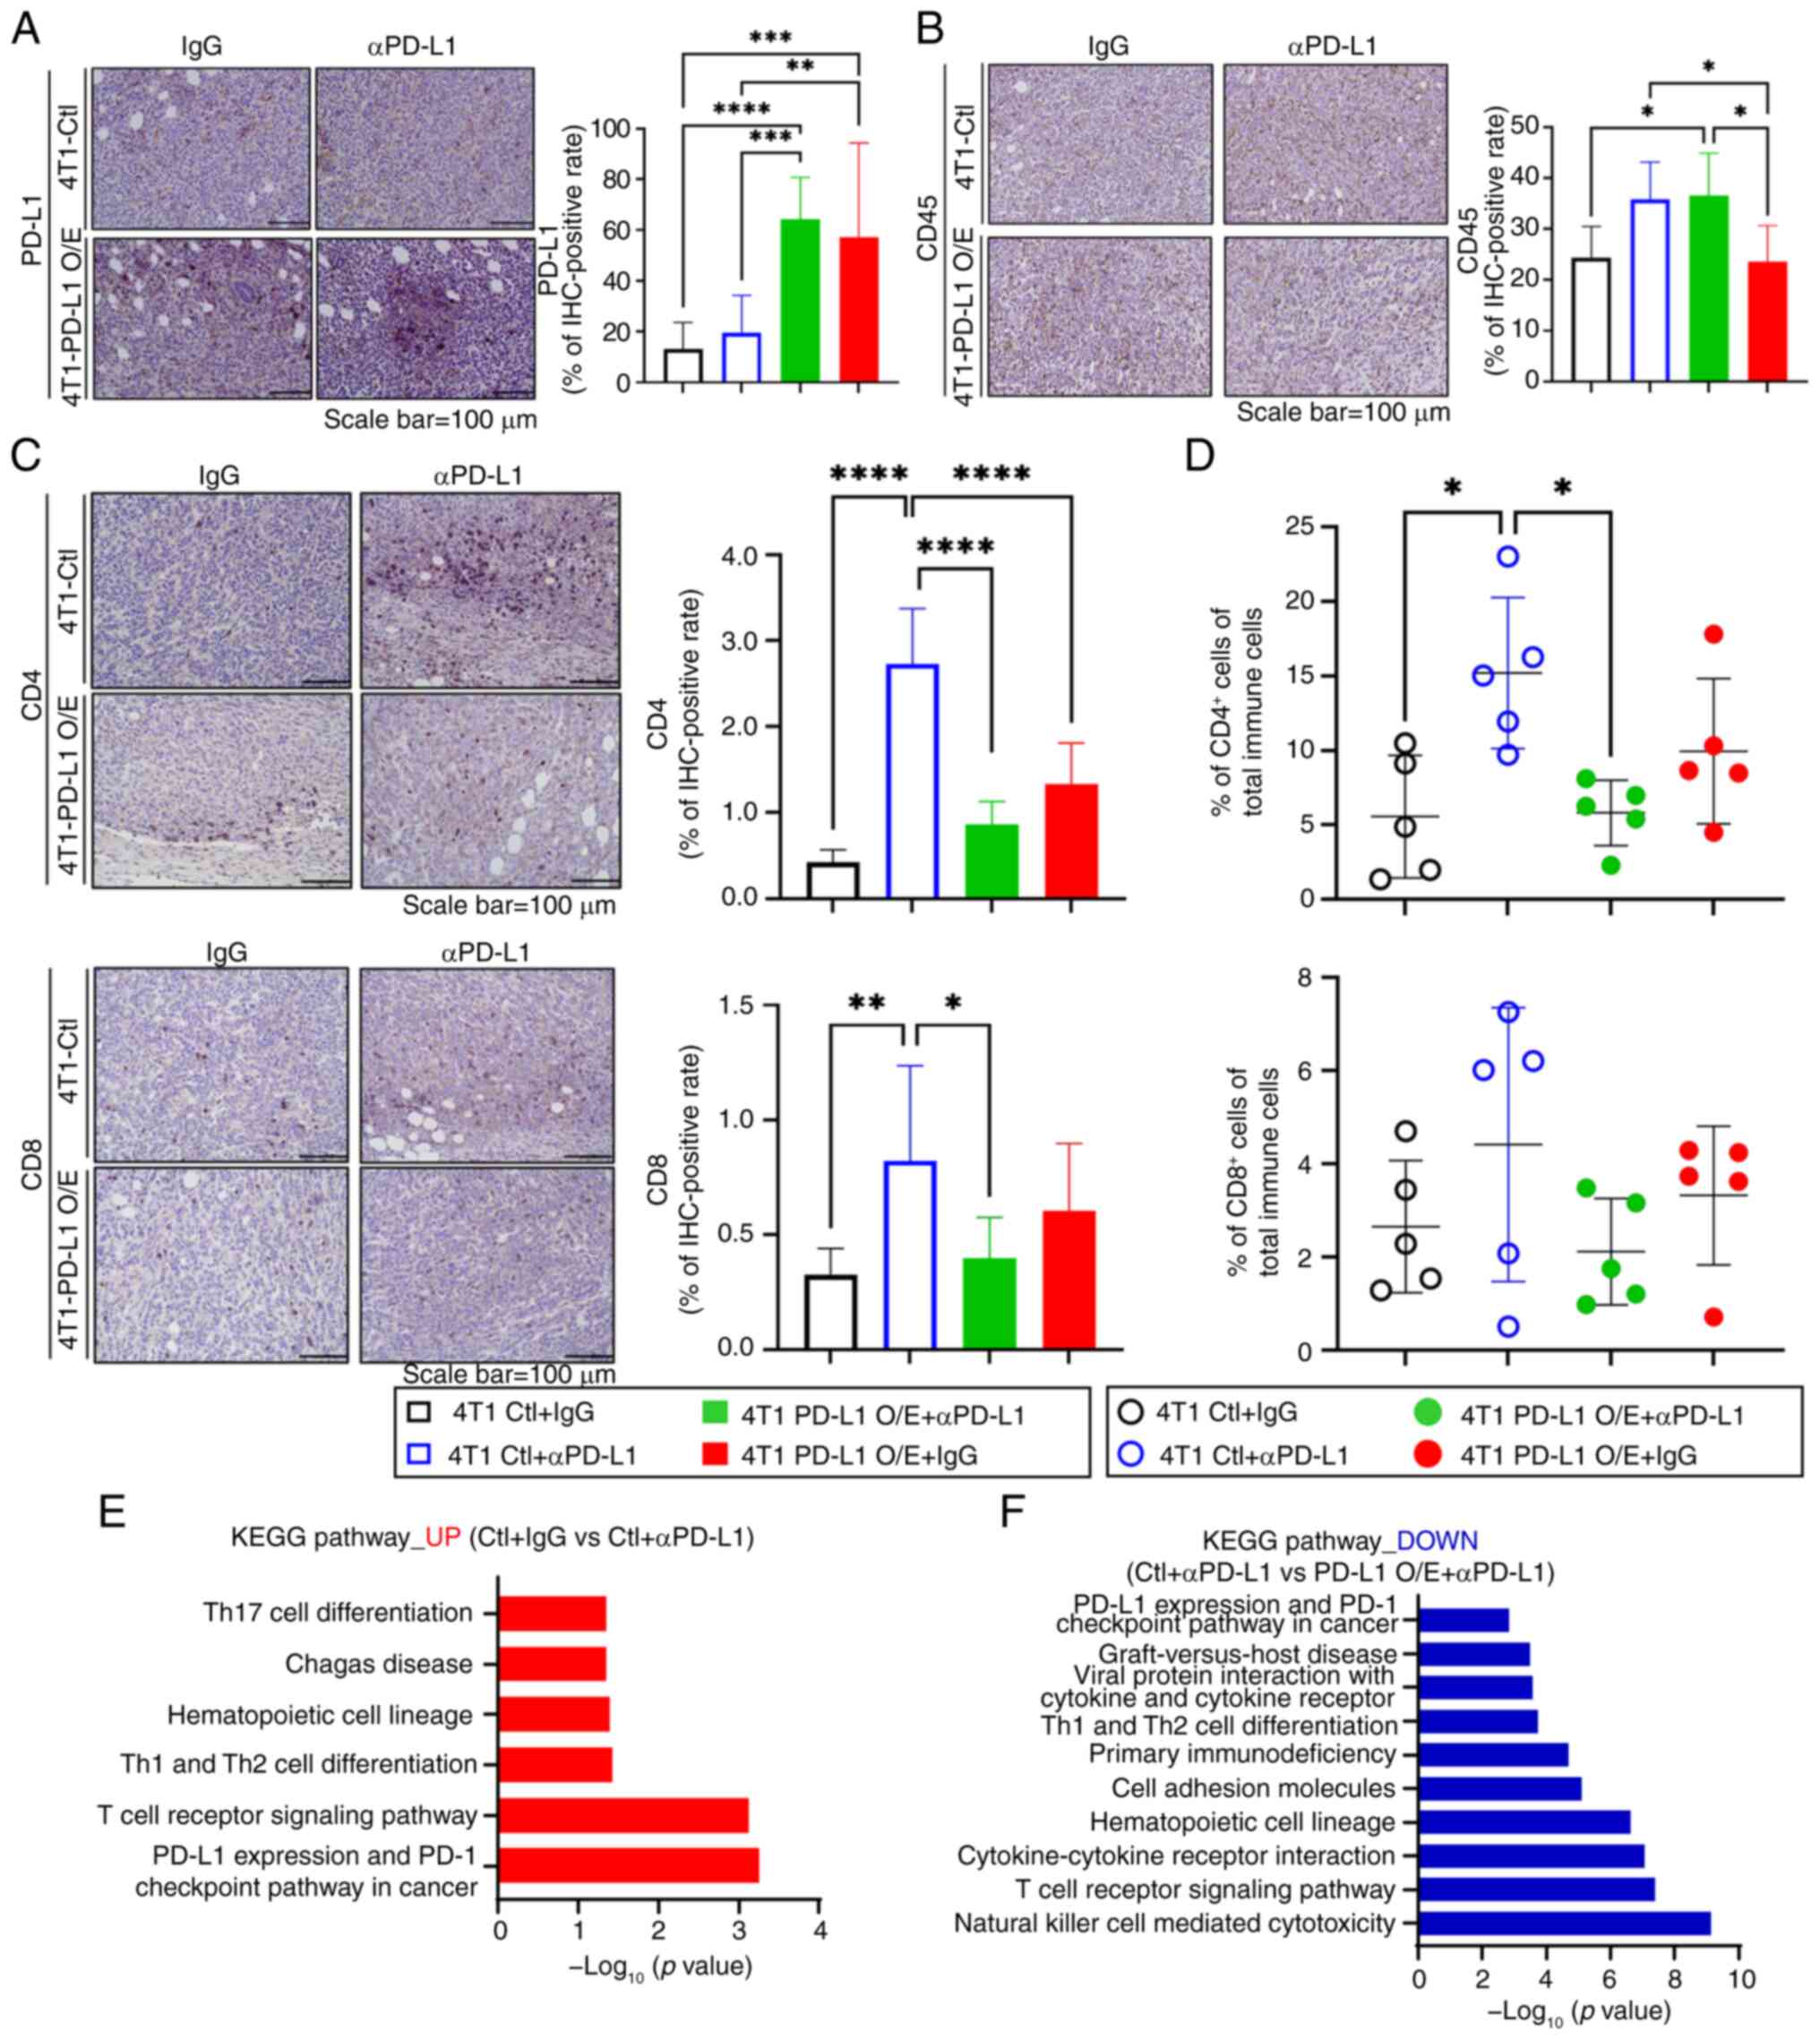 | Figure 4Influence of PD-L1 overexpression on
immune cell infiltration and T cell activation in response to
αPD-L1 therapy. Representative (A) PD-L1 and (B) CD45
immunohistochemistry images (scale bar, 100 μm) and the
corresponding quantification data of the tumor tissues (n=3, mean ±
SEM; *P<0.05, **P<0.01,
***P<0.001, ****P<0.0001 by two-way
ANOVA with Tukey's post hoc test). (C) Representative tissue images
of stained CD4 and CD8 (scale bar, 100 μm) and the
corresponding quantification data of the images (n=5, mean ± SEM;
*P<0.05, **P<0.01,
****P<0.0001 by two-way ANOVA with Tukey's post hoc
test). (D) Percentage of CD4 and CD8+ T cells in the
total immune cells analyzed through flow cytometry (n=5, mean ±
SEM; *P<0.05 by two-way ANOVA with Tukey's post hoc
test). Tumor groups are distinguished by color and fill across the
graph panels in A-D: Black (hollow): 4T1-Ctl + IgG, blue (hollow):
4T1-Ctl + αPD-L1, green (solid): 4T1-PD-L1 O/E + IgG, red (solid):
4T1-PD-L1 O/E + αPD-L1. (E) KEGG pathway analysis of DEGs
upregulated in control tumors treated with αPD-L1 compared with
IgG-treated controls. (F) KEGG pathway analysis of DEGs
downregulated in PD-L1 overexpressing tumors treated with αPD-L1
compared with control tumors treated with αPD-L1. PD-L1, programmed
death-ligand 1; αPD-L1, anti-PD-L1 antibody; CD45, cluster of
differentiation 45; CD4, cluster of differentiation 4; CD8, cluster
of differentiation 8; KEGG, Kyoto Encyclopedia of Genes and
Genomes; DEGs, differentially expressed genes; IgG, immunoglobulin
G; O/E, overexpression. |
The group differences in the distribution of
CD4+ and CD8+ T cells were analyzed, which
are associated with the anti-PD-L1 antitumor effect among immune
cells. In the control tumors, where anti-PD-L1 treatment was highly
effective, infiltrated CD4+ and CD8+ T cells
were more numerous that in the other groups (Fig. 4C). By contrast, tumors
overexpressing PD-L1 exhibited only a slight increase in
CD4+ and CD8+ T cell infiltration levels
after anti-PD-L1 treatment compared with the control (Fig. 4C). Notably, in these tumors,
anti-PD-L1 treatment lowered the infiltration of both types of T
cells compared with the control anti-PD-L1 treatment group. For
validation of the aforementioned results, flow cytometry was
performed. The control group treated with anti-PD-L1 had higher
CD4+ and CD8+ T cell infiltration levels,
whereas the tumors treated with anti-PD-L1 that overexpressed PD-L1
had reduced T cell distribution (Figs. 4D and S3).
To understand the underlying mechanism for these
observations, the tumor samples were subjected to bulk RNA
sequencing and group specific DEGs were applied to the pathway
analysis. Using the identified DEGs and pathways, the DEGs were
compared between the control tumors treated with IgG and those
treated with anti-PD-L1. This method led to the identification of
pathways specifically upregulated by anti-PD-L1, independent of
PD-L1 overexpression. To assess downregulation in primary
resistance, DEGs were also compared between control tumors and
PD-L1-overexpressing tumors, both treated with anti-PD-L1. Analysis
of the upregulated genes in the control + anti-PD-L1 group showed
enhanced signaling related to T cell activation, with increased
PD-L1 and PD-1 immune check point pathway activities, as well as
upregulation of Th17 and Th1/Th2 cell differentiation KEGG pathways
(Fig. 4E). By contrast, the PD-L1
O/E + anti-PD-L1 group exhibited significant downregulation of
genes involved in T cell signaling, the PD-L1-PD-1 pathway and
various immune cell-related signaling pathways, compared with the
control treatment group (Fig.
4F). These results suggest that while PD-L1 upregulation
contributes to immune cell infiltration within tumors, excessive
PD-L1 levels may impair T cell activation and overall immune
responses, thereby compromising the efficacy of anti-PD-L1 therapy.
These findings highlight the importance of PD-L1 expression levels
in determining the success of the immune checkpoint blockade and
suggest that excessively high PD-L1 expression levels may lead to
an immunosuppressive microenvironment that impedes the therapeutic
effect of PD-L1 inhibitors.
Discussion
The present study focused on investigating the
antitumor response to anti-PD-L1 therapy according to the
expression level of PD-L1 and on determining the reasons for the
difference in response. The application of ICIs to TNBC, which has
limited treatment options due to the lack of clear targeted
therapies, has emerged as a new treatment strategy, but not all
patients respond well to the treatment (27). PD-L1, highly expressed in various
cancer types and involved in immune evasion, is a crucial target of
cancer immunotherapy, but its role and function according to the
degree of expression are not yet known. Due to the potential
implications of PD-L1 expression levels, it is essential to
investigate whether these levels may limit the effectiveness of
anti-PD-L1 therapy. In the present study, 4T1 cell lines with
various levels of PD-L1 were transplanted into a breast cancer
mouse tumor model, which were then treated with anti-PD-L1,
providing evidence that there is a difference in the immunotherapy
response depending on the expression level of PD-L1. The results
support that the expression level of PD-L1 has a pivotal role in
immunotherapy and that refined clinical strategies considering this
are needed. PD-L1 is associated with the response to anti-PD-1 or
anti-PD-L1 therapy in various cancer types (28-30). In the IMpaassion130 study that
assessed the efficacy of atezolizumab (targets PD-L1), the
PD-L1-positive patient subgroup exhibited prolonged overall
survival and progression-free survival (12,31). By contrast, the GeparNuevo
clinical trial of another anti-PD-L1 agent reported that durvalumab
did not induce differences in therapeutic efficacy according to
PD-L1 status (13). These studies
suggest that the efficacy of ICIs according to the status of PD-L1
expression in cancer remains unclear. In clinical trials, PD-L1
levels in immune cells and tumor cells have been used as a
criterion for selecting patient groups (20). Nevertheless, the efficacy of ICI
therapy was not guaranteed in a number of patients with high tumor
PD-L1 expression levels (32-35).
Tumor cells adaptively increase PD-L1 levels to
avoid immune attack via the PD-1/PD-L1 pathway, and this
upregulation of PD-L1 inhibits the effect of ICIs (36). Upregulated PD-L1 forms an
immunosuppressive TME (37-39), which could reduce the
effectiveness of ICIs. In the present study, in tumors
overexpressing PD-L1, an increase in the total immune cell levels
was observed but a reduced infiltration of T cells involved in the
anti-PD-L1 effect was also observed. In the control group with high
anti-PD-L1 treatment efficacy, the Th17 cell differentiation KEGG
pathway was highly expressed. Th17 recruits antitumor neutrophils
and CD8+ cytotoxic T cells to promote tumorigenic
mediators, which is consistent with the findings (40). Additionally, in the group that
responded to treatment, the Th1/Th2 cell differentiation pathway
was upregulated in KEGG pathway analysis. By contrast, this pathway
was suppressed in PD-L1-overexpressing tumors that did not respond
well to treatment. These findings are consistent with a previous
study demonstrating that Th1 cells enhance antitumor immunity by
secreting cytokines such as IFN-γ and IL-2, which promote the
proliferation and cytotoxic activity of CD8+ T cells
(41). Th1 activity also
contributes to antitumor effects by promoting M1 macrophage
polarization (42). By contrast,
Th2 cells facilitate tumor growth by secreting immunosuppressive
cytokines through M2 macrophages (43). Furthermore, in the present study,
NK cell-mediated cytotoxicity pathways were downregulated in the
PD-L1-overexpressing group. As critical effectors of innate
immunity, NK cells contribute to antitumor responses by promoting
dendritic cell maturation and inducing IL-12p70 production, which
further supports Th1 polarization (44). These findings suggest that the
reduced efficacy of anti-PD-L1 therapy in PD-L1-upregulated tumors
may be attributed to impaired Th1 responses and attenuated NK cell
activity, both of which are essential for effective antitumor
immunity. The observed immunosuppressive phenotype in
PD-L1-overexpressing tumors aligns with the well-established role
of the PD-1/PD-L1 axis in dampening T cell activation and promoting
the expansion of M2 macrophages (45,46). These observations, derived from
KEGG pathway analysis, support a model in which excessive PD-L1
expression contributes to a shift away from Th1- and NK
cell-mediated immunity, potentially limiting the effectiveness of
immune checkpoint blockade. These results indicate that PD-L1
overexpression may create an immunosuppressive state within the
tumor immune microenvironment, thereby inhibiting the therapeutic
efficacy of ICIs.
Similar observations have been reported across
various cancer types regarding the role of the PD-1/PD-L1 pathway.
In lung cancer, PD-L1 expression is associated with the suppression
of CD8+ T cell activation and poor survival outcomes,
reflecting the immunosuppressive role of the PD-1/PD-L1 axis in
modulating antitumor immune responses (47). Furthermore, in colorectal cancer,
PD-L1 expression contributes to immune evasion by enhancing
regulatory T cell function and inducing IL-10 expression (48). PD-L1 expression is more frequently
observed in metastatic tumors, where it correlates with poor
prognosis and serves as a biomarker for immunotherapy eligibility
(49). In gastric cancer, the
expression of PD-1 and PD-L1 in tumor-infiltrating immune cells has
been associated with a favorable prognosis (50). By contrast, tumor-associated
fibroblasts promote PD-L1 expression in cancer cells, thereby
contributing to an immunosuppressive microenvironment and
facilitating tumor progression (51). In pancreatic cancer,
PD-L1-positive tumors have been shown to exhibit increased
infiltration of regulatory T cells, reduced levels of IL-10 and
increased interferon-γ production following PD-L1 blockade, further
supporting the therapeutic potential of targeting the PD-1/PD-L1
axis (52).
Combination therapy with neoadjuvant chemotherapy
and ICIs has been used to improve tumor response and survival
outcomes in TNBC (13,34). Surgical excision is important in
the treatment of TNBC, and in cases that involve non-palpable
breast cancer, minimal localization procedures would make treatment
precise and minimize complications (53-55). The interplay between immune-based
therapies and evolving surgical techniques might provide a more
extensive approach to TNBC treatment. However, the molecular
function of PD-L1 upregulation in TNBC tumors was not elucidated in
the present study and the clinical significance of PD-L1 in human
tumor tissue samples was not demonstrated, both of which are the
major limitations of the present study.
In conclusion, the present study showed that the
efficacy of anti-PD-L1 in immunotherapy for TNBC is associated with
the PD-L1 expression status of the tumor. PD-L1 upregulation
induces changes in the tumor immune environment, which may be the
main cause of the limitations of immunotherapy. These results
indicate that novel therapeutic strategies considering the role of
PD-L1 should be further explored.
Supplementary Data
Availability of data and materials
The RNA sequencing data generated in the present
study may be found in the NCBI Gene Expression Omnibus repository
under accession number GSE292013 or at the following URL:
https://www.ncbi.nlm.nih.gov/geo/query/acc.cgi?acc=GSE292013.
All other data generated in the present study may be requested from
the corresponding author.
Authors' contributions
AYP and JHK confirm the authenticity of all the raw
data. Conception, design and methodology development were conducted
by JHK, HSK, HKK, HBL and WH; acquisition of data (including
experimentation and data collection) was conducted by JHK, AYP, SL,
HKK and HBL; analysis and interpretation of data (including
statistical and bioinformatics analysis) was conducted by JHK, AYP,
HKK, HBL and WH; writing and/or revising the manuscript was
conducted by JHK and WH; administrative, technical or material
support (including facility use and technical assistance) was
provided by HKK and HBL; study supervision and project
administration were conducted by WH. All authors read and approved
the final version of the manuscript.
Ethics approval and consent to
participate
In vivo experiments were conducted at the
animal facility of Seoul National University Hospital (Seoul,
Republic of Korea), following institutional guidelines and
obtaining prior approval from the Institutional Animal Care and Use
Committee (approval no. 23-0157-S1A0). Animals were housed in an
AAALAC International-accredited facility (accreditation no. 001169)
in accordance with the Guide for the Care and Use of Laboratory
Animals, 8th edition, NRC (2010).
Patient consent for publication
Not applicable.
Competing interests
The authors declare that they have no competing
interests.
Acknowledgements
Not applicable.
Funding
This work was supported by the National Research Foundation of
Korea grant funded by the Korea government (MSIT; grant nos.
RS-2022-NR070245 and RS-2022-NR070043), a grant of Patient-Centered
Clinical Research Coordinating Center funded by the Ministry of
Health & Welfare, Republic of Korea (grant no. HC19C0110), the
Industrial Strategic Technology Development Program funded by the
Ministry of Trade, Industry and Energy (Korea; grant no. 20024391),
grants from the SNUH Research Fund (grant nos. 03-2023-0360 and
04-2022-0230) and a grant of the Korea-US Collaborative Research
Fund funded by the Ministry of Science and ICT and Ministry of
Health & Welfare, Republic of Korea (grant no.
RS-2024-00468338).
References
|
1
|
Doroshow DB, Bhalla S, Beasley MB, Sholl
LM, Kerr KM, Gnjatic S, Wistuba II, Rimm DL, Tsao MS and Hirsch FR:
PD-L1 as a biomarker of response to immune-checkpoint inhibitors.
Nat Rev Clin Oncol. 18:345–362. 2021. View Article : Google Scholar : PubMed/NCBI
|
|
2
|
Blank C, Gajewski TF and Mackensen A:
Interaction of PD-L1 on tumor cells with PD-1 on tumor-specific T
cells as a mechanism of immune evasion: Implications for tumor
immunotherapy. Cancer Immunol Immunother. 54:307–314. 2005.
View Article : Google Scholar
|
|
3
|
Cha JH, Chan LC, Li CW, Hsu JL and Hung
MC: Mechanisms controlling PD-L1 expression in cancer. Mol Cell.
76:359–370. 2019. View Article : Google Scholar : PubMed/NCBI
|
|
4
|
Butte MJ, Keir ME, Phamduy TB, Sharpe AH
and Freeman GJ: Programmed death-1 ligand 1 interacts specifically
with the B7-1 costimulatory molecule to inhibit T cell responses.
Immunity. 27:111–122. 2007. View Article : Google Scholar : PubMed/NCBI
|
|
5
|
Akinleye A and Rasool Z: Immune checkpoint
inhibitors of PD-L1 as cancer therapeutics. J Hematol Oncol.
12:922019. View Article : Google Scholar : PubMed/NCBI
|
|
6
|
Yin L, Duan JJ, Bian XW and Yu SC:
Triple-negative breast cancer molecular subtyping and treatment
progress. Breast Cancer Res. 22:612020. View Article : Google Scholar : PubMed/NCBI
|
|
7
|
Won KA and Spruck C: Triple-negative
breast cancer therapy: Current and future perspectives (Review).
Int J Oncol. 57:1245–1261. 2020. View Article : Google Scholar : PubMed/NCBI
|
|
8
|
Elmakaty I, Abdo R, Elsabagh A, Elsayed A
and Malki MI: Comparative efficacy and safety of PD-1/PD-L1
inhibitors in triple negative breast cancer: A systematic review
and network meta-analysis of randomized controlled trials. Cancer
Cell Int. 23:902023. View Article : Google Scholar : PubMed/NCBI
|
|
9
|
Ahn SG, Kim SK, Shepherd JH, Cha YJ, Bae
SJ, Kim C, Jeong J and Perou CM: Clinical and genomic assessment of
PD-L1 SP142 expression in triple-negative breast cancer. Breast
Cancer Res Treat. 188:165–178. 2021. View Article : Google Scholar : PubMed/NCBI
|
|
10
|
Yu Y, Jin X, Zhu X, Xu Y, Si W and Zhao J:
PD-1/PD-L1 immune checkpoint inhibitors in metastatic
triple-negative breast cancer: A systematic review and
meta-analysis. Front Immunol. 14:12066892023. View Article : Google Scholar :
|
|
11
|
Cortes J, Rugo HS, Cescon DW, Im SA, Yusof
MM, Gallardo C, Lipatov O, Barrios CH, Perez-Garcia J, Iwata H, et
al: Pembrolizumab plus chemotherapy in advanced triple-negative
breast cancer. N Engl J Med. 387:217–226. 2022. View Article : Google Scholar : PubMed/NCBI
|
|
12
|
Schmid P, Rugo HS, Adams S, Schneeweiss A,
Barrios CH, Iwata H, Diéras V, Henschel V, Molinero L, Chui SY, et
al: Atezolizumab plus nab-paclitaxel as first-line treatment for
unresectable, locally advanced or metastatic triple-negative breast
cancer (IMpassion130): Updated efficacy results from a randomised,
double-blind, placebo-controlled, phase 3 trial. Lancet Oncol.
21:44–59. 2020. View Article : Google Scholar
|
|
13
|
Loibl S, Schneeweiss A, Huober J, Braun M,
Rey J, Blohmer JU, Furlanetto J, Zahm DM, Hanusch C, Thomalla J, et
al: Neoadjuvant durvalumab improves survival in early
triple-negative breast cancer independent of pathological complete
response. Ann Oncol. 33:1149–1158. 2022. View Article : Google Scholar : PubMed/NCBI
|
|
14
|
Ren D, Hua Y, Yu B, Ye X, He Z, Li C, Wang
J, Mo Y, Wei X, Chen Y, et al: Predictive biomarkers and mechanisms
underlying resistance to PD1/PD-L1 blockade cancer immunotherapy.
Mol Cancer. 19:192020. View Article : Google Scholar : PubMed/NCBI
|
|
15
|
Brummel K, Eerkens AL, de Bruyn M and
Nijman HW: Tumour-infiltrating lymphocytes: From prognosis to
treatment selection. Br J Cancer. 128:451–458. 2023. View Article : Google Scholar :
|
|
16
|
Angelico G, Broggi G, Tinnirello G, Puzzo
L, Vecchio GM, Salvatorelli L, Memeo L, Santoro A, Farina J, Mulé
A, et al: Tumor infiltrating lymphocytes (TILS) and PD-L1
expression in breast cancer: A review of current evidence and
prognostic implications from pathologist's perspective. Cancers
(Basel). 15:44792023. View Article : Google Scholar : PubMed/NCBI
|
|
17
|
Salgado R, Denkert C, Demaria S, Sirtaine
N, Klauschen F, Pruneri G, Wienert S, Van den Eynden G, Baehner FL,
Penault-Llorca F, et al: The evaluation of tumor-infiltrating
lymphocytes (TILs) in breast cancer: Recommendations by an
international TILs working group 2014. Ann Oncol. 26:259–271. 2015.
View Article : Google Scholar
|
|
18
|
Ahmed H, Mahmud AR, Siddiquee MF, Shahriar
A, Biswas P, Shimul MEK, Ahmed SZ, Ema TI, Rahman N, Khan MA, et
al: Role of T cells in cancer immunotherapy: Opportunities and
challenges. Cancer Pathog Ther. 1:116–126. 2023. View Article : Google Scholar
|
|
19
|
June CH: Adoptive T cell therapy for
cancer in the clinic. J Clin Invest. 117:1466–1476. 2007.
View Article : Google Scholar : PubMed/NCBI
|
|
20
|
Porta FM, Sajjadi E, Venetis K,
Frascarelli C, Cursano G, Guerini-Rocco E, Fusco N and Ivanova M:
Immune biomarkers in triple-negative breast cancer: Improving the
predictivity of current testing methods. J Pers Med. 13:11762023.
View Article : Google Scholar : PubMed/NCBI
|
|
21
|
Curtis C, Shah SP, Chin SF, Turashvili G,
Rueda OM, Dunning MJ, Speed D, Lynch AG, Samarajiwa S, Yuan Y, et
al: The genomic and transcriptomic architecture of 2,000 breast
tumours reveals novel subgroups. Nature. 486:346–352. 2012.
View Article : Google Scholar : PubMed/NCBI
|
|
22
|
Pereira B, Chin SF, Rueda OM, Vollan HK,
Provenzano E, Bardwell HA, Pugh M, Jones L, Russell R, Sammut S, et
al: The somatic mutation profiles of 2,433 breast cancers refines
their genomic and transcriptomic landscapes. Nat Commun.
7:114792016. View Article : Google Scholar : PubMed/NCBI
|
|
23
|
Cancer Genome Atlas Network: Comprehensive
molecular portraits of human breast tumours. Nature. 490:61–70.
2012. View Article : Google Scholar : PubMed/NCBI
|
|
24
|
Livak KJ and Schmittgen TD: Analysis of
relative gene expression data using real-time quantitative PCR and
the 2(-Delta Delta C(T)) method. Methods. 25:402–408. 2001.
View Article : Google Scholar
|
|
25
|
Shan D, Chen L, Njardarson JT, Gaul C, Ma
X, Danishefsky SJ and Huang XY: Synthetic analogues of migrastatin
that inhibit mammary tumor metastasis in mice. Proc Natl Acad Sci
USA. 102:3772–3776. 2005. View Article : Google Scholar : PubMed/NCBI
|
|
26
|
Teng MW, Ngiow SF, Ribas A and Smyth MJ:
Classifying cancers based on T-cell infiltration and PD-L1. Cancer
Res. 75:2139–2145. 2015. View Article : Google Scholar : PubMed/NCBI
|
|
27
|
Filho PN, Albuquerque C, Capella MP and
Debiasi M: Immune checkpoint inhibitors in breast cancer: A
narrative review. Oncol Ther. 11:171–183. 2023. View Article : Google Scholar
|
|
28
|
Herbst RS, Soria JC, Kowanetz M, Fine GD,
Hamid O, Gordon MS, Sosman JA, McDermott DF, Powderly JD, Gettinger
SN, et al: Predictive correlates of response to the anti-PD-L1
antibody MPDL3280A in cancer patients. Nature. 515:563–567. 2014.
View Article : Google Scholar : PubMed/NCBI
|
|
29
|
Taube JM, Anders RA, Young GD, Xu H,
Sharma R, McMiller TL, Chen S, Klein AP, Pardoll DM, Topalian SL
and Chen L: Colocalization of inflammatory response with B7-h1
expression in human melanocytic lesions supports an adaptive
resistance mechanism of immune escape. Sci Transl Med.
4:127ra1372012. View Article : Google Scholar
|
|
30
|
Topalian SL, Hodi FS, Brahmer JR,
Gettinger SN, Smith DC, McDermott DF, Powderly JD, Carvajal RD,
Sosman JA, Atkins MB, et al: Safety, activity, and immune
correlates of anti-PD-1 antibody in cancer. N Engl J Med.
366:2443–2454. 2012. View Article : Google Scholar : PubMed/NCBI
|
|
31
|
Badve SS, Penault-Llorca F, Reis-Filho JS,
Deurloo R, Siziopikou KP, D'Arrigo C and Viale G: Determining PD-L1
status in patients with triple-negative breast cancer: Lessons
learned from IMpassion130. J Natl Cancer Inst. 114:664–675. 2022.
View Article : Google Scholar :
|
|
32
|
Garon EB, Rizvi NA, Hui R, Leighl N,
Balmanoukian AS, Eder JP, Patnaik A, Aggarwal C, Gubens M, Horn L,
et al: Pembrolizumab for the treatment of non-small-cell lung
cancer. N Engl J Med. 372:2018–2028. 2015. View Article : Google Scholar : PubMed/NCBI
|
|
33
|
Schmid P, Chui SY and Emens LA:
Atezolizumab and nab-paclitaxel in advanced triple-negative breast
cancer. Reply. N Engl J Med. 380:987–988. 2019.PubMed/NCBI
|
|
34
|
Schmid P, Cortes J, Pusztai L, McArthur H,
Kümmel S, Bergh J, Denkert C, Park YH, Hui R, Harbeck N, et al:
Pembrolizumab for early triple-negative breast cancer. N Engl J
Med. 382:810–821. 2020. View Article : Google Scholar : PubMed/NCBI
|
|
35
|
Hellmann MD, Ciuleanu TE, Pluzanski A, Lee
JS, Otterson GA, Audigier-Valette C, Minenza E, Linardou H, Burgers
S, Salman P, et al: Nivolumab plus ipilimumab in lung cancer with a
high tumor mutational burden. N Engl J Med. 378:2093–2104. 2018.
View Article : Google Scholar : PubMed/NCBI
|
|
36
|
Yuan Y, Adam A, Zhao C and Chen H: Recent
advancements in the mechanisms underlying resistance to PD-1/PD-L1
blockade immunotherapy. Cancers (Basel). 13:6632021. View Article : Google Scholar : PubMed/NCBI
|
|
37
|
Yang L, Hu Q and Huang T: Breast cancer
treatment strategies targeting the tumor microenvironment: How to
convert 'Cold' tumors to 'Hot' tumors. Int J Mol Sci. 25:72082024.
View Article : Google Scholar
|
|
38
|
Fan Y and He S: The characteristics of
tumor microenvironment in triple negative breast cancer. Cancer
Manag Res. 14:1–17. 2022. View Article : Google Scholar : PubMed/NCBI
|
|
39
|
Ding R and Wang Y, Fan J, Tian Z, Wang S,
Qin X, Su W and Wang Y: Identification of immunosuppressive
signature subtypes and prognostic risk signatures in
triple-negative breast cancer. Front Oncol. 13:11084722023.
View Article : Google Scholar :
|
|
40
|
Yang L, Qi Y, Hu J, Tang L, Zhao S and
Shan B: Expression of Th17 cells in breast cancer tissue and its
association with clinical parameters. Cell Biochem Biophys.
62:153–159. 2012. View Article : Google Scholar
|
|
41
|
Bos R and Sherman LA: CD4+ T-cell help in
the tumor milieu is required for recruitment and cytolytic function
of CD8+ T lymphocytes. Cancer Res. 70:8368–8377. 2010. View Article : Google Scholar : PubMed/NCBI
|
|
42
|
Biswas SK and Mantovani A: Macrophage
plasticity and interaction with lymphocyte subsets: Cancer as a
paradigm. Nat Immunol. 11:889–896. 2010. View Article : Google Scholar : PubMed/NCBI
|
|
43
|
Fu C, Jiang L, Hao S, Liu Z, Ding S, Zhang
W, Yang X and Li S: Activation of the IL-4/STAT6 signaling pathway
promotes lung cancer progression by increasing M2 myeloid cells.
Front Immunol. 10:26382019. View Article : Google Scholar : PubMed/NCBI
|
|
44
|
Nguyen-Pham TN, Yang DH, Nguyen TA, Lim
MS, Hong CY, Kim MH, Lee HJ, Lee YK, Cho D, Bae SY, et al: Optimal
culture conditions for the generation of natural killer
cell-induced dendritic cells for cancer immunotherapy. Cell Mol
Immunol. 9:45–53. 2012. View Article : Google Scholar
|
|
45
|
Zhang L, Gu S, Wang L, Zhao L, Li T, Zhao
X and Zhang L: M2 macrophages promote PD-L1 expression in
triple-negative breast cancer via secreting CXCL1. Pathol Res
Pract. 260:1554582024. View Article : Google Scholar : PubMed/NCBI
|
|
46
|
Lotfinejad P, Kazemi T, Mokhtarzadeh A,
Shanehbandi D, Niaragh FJ, Safaei S, Asadi M and Baradaran B:
PD-1/PD-L1 axis importance and tumor microenvironment immune cells.
Life Sci. 259:1182972020. View Article : Google Scholar : PubMed/NCBI
|
|
47
|
Niemeijer AN, Sahba S, Smit EF,
Lissenberg-Witte BI, de Langen AJ and Thunnissen E: Association of
tumour and stroma PD-1, PD-L1, CD3, CD4 and CD8 expression with DCB
and OS to nivolumab treatment in NSCLC patients pre-treated with
chemotherapy. Br J Cancer. 123:392–402. 2020. View Article : Google Scholar : PubMed/NCBI
|
|
48
|
Li Y, He M, Zhou Y, Yang C, Wei S, Bian X,
Christopher O and Xie L: The prognostic and clinicopathological
roles of PD-L1 expression in colorectal cancer: A systematic review
and meta-analysis. Front Pharmacol. 10:1392019. View Article : Google Scholar : PubMed/NCBI
|
|
49
|
Wang HB, Yao H, Li CS, Liang LX, Zhang Y,
Chen YX, Fang JY and Xu J: Rise of PD-L1 expression during
metastasis of colorectal cancer: Implications for immunotherapy. J
Dig Dis. 18:574–581. 2017. View Article : Google Scholar : PubMed/NCBI
|
|
50
|
Wu X, Gu Z, Chen Y, Chen B, Chen W, Weng L
and Liu X: Application of PD-1 blockade in cancer immunotherapy.
Comput Struct Biotechnol J. 17:661–674. 2019. View Article : Google Scholar : PubMed/NCBI
|
|
51
|
Mu L, Yu W, Su H, Lin Y, Sui W, Yu X and
Qin C: Relationship between the expressions of PD-L1 and
tumour-associated fibroblasts in gastric cancer. Artif Cells
Nanomed Biotechnol. 47:1036–1042. 2019. View Article : Google Scholar
|
|
52
|
Okudaira K, Hokari R, Tsuzuki Y, Okada Y,
Komoto S, Watanabe C, Kurihara C, Kawaguchi A, Nagao S, Azuma M, et
al: Blockade of B7-H1 or B7-DC induces an anti-tumor effect in a
mouse pancreatic cancer model. Int J Oncol. 35:741–749.
2009.PubMed/NCBI
|
|
53
|
Gambardella C, Clarizia G, Patrone R, Offi
C, Mauriello C, Romano R, Filardo M, Conzo A, Sanguinetti A,
Polistena A, et al: Advanced hemostasis in axillary lymph node
dissection for locally advanced breast cancer: New technology
devices compared in the prevention of seroma formation. BMC Surg.
18:1252019. View Article : Google Scholar : PubMed/NCBI
|
|
54
|
Parisi S, Gambardella C, Conzo G, Ruggiero
R, Tolone S, Lucido FS, Iovino F, Fisone F, Brusciano L,
Parmeggiani D and Docimo L: Advanced localization technique for
non-palpable breast cancer: Radiofrequency alone VS combined
technique with ultrasound. J Clin Med. 12:50762023. View Article : Google Scholar : PubMed/NCBI
|
|
55
|
Parisi S, Ruggiero R, Gualtieri G, Volpe
ML, Rinaldi S, Nesta G, Bogdanovich L, Lucido FS, Tolone S,
Parmeggiani D, et al: Combined LOCalizer and intraoperative
ultrasound localization: First experience in localization of
non-palpable breast cancer. In Vivo. 35:1669–1676. 2021. View Article : Google Scholar :
|


