Introduction
Retinoblastoma (RB) is a rare disease of infancy and
early childhood (1). It is rarely
encountered in adults. The majority of RB patients exhibit
excellent survival outcomes (2,3). At
present, the standard staging system that is internationally used
is the International Retinoblastoma Staging System (4). Staging is an important factor
affecting treatment selection and outcome (5). Previous studies demonstrated that
African-American descent adversely affected the outcome of RB, a
finding that may be due to limited access to treatment (6,7).
Further investigations are required to identify the socioeconomic
barriers to optimal RB outcomes.
The Surveillance, Epidemiology and End Results
(SEER; http://seer.cancer.gov/) program is a
public-use cancer registry of the USA National Cancer Institute.
SEER is widely used as a source of benchmark data for studying RB
outcomes in the USA as well as in other countries (1,3,8–11).
In addition to the biological and treatment factors, this database
also provides a large number of county-level socioeconomic factors.
This study was part of a larger study that aimed to identify
barriers to optimal cancer treatment outcomes, which may be
discernable only from information obtained from a national
database.
Materials and methods
SEER is a public-use database that may be used for
analysis with no requirement for internal review board approval.
SEER Clinical Outcome Prediction Expert (SCOPE) (12) was used to mine SEER data and
construct accurate and efficient prediction models (13,14).
Data were obtained from the SEER 18 database, using the filter
‘Site and Morphology’. ICCC site recode ICD-O-3 = ‘V
Retinoblastoma’. The SEER*Stat statistical software
(http://seer.cancer.gov/seerstat/) was
used for case listing. Kaplan-Meier analysis was used to assess the
time to RB-specific mortality (coded as Eye and Orbit mortality in
SEER) data. The two-sample Kolmogorov-Smirnov test was used to
assess the significance of the difference between two survival
curves. The Cox proportional hazards model was used for
multivariate analysis. For univariate and multivariate analyses,
coding was as follows: i) SEER stage: 0, local/regional; 1,
metastatic/unstaged; ii) county-level rural vs. urban residence
status: 0, urban residence; 1, rural residence; iii)
race/ethnicity: 0, non-African American; 1, African American; iv)
county-level percentage of college graduates: 0, >25%; 1, ≤25%;
v) county-level household income: 0, >55,000 USD/year; 1,
≤55,000 USD/year. All statistics and programming were performed by
Matlab (www.mathworks.com). The areas under the receiver
operating characteristic (ROC) curves were computed for predictors.
In addition, binary fusion and optimization were used to streamline
the ROC risk stratification by combining risk strata when possible.
Similar strata were fused to create more efficient models if the
resultant ROC performance did not degrade (13,14).
Results
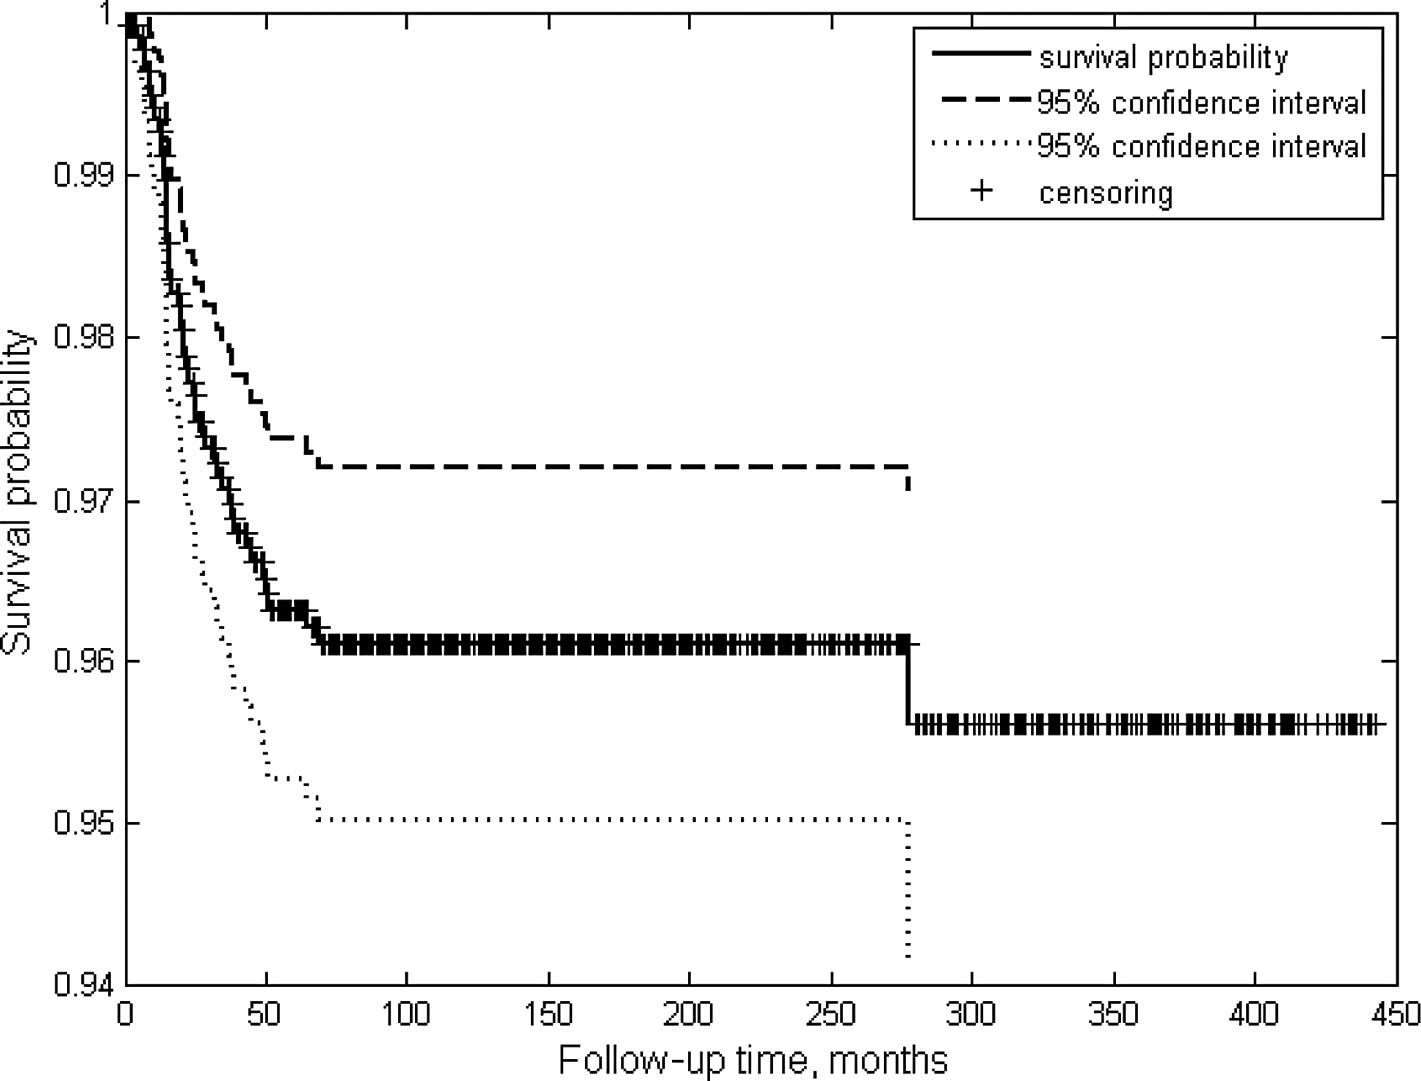
A total of 1,456 patients were included in this
study (Table I). The Kaplan-Meier
survival curve exhibited an excellent long-term cause-specific
survival rate of >90% (Fig. 1).
The mean follow-up time (SD) was 128.75 (113.74) months and the
mean age (SD) was 1.4 (2.6) years. There were only 5 adult RB
patients listed by the SEER 18 database, a number representing ∼28%
of the USA cases reported between 1973 and 2009. The majority of
the patients had been staged and SEER stage was the most
significant predictive factor, with an ROC area of 0.64 (0.01)
(Table I). The ROC area of this
model was computed from 5 samples that were randomly selected from
the case pool. Each sample represented 50% of the total number of
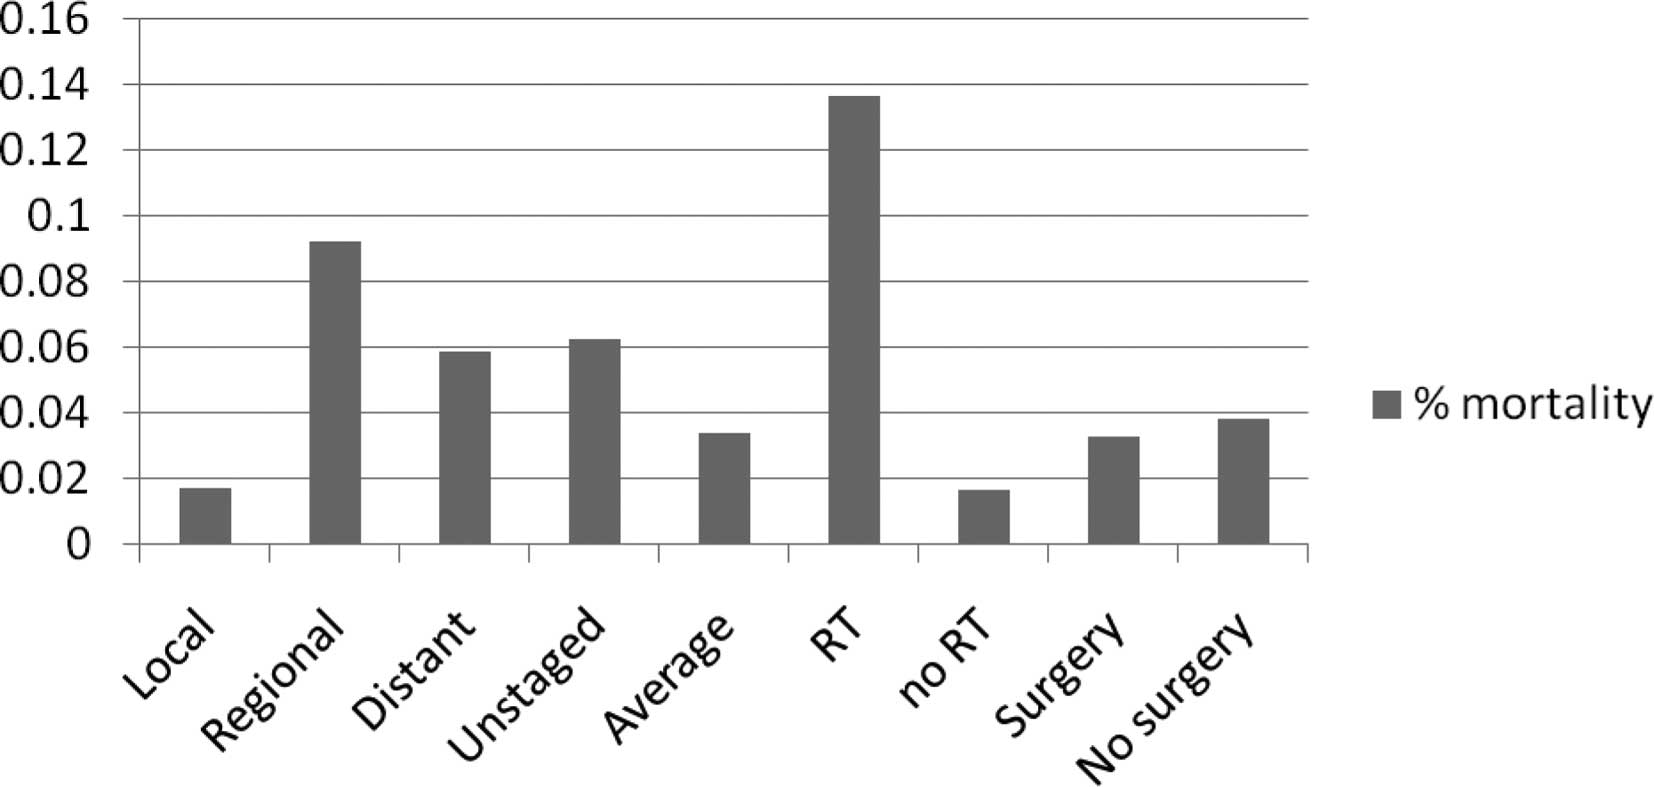
cases. As shown in Fig. 2, the
risk did not progress from lower (local stage)- to higher (distant
stage)-risk groups. Furthermore, ROC analysis revealed that
regional and distant groups may be combined in terms of predicting
the cause-specific survival of RB patients. A significant number of
unstaged patients were identified, accounting for 7.5% of the
patient population (Table I and
Fig. 2). Unstaged patients
exhibited a high risk of mortality, comparable to that of
metastatic RB patients (Fig. 2).
The SEER staging model was initially created as a 4-tiered model
(Table I). Radiotherapy (RT) was
used in ∼10% of patients and was predictive of worse outcome
(RB-specific mortality risk, 13.7%). The use of RT as an
eye-preservation treatment has declined over the years (Fig. 3), possibly due to the secondary
cancers that have been attributed to RT in RT-treated patients
(15).
 | Table IUnivariate risk models including
sociodemographic, tumor and treatment risk factors for disparity in
RB treatment outcome. |
Table I
Univariate risk models including
sociodemographic, tumor and treatment risk factors for disparity in
RB treatment outcome.
| Initial univariate
risk models | No. | % | Model | ROC | SD |
|---|
| Study population | 1,456 | | | | |
| Gender | | | | | |
| Male | 760 | 52.16 | | 0.52 | 0.00 |
| Female | 696 | 47.77 | | | |
| Mean follow-up time
in months (SD) | 128.75 (113.14) | | | | |
| Mean age of diagnosis
in years (SD) | 1.4 (2.6) | | | | |
| Patient age
(years) | | | | | |
| ≥20 | 5 | 0.34 | | | |
| <20 | 1,451 | 99.66 | | | |
| Race and
ethnicity | | | | | |
| White | 1,069 | 73.37 | | 0.55 | 0.01 |
| Othera | 156 | 10.71 | | | |
| Black | 207 | 14.21 | | | |
| Unknown | 19 | 1.30 | | | |
| Other unspecified
(1991+) | 5 | 0.34 | | | |
| Radiation
treatment | | | | | |
| Beam radiation | 183 | 12.56 | | | |
| Combination of beam
with implants or isotopes | 1 | 0.07 | RT vs. no | 0.73 | 0.01 |
| Radioactive
implants | 21 | 1.44 | | | |
| None | 1,217 | 83.53 | | | |
| Recommended,
unknown if administered | 13 | 0.89 | | | |
| Radiation, NOS
method or source not specified | 8 | 0.55 | | | |
| Unknown | 11 | 0.75 | | | |
| Refused | 1 | 0.07 | | | |
| Radioisotopes | 1 | 0.07 | | | |
| Surgery
recommendations | | | | | |
| Reasons other than
cancer | 1 | 0.07 | Surgery vs. no | 0.52 | 0.00 |
| Surgery
performed | 1,248 | 85.66 | | | |
| Recommended but not
performed, unknown reason | 76 | 5.22 | | | |
| Unknown; death
certificate or autopsy only case | 17 | 1.17 | | | |
| Not recommended,
contraindicated due to other conditions | 1 | 0.07 | | | |
| Not
recommended | 112 | 7.69 | | | |
| Recommended,
unknown if performed | 1 | 0.07 | | | |
| Recommended but not
performed, patient refused | 1 | 0.07 | | | |
| County-level annual
household income | | | | | |
| ≥55,000 USD | 615 | 42.24 | | 0.53 | 0.00 |
| <55,000
USD | 841 | 57.76 | | | |
| County-level %
college graduates | | | | | |
| ≥25% | 729 | 50.07 | | | |
| <25% | 727 | 49.93 | | | |
| Rural-urban
continuum code 2003 | | | | | |
| Counties in
metropolitan areas, 250,000-1 million pop | 295 | 20.25 | | 0.54 | 0.01 |
| Counties in
metropolitan areas ≥1 million pop | 897 | 61.56 | | | |
| Urban pop of
2,500-19,999, not adjacent to a metro area | 29 | 1.99 | | | |
| Urban pop of ge
20,000 adjacent to a metropolitan area | 29 | 1.99 | | | |
| Counties in
metropolitan areas of <250,000 pop | 121 | 8.30 | | | |
| Comp rural
<2,500 urban pop, adjacent to a metro area | 8 | 0.55 | | | |
| Urban pop of
2,500–19,999, adjacent to a metro area | 45 | 3.09 | | | |
| Comp rural
<2,500 urban pop, not adjacent to metro area | 8 | 0.55 | | | |
| Urban pop of
≥20,000 not adjacent to a metropolitan area | 20 | 1.37 | | | |
|
Unknown/missing/no match (Alaska -
Entire State) | 4 | 0.27 | | | |
| SEER historical
stage A | | | | | |
| Localized, I | 1,040 | 71.38 | I, II, III, IV | 0.64 | 0.01 |
| Regional, II | 185 | 12.70 | optimized | | |
| Distant, III | 119 | 8.17 | I, (II, III),
IV | 0.64 | 0.00 |
| Unstaged, IV | 112 | 7.69 | | | |
| COD to site rec
KM | | | | | |
| Alive | 1,362 | 93.48 | | | |
| Eye and
Orbit | 49 | 3.36 | | | |
| Others | 45 | 3.09 | | | |
As regards the pretreatment factors, Table II shows that gender, county-level
household income and county-level percentage of college graduates
did not divide RB patients into subgroups with distinct risk
factors of cause-specific RB mortality. The mean follow-up time was
∼10 years (Table I) and the
overall risk of cause-specific mortality was ∼3% (Fig. 2). However, groups not optimal in
terms of race and rural-urban continuum factors have doubled this
risk to ∼6%. Thus, race and rural-urban continuums were expected to
exhibit large ROC areas. However, their ROC areas were only
moderately larger than the expected 0.5 for a random variable
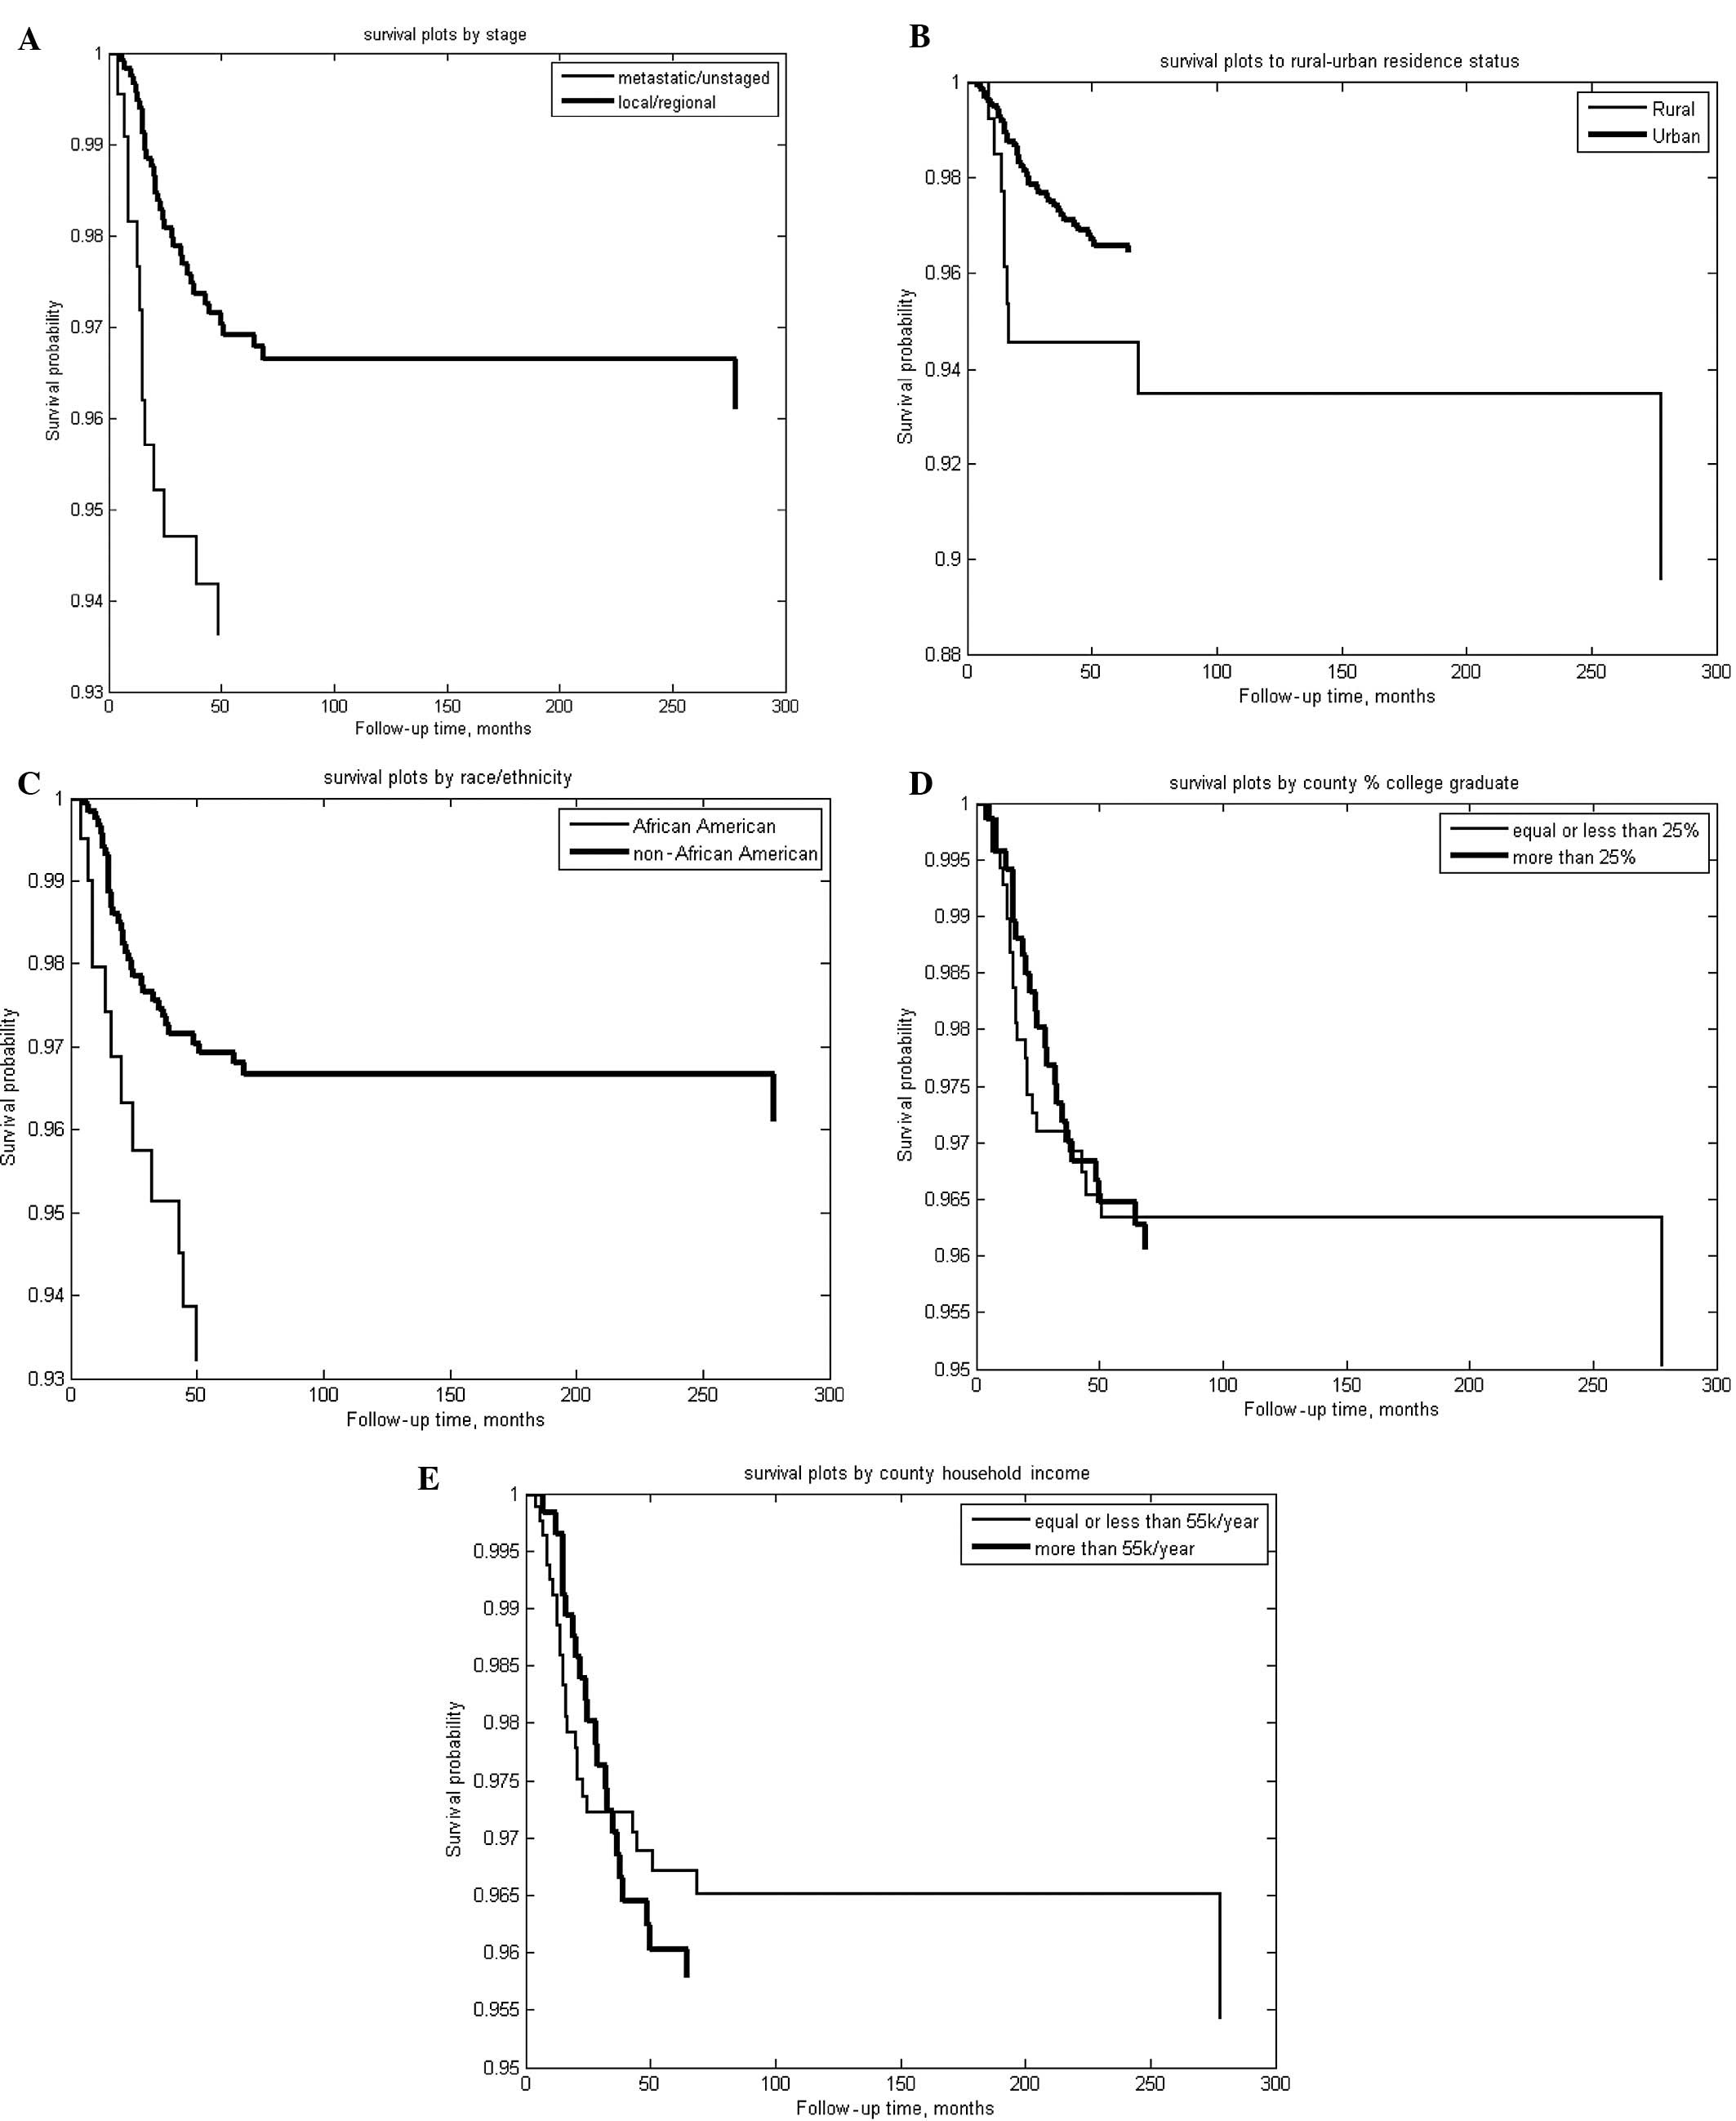
(Table I). When analyzed by time
to cause-specific mortality, however, Fig. 3 and Table III show that SEER stage, race and
rural-urban residence status were significant univariate
predictors, unlike county-level household income or percentage of
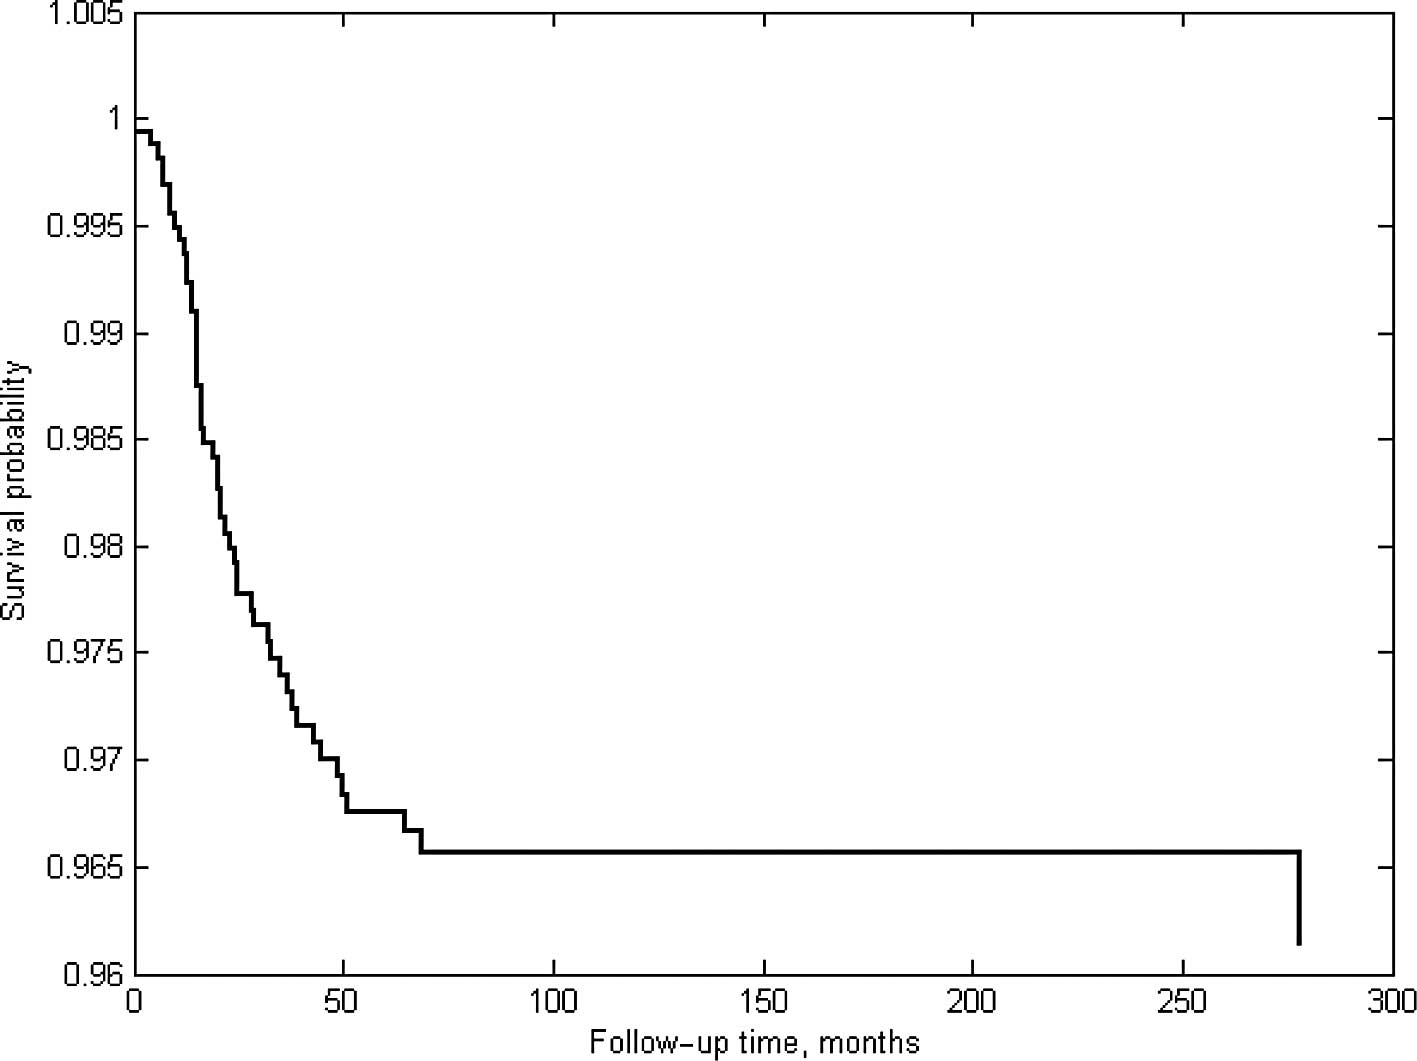
college graduates. Table III shows
that the effects of race and rural-urban residence on RB outcome,
as measured by Cox coefficients, are comparable to the effect of
SEER stage. The Cox proportional hazard fit from the related Cox
analysis (Table III) is shown in
Fig. 4.
| Table IIRisk of RB-specific mortality (%)
associated with gender, age and various socioeconomic models. |
Table II
Risk of RB-specific mortality (%)
associated with gender, age and various socioeconomic models.
| Predictors | Patient no. | % mortality |
|---|
| Gender | | |
| Female | 696 | 0.03 |
| Male | 760 | 0.03 |
| Age (years) | | |
| <20 | 1,451 | 0.03 |
| ≥20 | 5 | 0.00 |
| County % college
graduates | | |
| >25% | 729 | 0.03 |
| ≤25% | 727 | 0.03 |
| Rural-urban
continuum code 2003 | | |
| Metropolitan | 1,313 | 0.03 |
| No | 143 | 0.06 |
| County-level annual
household income | | |
| ≥55,000 USD | 615 | 0.04 |
| <55,000
USD | 841 | 0.03 |
| Ethnicity | | |
|
African-American | 207 | 0.06 |
| Others | 1,249 | 0.03 |
| Table IIIUnivariate and multivariate analyses
of RB prognosticators. |
Table III
Univariate and multivariate analyses
of RB prognosticators.
| Predictors | Kolmogorov-Smirnov
test
| Cox proportional
hazard model
|
|---|
| h | P-value | κ | β | SE | P-value |
|---|
| SEER stage | | | | | | |
| 0,
local/regional | 1 | 0.0284 | 0.4688 | 0.7737 | 0.3166 | 0.0145 |
| 1,
metastatic/unstaged | | | | | | |
| Rural-urban
residence | | | | | | |
| 0, urban
residence | 1 | 0.0152 | 0.5556 | 0.9337 | 0.4008 | 0.0198 |
| 1, rural
residence | | | | | | |
| Race/ethnicity | | | | | | |
| 0,
non-African-American | 1 | 0.0234 | 0.4833 | 0.804 | 0.3375 | 0.0172 |
| 1,
African-American | | | | | | |
| County % college
graduates | | | | | | |
| 0, >25% | 0 | 0.9879 | 0.134 | 0.0881 | 0.4123 | 0.8308 |
| 1, ≤25% | | | | | | |
| County household
income | | | | | | |
| 0,
>55,000/year | 0 | 0.7974 | 0.1905 | −0.3622 | 0.4151 | 0.383 |
| 1,
≤55,000/year | | | | | | |
Discussion
RB treatment exhibits success rates of >90%
(Fig. 1). Previous studies
demonstrated that socioeconomic factors may affect the outcome of
RB patients (6,7) and that relocation of individuals from
low-income to higher-income neighborhoods lowered the rates of
obesity and diabetes over a 10–15-year follow-up period (16,17).
The aim of this study was to identify socioeconomic factors
affecting the cause-specific survival of RB, in order to generate
testable hypotheses for future trials of removing socioeconomic
barriers to optimal RB outcomes. Therefore, this study investigated
numerous possible explanatory factors (Table I).
The use of RT has declined over the years. This is
likely due to severe long-term side effects. However, the long-term
outcomes following treatment with aggressive chemotherapy have not
been well characterized (2).
Considering the improvement in proton therapy techniques, modern
image guidance coupled with proton beam RT may need to be
re-evaluated regarding its utility in the treatment of RB (18–20).
The International Retinoblastoma Staging System
(4) serves as an important guide
for the treatment selection and outcome of RB patients (5). However, this study used SEER staging,
which has been consistent over the years, in order to analyze
follow-up data in their entirety. SEER staging was identified as
the most significant pretreatment predictive factor (Table I). After binary fusion, the
optimized staging was reduced to a 3-tiered classification
(Fig. 2 and Table I). Such efficient models may aid in
reducing the number of patients required for clinical trials, since
it has fewer risk groups to balance. Whether the SEER staging model
is more accurate compared to the alternative models (1,3) may
be elucidated by further investigations. As a point of reference,
we estimated that the ROC area of a commonly used prognostic model
for prostate cancer using PSA, Gleason Score and prostate T-stage,
had a ROC area of 0.75 (13,14,21).
Using ROC area as a metric and a binary fusion
algorithm, the 4-tiered SEER staging model was simplified into a
3-tiered model. The ROC area of this model was comparable to the
original risk model. Thus, the model is simplified by 25% without
an accuracy penalty. This may be of significance, considering that
25% less trial participants may be required to balance the risk
profiles of the test and control arms. This is particularly
relevant since several clinical trials are available for RB and
other childhood cancers (6,7).
Unstaged patients are associated with a high risk of mortality,
comparable to that of metastatic RB patients (Fig. 2), possibly due to the fact that
without accurate staging, it would be difficult to select the
optimal treatment option. Staged patients fared better compared to
the overall cohort (Table II and
Fig. 3A).
SEER data are particularly useful in ascertaining
treatment individualization and have been used by previous studies
(7,9–11).
In order to demonstrate the independent prognostic values of
socioeconomic factors, we performed univariate and multivariate
analyses of socioeconomic factors in combination with the most
significant biological factor (SEER stage). Residing in areas with
populations of <25,000 was associated with high risk of
RB-specific mortality, as was African American descent (Table II, Fig. 3B–C and Table III); however, county-level
household income and percentage of college graduates were not
associated with a higher risk of mortality (Fig. 3D–E and Table III).
In conclusion, this study identified the most
prognostic staging models according to pretreatment factors for RB
cancer patients. Socioeconomic barriers identified included race
and rural-urban residence. African American descent and rural
residence led to a 3% decrease (Table
II) in RB cause-specific survival. Eliminating barriers to
optimal treatment may reduce outcome disparity in RB patients.
References
|
1.
|
Broaddus E, Topham A and Singh AD:
Incidence of retinoblastoma in the USA: 1975–2004. Br J Ophthalmol.
93:21–23. 2009.
|
|
2.
|
Abramson DH, Marr BP, Brodie SE, et al:
Ophthalmic artery chemosurgery for less advanced intraocular
retinoblastoma: five year review. PLoS One. 7:e341202012.PubMed/NCBI
|
|
3.
|
Broaddus E, Topham A and Singh AD:
Survival with retinoblastoma in the USA: 1975–2004. Br J
Ophthalmol. 93:24–27. 2009.
|
|
4.
|
Sastre X, Chantada GL, Doz F, et al:
Proceedings of the consensus meetings from the International
Retinoblastoma Staging Working Group on the pathology guidelines
for the examination of enucleated eyes and evaluation of prognostic
risk factors in retinoblastoma. Arch Pathol Lab Med. 133:1199–1202.
2009.
|
|
5.
|
Schvartzman E, Chantada G, Fandino A, et
al: Results of a stage-based protocol for the treatment of
retinoblastoma. J Clin Oncol. 14:1532–1536. 1996.PubMed/NCBI
|
|
6.
|
Pui CH, Pei D, Pappo AS, et al: Treatment
outcomes in black and white children with cancer: results from the
SEER database and St Jude Children’s Research Hospital, 1992
through 2007. J Clin Oncol. 30:2005–2012. 2012.PubMed/NCBI
|
|
7.
|
Liu L, Krailo M, Reaman GH and Bernstein
L: Childhood cancer patients’ access to cooperative group cancer
programs: a population-based study. Cancer. 97:1339–1345. 2003.
|
|
8.
|
Kleinerman RA, Tucker MA, Abramson DH, et
al: Risk of soft tissue sarcomas by individual subtype in survivors
of hereditary retinoblastoma. J Natl Cancer Inst. 99:24–31. 2007.
View Article : Google Scholar : PubMed/NCBI
|
|
9.
|
Lanier AP, Holck P, Ehrsam Day G and Key
C: Childhood cancer among Alaska natives. Pediatrics. 112:e3962003.
View Article : Google Scholar : PubMed/NCBI
|
|
10.
|
Gatta G, Capocaccia R, Coleman MP, Ries LA
and Berrino F: Childhood cancer survival in Europe and the United
States. Cancer. 95:1767–1772. 2002. View Article : Google Scholar : PubMed/NCBI
|
|
11.
|
Breslow NE and Langholz B: Childhood
cancer incidence: geographical and temporal variations. Int J
Cancer. 32:703–716. 1983. View Article : Google Scholar : PubMed/NCBI
|
|
12.
|
Cheung R: Poor treatment outcome of
neuroblastoma and other peripheral nerve cell tumors may be related
to under usage of radiotherapy and socio-economic disparity: a US
SEER data analysis. Asian Pac J Cancer Prev. 13:4587–4591. 2012.
View Article : Google Scholar
|
|
13.
|
Cheung R, Altschuler MD, D’Amico AV, et
al: ROC optimization may improve risk stratification of prostate
cancer patients. Urology. 57:286–290. 2001. View Article : Google Scholar : PubMed/NCBI
|
|
14.
|
Cheung R, Altschuler MD, D’Amico AV, et
al: Using the receiver operating characteristic curve to select
pretreatment and pathologic predictors for early and late
postprostatectomy PSA failure. Urology. 58:400–405. 2001.
View Article : Google Scholar : PubMed/NCBI
|
|
15.
|
Vasudevan V, Cheung MC, Yang R, et al:
Pediatric solid tumors and second malignancies: characteristics and
survival outcomes. J Surg Res. 160:184–189. 2010. View Article : Google Scholar : PubMed/NCBI
|
|
16.
|
Ludwig J, Sanbonmatsu L, Gennetian L, et
al: Neighborhoods, obesity, and diabetes - a randomized social
experiment. N Engl J Med. 365:1509–1519. 2011. View Article : Google Scholar : PubMed/NCBI
|
|
17.
|
Ludwig J, Duncan GJ, Gennetian LA, et al:
Neighborhood effects on the long-term well-being of low-income
adults. Science. 337:1505–1510. 2012. View Article : Google Scholar : PubMed/NCBI
|
|
18.
|
Chang JW, Yu YS, Kim JY, et al: The
clinical outcomes of proton beam radiation therapy for
retinoblastomas that were resistant to chemotherapy and focal
treatment. Korean J Ophthalmol. 25:387–393. 2011. View Article : Google Scholar : PubMed/NCBI
|
|
19.
|
Munier FL, Verwey J, Pica A, et al: New
developments in external beam radiotherapy for retinoblastoma: from
lens to normal tissue-sparing techniques. Clin Experiment
Ophthalmol. 36:78–89. 2008. View Article : Google Scholar : PubMed/NCBI
|
|
20.
|
DeLaney TF: Clinical proton radiation
therapy research at the Francis H. Burr Proton Therapy Center.
Technol Cancer Res Treat. 6(Suppl 4): 61–66. 2007. View Article : Google Scholar : PubMed/NCBI
|
|
21.
|
Hanley JA and McNeil BJ: The meaning and
use of the area under a receiver operating characteristic (ROC)
curve. Radiology. 143:29–36. 1982. View Article : Google Scholar : PubMed/NCBI
|