Introduction
Gastric cancer (GC) is one of most common cancers
worldwide, even if the incidence rate is decreasing in certain
regions. Almost 951,600 new patients were diagnosed with GC in 2012
(1). The survival rate of patients
with GC remains relatively poor, since the majority of cases are
already in the late stage at diagnosis, and surgery and
chemotherapy result in an unsatisfactory prognosis. Serum tumor
markers are useful for diagnosis, for predicting survival rates and
for monitoring recurrence following surgery (2,3).
Carcinoembryonic antigen (CEA), carbohydrate antigen (CA) 19-9 and
CA72-4 are the most frequently used clinical markers. It has been
demonstrated that they are useful in the diagnosis, treatment and
prognosis of GC (4–8). However, the specificity and sensitivity
of serum tumor markers considered in isolation are not satisfactory
in GC, particularly in the early stage (9). Therefore, certain researchers have
previously used combinations of markers, since they can improve the
sensitivity for diagnosis of GC (10–12). Yang
et al (13) demonstrated that
the sensitivities of CA72-4, CEA, cancer antigen 125 (CA125) and
CA19-9 for GC were 33.0, 25.5, 31.1 and 38.7%, respectively.
However, the sensitivity of the four markers in combination
increased to 66.0%. Similarly, the individual sensitivities of CEA
and CA19-9 were 30 and 42%, respectively, although this increased
to 58% when CEA and CA19-9 were combined (14). Ychou et al (15) reported a similar result, with a
sensitivity of 75% when CA72-4, CEA and CA19-9 were combined. The
above results may be explained simply by different markers being
positive in different patients. However, to the best of our
knowledge, the fundamental cause underlying this phenomenon remains
to be fully elucidated. In the present study, the differences and
correlation of these three biomarkers in patients with GC were
investigated, with the aim to evaluate how the three biomarkers in
combination work more effectively than any of the biomarkers
considered alone.
Materials and methods
Patients
A total of 216 patients from Liaocheng People's
Hospital (Shandong, China) were enrolled between January 2011 and
December 2013. Of the patients, 172 (79.63%) were men and 44
(20.37%) were women. The median age was 62 years (range: 20–85
years). The patients' age, gender, tumor histological type and
extent of the primary tumor/involvement of regional lymph
node/distant metastases (TNM) stage of the cancer were collected
from the medical records. The cohort of patients included those who
received radical, palliative surgery or chemotherapy. The tumor
histological type was determined on the basis of the Japanese
Gastric Cancer Association classification system (2010) (16). The T- and the N-stages were not
identified in 23 and 29 of the total patients, respectively, since
these patients did not receive a radical gastrectomy. These
patients were therefore excluded from the statistical comparison
performed for the T- and N-stage groups. Papillary adenocarcinoma
and well-/moderately-differentiated tubular adenocarcinoma were
classified as differentiated-type carcinoma, whereas poorly
differentiated adenocarcinoma, signet ring cell carcinoma and
mucinous carcinoma were classified as undifferentiated-type
carcinoma. The TNM stage was determined according to the 7th
edition of the International Union Against Cancer Classification
(2010) (17).
Biomarkers
The serum levels of CEA, CA19-9 and CA72-4 were
detected on admission of the patients to hospital, when the
patients had not received any surgery, chemotherapy or
radiotherapy. The normal reference values were as follows: CEA, ≤5
ng/ml; CA19-9, ≤39 U/ml; and CA72-4, ≤6.9 U/ml. Patients were
considered positive for CEA, CA19-9 or CA72-4 when the serum levels
were identified to be greater than the above-mentioned values.
Patients were considered positive for the parallel test when the
serum level of any of CEA, CA19-9 or CA72-4 was greater than its
normal value.
Statistical analyses
Differences in the positive rates (categorical
variables) of CEA, CA72-4 and CA19-9 were analyzed using the
χ2 test, and f correlation analysis was used to study
the correlation among the expression levels of CEA, CA19-9 and
CA72-4. The serum levels of CEA, CA19-9 and CA72-4 were described
using median values. The differences in serum levels of the
biomarkers were compared using the non-parametric Wilcoxon
two-sample test. The correlation between serum levels of biomarkers
was analyzed using Spearman's rank correlation coefficient test.
All the data were analyzed using SAS version 9.0 software (SAS
Institute, Inc., Cary, NC, USA). P<0.05 was considered to
indicate a statistically significant difference.
Results
Differences and correlation of
positive rates of CEA, CA19-9 and CA72-4
The positive rates for CEA, CA19-9 and CA72-4 were
22.69 (49/216), 18.98 (41/216) and 22.69% (49/216). The positive
rate of the parallel test of CEA, CA19-9 and CA72-4 was 44.91%
(97/216), which was significantly higher compared with the
individual CEA, CA19-9 and CA72-4 positive rates (all P<0.05;
Fig. 1). In subgroups based on
gender, age, histology, T stage, N stage, M stage and TNM stage
cancer, the majority of the individual positive rates for CEA,
CA19-9 and CA72-4 were significantly lower compared with the
parallel test positive rates (P<0.05). However, no significant
differences were identified between the parallel test positive
rates, the CA19-9 and CA72-4 positive rates in the women patients,
or between the parallel test positive rates and the CEA and CA72-4
positive rates in the T1/2 and M1 subgroups (P>0.05).
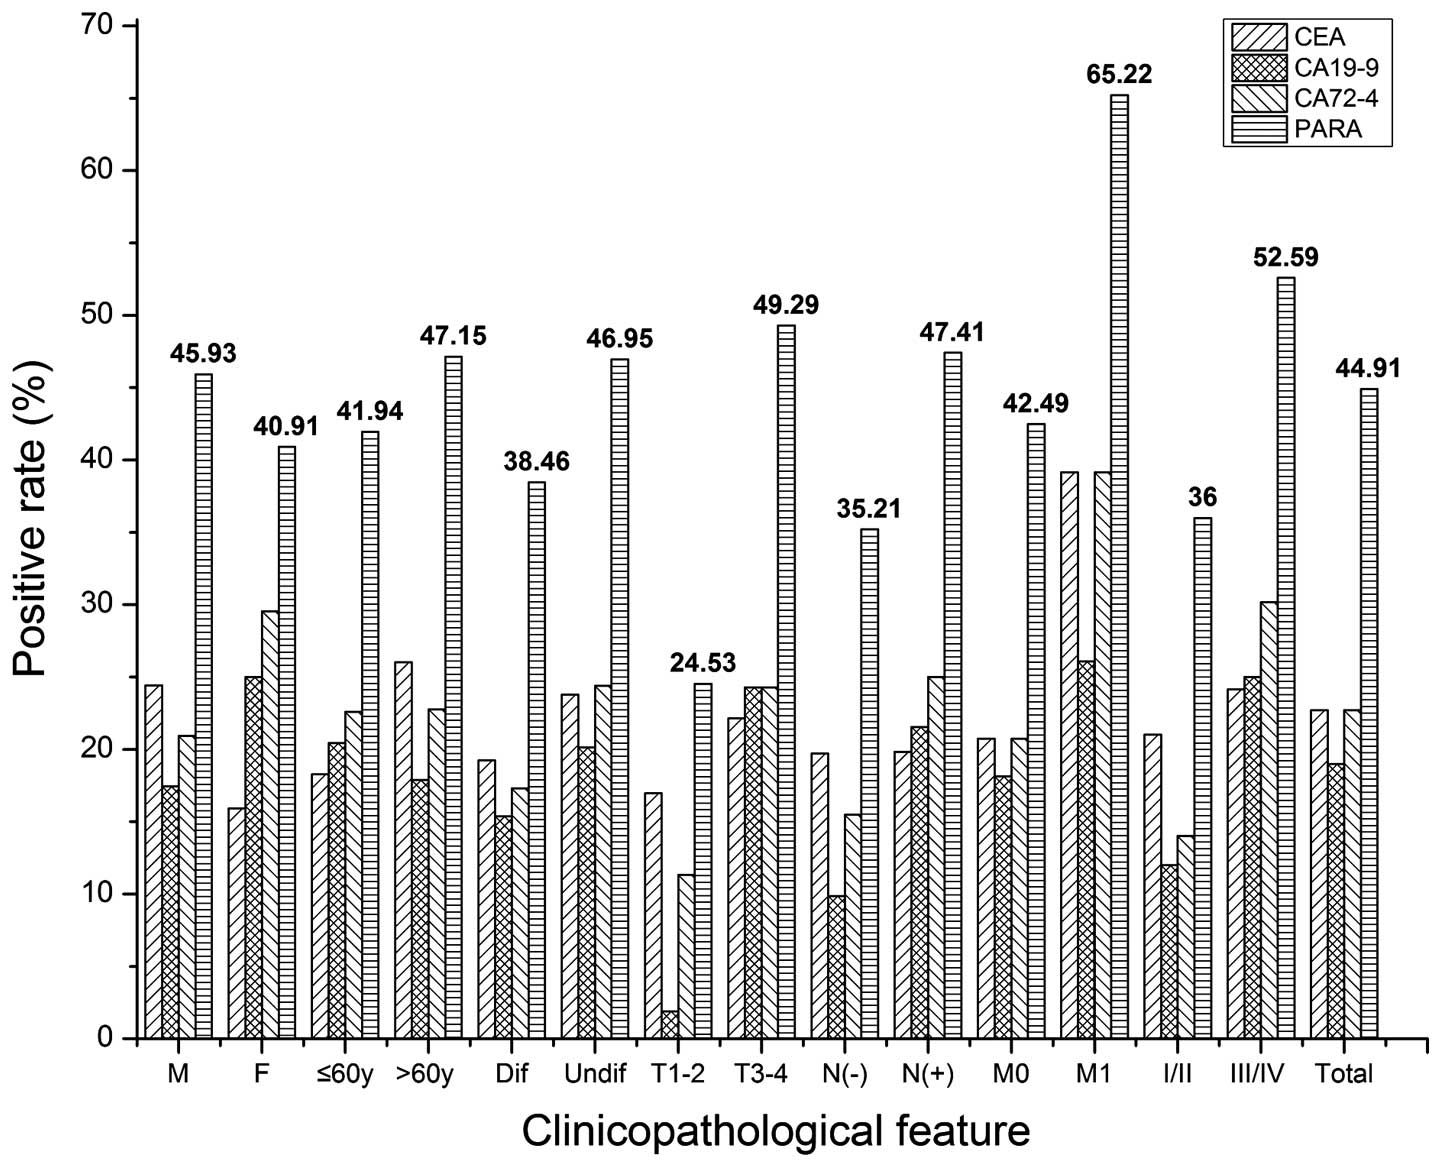 | Figure 1.The positive rate of CEA, CA19-9, and
CA72-4, and a parallel test of three tumor biomarkers in all
patients and in subgroups. M, male; F, female; y, years; Dif,
differentiated; Undif, undifferentiated; T, tumor stage; N, lymph
node stage; M; M stage; CEA, carcinoembryonic antigen; CA19-9,
carbohydrate antigen 19-9; CA72-4, carbohydrate antigen 72-4; PARA,
parallel test. |
As shown in Table I,
the positive rate of CEA, CA19-9 or CA72-4 did not differ
significantly in all 216 patients. In the subgroups, no significant
difference was identified in the positive rate of CEA, CA19-9 and
CA72-4, with the exception of the T1/2-stage patients
(χ2=6.810, P=0.033).
 | Table I.The differences among the positive
rates of CEA, CA19-9 and CA72-4 for different clinicopathological
features in patients with gastric carcinoma. |
Table I.
The differences among the positive
rates of CEA, CA19-9 and CA72-4 for different clinicopathological
features in patients with gastric carcinoma.
| Clinicopathological
feature | Total n | CEA n (%) | CA19-9 n (%) | CA72-4 n (%) | χ2 | P-value |
|---|
| Gender |
|
|
|
|
|
|
| Male | 172 | 42 (24.42) | 30 (17.44) | 36 (20.93) | 2.529 | 0.282 |
|
Female | 44 | 7 (15.91) | 11 (25.00) | 13 (29.55) | 2.361 | 0.307 |
|
χ2 |
| 1.447 | 1.302 | 1.483 |
|
|
|
P-value |
| 0.229 | 0.254 | 0.223 |
|
|
| Age (years) |
|
|
|
|
|
|
| ≤60 | 93 | 17 (18.28) | 19 (20.43) | 21 (22.58) | 0.529 | 0.768 |
|
>60 | 123 | 32 (26.02) | 22 (17.89) | 28 (22.76) | 2.383 | 0.304 |
|
χ2 |
| 1.807 | 0.223 | 0.001 |
|
|
|
P-value |
| 0.179 | 0.637 | 0.975 |
|
|
| Histology |
|
|
|
|
|
|
|
Differentiated | 52 | 10 (19.23) | 8 (15.38) | 9 (17.31) | 0.268 | 0.874 |
|
Undifferentiated | 164 | 39 (23.78) | 33 (20.12) | 40 (24.39) | 0.994 | 0.608 |
|
χ2 |
| 0.466 | 0.576 | 1.129 |
|
|
|
P-value |
| 0.495 | 0.448 | 0.288 |
|
|
| T stage |
|
|
|
|
|
|
|
T1–2 | 53 | 9 (16.98) | 1 (1.89) | 6 (11.32) | 6.810 | 0.033 |
|
T3–4 | 140 | 31 (22.14) | 34 (24.29) | 34 (24.39) | 0.238 | 0.888 |
|
χ2 |
| 0.623 | 12.992 | 3.933 |
|
|
|
P-value |
| 0.430 | 0.0003 | 0.047 |
|
|
| N
stage |
|
|
|
|
|
|
|
N(−) | 71 | 14 (19.72) | 7 (9.86) | 11 (15.94) | 2.721 | 0.257 |
|
N(+) | 116 | 23 (18.93) | 25 (21.55) | 29 (25.00) | 0.934 | 0.627 |
|
χ2 |
| 0.0003 | 4.245 | 2.367 |
|
|
|
P-value |
| 0.986 | 0.039 | 0.124 |
|
|
| M stage |
|
|
|
|
|
|
| M0 | 193 | 40 (20.73) | 35 (18.13) | 40 (20.73) | 0.543 | 0.762 |
| M1 | 23 | 9 (39.13) | 6 (26.09) | 9 (39.13) | 1.150 | 0.563 |
|
χ2 |
| 3.969 | 0.302 | 3.969 |
|
|
|
P-value |
| 0.046 | 0.583 | 0.046 |
|
|
| TNM
stagea |
|
|
|
|
|
|
|
I/II | 100 | 21 (21.00) | 12 (12.00) | 14 (14.00) | 3.381 | 0.185 |
|
III/IV | 116 | 28 (24.14) | 29 (25.00) | 35 (30.17) | 1.271 | 0.530 |
|
χ2 |
| 0.302 | 5.902 | 8.009 |
|
|
|
P-value |
| 0.583 | 0.015 | 0.005 |
|
|
| Total cases | 216 | 49 (22.69) | 41 (18.98) | 49 (22.69) | 1.172 | 0.557 |
The differences in the positive rates of CEA, CA19-9
and CA72-4 according to gender, age, histology, T stage, N stage, M
stage and TNM stage in each subgroup were analyzed using the
χ2 test. The positive rate of CEA in the M1 subgroup was
higher compared with that in the M0 subgroup. No differences in the
positive rate of CEA were identified on the basis of gender, age,
histology, T stage, N stage or the TNM stage. The positive rate of
CA19-9 in the T3/4, N(+) and TNM-III/IV stage subgroups was higher
compared with that in the T1/2, N(−) and TNM-I/II stage subgroups.
No differences in the positive rate of CA19-9 were identified
according to other clinicopathological classifications. The
positive rate of CA72-4 in the T3/4, M1 and TNM-III/IV stage
subgroups was higher compared with that in the T1/2, M0 and
TNM-I/II stage subgroups (Table
I).
The phi (f) correlation analysis demonstrated that
no significant correlation existed between the expression levels
(positive or not) of CEA and CA19-9 in all 216 patients. However, a
significant correlation did exist between the expression levels of
CEA and CA72-4, and between that of CA19-9 and CA72-4, in all
cases. In all the subgroups, no significant correlation was
identified between CEA and CA19-9. However, a significant
correlation was identified between the expression level of CEA and
CA72-4 in men, in patients aged >60 years, in patients
exhibiting an undifferentiated histology and in the M0 subgroup of
GC, although not in other subgroups. The majority of the f
correlations between the expression levels of CA19-9 and CA72-4
were significant in patients aged ≤60 years, and in those with
undifferentiated histology or N(+), M0 or TNM-III/IV stage cancer
(Table II).
| Table II.Correlation between the expression of
CEA, CA19-9 and CA72-4 in patients with gastric carcinoma with
respect to different clinicopathological features. |
Table II.
Correlation between the expression of
CEA, CA19-9 and CA72-4 in patients with gastric carcinoma with
respect to different clinicopathological features.
|
|
| CEA vs. CA19-9 | CEA vs. CA72-4 | CA19-9 vs.
CA72-4 |
|---|
|
|
|
|
|
|
|---|
| Clinical
feature | n | Phi coef | χ2 | P-value | Phi coef | χ2 | P-value | Phi coef | χ2 | P-value |
|---|
| Gender |
|
|
|
|
|
|
|
|
|
|
|
Male | 172 | −0.012 | 0.023 | 0.879 | 0.173 | 5.166 | 0.023 | 0.140 | 3.378 | 0.066 |
|
Female | 44 | 0.323 |
| 0.054a | 0.263 |
| 0.170a | 0.316 |
| 0.057a |
| Age |
|
|
|
|
|
|
|
|
|
|
| ≤60
years | 93 | 0.174 |
| 0.106a | 0.077 |
| 0.524a | 0.300 |
| 0.011a |
| >60
years | 123 | −0.035 | 0.151 | 0.698 | 0.253 | 7.848 | 0.005 | 0.101 | 1.249 | 0.264 |
| Histology |
|
|
|
|
|
|
|
|
|
|
|
Diff | 52 | 0.062 |
| 0.642a | 0.035 |
| 1.000a | 0.228 |
| 0.130a |
|
Undiff | 164 | 0.041 | 0.278 | 0.598 | 0.216 | 7.678 | 0.006 | 0.175 | 5.043 | 0.025 |
| T stage |
|
|
|
|
|
|
|
|
|
|
|
T1–2 | 53 | −0.063 | | 1.000a | 0.156 |
| 0.267a | 0.388 |
| 0.113a |
|
T3–4 | 140 | 0.059 | 0.488 | 0.485 | 0.139 | 2.715 | 0.099 | 0.145 | 2.960 | 0.085 |
| Tx | 23 | −0.071 |
| 1.000a | 0.270 |
| 0.383a | 0.132 |
| 0.643a |
| N stage |
|
|
|
|
|
|
|
|
|
|
|
N(−) | 71 | 0.074 |
| 0.618a | 0.179 |
| 0.209a | −0.011 |
| 1.000a |
|
N(+) | 116 | 0.002 |
| 1.000a | 0.162 | 3.055 | 0.081 | 0.278 | 8.991 | 0.003 |
| Nx | 29 | 0.042 |
| 1.000a | 0.193 |
| 0.422 | 0.033 |
| 1.000a |
| M stage |
|
|
|
|
|
|
|
|
|
|
| M0 | 193 | 0.058 | 0.648 | 0.421 | 0.149 | 4.170 | 0.039 | 0.109 | 7.014 | 0.008 |
| M1 | 23 | −0.071 |
| 1.000a | 0.270 |
| 0.383a | 0.132 |
| 0.643a |
| TNM stage |
|
|
|
|
|
|
|
|
|
|
|
I–II | 100 | 0.036 |
| 0.712a | 0.217 |
| 0.069a | 0.028 |
| 0.674a |
|
III–IV | 116 | 0.047 | 0.251 | 0.616 | 0.156 | 2.819 | 0.093 | 0.228 | 6.015 | 0.014 |
| Total cases | 216 | 0.048 | 0.496 | 0.482 | 0.182 | 7.133 | 0.008 | 0.189 | 7.703 | 0.006 |
Differences and correlation of the
serum levels of CEA, CA19-9 and CA72-4
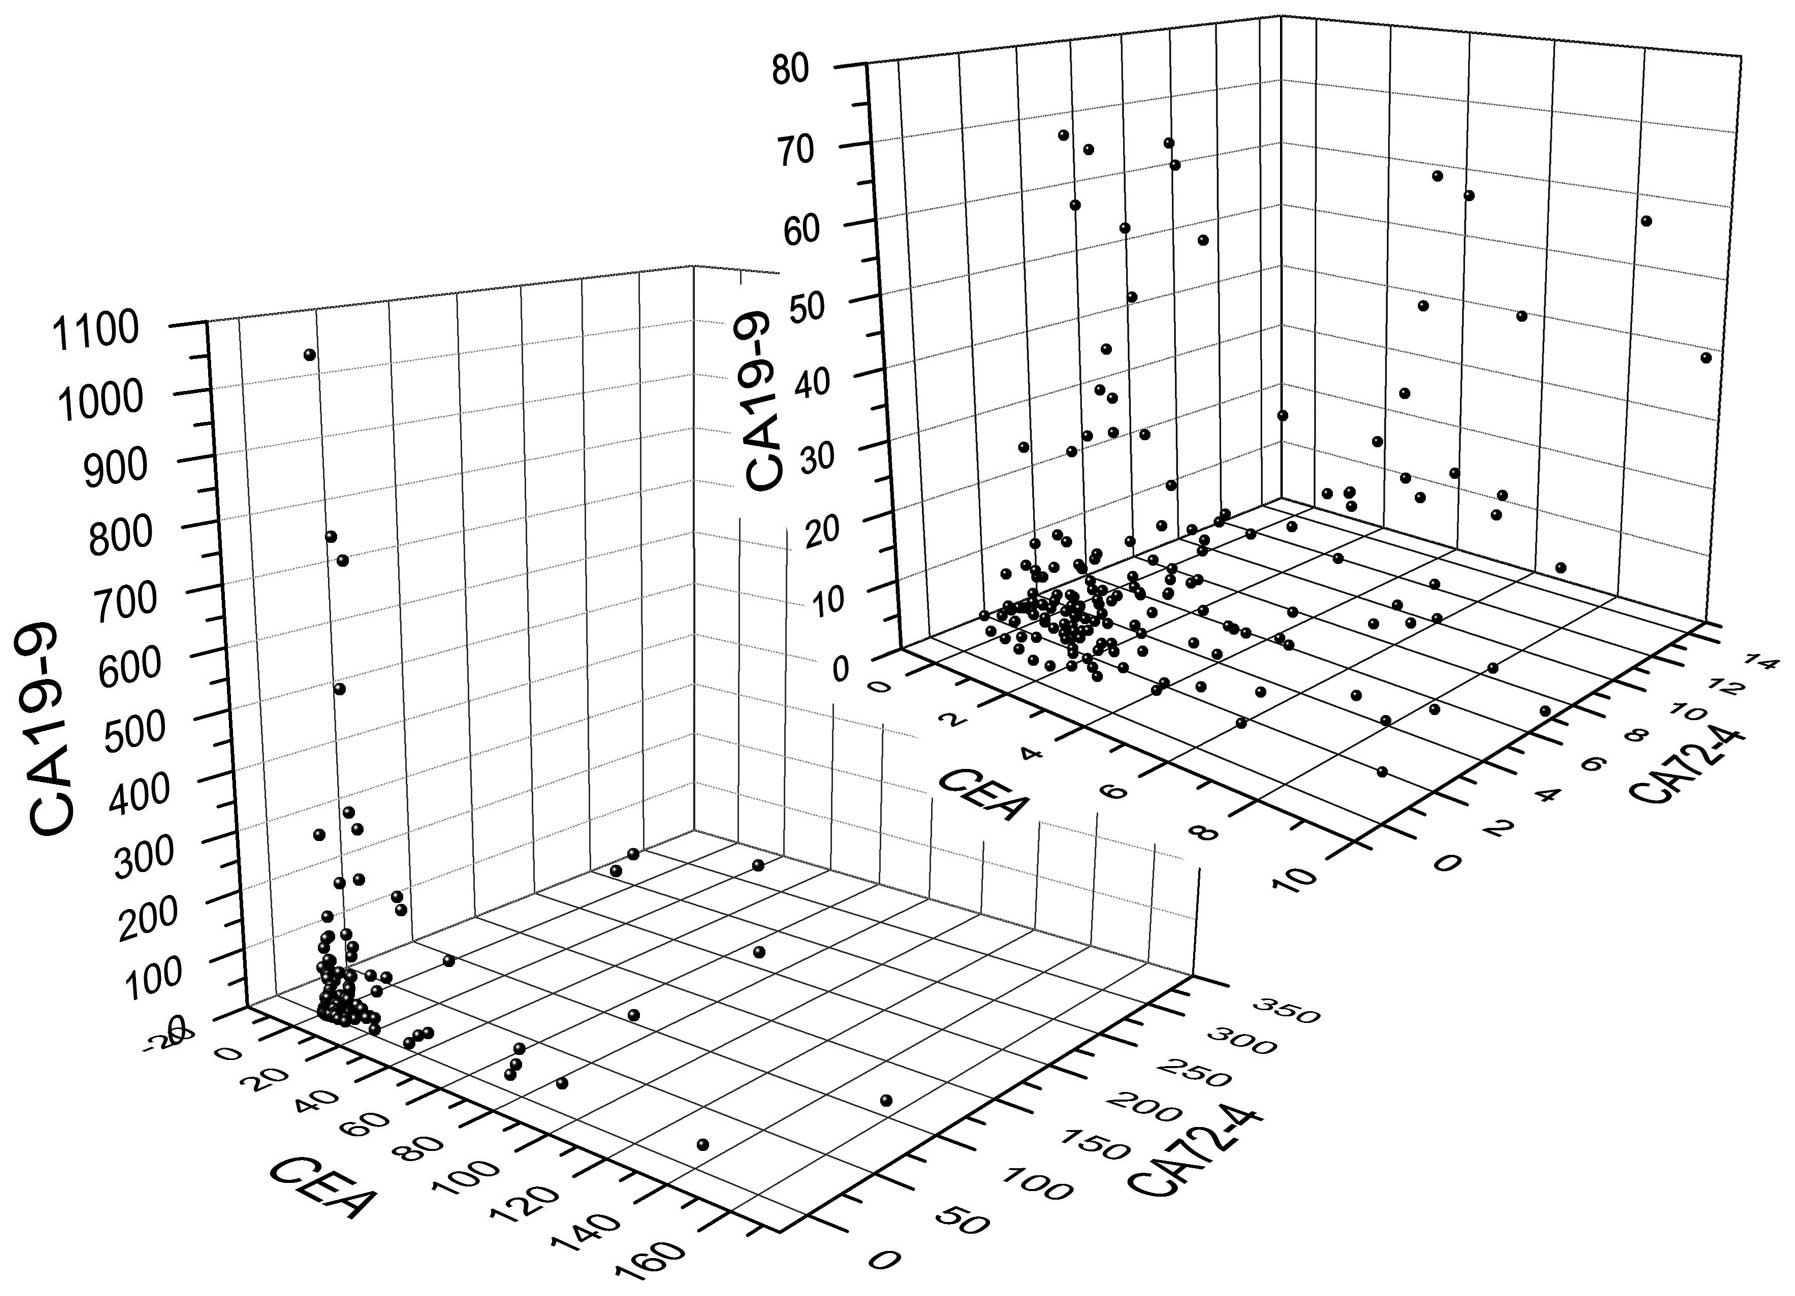
The median serum levels of CEA, CA19-9 and CA72-4
were 2.230 (range, 0.2–152.7) ng/ml, 7.50 (range, 0–1057.9) U/ml
and 2.51 (range, 0.503–300.0) U/ml, respectively. The
three-dimensional scatter plot is shown in Fig. 2.
The Wilcoxon two-sample test revealed that the serum
levels of CEA differed significantly, according to the gender. The
serum level of CEA was higher in women compared with men (2.465 vs.
1.175 ng/ml). No significant differences were identified in the
serum level of CEA according to age, histology, or the T, N, M or
TNM stages of cancer. The serum levels of CA19-9 in the T3/4 and
the TNM-III/IV stages were significantly higher compared with those
in the T1/2 and the TNM-I/II stages, respectively. The serum level
of CA72-4 in the T3/4, M1 and TNM-III/IV stage subgroups was
significantly higher than in the T1/2, M0 and TNM-I/II stage
subgroups. No significant differences were identified in the serum
level of CA19-9 and CA72-4 in the other clinicopathological
subgroups. These results are shown in Table III.
| Table III.Comparison of the serum levels of
CEA, CA19-9 and CA72-4 with respect to different
clinicopathological features in patients with gastric
carcinoma. |
Table III.
Comparison of the serum levels of
CEA, CA19-9 and CA72-4 with respect to different
clinicopathological features in patients with gastric
carcinoma.
|
|
| CEA | CA19-9 | CA72-4 |
|---|
|
|
|
|
|
|
|---|
| ClinPath
feature | n | Median | Z | P-value | Median | Z | P-value | Median | Z | P-value |
|---|
| Gender |
|
| −4.005 | <0.001 |
| 0.768 | 0.443 |
| 0.450 | 0.653 |
|
Male | 172 | 2.465 |
|
| 7.450 |
|
| 2.510 |
|
|
|
Female | 44 | 1.175 |
|
| 12.000 |
|
| 2.575 |
|
|
| Age (years) |
|
| −0.440 | 0.660 |
| 0.459 | 0.647 |
| 0.001 | 0.999 |
|
≤60 | 93 | 2.310 |
|
| 7.500 |
|
| 2.820 |
|
|
|
>60 | 123 | 2.230 |
|
| 7.500 |
|
| 2.390 |
|
|
| Histology |
|
| −0.088 | 0.930 |
| −0.693 | 0.489 |
| −1.483 | 0.138 |
|
Diff | 52 | 2.270 |
|
| 7.450 |
|
| 1.970 |
|
|
|
Undiff | 164 | 2.220 |
|
| 7.700 |
|
| 2.810 |
|
|
| T stage |
|
| −0.289 | 0.773 |
| −2.376 | 0.018 |
| −3.241 | 0.001 |
|
T1–2 | 53 | 2.230 |
|
| 6.600 |
|
| 1.530 |
|
|
|
T3–4 | 140 | 2.170 |
|
| 9.700 |
|
| 2.745 |
|
|
| N stage |
|
| 0.860 | 0.390 |
| −1.607 | 0.108 |
| −1.868 | 0.062 |
|
N(−) | 71 | 2.230 |
|
| 6.600 |
|
| 1.880 |
|
|
|
N(+) | 116 | 2.075 |
|
| 8.775 |
|
| 2.685 |
|
|
| M stage |
|
| 1.698 | 0.090 |
| 0.579 | 0.563 |
| 2.072 | 0.038 |
| M0 | 193 | 2.210 |
|
| 7.400 |
|
| 2.320 |
|
|
| M1 | 23 | 4.130 |
|
| 11.200 |
|
| 6.290 |
|
|
| TNM stage |
|
| −0.011 | 0.991 |
| −2.721 | 0.007 |
| −3.883 | 0.0001 |
|
I/II | 100 | 2.370 |
|
| 6.600 |
|
| 1.795 |
|
|
|
III/IV | 116 | 2.115 |
|
| 11.000 |
|
| 3.155 |
|
|
Spearman's correlation analysis showed that there
were significant correlations between the serum levels of CEA and
CA19-9, of CEA and CA72-4, and of CA19-9 and CA72-4 in all 216
patients (Table IV). Regarding the
subgroups, there were significant correlations between the serum
levels of CEA and CA19-9 in men, women, patients aged >60 years,
and those with differentiated tumors, undifferentiated tumors, and
T3/4, N(+), M0, TNM-I/II or TNM-III/IV stage cancer, but not in
patients aged ≤60 years and those with T1/2, N(−) or M1 stage
cancer. In the majority of subgroups, there were significant
correlations between the serum levels of CEA and CA72-4, except in
the cases of T1/2, N(−) and M1 stage cancer. A significant
correlation was identified between the serum levels of CA19-9 and
CA72-4 in women patients, those aged ≤60 years, those with
undifferentiated tumors and those with N(+), M0 and TNM-III/IV
stage cancer, although not in the other subgroups.
| Table IV.The correlation between serum levels
of CEA, CA19-9, CA72-4 in patients with gastric carcinoma in
different clinicopathological features. |
Table IV.
The correlation between serum levels
of CEA, CA19-9, CA72-4 in patients with gastric carcinoma in
different clinicopathological features.
|
|
| CEA vs. CA19-9 | CEA vs. CA72-4 | CA19-9 vs.
CA72-4 |
|---|
|
|
|
|
|
|
|---|
| ClinPath
feature | N | Coef | P-value | Coef | P-value | Coef | P-value |
|---|
| Gender |
|
|
|
|
|
|
|
|
Male | 172 | 0.217 | 0.004 | 0.266 | 0.000 | 0.065 | 0.399 |
|
Female | 44 | 0.376 | 0.012 | 0.330 | 0.029 | 0.465 | 0.002 |
| Age |
|
|
|
|
|
|
|
| ≤60
years | 93 | 0.186 | 0.075 | 0.238 | 0.022 | 0.299 | 0.004 |
| >60
years | 123 | 0.263 | 0.003 | 0.313 | 0.000 | 0.060 | 0.513 |
| Histology |
|
|
|
|
|
|
|
|
Differ | 52 | 0.285 | 0.041 | 0.342 | 0.013 | 0.018 | 0.901 |
|
Undiffer | 164 | 0.213 | 0.006 | 0.266 | 0.001 | 0.211 | 0.007 |
| T-stage |
|
|
|
|
|
|
|
|
T1–2 | 53 | 0.219 | 0.116 | 0.153 | 0.274 | −0.020 | 0.889 |
|
T3–4 | 140 | 0.255 | 0.002 | 0.294 | 0.000 | 0.162 | 0.056 |
| N-stage |
|
|
|
|
|
|
|
|
N(−) | 71 | 0.207 | 0.083 | 0.112 | 0.354 | −0.057 | 0.640 |
|
N(+) | 116 | 0.267 | 0.004 | 0.347 | 0.000 | 0.300 | 0.001 |
| M-stage |
|
|
|
|
|
|
|
| M0 | 193 | 0.251 | 0.000 | 0.255 | 0.000 | 0.174 | 0.015 |
| M1 | 23 | 0.022 | 0.920 | 0.261 | 0.229 | 0.089 | 0.688 |
| TNM-stage |
|
|
|
|
|
|
|
|
I/II | 100 | 0.211 | 0.036 | 0.297 | 0.002 | −0.046 | 0.646 |
|
III/IV | 116 | 0.234 | 0.011 | 0.288 | 0.001 | 0.239 | 0.010 |
| Total cases | 216 | 0.231 | 0.001 | −0.271 | <.0001 | 0.167 | 0.014 |
Discussion
CEA was originally described by Gold and Freedman in
1965 (18); it is a glycoprotein that
belongs to the immunoglobulin superfamily. CEA is used
predominantly for the management of colorectal carcinoma, and its
levels may be increased in gastric, lung, pancreatic and breast
carcinoma. CA19-9 was first isolated by Koprowski et al
(19) in 1979; it is a
high-molecular-mass mucin glycoprotein complex that is associated
with the Lewis A blood group. CA19-9 is used primarily as a tumor
marker for pancreatic cancer, although it has been used as a tumor
marker in other gastrointestinal cancers, including colorectal and
gastric carcinoma, and gallbladder cancer. It may also be increased
in several benign diseases, including pancreatitis and
cholelithiasis. CA72-4 was first described by Colcher et al
(20) in 1981: It is a glycoprotein
with a molecular mass >1000 kDa and is associated with the
sialylated Lewis Tn group. It is a tumor marker for numerous
cancers, including breast, ovarian, colorectal and pancreatic
cancer, and it has good specificity for GC.
No significant differences were identified in the
positive rate of CEA, CA19-9 and CA72-4 in all 216 patients, and
almost all the subgroups, in the present study. Only ~20% of all
the patients with GC exhibited positive rates of CEA, CA19-9 and
CA72-4. The results in the present study were similar to those
previously obtained: In a systematic review (9) of 187 publications with data for CEA and
CA19-9, and 19 publications with data for CEA, CA72-4 and CA19-9,
the positive rates were 21.1% for CEA, 27.8% for CA19-9 and 30.0%
for CA72-4. In a study of 149 Chinese patients with GC, He et
al (10) demonstrated that the
positive rates for CEA and CA19-9 were 17.4 and 20.8%,
respectively, which were not significantly different. In a
subsequent study of Chinese patients with GC, the preoperative
serum positive rate of CEA was 24.0%, which was similar to the
serum positive rate of CA19-9 (18.9%) (21). Mittal et al (22) demonstrated that the positive rate of
CEA was lower compared with that of CA19-9, although no significant
differences were identified between the positive rate of CEA and
CA72-4, or of CA19-9 and CA72-4. In previous studies (6,23), the
positive rate of CEA was determined to be lower compared with that
of CA19-9 and CA72-4.
The positive rate of the parallel test for CEA,
CA19-9 and CA72-4 was significantly higher compared with the
individual positive rates for CEA, CA19-9 and CA72-4 in all 216
patients. In the subgroups, the majority of the parallel test
positive rates were also higher compared with the individual CEA,
CA19-9, and CA72-4 positive rates.
In the gender, age and histological subgroups, no
significant differences were identified in the positive rate of
CEA, CA19-9 and CA72-4. The serum levels of CEA, CA19-9 and CA72-4
did not differ significantly on the basis of gender, age or
histological classification, with the exception of the serum level
of CEA, which differed between the genders. The results of the
present study were supported by those of previous studies. No
significant differences were identified in the positive rate of
CEA, CA19-9 and CA72-4 between men and women, between patients aged
<60 and ≥60 years, or among the various histological types
(24). Ucar et al (25) demonstrated that no significant
differences existed among the positive rates of CEA, CA19-9 and
CA72-4, according to gender or the histological type (intestinal or
diffuse). Choi et al (8)
demonstrated that the positive rate of CA19-9 was not correlated
with gender and age, although it was correlated with histological
type. Yajima et al (26)
identified that the serum levels of CA19-9 did not correlate with
gender, age or histological type.
The positive rate of CEA did not increase in
association with the progression of GC. The significant difference
of the positive rate of CEA was presented only in the M subgroup.
No significant differences were identified in the positive rates of
CEA according to the T, N or TNM stages of cancer in the present
study. These results are supported by previous studies: Cidon et
al (23) demonstrated that the
positive rate of CEA in early-stage GC did not differ from that in
advanced-stage GC. Ucar et al (25) identified that the positive rate did
not correlate with the TNM stage of cancer, serosal involvement or
the N stage, although it was correlated with liver involvement.
However, a number of previous studies indicated that the positive
rate of CEA does increase with tumor progression. In a systematic
review, Shimada et al (9)
revealed that the positive rate of serum CEA was significantly
correlated with the TNM stage. Tian et al (27) demonstrated that there were significant
differences in the positive rate of serum CEA between the T1/2 and
T3/4 stages, and between cases with lymph node metastasis and those
with no lymph node metastasis.
The positive rate of CA19-9 increased with the
progression of GC. The positive rate of CA19-9 in the T3/4, N(+)
and TNM-III/IV subgroups was higher compared with that in the T1/2,
N(−) and TNM-I/II subgroups. Shimada et al (9) presented similar results on the basis of
a systematic review, which identified that the positive rate of
CA19-9 increased with the TNM stage. These results indicated that
CA19-9 is an improved marker for GC prognosis (28). Lee et al (11) identified that the positivity of CA19-9
increased significantly with GC progression, similarly to the
results in the present study. The positivity of CA19-9 was 4.0% in
stage I, 6.8% in stage II, 13.9% in stage III and 24.1% in stage IV
GC. A previous study (21) revealed
that the positive rate of CA19-9 was not correlated with the T, M
or TNM-stage GC cases. Another study demonstrated that there were
significant increases in the level of CA19-9 in patients with GC,
with direct invasion and extensive peritoneal seeding (29).
The positive rate of CA72-4 increased in accordance
with the progression of GC. The positive rate of CA72-4 in the
T3/4, M1 and TNM-III/IV subgroups was higher compared with that in
the T1/2, M0 and TNM-I/II subgroups. A systematic review by Shimada
et al (9) indicated that the
positive rate of CA72-4 increased with the TNM stage. The
specificity of CA72-4 for GC is higher compared with that of CEA
and CA19-9. A meta-analysis of Chinese patients with GC (30) demonstrated that CA72-4 was selected as
the preferable single test, with the highest accumulated accuracy
among tumor markers, including CA72-4, CA12-5, CA15-3, CA19-9,
CA24-2 and CEA. The CA72-4 was identified as a tumor marker for
late-stage GC in previous studies. Emoto et al (31) determined that the sensitivity of
CA72-4 for the peritoneal metastasis of GC was 45%, which was
higher compared with that of CEA and CA19-9. Patients with ovarian
metastasis exhibited significantly higher levels of CA72-4
(31).
The serum levels of CA19-9 and CA72-4 increased with
tumor progression, although the serum level of CEA did not. CEA was
revealed not to be higher in the T3/4, N(+), M1 and TNM-III/IV
stages, compared with the T1/2, N(−), M0 and TNM-I/II stages. The
serum level of CA19-9 was higher in the T3/4 and TNM-III/IV stages
compared with the T1/2 and the TNM-I/II stages. The serum level of
CA72-4 was higher in the T3/4, M1 and TNM-III/IV stages compared
with the T1/2, M0 and TNM-I/II stages. Subsequently to the
aforementioned results, the serum level of CA19-9 and CA72-4 in the
TNM-III/IV stage was higher compared with the TNM-I/II stage,
although there were conflicting results for the difference in the
serum level of CA19-9 and CA72-4 in the T, N and M stages. Han
et al (29) identified that
the mean values of CEA did not differ significantly among the
serosa-unexposed, serosa-exposed, direct invasion and localized
peritoneal seeding groups. The mean CEA level was higher in
patients with extensive peritoneal seeding. Yajima et al
(26) identified that the patients
with higher serum levels of CA19-9 presented with advanced T stage,
N stage and TNM stage cancer. However, Lee et al (11) revealed that there was a tendency
towards increasing CEA levels with advancing stages of cancer, as
well as increases in CA19-9 and CA72-4.
In all the patients, the f correlation analysis
indicated that there was significant correlation between the
expression of CEA and CA72-4, and between CA72-4 and CA19-9. The
correlation coefficients between CEA and CA72-4 and between CA72-4
and CA19-9 was <0.2, indicating a weak correlation. No
significant correlation was identified between CEA and CA19-9.
However, in certain of the subgroups, a significant correlation was
identified between the expression of CEA and CA72-4, and between
CA19-9 and CA72-4. The results in the present study revealed that
CEA, CA19-9 and CA72-4 did not exhibit similar trends in
positivity. Statistical analyses revealed that different patients
presented with different biomarkers, even if the positive rate was
determined to be similar among the three biomarkers.
In all 216 patients, a significant correlation was
identified between the serum levels of CEA and CA19-9, of CEA and
CA72-4, and of CA19-9 and CA72-4. In the T1/2 stage subgroup, no
significant correlations between the serum levels of CEA and
CA19-9, of CEA and CA72-4, and of CA19-9 and CA72-4 were
identified. In the T3/4 stage subgroup, a significant correlation
was identified between the serum level of CEA and CA19-9, and also
between that of CEA and CA72-4, and an almost significant
correlation existed between CA19-9 and CA72-4 (P=0.056). In the N
stage subgroup, a significant correlation was identified between
the serum levels of CEA and CA19-9, of CEA and CA72-4, and of
CA19-9 and CA72-4 in N(+) stage patients, although not in N(−)
stage patients. These results indicated that a significant
correlation was identified between the serum levels of CEA, CA19-9
and CA72-4 in the late T and N stages, although not in the early T
and N stages. However, the opposite was shown for the M stage. A
significant correlation was identified between the serum levels of
CEA, CA19-9 and CA72-4 in the M0 stage, although not in the M1
stage. There have been few studies published on the correlation
among biomarkers. Han et al (29) obtained different results: Significant
correlations between the serum levels of CEA and CA19-9 were
identified in their laboratory for most patients, including the
serosa-unexposed group (although not the serosa-exposed group), and
patients with direct invasion, localized peritoneal seeding and
extensive peritoneal seeding.
In conclusion, the present study identified only a
weak correlation between the positive rates of CEA and CA72-4, and
of CA19-9 and CA72-4, and no correlation was identified between the
positive rate of CEA and CA19-9 in all the patients with GC, even
if there was a marked correlation between the serum levels of CEA
and CA19-9, CA19-9 and CA72-4, and CA19-9 and CA72-4. In addition,
the positive rate and serum level of CEA did not increase with
tumor progression, although the positive rate and levels of CA19-9
and CA72-4 did increase with tumor progression. These results
indicated that different biomarkers presented positive in different
cases and during different stages of GC. There was less
co-presentation of CEA, CA19-9 and CA72-4 in patients with GC.
Therefore, the combined value of the tests, particularly of CA19-9
and CA72-4, is complementary. The sensitivity of the three
biomarkers in combination is greater than that of any of the
biomarkers taken in isolation.
Acknowledgements
We would like to thank all members of the staff in
the Department of Gastrointestinal Surgery, Department of Pathology
and the Medical Record Department for their support in data
accumulation.
References
|
1
|
Torre LA, Bray F, Siegel RL, Ferlay J,
Lortet-Tieulent J and Jemal A: Global cancer statistics, 2012. CA
Cancer J Clin. 65:87–108. 2015. View Article : Google Scholar : PubMed/NCBI
|
|
2
|
Park HJ, Ahn JY, Jung HY, Lim H, Lee JH,
Choi KS, do Kim H, Choi KD, Song HJ, Lee GH and Kim JH: Clinical
characteristics and outcomes for gastric cancer patients aged 18-30
years. Gastric Cancer. 17:649–660. 2014. View Article : Google Scholar : PubMed/NCBI
|
|
3
|
Nam DH, Lee YK, Park JC, Lee H, Shin SK,
Lee SK, Lee YC, Cheong JH, Hyung WJ, Noh SH and Kim CB: Prognostic
value of early postoperative tumor marker response in gastric
cancer. Ann Surg Oncol. 20:3905–3911. 2013. View Article : Google Scholar : PubMed/NCBI
|
|
4
|
Mohri Y, Tanaka K, Ohi M, Saigusa S,
Yasuda H, Toiyama Y, Araki T, Inoue Y and Kusunoki M:
Identification of prognostic factors and surgical indications for
metastatic gastric cancer. BMC Cancer. 14:4092014. View Article : Google Scholar : PubMed/NCBI
|
|
5
|
Kwon OK, Yu W and Chung H: Prognostic
value of postoperative CA19-9 normalization in patients with
advanced gastric cancer. Hepatogastroenterology. 60:240–243.
2013.PubMed/NCBI
|
|
6
|
Kim DH, Oh SJ, Oh CA, Choi MG, Noh JH,
Sohn TS, Bae JM and Kim S: The relationships between perioperative
CEA, CA 19-9, and CA 72-4 and recurrence in gastric cancer patients
after curative radical gastrectomy. J Surg Oncol. 104:585–591.
2011. View Article : Google Scholar : PubMed/NCBI
|
|
7
|
Jo JC, Ryu MH, Koo DH, Ryoo BY, Kim HJ,
Kim TW, Choi KD, Lee GH, Jung HY, Yook JH, et al: Serum CA 19-9 as
a prognostic factor in patients with metastatic gastric cancer.
Asia Pac J Clin Oncol. 9:324–330. 2013. View Article : Google Scholar : PubMed/NCBI
|
|
8
|
Choi AR, Park JC, Kim JH, Shin SK, Lee SK,
Lee YC and Chung JB: High level of preoperative carbohydrate
antigen 19-9 is a poor survival predictor in gastric cancer. World
J Gastroenterol. 19:5302–5308. 2013. View Article : Google Scholar : PubMed/NCBI
|
|
9
|
Shimada H, Noie T, Ohashi M, Oba K and
Takahashi Y: Clinical significance of serum tumor markers for
gastric cancer, A systematic review of literature by the task force
of the Japanese gastric cancer association. Gastric Cancer.
17:26–33. 2014. View Article : Google Scholar : PubMed/NCBI
|
|
10
|
He CZ, Zhang KH, Li Q, Liu XH, Hong Y and
Lv NH: Combined use of AFP, CEA, CA125 and CAl9-9 improves the
sensitivity for the diagnosis of gastric cancer. BMC Gastroenterol.
13:872013. View Article : Google Scholar : PubMed/NCBI
|
|
11
|
Lee JC, Lee SY, Kim CY and Yang DH:
Clinical utility of tumor marker cutoff ratio and a combination
scoring system of preoperative carcinoembryonic antigen,
carbohydrate antigen 19-9, carbohydrate antigen 72-4 levels in
gastric cancer. J Korean Surg Soc. 85:283–289. 2013. View Article : Google Scholar : PubMed/NCBI
|
|
12
|
Li F, Li S, Wei L, Liang X, Zhang H and
Liu J: The correlation between pre-operative serum tumor markers
and lymph node metastasis in gastric cancer patients undergoing
curative treatment. Biomarkers. 18:632–637. 2013. View Article : Google Scholar : PubMed/NCBI
|
|
13
|
Yang AP, Liu J, Lei HY, Zhang QW, Zhao L
and Yang GH: CA72-4 combined with CEA, CA125 and CAl9-9 improves
the sensitivity for the early diagnosis of gastric cancer. Clin
Chim Acta. 437:183–186. 2014. View Article : Google Scholar : PubMed/NCBI
|
|
14
|
Bagaria B, Sood S, Sharma R and Lalwani S:
Comparative study of CEA and CA19-9 in esophageal, gastric and
colon cancers individually and in combination (ROC curve analysis).
Cancer Biol Med. 10:148–157. 2013.PubMed/NCBI
|
|
15
|
Ychou M, Duffour J, Kramar A, Gourgou S
and Grenier J: Clinical significance and prognostic value of CA72-4
compared with CEA and CA19-9 in patients with gastric cancer. Dis
Markers. 16:105–110. 2000. View Article : Google Scholar : PubMed/NCBI
|
|
16
|
Japanese Gastric Cancer Association:
Japanese classification of gastric carcinoma: 3rd English edition.
Gastric Cancer. 14:101–112. 2011. View Article : Google Scholar : PubMed/NCBI
|
|
17
|
Edge SB, Byrd DR, Compton CC, Fritz AG,
Greene FL and Trotti A: AJCC Cancer Staging Handbook. New York:
Springer. 2010.
|
|
18
|
Gold P and Freedman SO: Demonstration of
tumor-specific antigens in human colonic carcinomata by
immunological tolerance and absorption techniques. J Exp Med.
121:439–462. 1965. View Article : Google Scholar : PubMed/NCBI
|
|
19
|
Koprowski H, Steplewski Z, Mitchell K,
Herlyn M, Herlyn D and Fuhrer P: Colorectal carcinoma antigens
detected by hybridoma antibodies. Somatic Cell Genet. 5:957–971.
1979. View Article : Google Scholar : PubMed/NCBI
|
|
20
|
Colcher D, Hand PH, Nuti M and Schlom J: A
spectrum of monoclonal antibodies reactive with human mammary tumor
cells. Proc Natl Acad Sci USA. 78:3199–3203. 1981. View Article : Google Scholar : PubMed/NCBI
|
|
21
|
Huang ZB, Zhou X, Xu J, Du YP, Zhu W, Wang
J, Shu YQ and Liu P: Prognostic value of preoperative serum tumor
markers in gastric cancer. World J Clin Oncol. 5:170–176. 2014.
View Article : Google Scholar : PubMed/NCBI
|
|
22
|
Mittal A, Gupta SP, Jha DK, Sathian B and
Poudel B: Impact of various tumor markers in prognosis of gastric
cancer. Histopathology. Asian Pac J Cancer Prev. 14:1965–1967.
2013. View Article : Google Scholar : PubMed/NCBI
|
|
23
|
Cidón EU and Bustamante R: Gastric cancer:
Tumor markers as predictive factors for preoperative staging. J
Gastrointest Cancer. 42:127–130. 2011. View Article : Google Scholar : PubMed/NCBI
|
|
24
|
Liu X, Cai H and Wang Y: Prognostic
significance of tumour markers in Chinese patients with gastric
cancer. ANZ J Surg. 84:448–453. 2014. View Article : Google Scholar : PubMed/NCBI
|
|
25
|
Ucar E, Semerci E, Ustun H, Yetim T,
Huzmeli C and Gullu M: Prognostic value of preoperative CEA, CA
19-9, CA 72-4, and AFP levels in gastric cancer. Adv Ther.
25:1075–1084. 2008. View Article : Google Scholar : PubMed/NCBI
|
|
26
|
Yajima H, Omura N, Matai K, Mitsumori N,
Yoshida K and Yanaga K: Clinicopathological features of
CA19-9-producing gastric cancer. Hepatogastroenterology.
61:221–225. 2014.PubMed/NCBI
|
|
27
|
Tian SB, Yu JC, Kang WM, Ma ZQ, Ye X, Cao
ZJ and Yan C: Combined detection of CEA, CA 19-9, CA 242 and CA 50
in the diagnosis and prognosis of resectable gastric cancer. Asian
Pac J Cancer Prev. 15:6295–6300. 2014. View Article : Google Scholar : PubMed/NCBI
|
|
28
|
Sisik A, Kaya M, Bas G, Basak F and
Alimoglu O: CEA and CA 19-9 are still valuable markers for the
prognosis of colorectal and gastric cancer patients. Asian Pac J
Cancer Prev. 14:4289–4294. 2013. View Article : Google Scholar : PubMed/NCBI
|
|
29
|
Han ES, Lee HH, Lee JS, Song KY, Park CH
and Jeon HM: At which stage of gastric cancer progression do levels
of carcinoembryonic antigen and carbohydrate antigen 19-9 increase?
Application in advanced gastric cancer treatment. J Gastric Cancer.
14:123–128. 2014. View Article : Google Scholar : PubMed/NCBI
|
|
30
|
Chen XZ, Zhang WK, Yang K, Wang LL, Liu J,
Wang L, Hu JK, Zhang B, Chen ZX, Chen JP, et al: Correlation
between serum CA724 and gastric cancer: Multiple analyses based on
Chinese population. Mol Biol Rep. 39:9031–9039. 2012. View Article : Google Scholar : PubMed/NCBI
|
|
31
|
Emoto S, Ishigami H, Yamashita H,
Yamaguchi H, Kaisaki S and Kitayama J: Clinical significance of
CA125 and CA72-4 in gastric cancer with peritoneal dissemination.
Gastric Cancer. 15:154–161. 2012. View Article : Google Scholar : PubMed/NCBI
|