Introduction
Nasopharyngeal carcinoma (NPC) is a group of
malignant epithelial tumors with different etiopathogeneses and a
broad range of histopathological appearances (1). Populations with elevated rates include
the natives of Southeast Asia, the natives of the Artic region, and
the Arabs of North Africa and parts of the Middle East (2). The well-known excess risk for NPC in
North Africa is confirmed, with rates reaching the level of 5.4 in
men and 1.9 in women, which are 10-times higher compared with that
in Europe (3).
Epstein-Barr virus (EBV) is a ubiquitous, gamma-1
lymphotropic virus linked to NPC (4). Decoy receptor (DcR) 3 was overexpressed
in NPC and its higher expression scores were observed in metastatic
NPC; suggesting that DcR3 may enhance cell metastatic potential
(5).
EBV-infected cells secrete EBV-encoded small RNAs,
leading to the induction of type-I interferon and inflammatory
cytokines, and subsequent immune activation (6). EBV latent membrane protein (LMP) 1 is
an oncogenic protein (7) capable of
upregulating IL-1α and IL-1β secretions from epithelial cells and
is positively modulated by TNF-α (8). LMP1-expressing cells exhibited
increased rates of haptotactic migration. Extracellular-regulated
and mitogen-activated protein kinases (MAPK) may contribute to the
oncogenicity of LMP1 through its ability to promote cell motility
and enhance the invasive properties of epithelial cells (7).
The present prospective study aimed to determine the
predictability of pre-treatment serum levels of IL-1β, IL-6 and
TNF-α for the outcome of patients with NPC assigned for
chemoradiotherapy.
Patients and methods
Patients
The current multi-center study was performed between
May 2011 and December 2015, including 2-year follow-ups. The study
protocol was approved by the Local Ethics Committee of Benha
University, October 6 University and Tanta University. All enrolled
patients or their nearest relatives provided written informed
consent agreeing to the methodology for investigations and
modalities of therapy prior to enrolment. The study included 35
patients with biopsy confirmed NPC. A total of 10 healthy
volunteers were selected from those attending Benha University
Blood Bank for blood donation after passing examination protocol
for blood donation for being serologically negative for HCV, HBsAg
and HIV, and with no history of previous infectious mononucleosis,
no otorhinolaryngology diseases, recent infection or surgery within
the last 3 months as a control for results of laboratory
investigations.
Otorhinolaryngological evaluation
Patients were subjected to an assessment of full
history, clinical examination with respect to nasopharyngeal
region, nasopharyngoscopy and computed tomography and/or magnetic
resonance imaging (MRI) to determine the full extent of the local
and nodal spread of the tumor. The patients were clinically
categorized using tumor-node-metastasis staging, according to the
American Joint Committee for Cancer (AJCC) staging (9).
Nasopharyngoscopy was performed under general
anesthesia to allow proper visualization, lesion identification and
biopsy taking. Using a rigid 0°, 30° sinus endoscope cupped biopsy
forceps, the biopsy specimen was obtained, including the marginal
adjacent tissue and the tumor itself. Specimens were maintained in
prepared preservative and sent for histopathological examination.
Pathological findings were graded according to the World Health
Organization, which has classified NPC into three categories: i)
WHO-1, defined as well-to-moderately differentiated squamous or
transitional cell carcinoma with keratin production; ii) WHO-2,
which is non-keratinizing carcinoma; iii) WHO-3, which is
undifferentiated carcinoma, including lymphoepithelioma (10).
Performance status evaluation
All patients were evaluated for performance status
criteria using the Karnofsky performance scale (KPS) (11). Performance status evaluation was
performed pre-treatment and 6-months post-treatment for 2 years.
Inclusion criteria included pathology proven to be WHO type II–III
NPC, stage III/IV according to the AJCC staging criteria, no
distant metastasis, an expected lifespan of at least 6 months, KPS
score ≥70, neutrophil count >2×10⁹/l and platelet
count >100×109/l prior to treatment, and bilirubin
<1.5 mg/dl, AST/ALT <2 times the upper limits of normal,
serum creatinine <1.5 mg/dl and creatinine clearance rate >50
ml/min prior to treatment. The exclusion criteria included previous
radiotherapy to the head and neck region, previous surgery in the
primary tumor site or neck (unless for diagnostic biopsy), history
of malignant tumors or simultaneous multiple tumors, a positive
pregnancy test result for women of reproductive age, impaired renal
or hepatic functions, diabetes mellitus or cardiac diseases.
Laboratory assessments
Blood samples were collected from patients prior to
and following completion of their chemoradiotherapy course. The
collected blood samples were divided into two samples.
The first sample was collected in EDTA-containing
tubes and the plasma was separated immediately and stored at −80°C
until use for polymerase chain reaction (PCR) qualitative
identification of EBV DNA and quantitative estimation of EBV DNA
plasma load, according to the manufacturer's protocol (12). Briefly, a 200 µl aliquot of plasma
from each sample was used. The DNA was extracted from the samples
using the QIAamp® DNA minikit (Qiagen, Hamburg,
Germany). The extracted DNA was quantified and checked for purity
using a spectrophotometer (Shimadzu, Kyoto, Japan). Quantification
of EBV DNA copies in plasma-derived DNA was performed using the
iCycler iQ™ Real Time PCR system (Bio-Rad Laboratories, Hercules,
CA, USA). The quality of purified DNA from plasma samples was
confirmed by conventional PCR amplification of the human β-globin
gene using the following gene-specific primers: Forward:
5′-AGGAGTGGTGGCTCATGTCT-3′ and reverse: 5′-CTCAAGGGATCCTCCCATTT-3′.
Primers flanking the BamH1W region (EBV coordinate:
14,649–14,724) of the EBV genome and TaqMan® probe
(Applied Biosystems, Foster City, CA, USA) directed within this
flanked region (EBV coordinate: 14,672–14,698) were reported by Lo
et al (12) and were
custom-made (Applied Biosystems). An aliquot of 5 µl purified DNA
isolated from the plasma was used for amplification in a total
reaction volume of 50 µl, which contained the following components:
300 nM each primer, 25 nM TaqMan® probe and
TaqMan® PCR reagents. The amplification reaction for
each sample and standard was performed in duplicate. The standard
curve correlating the viral DNA copy to threshold cycle was
constructed by amplifying 5 µl aliquots of serially diluted DNA
isolated from Namalwa cells that contained 45, 450, 45,000, 100,000
and 450,000 EBV DNA copies/ml. The fluorescence detection threshold
value was set at 10x the mean standard deviation of fluorescence in
all reactions. EBV DNA load, expressed as viral copy number/ml of
plasma, was determined using the following equation: EBV DNA
copy/ml = Q (VE / VA) × 1 / VP. Where Q is the DNA copy determined
from standard curve, VE is the volume of DNA eluent (50 µl), VA is
the volume of DNA template amplified (5 µl) and VP is the volume of
plasma used for DNA extraction (200 µl).
The second sample was maintained in a plane
container and allowed to clot. The serum was subsequently separated
by centrifugation for 10 min at 1,000 × g using a
refrigerated centrifuge. Serum was removed and stored in
pyrogen-free Eppendorf tubes at −80°C until assayed for estimation
of serum levels of IL-1β (Quantikine ELISA kit; R&D Systems,
Inc., Minneapolis, MN, USA) (13),
IL-6 (Pelikine™ Inc., Concord, MA, USA) (14) and TNF-α (Pelikine™ Inc.) (15) using ELISA kits, according to the
manufacturer's protocols.
Chemoradiotherapy procedure
All patients were assigned to receive the
appropriate chemoradiotherapy at the Nuclear Medicine Department,
Cancer Institute, Tanta University (Tanta, Egypt). Patients
received radiotherapy by the simplified intensity modulated
radiotherapy technique to shorten the radiation time in each
fraction, with prescription doses of 70, 66.5/68.25 and 61.25 Gy
(in 35 fractions) for high-risk gross tumor volume of primary tumor
and metastatic lymph nodes, and clinical target volume,
respectively. Patients with low-risk clinical target volume,
referred to levels IV and Vb without metastatic cervical lymph
nodes, were radiated with 54 Gy/30 fractions in the
anterior-posterior fields. All patients received neoadjuvant
chemotherapy prior to radiotherapy with the TPF regimen (docetaxel
75 mg/m2 and cisplatin 75 mg/m2 on day 1, and
5-florouracil at 500 mg/m2 on day 3) on continuous
intravenous infusion for 120 h every 3 weeks for 3 cycles. Complete
blood count, liver function and renal function were tested prior to
each chemotherapy course, and only patients with a qualifying index
were allowed to proceed with the next chemotherapy course.
Concurrent chemoradiotherapy was administered following three
courses of neoadjuvant chemotherapy. Concurrent chemotherapy
consisted of weekly cisplatin (40 mg/m2) during
radiotherapy, with a maximum of seven courses (16).
Follow-up
Patients completed their follow-up by attending
Otorhinolaryngology ENT and Internal Medicine outpatient clinics
every 3 months for 2 years for nasopharyngoscopy and neck palpation
and for MRI at 3 months after radiotherapy, then every 6 months.
Performance status evaluation was performed 6-monthly following
treatment for 2 years.
Statistical analysis
The sample size was calculated using the standard
nomogram proposed by Kraemer and Thiemann (17). Considering the increasing frequency
of NPC in North Africa (3), a sample
size of >30 patients was determined to be sufficient to detect a
difference at the 5% significance level and to give the trial 60%
power (18). Sample size and power
were recalculated and assured using Power and Sample Size
Calculation Software program (version 3.1.2) provided by Department
of Biostatistics, Vanderbilt University (Nashville, TN, USA). The
obtained data were presented as the mean ± standard deviation,
ranges, numbers and ratios. The results were analyzed using one-way
analysis of variance, with post-hoc Tukey HSD test and
χ2. Sensitivity and specificity of estimated parameters
as survival predictors were evaluated using the receiver operating
characteristic (ROC) curve analysis judged by the area under the
curve (AUC) compared with the null hypothesis that AUC=0.05.
Possible associations were investigated using Spearman linear
regression. Statistical analysis was performed using the SPSS
(version 15) statistical package for Windows (SPSS, Inc., Chicago,
IL, USA). P<0.05 was considered to indicate a statistically
significant difference.
Results
The present study included 35 patients with NPC.
Clinical presenting symptoms, clinical stage and pathological
grading data are shown in Table I.
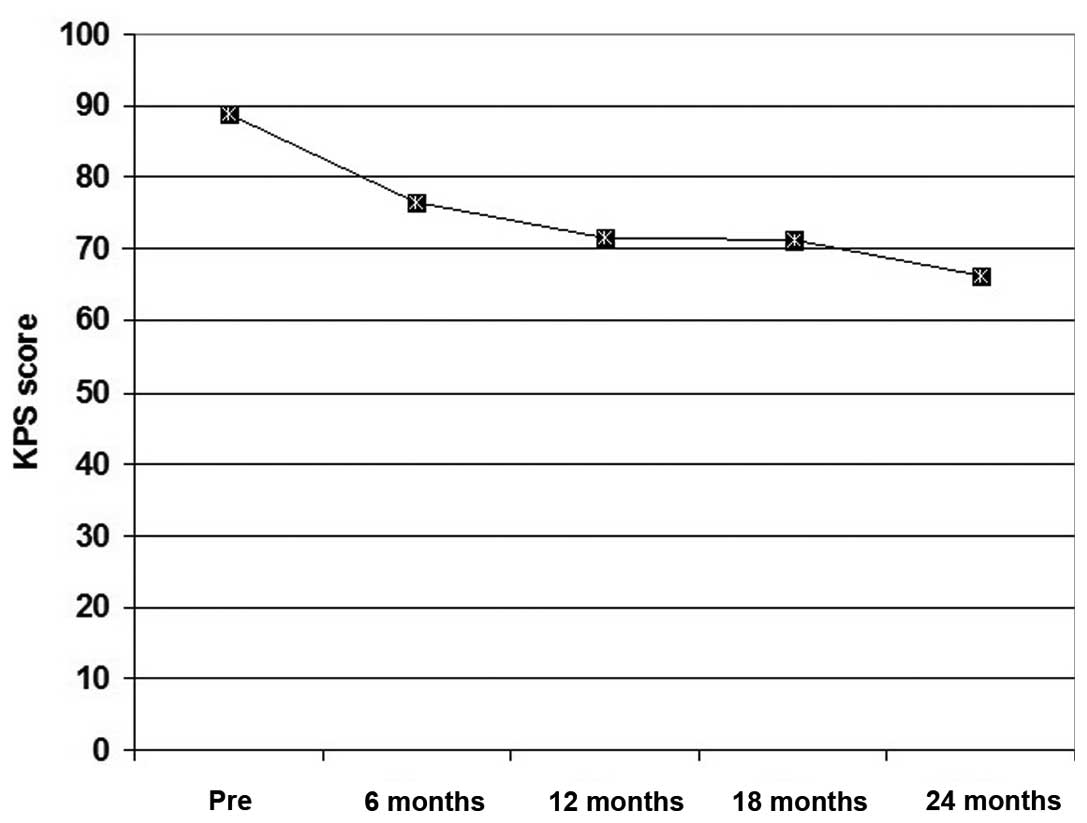
All patients exhibited a gradual decrease of their performance
scores throughout the follow-up period, but the extent of decrease
was gradual with non-significant differences (P>0.05) between
patient frequency among higher scoring items at 6 months
post-treatment compared with pre-treatment frequency. Thereafter,
at 12, 18 and 24 months post-treatment, the frequency of patients
with high performance scores was significantly lower compared with
the pre-treatment frequency. The mean of collective scoring
throughout the follow-up period was significantly lower compared
with the pre-treatment collective score (Fig. 1).
 | Table I.Enrolled patient data. |
Table I.
Enrolled patient data.
| Patient
information | Findings |
|---|
| Demographic data |
|
| Age,
years (range) | 54.5±11.8
(37–71) |
| Gender
(male:female) | 2.18:1 |
| Smoking history
(%) |
|
|
Current | 17 (48.6) |
|
Ex-smoker | 8 (22.8) |
|
Non-smoker | 10 (28.6) |
|
Occupational exposure
frequency | 13 (37.1) |
| Presenting symptoms
(%) |
|
| Cervical
lymphadenopathy | 23 (65.7) |
| Recurrent
epistaxis | 16 (45.7) |
| Secretory
otitis media | 10 (28.6) |
|
Headache | 9 (25.7) |
|
Otalgia | 7 (20) |
| Frequency of symptoms
(1:2:3:4:5) | 17:9:7:1:1 |
| Mean
number (range) | 1.86±1 (1–5) |
| Clinical stage
(Stage II:III:IV) | 13:13:9 |
| Pathological
gradinga (Type
1:2:3) | 15:12:8 |
The mean pre- and post-treatment serum levels of the
investigated cytokines were significantly higher compared with the
control levels. The mean post-treatment plasma EBV DNA viral load
and serum levels of IL-6 and TNF-α were significantly lower, but
post-treatment serum levels of IL-1β were significantly higher
compared with the pre-treatment levels (Table II).
| Table II.Pre- and post-treatment laboratory
findings of studied patients compared with control levels. |
Table II.
Pre- and post-treatment laboratory
findings of studied patients compared with control levels.
|
|
| Patients |
|
|---|
|
|
|
|
|
|---|
| Cytokine level | Control | Pre-treatment | Post-treatment |
P-valuea |
|---|
| Serum IL-1β, ng/ml
(P-valueb) | 1.75±0.4 | 2.44±0.53
(0.012) | 3.03±1.1
(0.035) | 0.001 |
| Serum TNF-α, ng/ml
(P-valueb) | 3.64±1.17 | 13.39±4.51
(0.0004) | 11.06±2.71
(0.0004) | 0.002 |
| Serum IL-6, ng/ml
(P-valueb) | 13.53±2.84 | 189.89±43.36
(0.0001) | 35.52±13.92
(0.0003) |
0.0001 |
| Plasma EBV DNA
load, copies/ml | – |
2,112.11±595.62 | 63.93±27.16 |
0.0001 |
Throughout the 2-years follow-up period, nine
patients succumbed to mortality, giving a 2-year mortality rate of
25.7%. A total of 5 mortalities were associated with
radiation-related injuries; 2 patients succumbed to secondary
development of mucosal necrosis, 2 due to massive gastrointestinal
hemorrhage and 1 secary to development of radiation encephalopathy.
A total of 2 mortalities were secondary to local regional therapy
failure and another 2 were secondary to distant metastasis.
At end of the 2-year follow-up, collective mortality
rates were 44.5, 23.1 and 15.4% for patients with pre-treatment
clinical stage IV, III and II, respectively. The 2-year survival
rate demonstrated negative significant correlation with serum
levels of IL-6 and TNF-α, and with plasma levels of EBV DNA viral
load. It also demonstrated positive significant correlation with
serum levels IL-1β and KPS; however, demonstrated positive
non-significant correlation with pre-treatment clinical staging.
Detailed correlations between the investigated parameters are shown
in Table III.
| Table III.Spearman correlation between various
factors. |
Table III.
Spearman correlation between various
factors.
|
| 2-year
survival | Plasma EBV DNA | Clinical
staging |
|---|
|
|
|
|
|
|---|
| Factor | Rho | P-value | Rho | P-value | Rho | P-value |
|---|
| Karnofsky
performance score | 0.379 | 0.025 | −0.395 | 0.017 | −0.716 | 0.0009 |
| Clinical
staging | −0.248 | >0.05 | 0.499 | 0.002 | – | – |
| Serum IL-1β
(ng/ml) | 0.415 | 0.013 | −0.425 | 0.011 | −0.555 | 0.001 |
| Serum TNF-α
(ng/ml) | −0.458 | 0.006 | 0.350 | 0.039 | 0.394 | 0.019 |
| Serum IL-6
(ng/ml) | −0.541 | 0.001 | 0.504 | 0.002 | 0.806 | 0.0004 |
| Plasma EBV DNA
(copies/ml) | −0.401 | 0.017 | – | – | – | – |
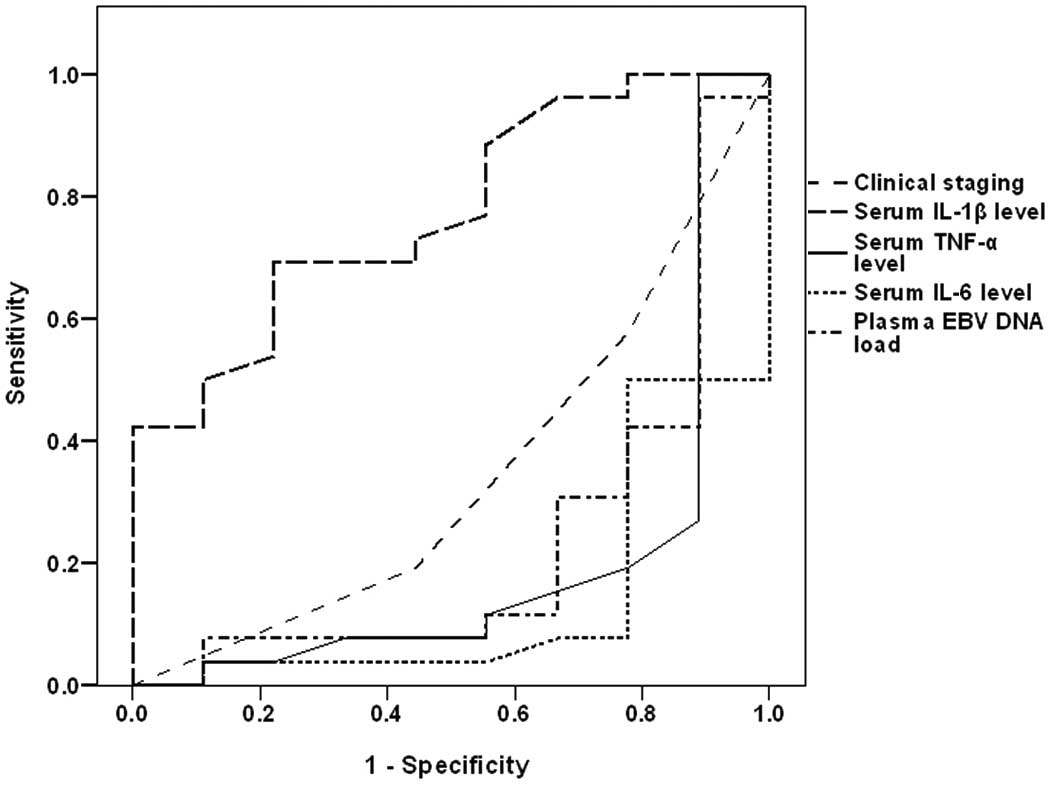
ROC curve analysis defined high pre-treatment serum
IL-6, serum TNF-α and plasma EBV DNA as sensitive predictors of
mortality, with descending order of significance compared with the
null hypothesis of AUC=0.5, while high serum IL-1β as a specific
predictor for survival with significantly higher AUC compared with
the null hypothesis (Table IV and
Fig. 2). Regression analysis defined
high pre-treatment serum IL-6 as a specific significant predictor
for mortality (β=−0.529, t=3.584, P=0.001).
| Table IV.Receiver operating characteristic
curve analysis of clinical staging and laboratory findings as
predictors for 2-year survival determined by AUC. |
Table IV.
Receiver operating characteristic
curve analysis of clinical staging and laboratory findings as
predictors for 2-year survival determined by AUC.
| Factor | AUC | SE | P-value | 95% CI |
|---|
| Clinical stage | 0.346 | 0.109 | >0.05 | 0.132–0.560 |
| Serum IL-1β
(ng/ml) | 0.774 | 0.085 | 0.016 | 0.607–0.940 |
| Serum TNF-α
(ng/ml) | 0.199 | 0.105 | 0.008 | −0.007–0.405 |
| Serum IL-6
(ng/ml) | 0.143 | 0.076 | 0.002 | −0.005–0.291 |
| Plasma EBV DNA load
(copies/ml) | 0.235 | 0.106 | 0.019 | 0.028–0.442 |
Discussion
Clinical presentation of studied cases of NPC was
mosaic and non-specific. The major presenting symptoms were
cervical lymphadenopathy, epistaxis of unexplained origin and
varied otological symptoms and signs. Similarly, Adham et al
(19) reported that the initial
diagnosis of NPC is difficult to make since early signs and
symptoms of NPC are not specific to the disease.
The estimated pre-treatment plasma EB viral DNA load
were decreased significantly following the completion of the
treatment protocol and demonstrated a positive significant
correlation with clinical tumor aggressiveness. These findings
indicated a close association between the presence of NPC and EBV
viremia, and the probability of reliance on estimation of plasma
EBV DNA load as a non-invasive diagnostic modality for NPC that
provided a pre-treatment knowledge about disease stage and response
to applied therapy.
In line with these data, Ji et al (20) reported that at the cutoff point of 0
copies/ml plasma EBV DNA had a sensitivity, positive and negative
predictive values of 86.8, 30 and 99.3%, respectively, for NPC
detected within the first year of follow-up. Additionally, it had a
sensitivity of 81.5 and 100% for patients who had early and
advanced NPC, respectively. Hutajulu et al (21) documented elevated viral DNA in the
patient circulation, as well as nasopharyngeal site underline the
role of EBV for NPC development.
In trials to explore the association between NPC and
EBV infection, experimental studies using NPC lines infected in
vitro with EBV showed that in vitro EBV infection
resulted in the activation of signal transducer and activator of
transcription (STAT)-3 and nuclear factor-κB signaling cascades in
nasopharyngeal epithelial cells. This resulted in increased
expression of their downstream targets. These findings suggest that
EBV infection may manipulate multiple cellular signaling cascades
to protect infected cells from immunological attack and to
facilitate cancer development (22,23).
Estimated post-treatment levels of IL-6 and TNF-α
were significantly decreased compared with pre-treatment levels
that showed positive significant correlation with clinical staging
and EBV DNA plasma load; a finding indicating a close association
between NPC and high serum levels of both inflammatory cytokines.
The detected association between clinical staging and pre-treatment
plasma EBV DNA viral load on one side and pre-treatment serum
cytokines was approved experimentally by Zhang et al
(24) who reported that EBV-infected
nasopharyngeal epithelial cells exhibited enhanced response to
IL-6-induced STAT-3 activation through overexpression of the IL-6
receptor, thus promoting growth and invasive properties
EBV-positive NPC cells. Ansari et al (25) observed that EBV facilitates its
genome persistence and evasion of host immune responses through
activation of caspase-1, which cleaves the pro-forms of
inflammatory IL-1β, IL-18 and IL-33 cytokines. Song et al
(26) suggested that TNF-α may be a
promoter for NPC local spread and metastasis through the induction
of inhibitor of apoptosis proteins, which contribute to both tumor
progression and tumor metastasis. Liao et al (27) used NPC cell lines to detect that IL-6
promoted NPC cell proliferation in a dose- and time-dependent
manner, and this was accompanied by increasing cyclin D1 and Bcl-2
expression, STAT-3 activation, and inhibition of Bax and p21
expression. Liu et al (28)
observed that in certain macrophages of the tumor stroma of NPC
tissue, IL-6- and TNF-α-dependent expression of
tryptophan-catabolizing enzyme indoleamine 2,3-dioxygenase led to
suppressed proliferation of T cells and impaired cytotoxic activity
of CD8(+) T cells, thus facilitating immune escape.
Notably, the estimated pre-treatment levels of IL-1β
were significantly lower compared with post-treatment levels and
had negative significant correlation with clinical staging and
plasma EBV DNA viral load. These data may indicate an abnormal
behavior of IL-1β, which despite being an inflammatory cytokine,
appears to have anticancer action. In line with these findings,
Chen et al (29)
experimentally reported that tumor inflammasomes, which are
critical for IL-1β production, serve a key role in tumor control by
recruiting neutrophils, and their expression levels manifested by
increased levels of IL-1β are favorable prognostic markers and
promising therapeutic targets in patients.
The reported 2-year survival rate demonstrated
negative significant correlation with pre-treatment serum levels of
IL-6 and TNF-α, while showed positive significant correlation with
pre-treatment serum level of IL-1β. Statistical analyses defined
high pre-treatment serum IL-6 as a significant specific predictor
for high mortality rate. These findings go in hand with Lu et
al (30) who reported that
pre-treatment serum levels of IL-2 and TNF-α were closely
associated with the overall survival of patients with NPC, with
>2-fold increase in the risk of mortality in patients with low
IL-2 expression and/or high TNF-α expression compared with those
with high IL-2 or low TNF-α levels. Visconti et al (31) demonstrated that elevated IL-6 and
IL-10 levels appear to be independently associated with worse
prognosis in terms of overall and disease-free survival in cancer
patients. Reitter et al (32)
reported that elevated levels of IL-6, IL-8 and IL-11 were
associated with worse survival of cancer patients. Cheng et
al (33) revealed that NPC
patients who had high IL-8 levels had significantly shorter overall
survival and disease-free survival.
In conclusion, NPC is associated with high
pre-treatment plasma EBV DNA load and serum cytokines, and
chemoradiotherapy significantly reduced these high levels. High
pre-treatment serum IL-6 level is a significantly specific
predictor for high mortality rate. Increased post-treatment serum
levels of IL-1β indicated good therapeutic response and most
probably high survival rate.
Acknowledgements
The authors would like to thank staff members,
assistants, technicians and workers at Tanta Cancer Institute for
providing assistance for researchers and patients during the
chemoradiotherapy.
Glossary
Abbreviations
Abbreviations:
|
NPC
|
nasopharyngeal carcinoma
|
|
IL
|
interleukin
|
|
EBV
|
Epstein-Barr virus
|
|
TNF-α
|
tumor necrosis factor-α
|
References
|
1
|
Petersson F: Nasopharyngeal carcinoma: A
review. Semin Diagn Pathol. 32:54–73. 2015. View Article : Google Scholar : PubMed/NCBI
|
|
2
|
Yu MC and Yuan JM: Epidemiology of
nasopharyngeal carcinoma. Semin Cancer Biol. 12:421–429. 2002.
View Article : Google Scholar : PubMed/NCBI
|
|
3
|
Zanetti R, Tazi MA and Rosso S: New data
tells us more about cancer incidence in North Africa. Eur J Cancer.
46:462–466. 2010. View Article : Google Scholar : PubMed/NCBI
|
|
4
|
Chang CM, Yu KJ, Mbulaiteye SM, Hildesheim
A and Bhatia K: The extent of genetic diversity of Epstein-Barr
virus and its geographic and disease patterns: A need for
reappraisal. Virus Res. 143:209–221. 2009. View Article : Google Scholar : PubMed/NCBI
|
|
5
|
Ho CH, Chen CL, Li WY and Chen CJ: Decoy
receptor 3, upregulated by Epstein-Barr virus latent membrane
protein 1, enhances nasopharyngeal carcinoma cell migration and
invasion. Carcinogenesis. 30:1443–1451. 2009. View Article : Google Scholar : PubMed/NCBI
|
|
6
|
Iwakiri D and Takada K: Role of EBERs in
the pathogenesis of EBV infection. Adv Cancer Res. 107:119–136.
2010. View Article : Google Scholar : PubMed/NCBI
|
|
7
|
Dawson CW, Laverick L, Morris MA,
Tramoutanis G and Young LS: Epstein-Barr virus-encoded LMP1
regulates epithelial cell motility and invasion via the ERK-MAPK
pathway. J Virol. 82:3654–3664. 2008. View Article : Google Scholar : PubMed/NCBI
|
|
8
|
Huang YT, Liu MY, Tsai CH and Yeh TH:
Upregulation of interleukin-1 by Epstein-Barr virus latent membrane
protein 1 and its possible role in nasopharyngeal carcinoma cell
growth. Head Neck. 32:869–876. 2010.PubMed/NCBI
|
|
9
|
AJCC, . LarynxAmerican Joint Committee on
Cancer. AJCC Cancer Staging Manual. 6th. Springer; New York: pp.
47–57. 2002
|
|
10
|
Shanmugaratnam KS and Sobin LH:
Histological typing of upper respiratory tract tumors. Geneva:
World Health Organization; 1978
|
|
11
|
Schag CC, Heinrich RL and Ganz PA:
Karnofsky performance status revisited: Reliability, validity, and
guidelines. J Clin Oncol. 2:187–193. 1984.PubMed/NCBI
|
|
12
|
Lo YM, Chan LY and Lo KW: Quantitative
analysis of cell-free Epstein-Barr virus DNA in plasma of patients
with nasopharyngeal carcinoma. Cancer Res. 59:1188–1191.
1999.PubMed/NCBI
|
|
13
|
Dinarello CA: ELISA kits based on
monoclonal antibodies do not measure total IL-1beta synthesis. J
Immunol Methods. 148:255–259. 1992. View Article : Google Scholar : PubMed/NCBI
|
|
14
|
Gaines-Das RE and Poole S: The
international standard for interleukin-6. Evaluation in an
international collaborative study. J Immunol Methods. 160:147–153.
1993. View Article : Google Scholar : PubMed/NCBI
|
|
15
|
De Kossodo S, Houba V and Grau GE:
Assaying tumor necrosis factor concentrations in human serum. A WHO
international collaborative study. J Immunol Methods. 182:107–114.
1995. View Article : Google Scholar : PubMed/NCBI
|
|
16
|
Kong L, Zhang YW, Hu CS and Guo Y:
Neoadjuvant chemotherapy followed by concurrent chemo-radiation for
locally advanced nasopharyngeal carcinoma. Chin J Cancer.
29:551–555. 2010. View Article : Google Scholar : PubMed/NCBI
|
|
17
|
Kraemer HC and Theimann S: How many
subjects?Statistical Power Analysis in Research. Newbury Park, CA:
Sage; 1987
|
|
18
|
Murphy KR and Myors B: Statistical power
analysis: A simple and general model for traditional and modern
hypothesis tests. 2nd. Lawrence Erlbaum Associates, Inc.; 2003
|
|
19
|
Adham M, Kurniawan AN, Muhtadi AI, Roezin
A, Hermani B, Gondhowiardjo S, Tan IB and Middeldorp JM:
Nasopharyngeal carcinoma in Indonesia: Epidemiology, incidence,
signs, and symptoms at presentation. Chin J Cancer. 31:185–196.
2012. View Article : Google Scholar : PubMed/NCBI
|
|
20
|
Ji MF, Huang QH, Yu X, Liu Z, Li X, Zhang
LF, Wang P, Xie SH, Rao HL, Fang F, et al: Evaluation of plasma
Epstein-Barr virus DNA load to distinguish nasopharyngeal carcinoma
patients from healthy high-risk populations in Southern China.
Cancer. 120:1353–1360. 2014. View Article : Google Scholar : PubMed/NCBI
|
|
21
|
Hutajulu SH, Kurnianda J, Tan IB and
Middeldorp JM: Therapeutic implications of Epstein-Barr virus
infection for the treatment of nasopharyngeal carcinoma. Ther Clin
Risk Manag. 10:721–736. 2014. View Article : Google Scholar : PubMed/NCBI
|
|
22
|
Stewart S, Dawson CW, Takada K, Curnow J,
Moody CA, Sixbey JW and Young LS: Epstein-Barr virus-encoded LMP2A
regulates viral and cellular gene expression by modulation of the
NF-kappaB transcription factor pathway. Proc Natl Acad Sci USA.
101:15730–15735. 2004. View Article : Google Scholar : PubMed/NCBI
|
|
23
|
Lo AK, Lo KW, Tsao SW, Wong HL, Hui JW, To
KF, Hayward DS, Chui YL, Lau YL, Takada K and Huang DP:
Epstein-Barr virus infection alters cellular signal cascades in
human nasopharyngeal epithelial cells. Neoplasia. 8:173–180. 2006.
View Article : Google Scholar : PubMed/NCBI
|
|
24
|
Zhang G, Tsang CM, Deng W, Yip YL, Lui VW,
Wong SC, Cheung AL, Hau PM, Zeng M, Lung ML, et al: Enhanced
IL-6/IL-6R signaling promotes growth and malignant properties in
EBV-infected premalignant and cancerous nasopharyngeal epithelial
cells. PLoS One. 8:e622842013. View Article : Google Scholar : PubMed/NCBI
|
|
25
|
Ansari MA, Singh VV, Dutta S, Veettil MV,
Dutta D, Chikoti L, Lu J, Everly D and Chandran B: Constitutive
interferon-inducible protein 16-inflammasome activation during
Epstein-Barr virus latency I, II and, III in B and epithelial
cells. J Virol. 87:8606–8623. 2013. View Article : Google Scholar : PubMed/NCBI
|
|
26
|
Song Q, Wang G, Chu Y, Zhou L, Jiang M, He
Q, Liu M, Qin J and Hu J: TNF-α up-regulates cellular inhibitor of
apoptosis protein 2 (c-IAP2) via c-Jun N-terminal kinase (JNK)
pathway in nasopharyngeal carcinoma. Int Immunopharmacol.
16:148–153. 2013. View Article : Google Scholar : PubMed/NCBI
|
|
27
|
Liao Q, Zeng Z, Guo X, Li X, Wei F, Zhang
W, Li X, Chen P, Liang F, Xiang B, et al: LPLUNC1 suppresses
IL-6-induced nasopharyngeal carcinoma cell proliferation via
inhibiting the Stat3 activation. Oncogene. 33:2098–2109. 2014.
View Article : Google Scholar : PubMed/NCBI
|
|
28
|
Liu WL, Lin YH, Xiao H, Xing S, Chen H,
Chi PD and Zhang G: Epstein-Barr virus infection induces
indoleamine 2,3-dioxygenase expression in human monocyte-derived
macrophages through p38/mitogen-activated protein kinase and NF-κB
pathways: Impairment in T cell functions. J Virol. 88:6660–6671.
2014. View Article : Google Scholar : PubMed/NCBI
|
|
29
|
Chen LC, Wang LJ, Tsang NM, Ojcius DM,
Chen CC, Ouyang CN, Hsueh C, Liang Y, Chang KP, Chen CC and Chang
YS: Tumor inflammasome-derived IL-1β recruits neutrophils and
improves local recurrence-free survival in EBV-induced
nasopharyngeal carcinoma. EMBO Mol Med. 4:1276–1293. 2012.
View Article : Google Scholar : PubMed/NCBI
|
|
30
|
Lu K, Feng X, Deng Q, Sheng L, Liu P, Xu S
and Su D: Prognostic role of serum cytokines in patients with
nasopharyngeal carcinoma. Onkologie. 35:494–498. 2012. View Article : Google Scholar : PubMed/NCBI
|
|
31
|
Visconti L, Nelissen K, Deckx L, van den
Akker M, Adriaensen W, Daniels L, Matheï C, Linsen L, Hellings N,
Stinissen P and Buntinx F: Prognostic value of circulating
cytokines on overall survival and disease-free survival in cancer
patients. Biomark Med. 8:297–306. 2014. View Article : Google Scholar : PubMed/NCBI
|
|
32
|
Reitter EM, Ay C, Kaider A, Pirker R,
Zielinski C, Zlabinger G and Pabinger I: Interleukin levels and
their potential association with venous thromboembolism and
survival in cancer patients. Clin Exp Immunol. 177:253–260. 2014.
View Article : Google Scholar : PubMed/NCBI
|
|
33
|
Cheng D, Kong H and Li Y: Prognostic value
of interleukin-8 and MMP-9 in nasopharyngeal carcinoma. Eur Arch
Otorhinolaryngol. 271:503–509. 2014. View Article : Google Scholar : PubMed/NCBI
|