Introduction
We recently developed a novel quantitative
immunostaining technique termed ‘digital immunostaining with
phosphor-integrated dot (PID)’. This method is highly sensitive
with a wide range of detection compared with conventional
immunostaining methods such as 3,3′-diaminobenzidine (DAB)- or
alkaline phosphatase-based visualization (1–3). Most
conventional immunohistochemistry (IHC) scoring systems are
dependent on the staining intensity and are semi-quantitative.
Compared with conventional IHC, our digital IHC provides more
objective data because we can count the number of particles that
bind in a one-to-one fashion with antibody in each cell.
Furthermore, our previous study of digital immunostaining of human
epidermal growth factor receptor 2 protein revealed the close
correlation with clinical response to trastuzumab therapy compared
with that of conventional DAB staining (2).
PD-1 is a type of immune checkpoint receptor
expressed on the surface of cytotoxic T-cells. The upregulation of
the PD-1 receptor plays an important role in suppressing the
inactivation of programmed death ligand-1 (PD-L1) (4). Recently, therapeutic antibodies to
PD-1/PD-L1 have shown promising clinical results for several tumors
such as melanoma, renal cancer, and non-small cell lung cancer
(NSCLC) (5). There is a strong
association between the efficacy of PD-1/PD-L1 antibody therapy and
PD-L1 protein expression measured with DAB-based IHC (6). One of the difficulties in diagnostic
pathology is the harmonization of one drug-one diagnostic tests for
PD-L1. To overcome this challenge, several studies, e.g., the
Blue-print project, were performed (7). The consensus was that all diagnostic
kits, excluding the SP142 assay, showed robust harmonization
(7). However, there are many
variables to consider for accurate comparison of diagnostic tests,
such differences in antibody titer, detection system, and dynamic
range of visualization.
Because the estimation of the ability of each
antibody test is less informative in daily practice, the ability of
each diagnostic test was evaluated together with antibody titer,
detection system, and visualization method. Understanding the
differences in titer of each antibody used for diagnostic kits or
research with digital immunostaining may be beneficial for future
harmonized analysis.
Materials and methods
Cell lines and cell block
construction
Five cell lines with various PD-L1 expression levels
(NCI-H446, PC-3, NCI-H1299, A549, and NCI-H460) were obtained from
the American Type Culture Collection (ATCC, Manassas, VA, USA).
PC-3 and A549 cells were cultured in F-12K (ATCC 30-2004), whereas
NCI-H1299, H460, and H446 cells were cultured in RPMI 1640 (ATCC
30-2001) with 10% fetal bovine serum (Life Technologies, Carlsbad,
CA, USA) and 1% penicillin-streptomycin (Nacalai Tesque, Kyoto,
Japan). Cells were maintained in a humidified incubator with 5%
CO2 at 37°C.
A formalin-fixed, paraffin-embedded (FFPE) cell
block was constructed for the five cell lines. The specimens were
centrifuged for 10 min at 2,000 rpm. The resulting pellet was fixed
in 10% buffered formalin for 6 h and embedded in paraffin.
ELISA
ELISA was performed according to the manufacturers
instructions using a PathScan Total PD-L1 Sandwich ELISA kit (cat.
no. 14784; Cell Signaling Technology, Inc., Danvers, MA, USA). The
ELISA results were obtained as relative (OD), as there were no
standard substances for PD-L1 in the kit.
mRNA molecular counting
Cell line-derived cell blocks were cut into
5-µm-thick pieces with a microtome. The total mRNA was extracted
from 5–6 sections using a NucleoSpin total RNA FFPE kit
(Machery-Nagel, Düren, Germany). The RNA concentrations were
determined from the 260/280-nm OD ratio.
The nCounter GX Custom CodeSet was used to detect
gene expression in the purified RNA. RNA was hybridized with
CodeSets of 41 genes for 18 h at 65°C and processed according to
the manufacturers instructions. This method directly quantifies the
RNA using simultaneous hybridization processes with multiple
probes.
IHC with PID
Specimens of the cell lines were cut into pieces
with a thickness of 5 µm. Tissue microar-rays of NSCLC were
obtained from US Biomax (Rockville, MD, USA; LC241). They consisted
of six NSCLC samples, one adenocarcinoma sample (C5 core), and five
squamous cell carcinoma samples (A1, B1, C1, A6, and B6 cores).
Staining was performed on serial sections with each antibody.
The sections were deparaffinized, washed with
distilled water, boiled in 10 mM sodium citrate buffer (pH=6.3) for
20 min, allowed to cool at 25°C for 40 min, rinsed with deionized
water, and washed in PBS for 5 min. They were then incubated with
the anti-rabbit monoclonal PD-L1 antibody diluted with the antibody
diluent. Antibodies were diluted as follows: E1L3N (Cell Signaling
Technology, Inc.) 1:800, SP142 (Spring Bioscience, Pleasanton, CA,
USA) 1:100, SP263 (Ventana Medical Systems, Oro Valley, AZ, USA)
1:1, and 28-8 (Abcam, Cambridge, UK) 1:500.
Sections were incubated with a biotinylated
secondary monoclonal anti-rabbit antibody (LO-RG-1, 2 µg/ml) for 30
min and with streptavidin-conjugated PID (0.03 nM) for 2 h, both at
25°C.
Measurement of PID fluorescence
Sections were irradiated at 580 nm, and the
fluorescence intensity was measured using a fluorescence microscope
(BX-53; Olympus Corp., Tokyo, Japan) and a CCD camera (DP73;
Olympus Corp.). The PID particle number per cell was measured using
the PidAnalyzer (Konica Minolta, Inc., Tokyo, Japan). Five fields
were selected randomly, and over 1,000 tumor cells were
counted.
Statistical analysis
The linearity of PID was determined by comparing the
ELISA and nCounter data and calculated by Pearsons test.
PidAnalyzer v.2.14.1.1 software (Konica-Minolta, Inc.) was used to
conduct statistical analyses.
Results
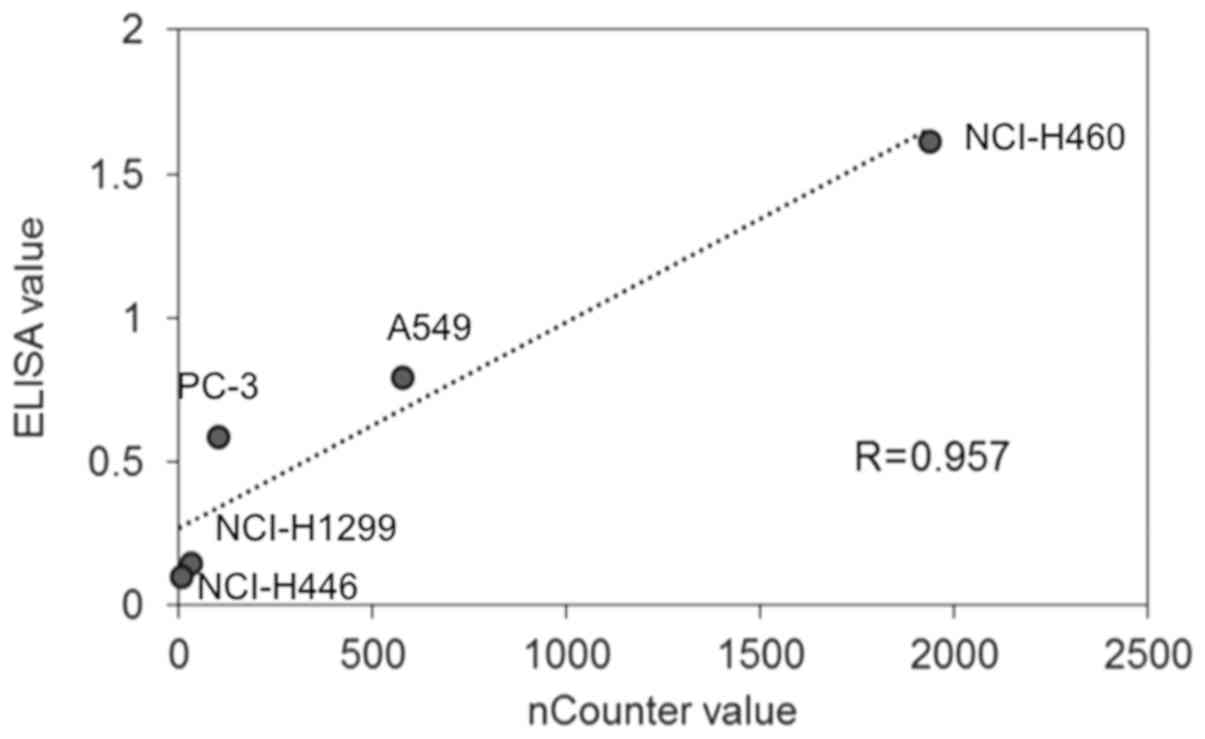
Comparison between protein and mRNA
expression
The linearity of ELISA data was determined by
comparison with the nCounter data. The highest protein expression
level of PD-L1 measured by ELISA was in NCI-H460 cells (1.62)
followed by A549 (0.80), PC-3 (0.59), NCI-H1299 (0.15), and
NCI-H446 (0.10) cells. Regarding the mRNA levels of PD-L1, the
highest value measured by nCounter was in H460 cells (1937)
followed by A549 (575), PC-3 (101), NCI-H1299 (31), and NCI-H446
(4) cells. The PD-L1 protein amount
measured by ELISA and the mRNA counts showed a high correlation
(Fig. 1: R>0.957).
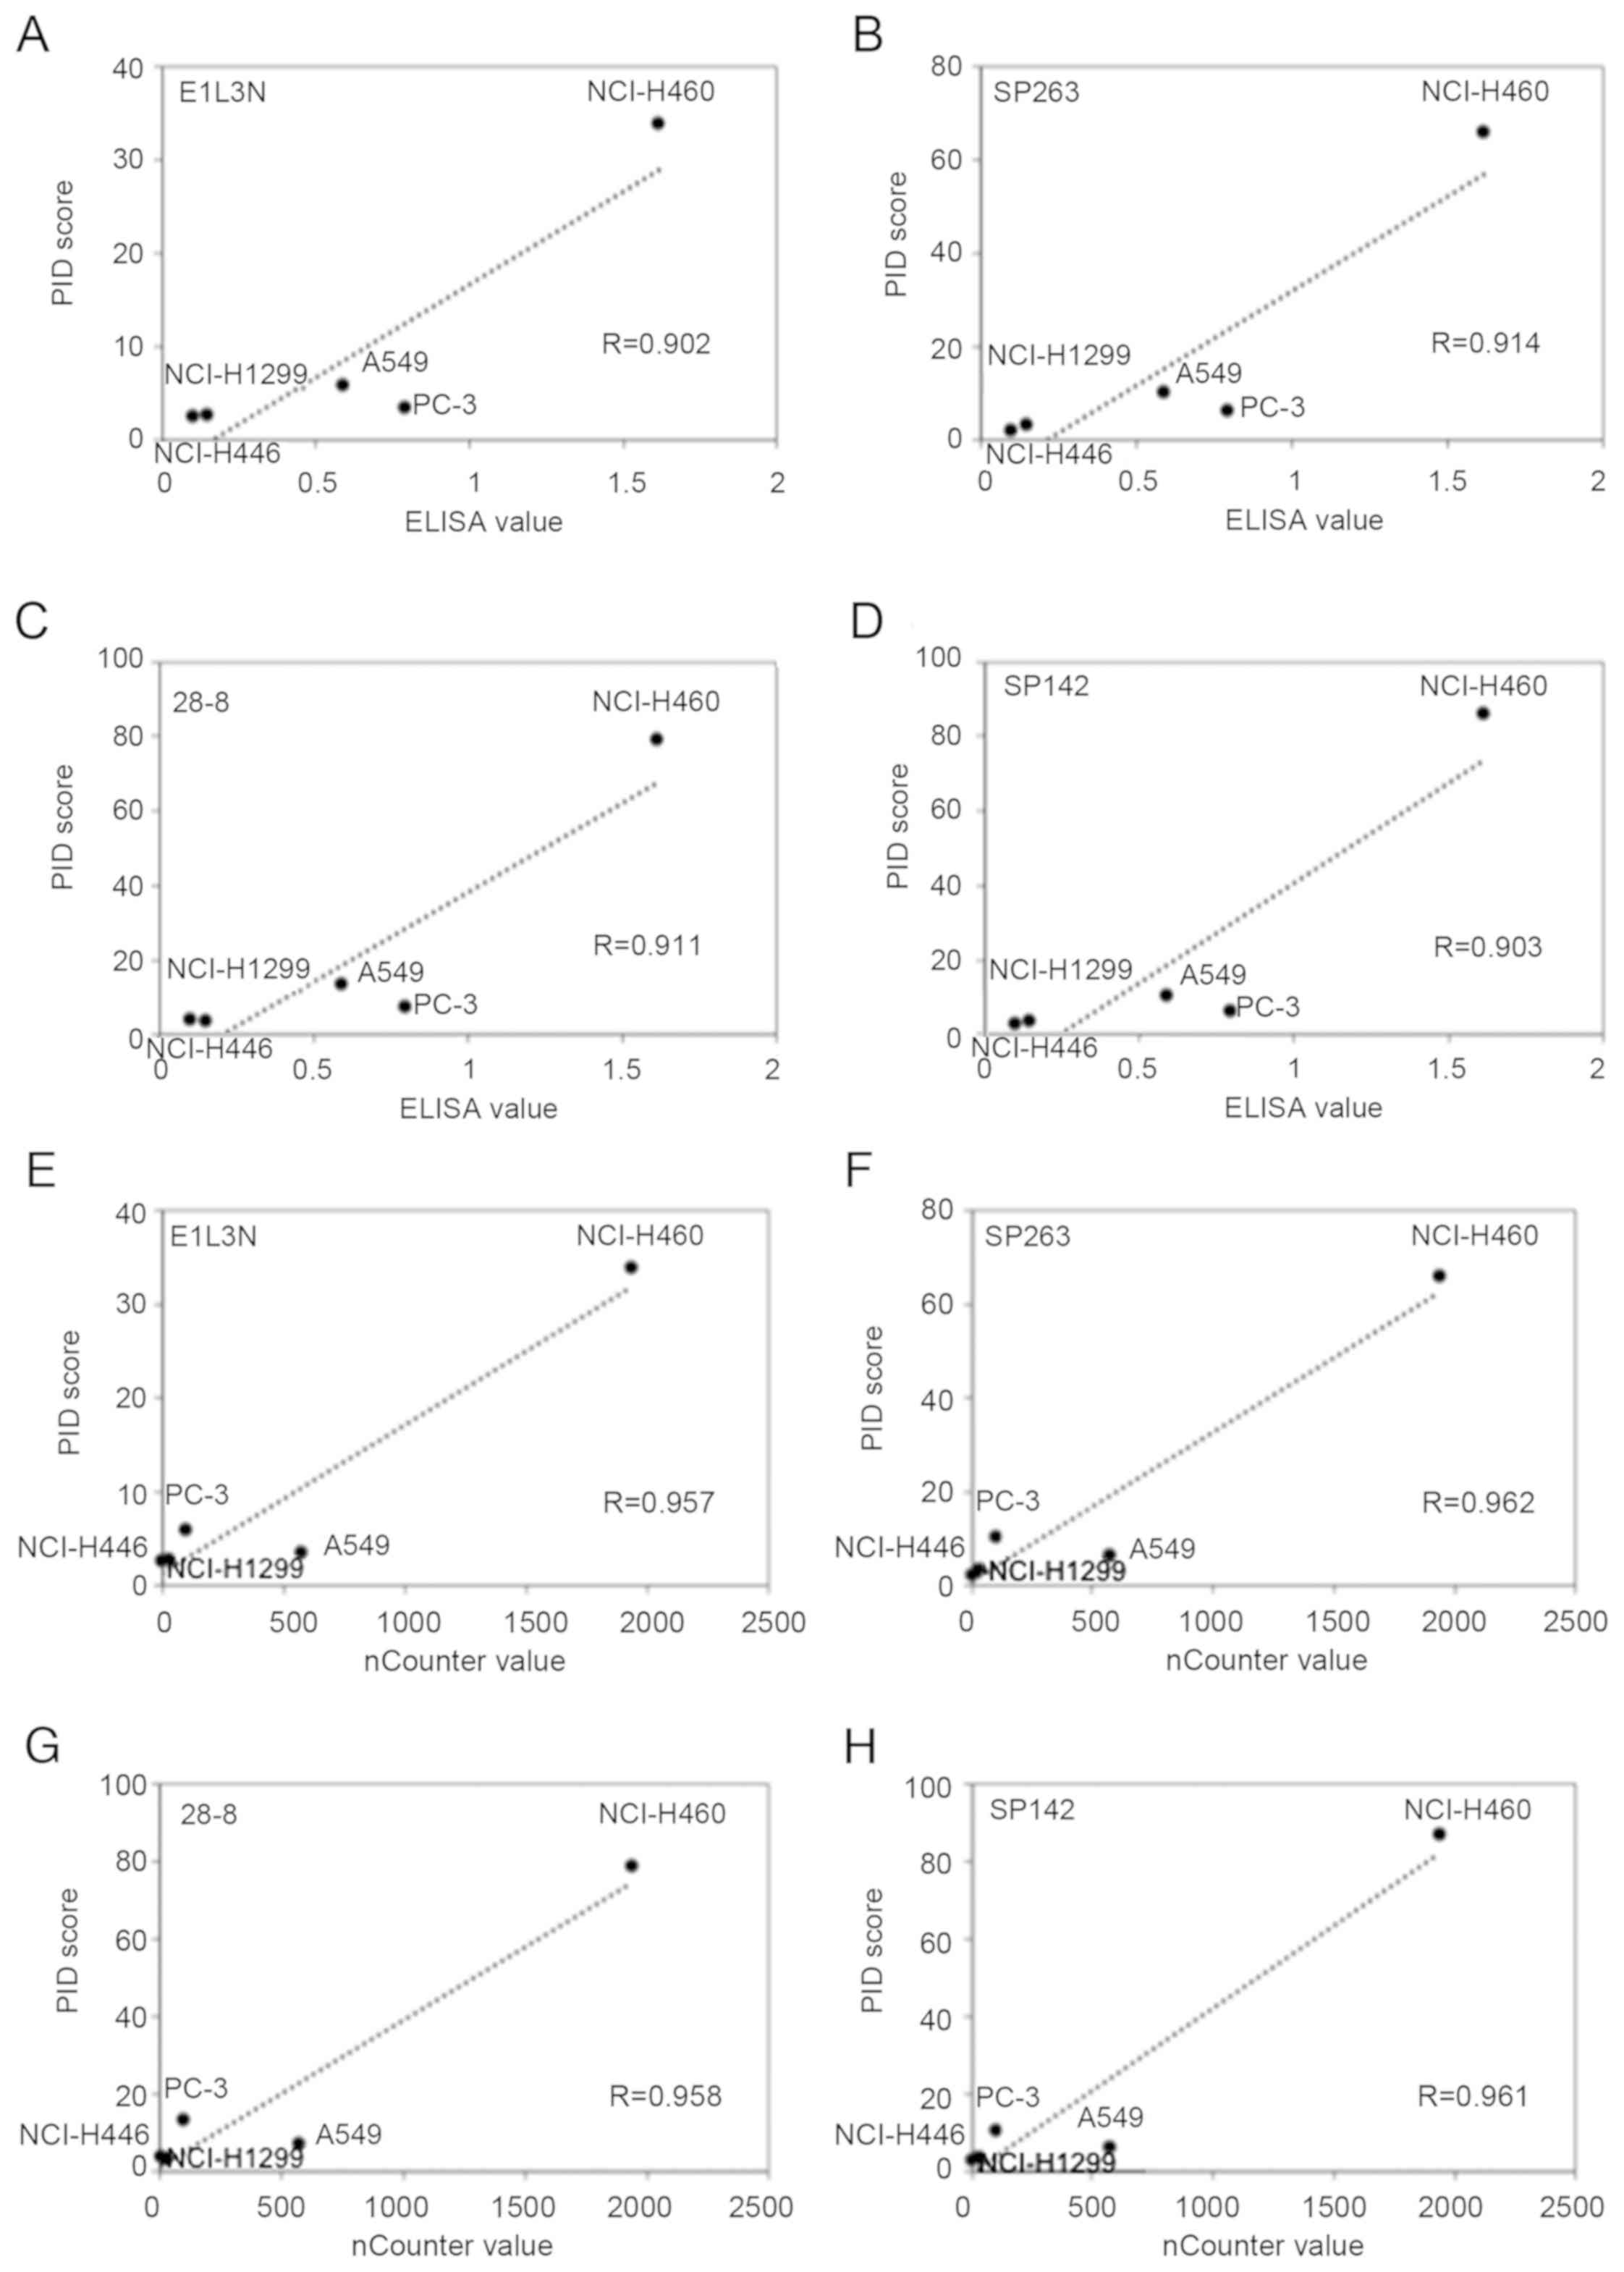
Comparison of PD-L1 protein expression
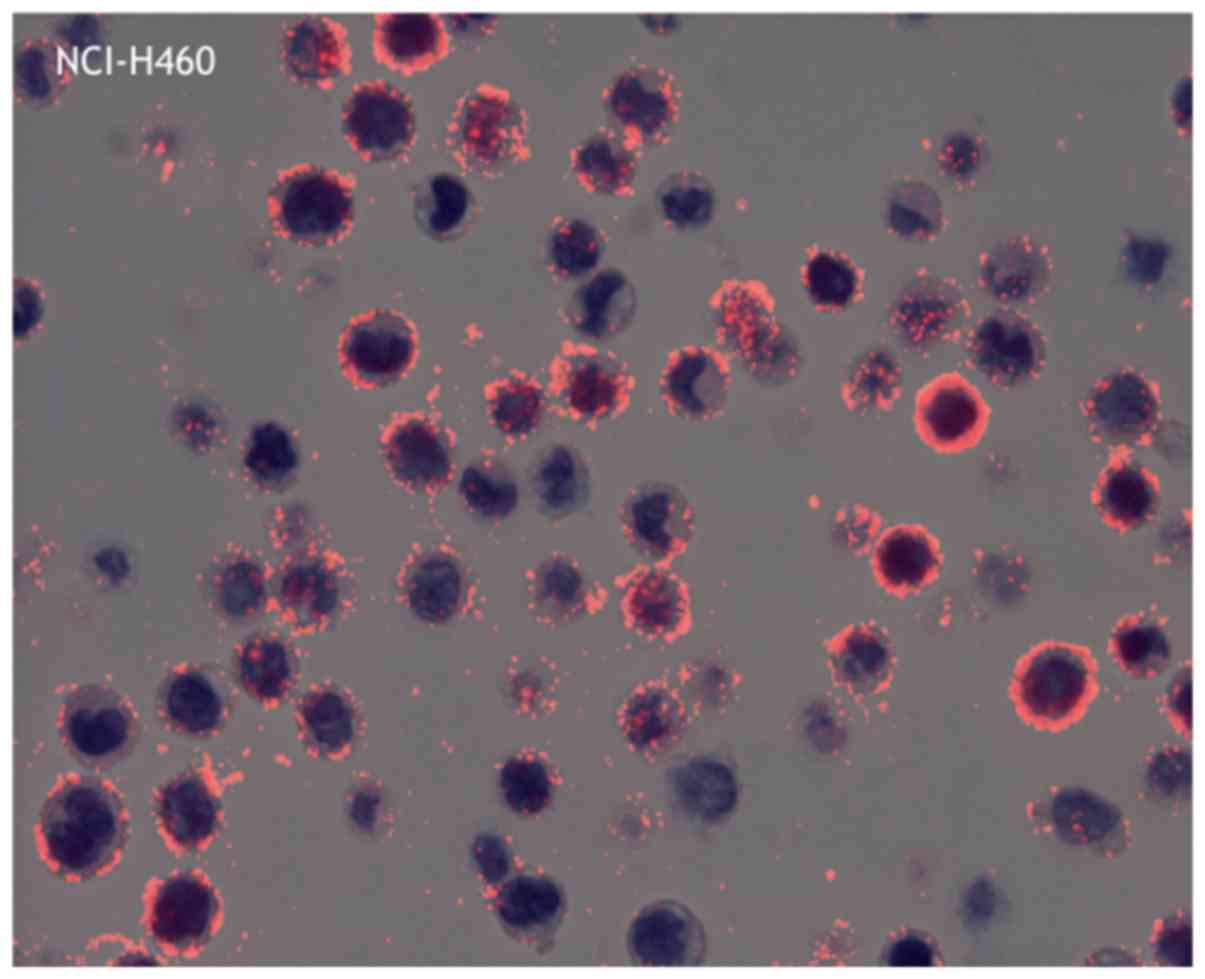
between ELISA and digital immunostaining with PID
The average PID score was determined by fluorescence
microscopy (Fig. 2). The highest
concordance between the PID score and ELISA was observed for SP263
(r=0.914) followed by 28-8 (r=0.911), SP142 (r=0.903), and E1L3N
(r=0.902; Fig. 3A-D). Comparison of
the PD-L1 score (PID count per cell) with the ELISA levels revealed
a high correlation (R>0.90) for all primary antibodies.
Furthermore, there was no difference in the PD-L1 expression
tendency for each antibody.
Comparison of PD-L1 mRNA expression
between nCounter and digital immunostaining with PID
The highest concordance between the PID score and
nCounter value was observed for SP263 (r=0.962) followed by SP142
(r=0.961), 28-8 (r=0.958), and E1L3N (r=0.957; Fig. 3E-H). Comparison of the PD-L1 score
(PID count per cell) with the nCounter levels revealed a high
correlation for all primary antibodies. Furthermore, there was no
difference in the PD-L1 expression tendency for each antibody.
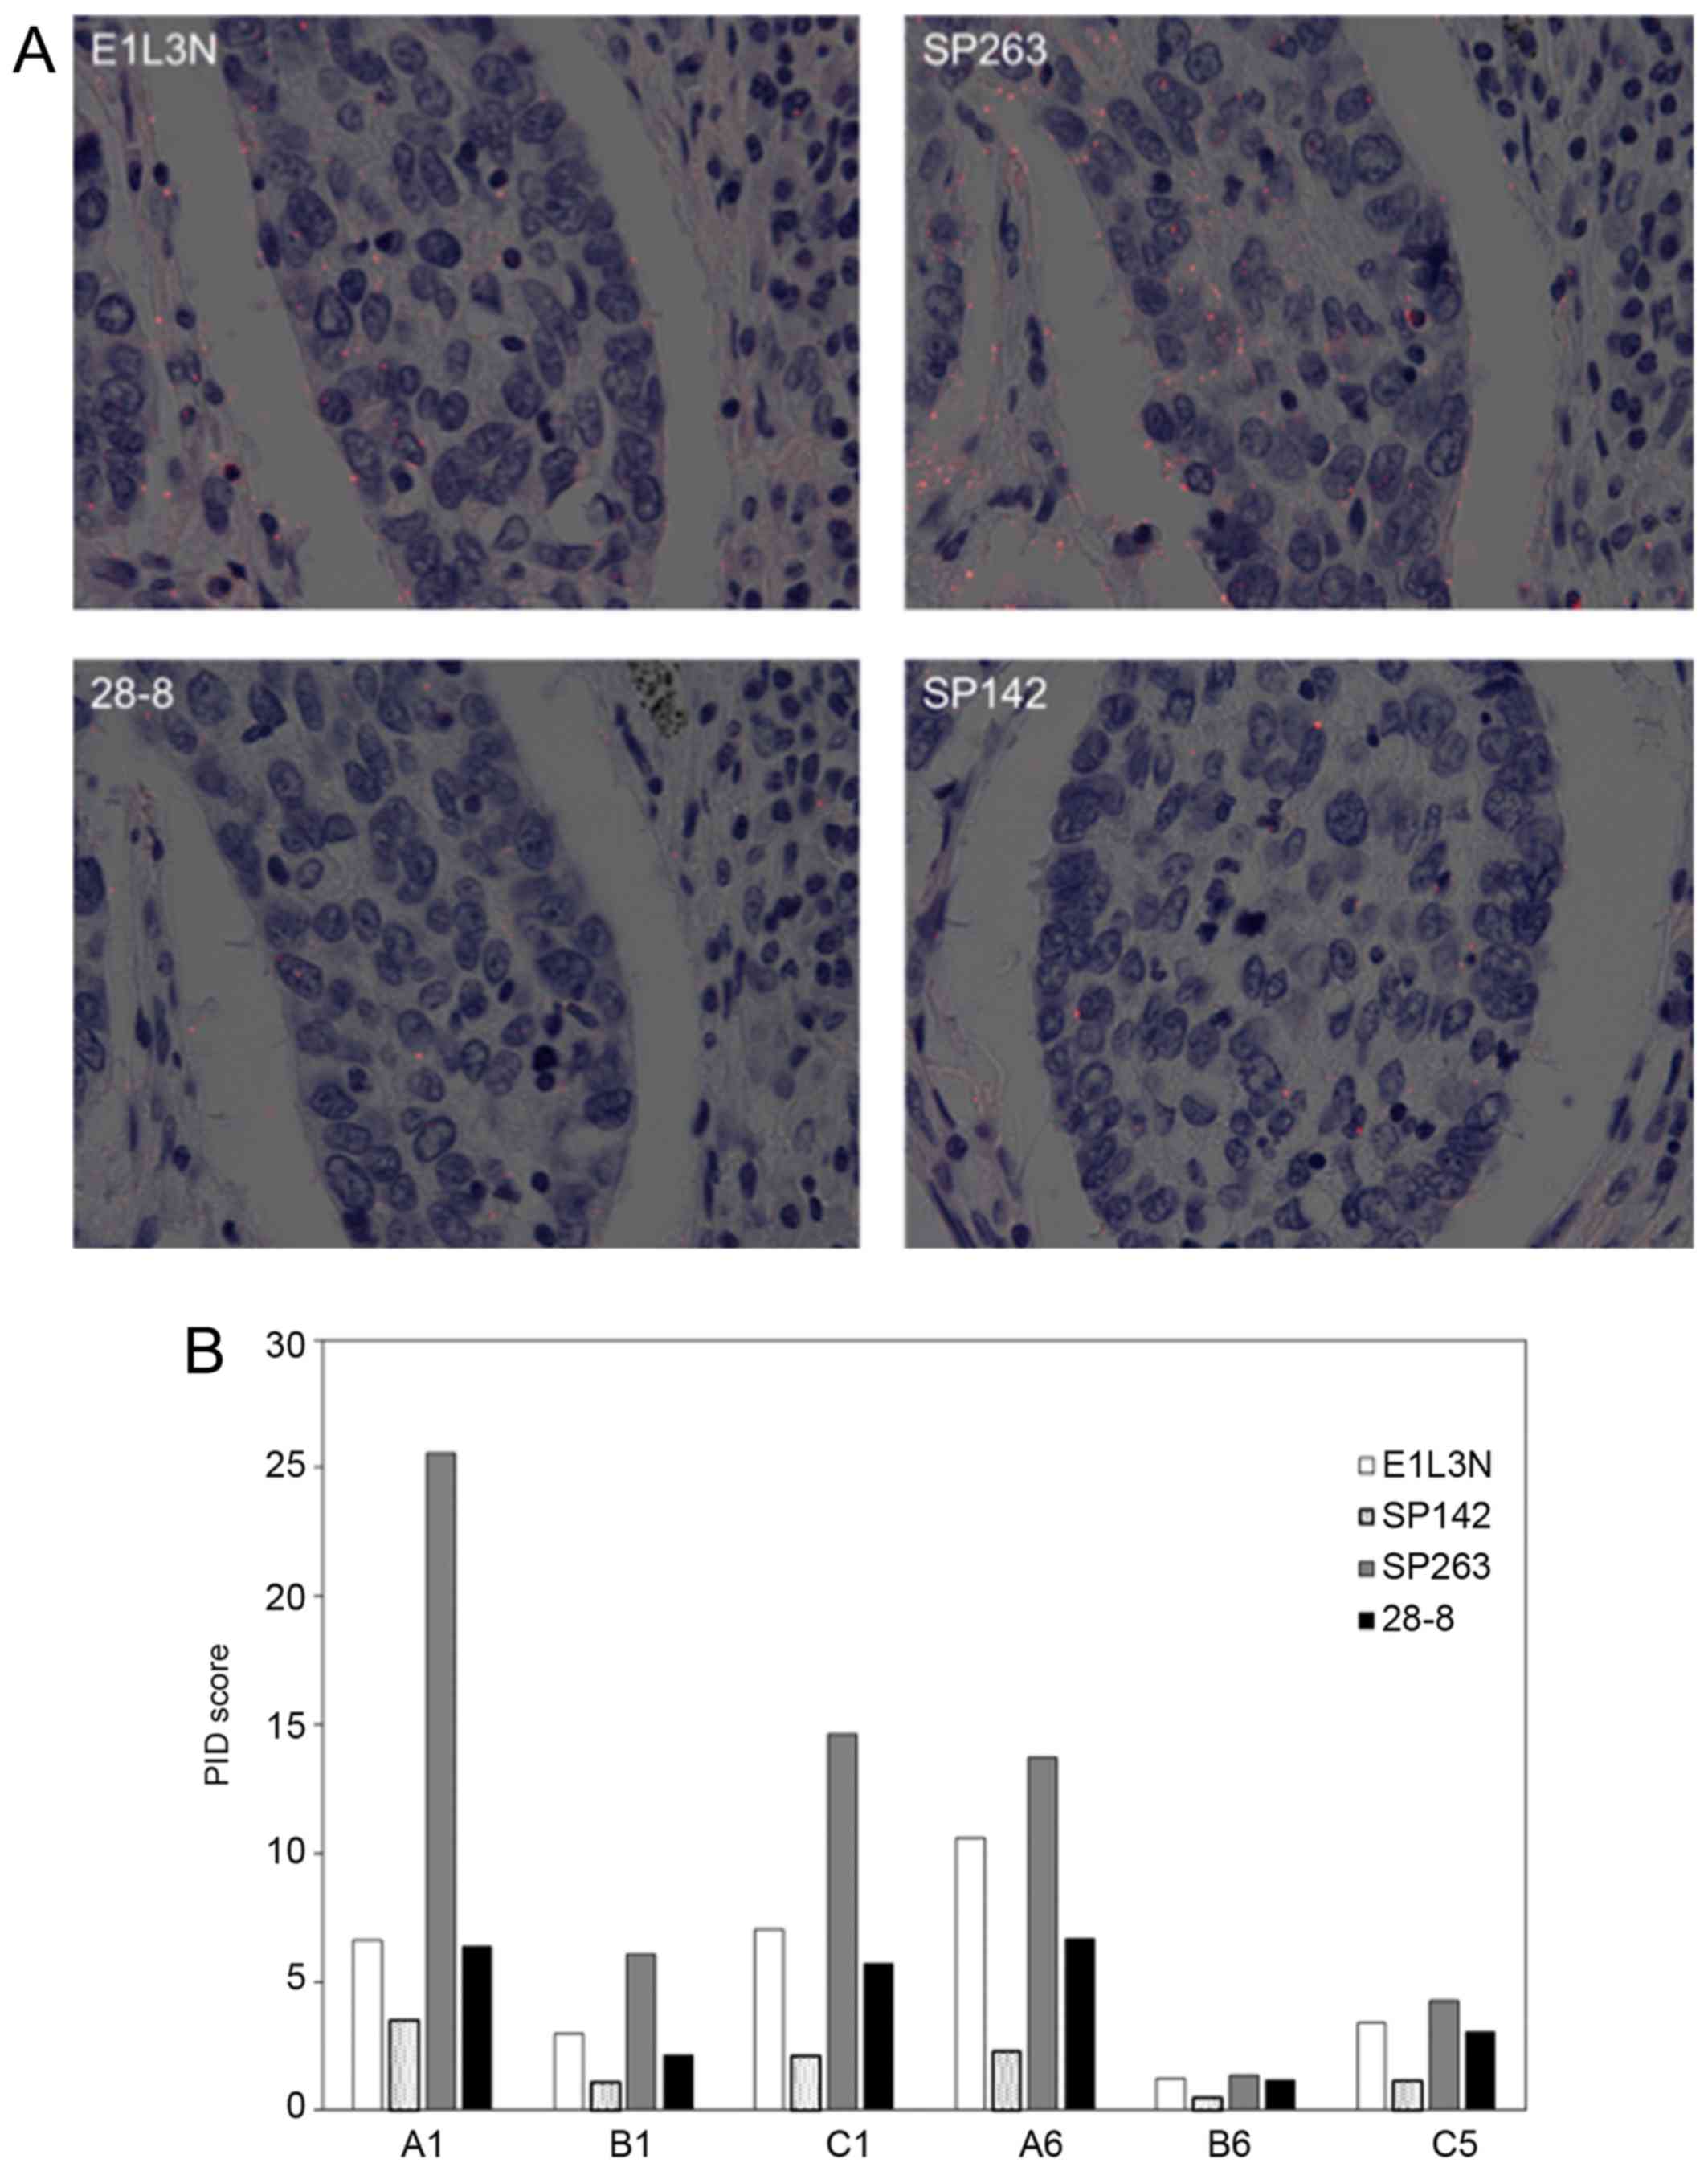
PD-L1 expression in NSCLC
specimen
The representative images of PID for NSCLC are shown
in Fig. 4. All but one core (B8)
showed a similar tendency in average PID score using four primary
antibodies: The score of SP263 was highest and decreased in the
order of E1L3N, 28-8, and SP142.
Discussion
The present study revealed that digital
immunostaining of PD-L1 expression was highly correlated with
protein expression measured by ELISA and quantitative mRNA data
obtained using an nCounter system. Based on digital immunostaining
data of each antibody of PD-L1 in NSCLC specimens, the number of
dots per cell was the lowest for SP142 among the four
antibodies.
In general, mRNA and protein expression levels are
not always closely correlated (8);
however, based on ELISA and the nCounter tests, they showed a
strong correlation in the five cell lines we evaluated. Therefore,
the PD-L1 mRNA expression was tightly linked to the protein
expression. Digital immunostaining data of PD-L1 were highly
correlated with ELISA data as well as nCounter values. The nCounter
system utilizes a novel digital color-coded barcode technology that
is based on direct measurement of gene expression without RT-PCR
and offers high levels of precision and sensitivity (<1 copy per
cell). Each barcode is attached to a single target-specific probe
corresponding to a gene of interest. Thus, the digital
immunostaining data were sufficiently robust for further
analysis.
Although the absolute signal values of PID were
different among the four antibodies, similar linearity between the
PD-L1 protein and mRNA expression was observed for the five cell
lines. The results were similar to those of the Blueprint project
(7) which found lower sensitivity of
SP142 than 22C3, 28-8, and SP263. Digital IHC for PD-L1 in NSCLC
specimens in the current study also revealed that SP142 had the
lowest value. However, the expression pattern was almost the same
as that of the other antibodies. There are many potential reasons
for the lower expression level of SP142, such as different IHC
staining methods, different kits used, truncation of PD-L1 protein,
or different affinity for PD-L1 protein. For PD-L1 diagnostic
agents, as various sensitizing reagents are used after the
secondary antibody reaction (9) it
is difficult to precisely estimate the affinity of the primary
antibody.
Recent analysis revealed that disruption of the
PD-L1 3′-untranslated region in mice ena-bles immune evasion of
EG7-OVA tumor cells with elevated PD-L1 expression (10). In the case of disruption of the PD-L1
3′-untranslated region, PD-L1 expression was detected only with an
antibody directed against the extracellular domain (28–8) but not
the intracellular domain (E1L3N, SP142, and SP263). The current
digital imaging method using PID can compare the affinities of
antibodies in a digital fashion, as the reaction system after the
reaction of the secondary antibody is the same. Thus, the
differences in the PID score are considered to reflect the affinity
of the primary antibody more accurately. Based on our data, the
most reasonable explanation for the lower score of SP142 is its
lower affinity for the PD-L1 antigen.
In clinical settings, only a PD-L1 diagnostic agent
with the antibody 22C3 has been approved for a companion diagnostic
kit for administration of pembrolizumab (6,11). We
attempted to determine the utility of 22C3, but it was difficult to
directly compare the 22C3 antibody and other antibodies because the
22C3 antibody was raised against mice, whereas E1L3N, SP142, SP263,
and 28-8 were raised against rabbits. Although the differences
between mouse and rabbit secondary detection systems in PID
staining can be adjusted for by manipulating the secondary antibody
system, it is difficult to accurately quantify the PID dots. Our
data also indicate that the capability of the E1L3N antibody, which
is mainly used for research (12–15)
rather than as a complementary or companion diagnostic antibody,
was equivalent to that of 28-8 and SP263.
Another benefit of digital immunostaining compared
with immunofluorescence analysis, which is dependent on
fluorescence intensity, is the lack of influence from fading
fluorescence signals over time. Although digital immunostaining
also requires fluorescence microscopy, the technique is independent
of the fluorescence intensity; thus, fluorescence fade does not
affect dot quantitation. In addition, we can simultaneously examine
cell morphology and the number of dots as well as superimpose DAB
staining with the semi transmissive mode.
In conclusion, the results show that digital
immunostaining of PD-L1 provides a sensitive, quantitative,
accurate, and robust assay for measurement of protein expression in
FFPE cell lines and human tissue. Our developed digital
immunostaining assay allows for direct correlation between the
number of dots and amount of biomarker present in the tissue. Thus,
it is potentially a valuable tool for comparing the titer of
different antibodies such as in the Blueprint project as well as
patient selection in daily practice.
Acknowledgements
The authors would like to thank Ms. Aoi Nozawa and
Ms. Yoriko Ikehata (Konica-Minolta, Inc., Tokyo, Japan) for their
technical assistance.
Funding
The present study was funded by The Yasuko Shiozaki
Grant awarded by the Alumni Association of Kansai Medical
University (Osaka, Japan; grant no. 2017-27).
Availability of data and materials
All data generated or analyzed during this study are
included in this published article.
Authors contributions
KT designed the study and drafted the manuscript.
KN, MT, HO and YN analyzed and interpreted the data regarding the
cell lines. TF, MY, KS, HY and HI performed the digital
immunostaining examinations, and assisted in the preparation of the
manuscript. TF was a major contributor in writing the manuscript.
All authors contributed to data collection and interpretation,
critically revised the manuscript for important intellectual
content, and read and approved the final manuscript.
Ethics approval and consent to
participate
Not applicable.
Patient consent for publication
Not applicable.
Competing interests
The authors Kenji Nishikawa, Masaru Takahashi,
Hisatake Okada and Yasushi Nakano are affiliated with
Konica-Minolta, Inc., (Tokyo, Japan). The software PidAnalyzer
v.2.14.1.1 used for data analysis in the present study was supplied
by this company. The authors declare that they have no competing
interests.
References
|
1
|
Gonda K, Miyashita M, Watanabe M,
Takahashi Y, Goda H, Okada H, Nakano Y, Tada H, Amari M and Ohuchi
N: Development of a quantitative diagnostic method of estrogen
receptor expression levels by immunohistochemistry using organic
fluorescent material-assembled nanoparticles. Biochem Biophys Res
Commun. 426:409–414. 2012. View Article : Google Scholar : PubMed/NCBI
|
|
2
|
Gonda K, Watanabe M, Tada H, Miyashita M,
Takahashi-Aoyama Y, Kamei T, Ishida T, Usami S, Hirakawa H,
Kakugawa Y, et al: Quantitative diagnostic imaging of cancer
tissues by using phosphor-integrated dots with ultra-high
brightness. Sci Rep. 7:75092017. View Article : Google Scholar : PubMed/NCBI
|
|
3
|
Yamaki S, Yanagimoto H, Tsuta K, Ryota H
and Kon M: PD-L1 expression in pancreatic ductal adenocarcinoma is
a poor prognostic factor in patients with high CD8+
tumor-infiltrating lymphocytes: Highly sensitive detection using
phosphor-integrated dot staining. Int J Clin Oncol. 22:726–733.
2017. View Article : Google Scholar : PubMed/NCBI
|
|
4
|
Topalian SL, Taube JM, Anders RA and
Pardoll DM: Mechanism-driven biomarkers to guide immune checkpoint
blockade in cancer therapy. Nat Rev Cancer. 16:275–287. 2016.
View Article : Google Scholar : PubMed/NCBI
|
|
5
|
Topalian SL, Hodi FS, Brahmer JR,
Gettinger SN, Smith DC, McDermott DF, Powderly JD, Carvajal RD,
Sosman JA, Atkins MB, et al: Safety, activity, and immune
correlates of anti-PD-1 antibody in cancer. N Engl J Med.
366:2443–2454. 2012. View Article : Google Scholar : PubMed/NCBI
|
|
6
|
Reck M, Rodríguez-Abreu D, Robinson AG,
Hui R, Csőszi T, Fülöp A, Gottfried M, Peled N, Tafreshi A, Cuffe
S, et al: KEYNOTE-024 Investigators: Pembrolizumab versus
chemotherapy for PD-L1-positive non-small-cell lung cancer. N Engl
J Med. 375:1823–1833. 2016. View Article : Google Scholar : PubMed/NCBI
|
|
7
|
Hirsch FR, McElhinny A, Stanforth D,
Ranger-Moore J, Jansson M, Kulangara K, Richardson W, Towne P,
Hanks D, Vennapusa B, et al: PD-L1 immunohistochemistry assays for
lung cancer: Results from phase 1 of the Blueprint PD-L1 IHC assay
comparison project. J Thorac Oncol. 12:208–222. 2017. View Article : Google Scholar : PubMed/NCBI
|
|
8
|
Chen G, Gharib TG, Huang CC, Taylor JM,
Misek DE, Kardia SL, Giordano TJ, Iannettoni MD, Orringer MB,
Hanash SM, et al: Discordant protein and mRNA expression in lung
adenocarcinomas. Mol Cell Proteomics. 1:304–313. 2002. View Article : Google Scholar : PubMed/NCBI
|
|
9
|
Skaland I, Nordhus M, Gudlaugsson E, Klos
J, Kjellevold KH, Janssen EA and Baak JP: Evaluation of 5 different
labeled polymer immunohistochemical detection systems. Appl
Immunohistochem Mol Morphol. 18:90–96. 2010. View Article : Google Scholar : PubMed/NCBI
|
|
10
|
Kataoka K, Shiraishi Y, Takeda Y, Sakata
S, Matsumoto M, Nagano S, Maeda T, Nagata Y, Kitanaka A, Mizuno S,
et al: Aberrant PD-L1 expression through 3′-UTR disruption in
multiple cancers. Nature. 534:402–406. 2016. View Article : Google Scholar : PubMed/NCBI
|
|
11
|
Garon EB, Rizvi NA, Hui R, Leighl N,
Balmanoukian AS, Eder JP, Patnaik A, Aggarwal C, Gubens M, Horn L,
et al KEYNOTE-001 Investigators, : Pembrolizumab for the treatment
of non-small-cell lung cancer. N Engl J Med. 372:2018–2028. 2015.
View Article : Google Scholar : PubMed/NCBI
|
|
12
|
Mori H, Kubo M, Yamaguchi R, Nishimura R,
Osako T, Arima N, Okumura Y, Okido M, Yamada M, Kai M, et al: The
combination of PD-L1 expression and decreased tumor-infiltrating
lymphocytes is associated with a poor prognosis in triple-negative
breast cancer. Oncotarget. 8:15584–15592. 2017. View Article : Google Scholar : PubMed/NCBI
|
|
13
|
Ameratunga M, Asadi K, Lin X, Walkiewicz
M, Murone C, Knight S, Mitchell P, Boutros P and John T: PD-L1 and
tumor infiltrating lymphocytes as prognostic markers in resected
NSCLC. PLoS One. 11:e01539542016. View Article : Google Scholar : PubMed/NCBI
|
|
14
|
Twyman-Saint Victor C, Rech AJ, Maity A,
Rengan R, Pauken KE, Stelekati E, Benci JL, Xu B, Dada H, Odorizzi
PM, et al: Radiation and dual checkpoint blockade activate
non-redundant immune mechanisms in cancer. Nature. 520:373–377.
2015. View Article : Google Scholar : PubMed/NCBI
|
|
15
|
McLaughlin J, Han G, Schalper KA,
Carvajal-Hausdorf D, Pelekanou V, Rehman J, Velcheti V, Herbst R,
LoRusso P and Rimm DL: Quantitative assessment of the heterogeneity
of PD-L1 expression in non-small-cell lung cancer. JAMA Oncol.
2:46–54. 2016. View Article : Google Scholar : PubMed/NCBI
|