Open Access

Overexpression of ECT2 is a strong poor prognostic factor in ER(+) breast cancer

  • Authors:
    • Yingying Xiu
    • Wei Liu
    • Tianyi Wang
    • Yi Liu
    • Minwen Ha
  • View Affiliations

  • Published online on: March 20, 2019     https://doi.org/10.3892/mco.2019.1832
  • Pages: 497-505
  • Copyright: © Xiu et al. This is an open access article distributed under the terms of Creative Commons Attribution License.

Metrics: Total Views: 0 (Spandidos Publications: | PMC Statistics: )
Total PDF Downloads: 0 (Spandidos Publications: | PMC Statistics: )


Abstract

Epithelial cell transforming sequence 2 (ECT2) is a guanine nucleotide exchange factor encoded by the ECT2 gene, which is located on the 3q26.31 chromosomal region and is directly associated with the occurrence of cancers. The aim of the present study was to examine the expression and prognostic importance of ECT2 in various breast cancer subtypes using the online tools, Gene Expression Profiling Interactive Analysis, Kaplan‑Meier‑plotter and bc‑GenExMiner. ECT2 mRNA expression was significantly different in oestrogen receptor ER(+) breast cancer; overexpression of ECT2 was associated with poor prognosis in ER+ breast cancer. The mRNA expression levels of ECT2 were increased in basal‑like breast cancer and triple negative breast cancer, but were not significant for prognostic prediction. We identified ECT2‑correlated genes and their corresponding Gene Ontology (GO) enrichment terms. The results revealed that GO: 0005524 (protein binding) had the greatest number of correlated genes and also contained ECT2. This suggested that overexpression of ECT2 may be a significant prognostic factor for poor outcome in ER+ breast cancer; however, the precise role of ECT2 in breast cancer requires further investigation.

Introduction

Breast cancer is the second most common type of cancer worldwide, with the highest incidence and leading cause of mortality in females (1). According to data from Globocan, ~1.67 million novel cases of breast cancer were diagnosed in 2012 (2). The rates of incidence vary between less developed and developed countries, with rates ranging from 27 cases per 100,000 in Central Africa and Eastern Asia compared with 96 cases per 100,000 in Western Europe (2). In China, the largest developing and highly populated country worldwide, and has a low incidence of breast cancer; however, the burden of breast cancer in China is increasing annually (3). In 2008, 169,452 novel cases of breast cancer and 44,908 breast cancer-associated mortalities in China were reported, accounting for 12.2% of cases and 9.6% of associated mortalities globally (4). At present, the 5-year survival rate for primary breast cancer is relatively high, at 92% (5); however, the survival rate of patients with metastatic breast cancer remains <25% (2,5). Developments concerning the pathogenesis of breast cancer have been made, yet few drugs for the treatment of breast cancer exhibit satisfactory outcomes. Therefore, investigating the occurrence and development of breast cancer is a primary research objective.

Epithelial cell transforming sequence 2 (ECT2) is a guanine nucleotide exchange factor encoded by the ECT2 gene in humans and is directly associated with the occurrence of cancers (6). ECT2 is primarily upregulated in certain cancers and is considered a major oncogene involved in the onset or progression of cancer (7,8). In ovarian cancers, ECT2 mRNA is frequently amplified, and the protein is highly expressed in the nucleus but not in the cytoplasm in advanced disease; ECT2 acts as a Rho guanine nucleotide exchange factor specifically within the nucleus to drive ovarian cancer cell transformation (9). In breast cancer cells, ECT2 serves a significant role in the progression of breast cancer (10); however, the effects of ECT2 on the prognosis of different molecular types of breast cancer remains unclear. In the present study, Breast Cancer Gene-Expression Miner v4.1 (11), was employed to analyse the expression of ECT2 in various types of breast cancer. The aim of our study was to investigate whether ECT2 expression could predict the prognosis of different types of breast cancer.

Materials and methods

Gene expression levels of ECT2

We obtained the RNA sequence and expression profile of ECT2 in normal and tumour tissues from Gene Expression Profiling Interactive Analysis (GEPIA; http://gepia.cancer-pku.cn/index.html, using a standard system to analyse 9,736 tumour and 8,587 normal samples from the Cancer Genome Atlas (TCGA; http://cancergenome.nih.gov/) and Genotype-Tissue Expression projects (12). The differential expression of ECT2 across PAM50 subtypes, oestrogen receptor (ER, −/+) and basal-like and/or triple negative breast cancers (TNBCs), were analysed using bc-GenExMiner v4.1 (http://bcgenex.centregauducheau.fr/BC-GEM/GEM-Accueil.php?js=1), a web-based tool with a MySQL relational database. Subsequently, boxplots were created to visualize the results. There were 32 datasets with containing ECT2 expression data of 5,277 patients for analysis; gene correlation analysis was conducted using data from 36 datasets.

Survival analysis of patients with breast cancer associated with ECT2

The association between the expression of ECT2, and the overall survival (OS) and progression-free survival (PFS) in patients with breast cancer was determined using Kaplan-Meier-plotter (KM plotter, http://kmplot.com/analysis/), which can analyse 54,675 genes with respect to survival using 10,461 cancer samples (13). The longest follow up was conducted for 300 months. OS data for patients with ER (−/+), different grades and basal-like and/or TNBCs were obtained from KM plotter and bc-GenExMiner v4.1, with a MySQL relational database (11,13). A total of 5,206 patients from 32 datasets were used for prognostic analysis with respect to ECT2 with any nodal status, ER status and any event (AE).

Univariate Cox analysis of ECT2

Univariate cox analysis was conducted with data of ECT2 for the survival of patients with breast cancer and basal-like and/or TNBC using bc-GenExMiner v4.1, with a MySQL relational database (11).

Correlation between ECT2 and Gene Ontology (GO) ‘biological process’ enrichment

Using bc-GenExMiner v4.1 with a MySQL relational database, we determined genes that were correlated with ECT2 and performed corresponding GO ‘biological process’ enrichment analysis (12).

Statistical analysis

Data are presented as the mean ± standard deviation. The survival plot was generated by GEPIA and the Log-rank test was used for comparison of survival curves. Kaplan-Meier survival curves and univariate Cox analysis were conducted via bc-GenEx-Miner v4.1 to analyse the association between ECT2 expression and ER. Box and whiskers plots were used to compare ECT2 expression among the different population groups by bc-GenEx-Miner v4.1 and a Welch's test. In addition, when there were at least three different groups, Dunnett-Tukey-Kramer's test was used for two-by-two comparisons. P<0.05 was considered to indicate a statistically significant difference.

Results

ECT2 expression in different types of breast cancer tissue and normal breast tissues

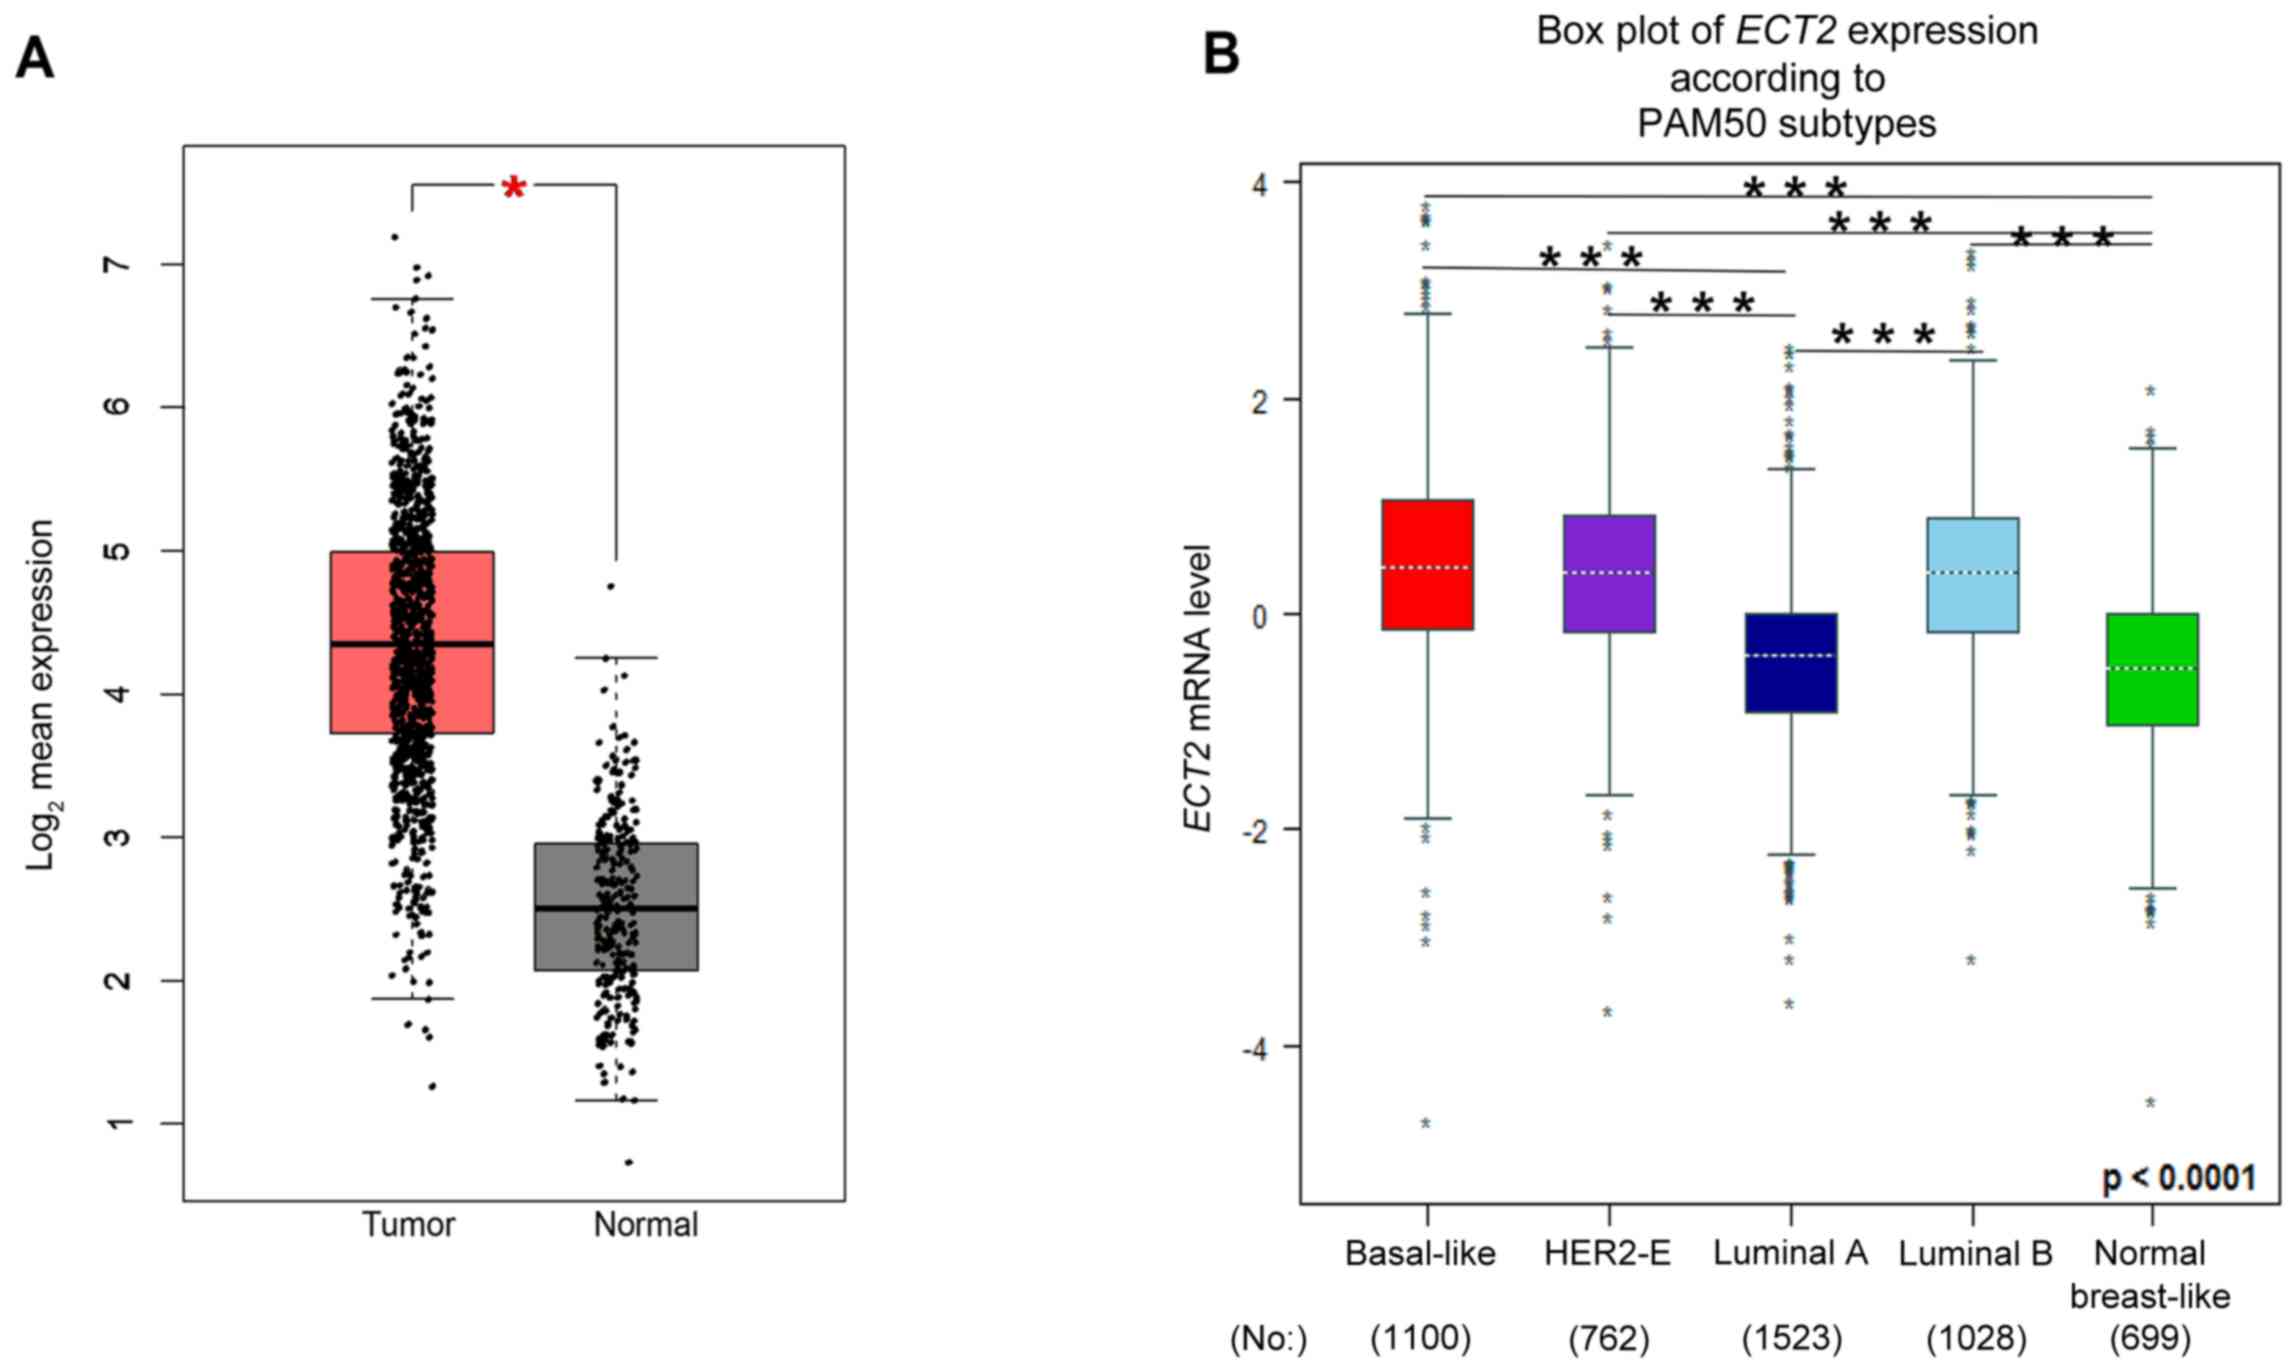
Using GEPIA expression analysis, it was revealed that the expression of ECT2 was significantly higher in breast cancer tissues compared with normal breast tissues (P<0.0001; Fig. 1A). We used bc-GenExMiner to demonstrate that ECT2 expression significantly varied in PAM50 subtypes (P<0.0001; Fig. 1B), and basal-like breast cancer exhibited higher ECT2 expression than all other subtypes.

OS and PFS of patients with breast cancer exhibiting high and low expression levels of ECT2

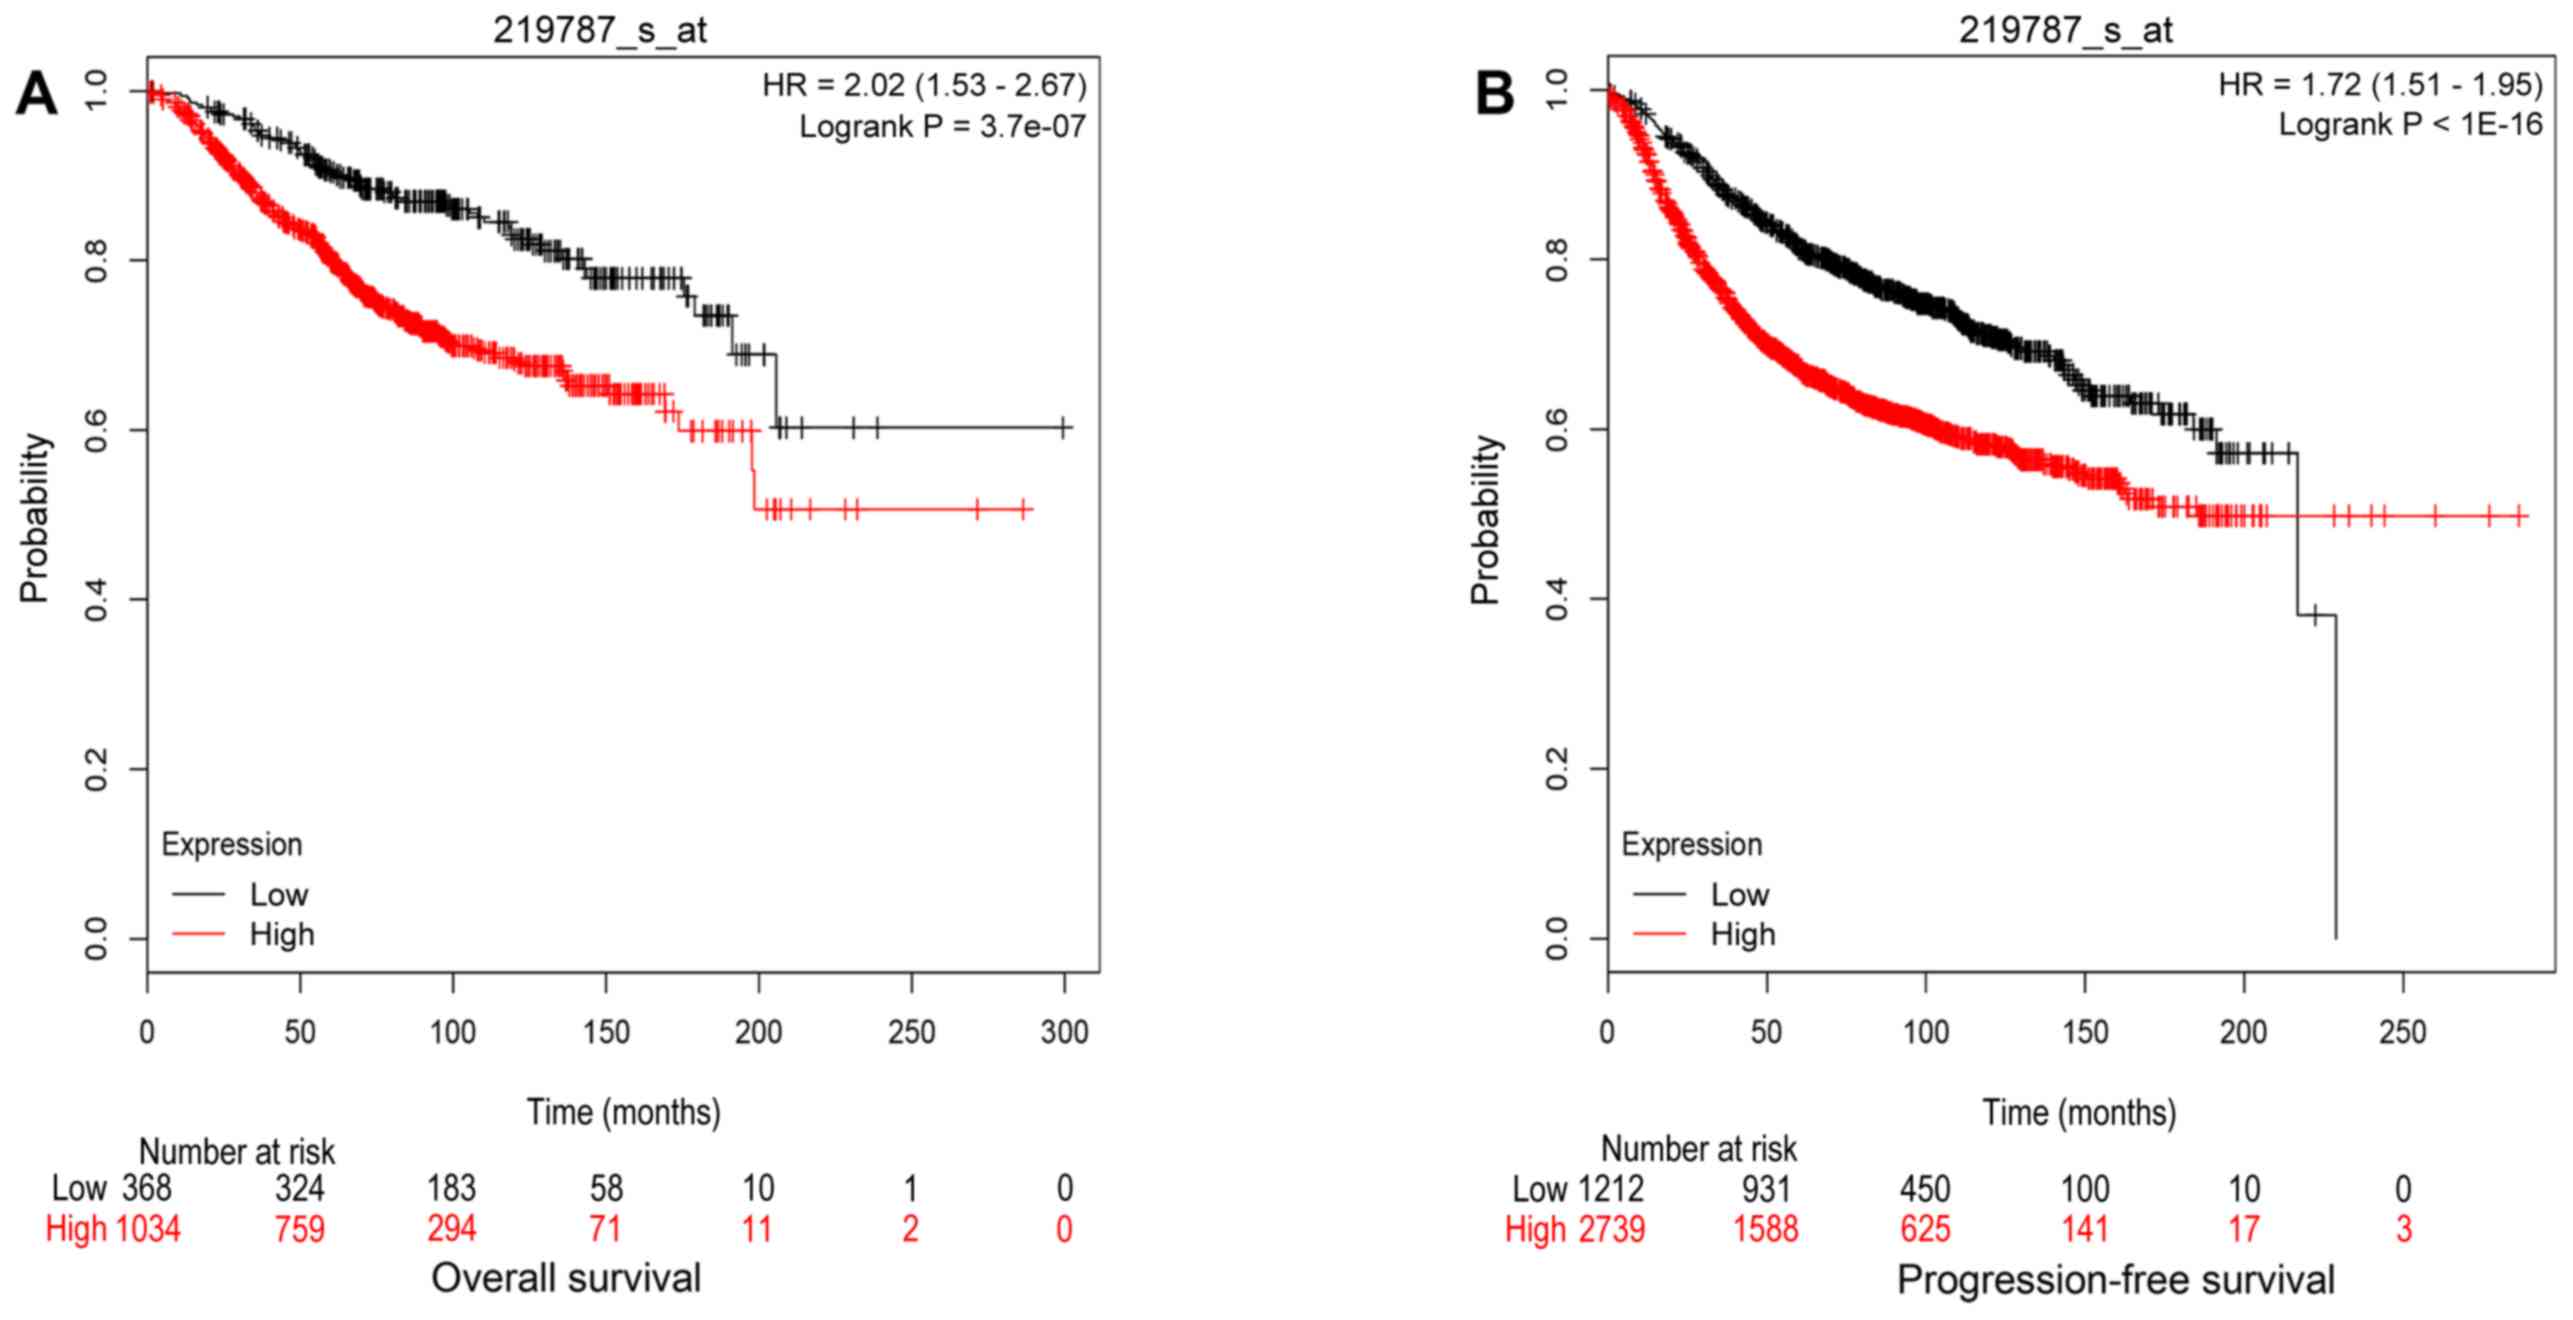
Survival analysis from the Kaplan-Meier-plotter was employed to confirm whether high ECT2 expression was associated with significantly worse OS (P=3.7×10⁻⁷; Fig. 2A) and PFS (P<1×10⁻¹⁶; Fig. 2B) in patients with breast cancer. The results indicates that ECT2 expression was associated with significantly worse PFS and OS. As presented in Fig. 2B that the patient with the longest follow-up succumbed to mortality. All observed subjects succumbed by the last time point in the low ECT2 expression group; however, high ECT2 expression was associated with significantly worse PFS.

ECT2 expression and OS in patients with ER+ and ER− breast cancer

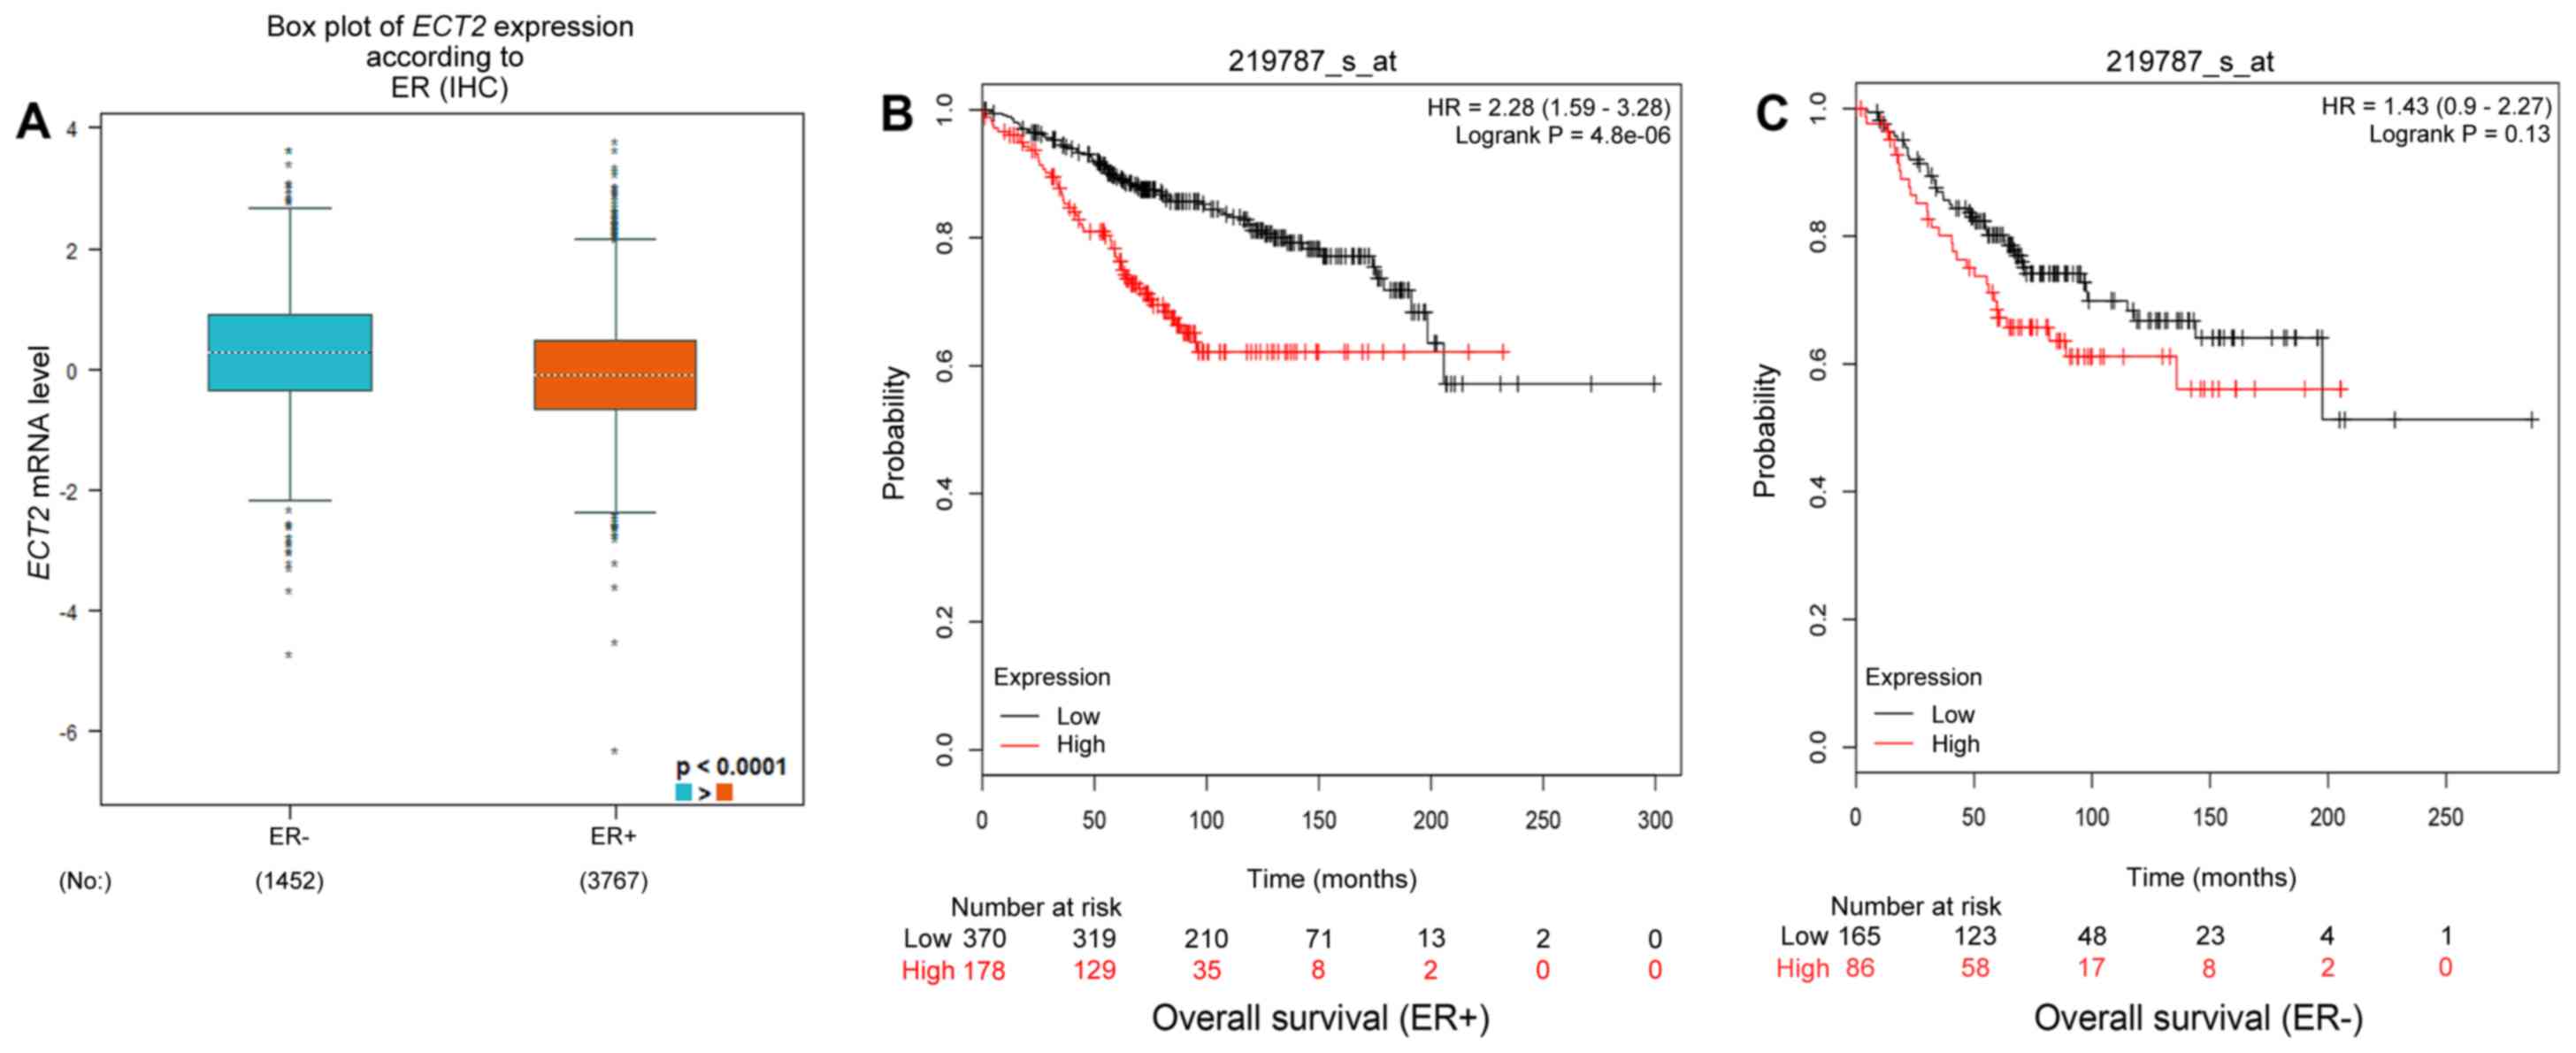
There were 12 significant results (P<0.05) among the 18 total findings from the Univariate Cox analysis from bc-GenExMiner v4.1 data (Table I). ECT2 mRNA expression was significantly different between patients with ER+ and ER breast cancer (Fig. 3A); ECT2 expression was upregulated in ER breast cancer than in ER+ breast cancer. On the contrary, the present study reported that higher expression levels of ECT2 were associated with poor prognosis in breast cancer in the mixed nodal status (Nm)/ER+/AE, Nm/ER+/MR, Nm/mixed ER status (ERm)/AE, Nm/ERm/MR, negative nodal status (N)/ER+/MR, N/ER+/AE, N/ERm/AE, N/ERm/MR, positive nodal status (N+)/ER+/MR and N+/ER+/AE subtypes, particularly in ER+ breast cancer, high expression of ECT2 is associated with poor prognosis in all ER+ breast cancers. In addition, we observed that high ECT2 expression was associated with significantly worse OS in patients with ER+ breast cancer (Fig. 3B), while the expression of ECT2 in patients with ER breast cancer was not significantly associated with survival (Fig. 3C).

Table I.

Univariate Cox analysis of ECT2 for the survival of the patients with breast cancer.

Table I.

Univariate Cox analysis of ECT2 for the survival of the patients with breast cancer.

No.Nodal statusER statusEvent statusP-valueHazard ratio95% CINo. patientsNo. events
  1NmER+AE <0.00011.321.24–1.413,7221,177
  2NmER+MR <0.00011.481.36–1.612,711652
  3NmERmAE <0.00011.24 1.18–1.305,2061,750
  4NmERmMR <0.00011.32 1.23–1.413,751979
  5N-ER+MR <0.00011.62 1.43–1.841,358310
  6N-ER+AE <0.00011.45 1.31–1.601,740502
  7N-ERmAE <0.00011.31 1.21–1.422,385717
  8N-ERmMR <0.00011.40 1.27–1.541,841448
  9N+ER+MR <0.00011.42 1.20–1.67662198
10N+ER+AE   0.00021.26 1.12–1.431,033397
11N+ERmMR   0.00101.23 1.09–1.39951314
12N+ERmAE   0.00461.15 1.04–1.261,466606
13N+ER-AE   0.28710.920.79–1.07426208
14N+ER-MR   0.35610.920.76–1.10283115
15N-ER-AE   0.70961.030.89–1.18622211
16N-ER-MR   0.835911.020.86–1.21466137
17NmER-AE   0.91811.000.92–1.101,439563
18NmER-MR   0.94621.000.89–1.111,014323

[i] Bold font indicates significant findings. ECT2, epithelial cell transforming sequence 2; CI, confidence interval; AE, any event; MR, metastatic relapse; ER, oestrogen receptor status; N, nodal status; +, positive; -, negative; m, mixed.

ECT2 expression and OS in patients with basal-like breast cancer and/or TNBC

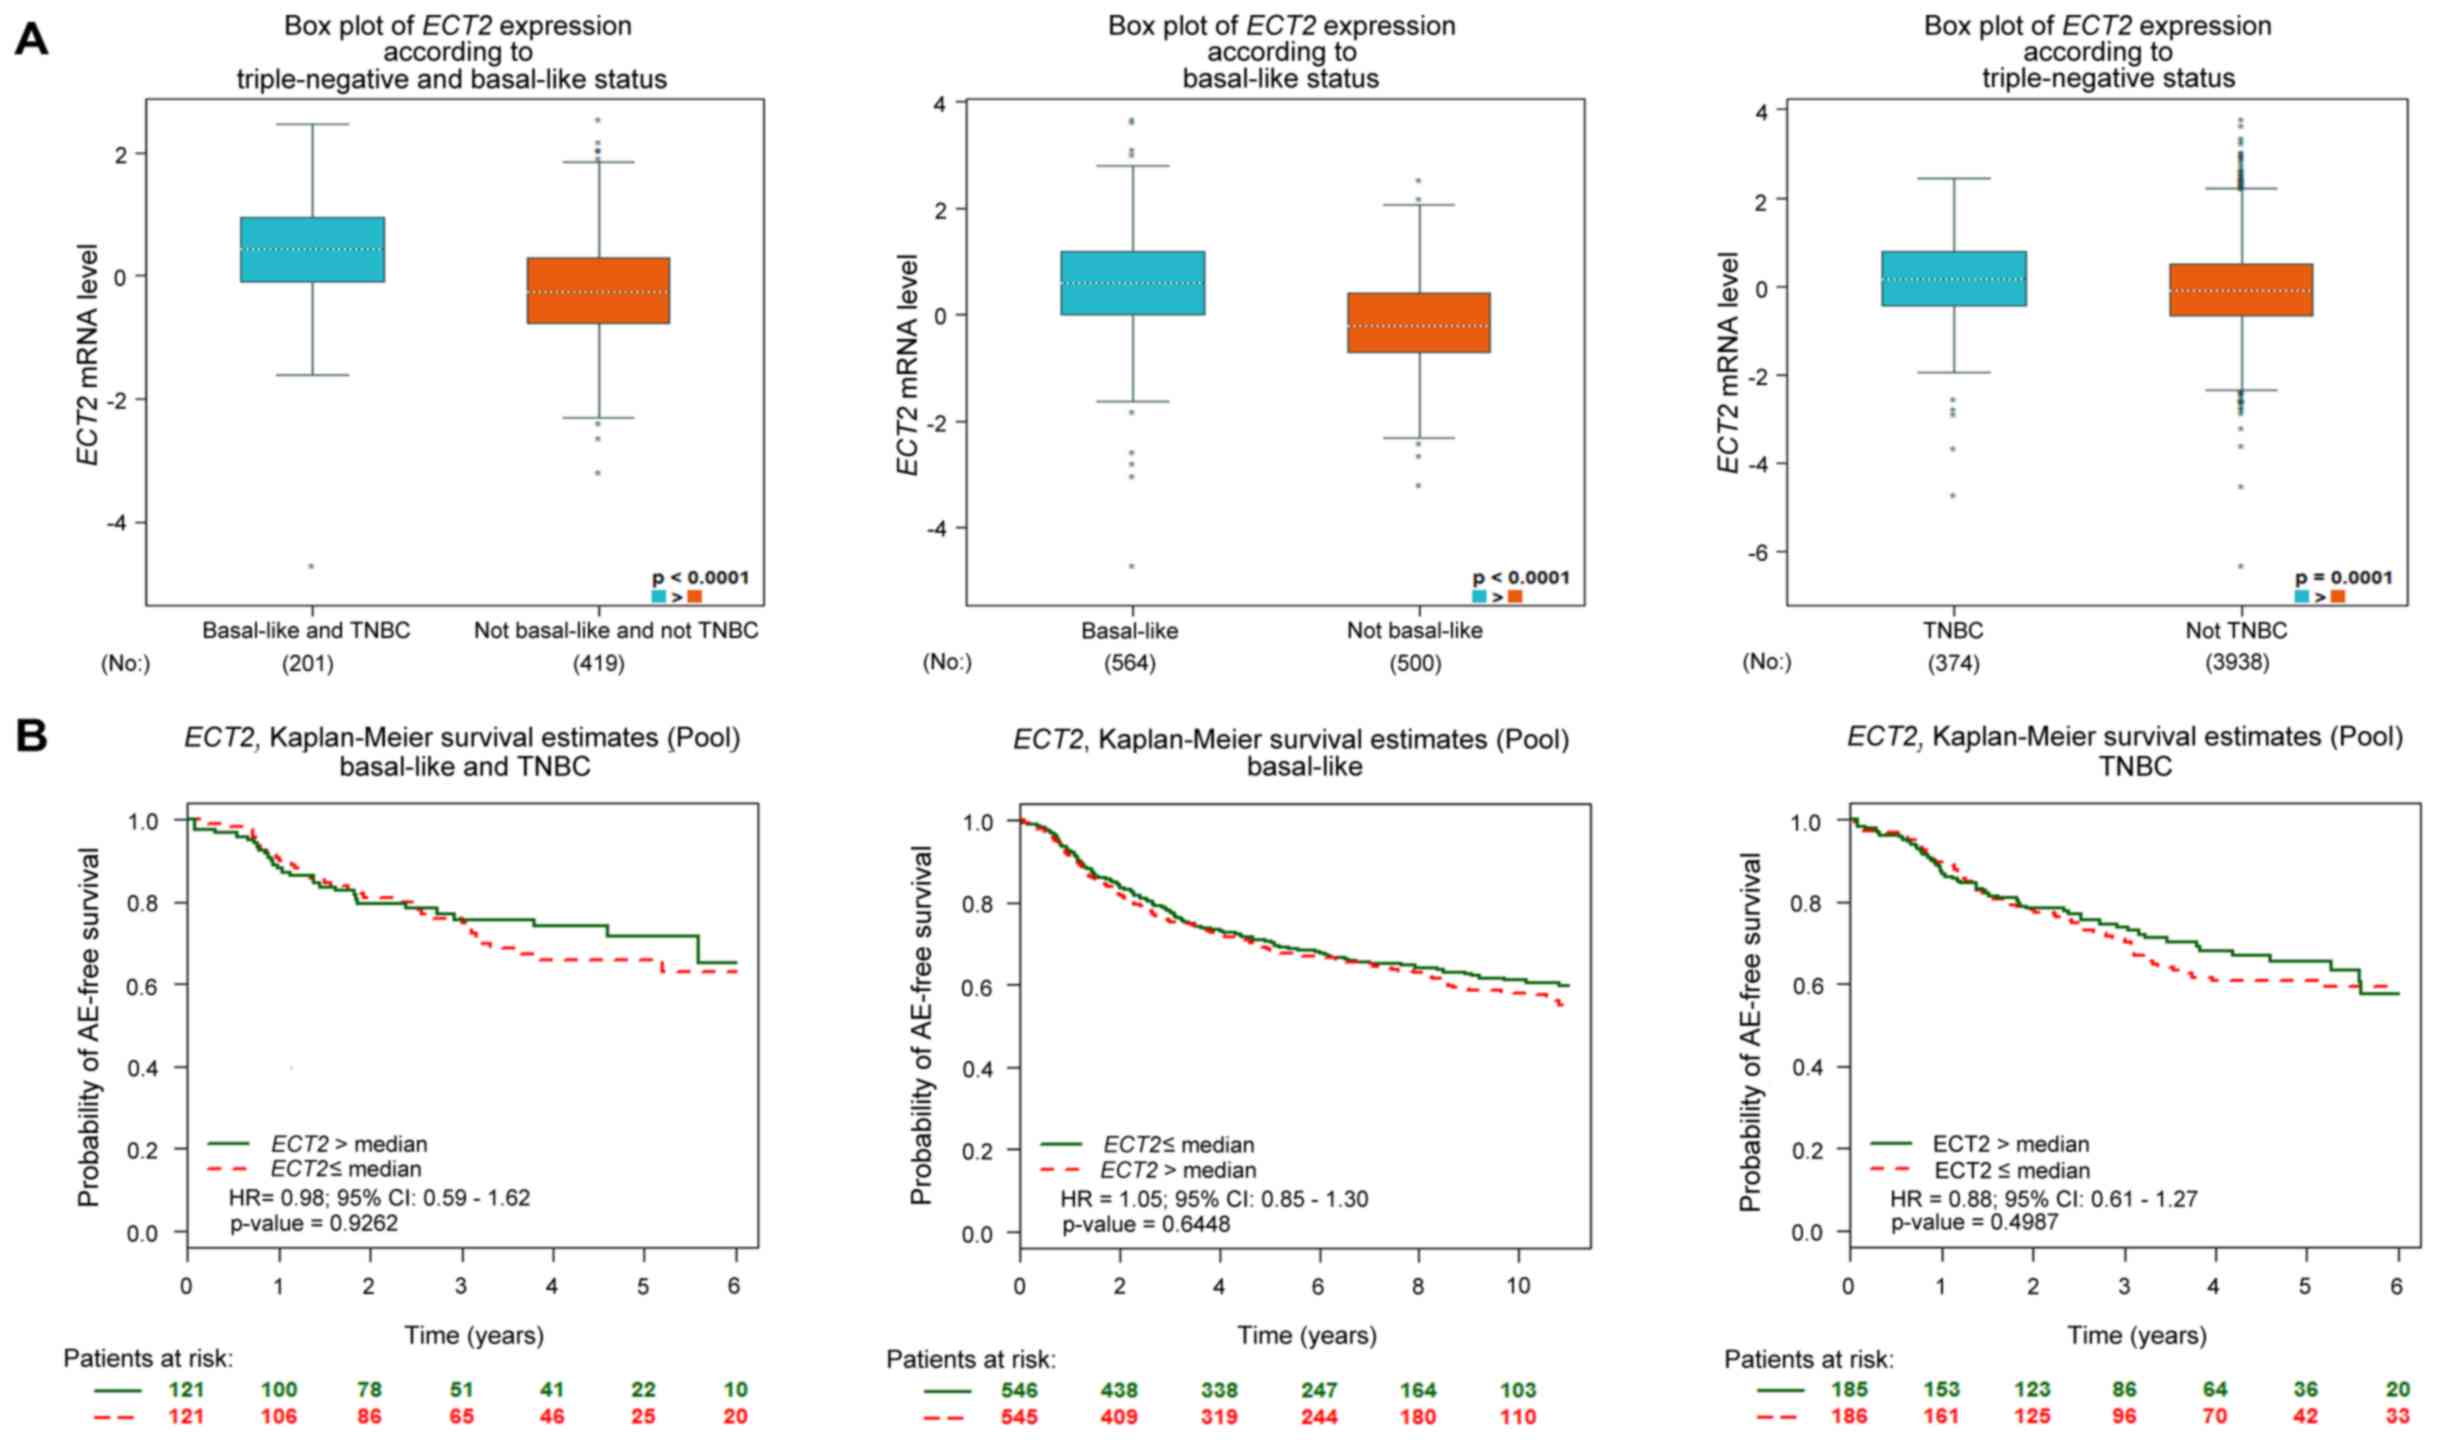
There were no significant differences (P>0.05) among the three total results from univariate Cox analysis of ECT2 for the survival of patients with basal-like and/or TNBC from bc-GenExMiner v4.1 data (Table II). Significant differences in the expression of ECT2 mRNA between patients with basal-like breast cancer and/or TNBC were observed. The expression levels of ECT2 mRNA in patients with basal-like breast cancer and/or TNBC were upregulated than in patients without these subtypes (P<0.05; Fig. 4A). In addition, the expression of ECT2 was not associated with OS in basal-like breast cancer and/or TNBC with concomitant AE via KM analysis (P>0.05; Fig. 4B).

Table II.

Univariate Cox analysis of ECT2 for the survival of the patients with basal-like and/or triple negative breast cancer.

Table II.

Univariate Cox analysis of ECT2 for the survival of the patients with basal-like and/or triple negative breast cancer.

PopulationP-valueHazard ratio95% CINo. patientsNo. events
Basal-like0.26091.070.95–1.191,091384
TNBC0.35100.910.76–1.10   371120
Basal-like and TNBC0.62291.070.81–1.42   242  66

[i] ECT2, epithelial cell transforming sequence 2; CI, confidence interval.

Genes correlated with ECT2

The top 10 closest positive/negative correlations with ECT2 were identified via extensive gene correlation analysis of breast cancer (Table III). Then, GO enrichment analysis was performed for the genes correlated with ECT2 via bc-GenExMiner (Table IV). Among them, GO:0005524 (protein binding) had the greatest number of associated genes and also contained ECT2 itself.

Table III.

The top 10 positive and/or negative genes correlated with ECT2.

Table III.

The top 10 positive and/or negative genes correlated with ECT2.

Positive correlationsNegative correlations


GeneP-valueNo. patientsGene symbolP-valueNo. patients
PRINS <0.0001a155LOC100507412<0.0001155
CDK1 <0.0001a5,277LINC01660<0.0001155
SMC4 <0.0001a5,277LOC286161<0.0001214
CENPW <0.0001a2,607IGHV5-78<0.0001206
CLPSL1 <0.0001a139TARP0.0003  51
CEP55 <0.0001a5,277TRBV190.0011  50
RPL39P5 <0.0001a139MIR600HG<0.0001400
MELK <0.0001a5,277USP17L6P<0.0001135
RFC4 <0.0001a5,277BMS1P21<0.0001326
RRM2 <0.0001a5,106AARSD10.0013  59

a P<0.05. AARSD1, alanyl-tRNA synthetase domain containing 1; BMS1P21, BMS1, ribosome biogenesis factor pseudogene 21; CDK1, cyclin-dependent kinase 1; CEP55, centrosomal protein 55; CENPW, centromere protein W; CLPSL1, colipase like 1; ECT2, epithelial cell transforming sequence 2; IGHV5-78, immunoglobulin heavy variable 5–78; LINC01660, long intergenic non-protein coding RNA 1660; PRINS, psoriasis associated non-protein coding RNA induced by stress; MELK, maternal embryonic leucine zipper kinase; RFC4, replication factor C subunit 4; RPL39P5, ribosomal protein L39 pseudogene 5; RRM2, ribonucleotide reductase regulatory subunit 2; SMC4, structural maintenance of chromosomes 4; TARP, TCR γ alternate reading frame protein; TRBV19, T cell receptor β variable 19; USP17L6P, ubiquitin carboxyl-terminal hydrolase 17-like protein 6.

Table IV.

GO enrichment of genes correlated with ECT2.

Table IV.

GO enrichment of genes correlated with ECT2.

GO termsDescriptionP-valueAssociated genes
Biological process
  GO: 0051301Cell division <0.0001aCDK1, SMC4, CENPW, CCNB1, MAD2L1, NEK2, BUB1B, NCAPG, KIF18B, FBXO5, KIF11, FAM83D, CKS2, CCNA2, CDCA8, UBE2C, KIF14, ZWINT, CCNE2, PTTG1, TPX2, CENPF, OIP5, SMC2, NDC80, KNSTRN, AURKA, CDC20, ERCC6L, NCAPH, CDCA2, KIF2C, NUF2, GPSM2, CKS1B, CDCA3, SPAG5, BIRC5, MASTL, SGO2, CCNB2, CENPE, NCAPG2, BUB1, SKA3, CDCA5, KIFC1
  GO: 00007062Sister chromatid cohesion <0.0001aMAD2L1, BUB1B, CDCA8, ZWINT, CENPA, CENPF, NDC80, CDC20, ERCC6L, KIF2C, NUF2, CENPK, CENPL, BIRC5, CENPU, SGO2, KIF18A, CENPE, CENPM, CENPN, BUB1, CDCA5
  GO: 0000278Mitotic cell cycle <0.0001aCENPW, NEK2, BUB1B, PBK, KIF18B, KIF11, TPX2, CENPF, NDC80, AURKA, KIF2C, NUF2, KIF15, MASTL, RAB6C, CENPE, SKA3, CDCA5
  GO: 0000070Mitotic sister chromatid segregation <0.0001aSMC4, MAD2L1, NEK2, NUSAP1, KIF18B, ZWINT, NDC80, KNSTRN, SPAG5, ESPL1, KIFC1
Cellular component
  GO: 0005654Nucleoplasm <0.0001aCDK1, SMC4, CENPW, RFC4, ANLN, FANCI, KPNA2, CCNB1, MAD2L1, NEK2, PRC1, UBE2T, RACGAP1, FBXO5, DTL, RAD51AP1, TOP2A, CCNA2, KIF4A, CDCA8, UBE2C, KIF23, ZWINT, CCNE2, KIF20A, CENPA, TPX2, CENPF, EZH2, OIP5, SMC2, NDC80, FOXM1, MCM6, PCNA, ACTL6A, MCM2, ATAD2, AURKA, CDC20, CDCA2, KIF2C, CENPK, CKS1B, ASF1B, HJURP, PCLAF, CENPL, FEN1, RMI2, ZNF367, BIRC5, CENPU, DBF4, MCM10, MASTL, SGO2, EXO1, CHEK1, GMNN, RAD51, NCAPG2, MCM4, CSE1L, DEK, CENPM, TOPBP1, RNASEH2A, CENPN, BUB1, SNRPD1, CDCA5, NUDCD1
  GO: 0000777Condensed chromosome kinetochore <0.0001aCENPW,MAD2L1, NEK2, BUB1B, ZWINT, NDC80, KNSTRN,ERCC6L, KIF2C, NUF2, CENPK, HJURP, SPAG5, BIRC5, CENPU, SGO2, CENPM, CENPN, BUB1
  GO: 0000775Cytosol <0.0001aECT2, CDK1, SMC4, RRM2, FANCI, KPNA2, CCNB1, DLGAP5, MAD2L1, NEK2, PRC1, RACGAP1, BUB1B, NCAPG, KIF18B, FBXO5, DTL, KIF11, CDKN3, CCNA2, DEPDC1B, KIF4A, CDCA8, UBE2C, KIF23, KIF14, ZWINT, CCNE2, PTTG1, CENPA, TPX2, CENPF, OIP5, SMC2, NDC80, CKAP2L, HMMR, MCM2, MTHFD2, KNSTRN, AURKA, CDC20, ERCC6L, NCAPH, CDCA2, KIF2C, NUF2, GPSM2, CENPK, HJURP, CENPL, CDCA3, RMI2, KIF15, BIRC5, CENPU, SGO2, KIF18A, STIL, CHEK1, GMNN, ESPL1, TYMS, GMPS, RAD51, CCNB2, RAB6C, CENPE, PDCD10, CSE1L, CENPM, RNASEH2A, CENPN, BUB1, SNRPD1, PLK4, CDCA5, NUDCD1
  GO: 0030496Nucleus <0.0001aPRC1, UBE2T, RACGAP1, NCAPG, PBK, KIF18B, FBXO5, DTL, CDKN3, RAD51AP1, TOP2A, CCNA2, CDCA8, KIF23, KIF14, ZWINT, H2AFZ, PTTG1, CENPA, TPX2, CENPF, EZH2, OIP5, SMC2, NDC80, FOXM1, MCM6, PCNA, ACTL6A, MCM2, ATAD2, KNSTRN, AURKA, TRIP13, DONSON, NCAPH, NUF2, HJURP, PCLAF, FEN1, DEPDC1, ZNF367, BIRC5, CENPU, DBF4, MCM10, MASTL, TCF19, KIF18A, EXO1, CHEK1, GMNN, ESPL1, UHRF1, TYMS, RAD51, CCNB2, RAB6C, CENPE, MCM4, CSE1L, DEK, TOPBP1, CENPN, SNRPD1, CDCA5, TMPO, KIFC1
Molecular function
  GO: 0008017Microtubule binding <0.0001aPRC1, NUSAP1, RACGAP1, KIF18B, KIF11, FAM83D, KIF4A, KIF23, KIF14, KIF20A, SPAG5, KIF15, BIRC5, KIF18A, CENPE, KIFC1
  GO: 0005524Protein binding <0.0001aECT2, CDK1, SMC4, CENPW, CEP55, MELK, RFC4, RRM2, FANCI, KPNA2, CCNB1, DLGAP5, MAD2L1, NEK2, PRC1, NUSAP1, UBE2T, RACGAP1, BUB1B, NCAPG, PBK, TTK, KIF18B, FBXO5, DTL, CDKN3, RAD51AP1, TOP2A, FAM83D, CKS2, CCNA2, KIF4A, CDCA8, UBE2C, KIF23, KIF14, ZWINT, H2AFZ, CCNE2, PTTG1, KIF20A, CENPA, TPX2, CENPF, EZH2, OIP5, SMC2, NDC80, FOXM1, MCM6, HMMR, PCNA, ACTL6A, MCM2, MTFR2, ATAD2, KNSTRN, AURKA, CDC20, TRIP13, ERCC6L, DONSON, NCAPH, KIF2C, NUF2, GPSM2, CENPK, CKS1B, ASF1B, HJURP, PCLAF, CENPL, CDCA3, FEN1, SPAG5, DEPDC1, KIF15, BIRC5, CENPU, DBF4, MCM10, SGO2, TCF19, KIF18A, EXO1, STIL, CHEK1, GMNN, ESPL1, UHRF1, RAD51, CCNB2, FBXO45, CENPE, PDCD10, MCM4, CSE1L, SHCBP1, TOPBP1, FAM111B, BUB1, SKA3, SNRPD1, PLK4, CDCA5, NUDCD1
  GO: 0003777Microtubule motor activity <0.0001aKIF18B, KIF11, KIF4A, KIF23, KIF14, KIF20A, KIF2C, KIF15, CENPE, KIFC1
  GO: 0005515ATP binding <0.0001aCDK1, SMC4, MELK, RFC4, NEK2, UBE2T, BUB1B, PBK, TTK, KIF18B, KIF11, TOP2A, KIF4A, UBE2C, KIF23, KIF14, KIF20A, TPX2, SMC2, MCM6, MCM2, ATAD2, AURKA, TRIP13, ERCC6L, KIF2C, KIF15, MASTL, KIF18A, CHEK1, GMPS, RAD51, CENPE, MCM4, BUB1, PLK4, KIFC1

a P<0.05; GO, Gene Ontology.

Discussion

The ECT2 gene was initially identified as a proto-oncogene located in the 3q26.31 chromosomal region that can transform NIH/3T3 fibroblasts into cancer cells (14). As a guanine nucleotide exchange factor of the Rho guanosine triphosphate (GTP)ase family, ECT2 regulates cell division and the cell cycle (15,16), which affects various biological functions, including the proliferation, invasion and migration of tumour cells, associated with numerous signalling pathways (1719). ECT2 catalyses the dissociation of bound guanosine diphosphate (GDP) and promotes the replacement of GDP with GTP, thereby activating Ras GTP enzymes in cell signalling pathways (20,21). A study indicated that the formation of lung cancer depends on rRNA synthesis regulated by ECT2 (22). Numerous studies have reported that ECT2 expression correlated with the prognosis of patients with prostate cancer and gastrointestinal tumours, including gastric cancer, colorectal cancer and oesophageal cancer (15,21,23,24).

The present study demonstrated that the expression of ECT2 was significantly higher in breast cancer tissues than in normal breast tissues using data from GEPIA. Therefore, ECT2 may serve an important role in the occurrence and development of breast cancer. Furthermore, the expression of ECT2 in PAM50 subtypes was significantly different as determined via bc-GenExMiner analysis, indicating the that expression of ECT2 in luminal A and normal breast-like breast cancers were significantly lower than in other types. Several studies have proposed the overexpression of ECT2 to be an independent prognostic index in patients with various malignant disorders. For example, Luo et al (21) reported that patients with colorectal cancer and high ECT2 expression had notably shorter overall survival; Cox regression analysis revealed that ECT2 expression may be a significant independent prognostic factor for the OS rate of patients with colorectal cancer. Guo et al (23) used a dataset of TCGA to investigate the prognostic value of ECT2 in prostate cancer. In addition, lower levels of ECT2 mRNA expression predicted increased OS and biochemical recurrence-free survival in all patients with prostate cancer or non-metastatic prostate cancer (23). Hirata et al (24) screened for genes that were overexpressed in tumors via gene expression profile analyses of 101 lung cancer and 19 esophageal squamous cell carcinoma (ESCC) tissues via a cDNA microarray comprising 27,648 genes or expressed sequence tags. It was reported that high levels of ECT2 expression were associated with the poor prognosis of patients with NSCLC and ESCC (24). In the present study, it was observed that high ECT2 expression was associated with significantly lower OS and PFS in patients with breast cancer using KM-plotter. In addition, we determined that ECT2 expression was lower in ER+ breast cancer; however, increased expression of ECT2 was associated with the poor prognosis of ER+ breast cancer, as demonstrated by ECT2 univariate Cox and KM curve analyses of bc-GenExMiner v4.1 data. Although, the expression of ECT2 in ER breast cancer was higher than in ER+ breast cancer, our results indicated that the high expression of ECT2 in ER+ breast cancer may be associated with poor prognosis. These results suggest the potential of ECT2 as a biomarker and a therapeutic target for ER+ breast cancer. Recently, TNBC and ECT2 were reported to be independent prognostic factors for patients with breast cancer (25). On the contrary, the results of the present study indicated that ECT2 expression is higher in basal-like breast cancer and TNBC; however, ECT2 was not an independent prognostic factor for both of these subtypes. In addition, we conducted GO enrichment for genes correlated with ECT2 via GO analysis of bc-GenExMiner v4.1 data. The results revealed that GO: 0005524 (protein binding) had the greatest number of genes correlated with and contained ECT2, which may provide insight into the mechanism of ECT2 in the progression of breast cancer; however, further investigation is required. The mechanism of ECT2 action in breast cancer must be confirmed by prospective experiments in vitro and in vivo.

In conclusion, ECT2 may represent a novel therapeutic target for the treatment of cancer based on its role in the occurrence and development of breast cancer, as well as its independent prognostic significance.

Acknowledgements

Not applicable.

Funding

This work is supported partly by the Natural Science Foundation of Liaoning province in China (grant no. 201601359).

Availability of data and materials

The data that support the findings of this study are available from GEPIA (http://gepia.cancer-pku.cn/index.html) and bc-GenExMiner v4.1 (http://bcgenex.centregauducheau.fr/BC-GEM/GEM-Accueil.php?js=1).

Authors' contributions

XYY is the major contributor to the writing of the manuscript; XYY and HMW made substantial contributions to the design of the present study. LW, WTY and LY supervised the study and critically revised the manuscript for intellectually important content. All the authors have read and approved the final version of this manuscript.

Ethics approval and consent to participate

Not applicable.

Patient consent for publication

Not applicable.

Competing interests

The authors declare that they have no competing interests.

References

1 

Global Burden of Disease Cancer Collaboration, . Fitzmaurice C, Dicker D, Pain A, Hamavid H, Moradi-Lakeh M, MacIntyre MF, Allen C, Hansen G, Woodbrook R, et al: The global burden of cancer 2013. JAMA Oncol. 1:505–527. 2015. View Article : Google Scholar : PubMed/NCBI

2 

Ferlay J, Soerjomataram I, Dikshit R, Eser S, Mathers C, Rebelo M, Parkin DM, Forman D and Bray F: Cancer incidence and mortality worldwide: Sources, methods and major patterns in GLOBOCAN 2012. Int J Cancer. 136:E359–E386. 2015. View Article : Google Scholar : PubMed/NCBI

3 

Chen WQ and Zheng RS: Incidence, mortality and survival analysis of breast cancer in China. Chin J Clin Oncol. 42:668–674. 2015.

4 

Fan L, Strasser-Weippl K, Li JJ, St Louis J, Finkelstein DM, Yu KD, Chen WQ, Shao ZM and Goss PE: Breast cancer in China. Lancet Oncol. 15:e279–e289. 2014. View Article : Google Scholar : PubMed/NCBI

5 

Siegel RL, Miller KD and Jemal A: Cancer statistics, 2015. CA Cancer J Clin. 65:5–29. 2015. View Article : Google Scholar : PubMed/NCBI

6 

Tatsumoto T, Xie X, Blumenthal R, Okamoto I and Miki T: Human ECT2 is an exchange factor for Rho GTPases, phosphorylated in G2/M phases, and involved in cytokinesis. J Cell Biol. 147:921–928. 1999. View Article : Google Scholar : PubMed/NCBI

7 

Fields AP and Justilien V: The guanine nucleotide exchange factor (GEF) Ect2 is an oncogene in human cancer. Adv Enzyme Regul. 50:190–200. 2010. View Article : Google Scholar : PubMed/NCBI

8 

Justilien V and Fields AP: Ect2 links the PKCiota-Par6alpha complex to Rac1 activation and cellular transformation. Oncogene. 28:3597–3607. 2009. View Article : Google Scholar : PubMed/NCBI

9 

Huff LP, Decristo MJ, Trembath D, Kuan PF, Yim M, Liu J, Cook DR, Miller CR, Der CJ and Cox AD: The role of Ect2 nuclear RhoGEF activity in ovarian cancer cell transformation. Genes Cancer. 4:460–475. 2013. View Article : Google Scholar : PubMed/NCBI

10 

Mansour M, Haupt S, Chan AL, Godde N, Rizzitelli A, Loi S, Caramia F, Deb S, Takano EA, Bishton M, et al: The E3-ligase E6AP represses breast cancer metastasis via regulation of ECT2-Rho signaling. Cancer Res. 76:4236–4248. 2016. View Article : Google Scholar : PubMed/NCBI

11 

Jézéquel P, Frénel JS, Campion L, Guérin-Charbonnel C, Gouraud W, Ricolleau G and Campone M: bc-GenExMiner 3.0: New mining module computes breast cancer gene expression correlation analyses. Database (Oxford). 2013:bas0602013. View Article : Google Scholar : PubMed/NCBI

12 

Tang Z, Li C, Kang B, Gao G, Li C and Zhang Z: GEPIA: A web server for cancer and normal gene expression profiling and interactive analyses. Nucleic Acids Res. 45:W98–W102. 2017. View Article : Google Scholar : PubMed/NCBI

13 

Szász AM, Lánczky A, Nagy Á, Förster S, Hark K, Green JE, Boussioutas A, Busuttil R, Szabó A and Győrffy B: Cross-validation of survival associated biomarkers in gastric cancer using transcriptomic data of 1,065 patients. Oncotarget. 7:49322–49333. 2016. View Article : Google Scholar : PubMed/NCBI

14 

Miki T, Smith CL, Long JE, Eva A and Fleming TP: Oncogene ect2 is related to regulators of small GTP-binding proteins. Nature. 362:462–465. 1993. View Article : Google Scholar : PubMed/NCBI

15 

Wang HB, Yan HC and Liu Y: Clinical significance of ECT2 expression in tissue and serum of gastric cancer patients. Clin Transl Oncol. 18:735–742. 2016. View Article : Google Scholar : PubMed/NCBI

16 

Scoumanne A and Chen X: The epithelial cell transforming sequence 2, a guanine nucleotide exchange factor for Rho GTPases, is repressed by p53 via protein methyltransferases and is required for G1-S transition. Cancer Res. 66:6271–6279. 2006. View Article : Google Scholar : PubMed/NCBI

17 

Duquette PM and Lamarche-Vane N: Rho GTPases in embryonic development. Small GTPases. 5:e9728572014. View Article : Google Scholar

18 

Matsuoka T and Yashiro M: Rho/ROCK signaling in motility and metastasis of gastric cancer. World J Gastroenterol. 20:13756–13766. 2014. View Article : Google Scholar : PubMed/NCBI

19 

Tanabe K, Shinsato Y, Furukawa T, Kita Y, Hatanaka K, Minami K, Kawahara K, Yamamoto M, Baba K, Mori S, et al: Filamin C promotes lymphatic invasion and lymphatic metastasis and increases cell motility by regulating Rho GTPase in esophageal squamous cell carcinoma. Oncotarget. 8:6353–6363. 2017. View Article : Google Scholar : PubMed/NCBI

20 

Cook DR, Rossman KL and Der CJ: Rho guanine nucleotide exchange factors: Regulators of Rho GTPase activity in development and disease. Oncogene. 33:4021–4035. 2014. View Article : Google Scholar : PubMed/NCBI

21 

Luo Y, Qin SL, Mu YF, Wang ZS, Zhong M and Bian ZQ: Elevated expression of ECT2 predicts unfavorable prognosis in patients with colorectal cancer. Biomed Pharmacother. 73:135–139. 2015. View Article : Google Scholar : PubMed/NCBI

22 

Justilien V, Ali SA, Jamieson L, Yin N, Cox AD, Der CJ, Murray NR and Fields AP: Ect2-dependent rRNA synthesis is required for KRAS-TRP53-driven lung adenocarcinoma. Cancer Cell. 31:256–269. 2017. View Article : Google Scholar : PubMed/NCBI

23 

Guo Z, Chen X, Du T, Zhu D, Lai Y, Dong W, Wu W, Lin C, Liu L and Huang H: Elevated levels of epithelial cell transforming sequence 2 predicts poor prognosis for prostate cancer. Med Oncol. 34:132017. View Article : Google Scholar : PubMed/NCBI

24 

Hirata D, Yamabuki T, Miki D, Ito T, Tsuchiya E, Fujita M, Hosokawa M, Chayama K, Nakamura Y and Daigo Y: Involvement of epithelial cell transforming sequence-2 oncoantigen in lung and esophageal cancer progression. Clin Cancer Res. 15:256–266. 2009. View Article : Google Scholar : PubMed/NCBI

25 

Wang HK, Liang JF, Zheng HX and Xiao H: Expression and prognostic significance of ECT2 in invasive breast cancer. J Clin Pathol. 71:442–445. 2018. View Article : Google Scholar : PubMed/NCBI

Related Articles

Journal Cover

May-2019
Volume 10 Issue 5

Print ISSN: 2049-9450
Online ISSN:2049-9469

Sign up for eToc alerts

Recommend to Library

Copy and paste a formatted citation
x
Spandidos Publications style
Xiu Y, Liu W, Wang T, Liu Y and Ha M: Overexpression of ECT2 is a strong poor prognostic factor in ER(+) breast cancer. Mol Clin Oncol 10: 497-505, 2019
APA
Xiu, Y., Liu, W., Wang, T., Liu, Y., & Ha, M. (2019). Overexpression of ECT2 is a strong poor prognostic factor in ER(+) breast cancer. Molecular and Clinical Oncology, 10, 497-505. https://doi.org/10.3892/mco.2019.1832
MLA
Xiu, Y., Liu, W., Wang, T., Liu, Y., Ha, M."Overexpression of ECT2 is a strong poor prognostic factor in ER(+) breast cancer". Molecular and Clinical Oncology 10.5 (2019): 497-505.
Chicago
Xiu, Y., Liu, W., Wang, T., Liu, Y., Ha, M."Overexpression of ECT2 is a strong poor prognostic factor in ER(+) breast cancer". Molecular and Clinical Oncology 10, no. 5 (2019): 497-505. https://doi.org/10.3892/mco.2019.1832