Introduction
In Japan, rectal cancer is the seventh most common
cause of cancer-related death in men and the ninth highest in women
(1). After neoadjuvant
chemoradiotherapy treatment, rectal cancer can be controlled,
distant recurrence can be prevented and disease-free survival and
overall survival can be increased (2–5).
Radiological imaging is often performed to assess the therapeutic
effect of chemoradiotherapy during treatment. A recent study
demonstrated the therapeutic effect and increased disease-free
survival exhibited by chemoradiotherapy using computed tomography
(CT) (6). In Japan, neoadjuvant
chemotherapy (NAC) is accessible and is a promising treatment
option for locally advanced rectal cancer (7). However, long-term bowel dysfunction has
been reported to occur at a higher rate in irradiated patients
compared with patients who undergo surgery alone (8). Radiotherapy is able to control local
recurrence; however, radiation can induce fibrosis of the rectal
wall, and may also cause proctitis, which can deteriorate anorectal
function (9,10). The direct radiation damage to the
internal anal sphincter and nerve can cause anal sphincter
dysfunction (11,12). Therefore, identification of patients
who would be susceptible to chemotherapy may enhance their quality
of life and avoid these adverse effects. The current study aimed to
compare the radiological images and pathology of rectal cancer
treated with NAC, and elucidate its clinicopathological
characteristics. The present study assessed the clinicopathological
characteristics of rectal cancer cases in high and low radiological
cancer volume reduction ratio groups after NAC.
Patients and methods
Patient samples
A retrospective assessment was conducted of the CT
and/or MRI of 50 surgically resected rectal cancer lesions obtained
prior to and following NAC from 2015 to 2018 at Hirosaki University
Hospital (Hirosaki, Japan). Patient clinicopathological
characteristics are presented in Table
I. Informed consent was obtained from each patient regarding
the use of their clinical records and pathological specimens. The
patients underwent surgery from June 2015 to June 2018. The rectal
cancer cases that exhibited metastases to other organs were
excluded. Table II presents the
chemotherapy regimens and the number of cycles performed on the
patients prior to surgical resection. Clinical stage (cStage) was
graded prior to and following NAC and pathological stage (pStage)
was also graded based on the American Joint Committee on Cancer
(AJCC) staging manual (13)
(Table III).
 | Table I.Clinicopathological characteristics of
50 rectal cancer cases, treated with neoadjuvant chemotherapy. |
Table I.
Clinicopathological characteristics of
50 rectal cancer cases, treated with neoadjuvant chemotherapy.
| Clinicopathological
feature | Value |
|---|
| Age, mean (range),
years | 62.7 (35–78) |
| Sex, n (%) |
|
| Male | 38 (76) |
|
Female | 12 (24) |
| Location, n (%) |
|
| Ra | 2 (4) |
| RaRb | 1 (2) |
|
RaRbP | 1 (2) |
| Rb | 43 (86) |
| RbP | 3 (6) |
| Pathological T stage,
n (%) |
|
| pT0 | 6 (12) |
| pT1 | 3 (6) |
| pT2 | 13 (26) |
| pT3 | 23 (46) |
| pT4 | 5 (10) |
| Pathological N stage,
n (%) |
|
| pN0 | 35 (70) |
| pN1 | 13 (26) |
| pN2 | 2 (4) |
| Histology, n (%) |
|
| Tubular
adenocarcinoma, well differentiated type | 10 (20) |
| Tubular
adenocarcinoma, moderately differentiated type | 33 (66) |
| Poorly
differentiated type | 0 (0) |
| Mucinous
adenocarcinoma | 1 (2) |
| N.A. | 6 (12) |
| Lymphatic invasion, n
(%) |
|
| ly0 | 21 (42) |
| ly1 | 19 (38) |
| ly2 | 8 (16) |
| ly3 | 2 (4) |
| Venous invasion, n
(%) |
|
| v0 | 11 (22) |
| v1 | 9 (18) |
| v2 | 22 (44) |
| v3 | 8 (16) |
| Number of dissected
lymph nodes, mean (range) | 27.48 (3–59) |
| Pathological cancer
area, mean (range), mm2 | 168.1 (0–794.3) |
| Pathological changed
area, mean (range), mm2 | 38.3 (0.8–235.6) |
| Pathological total
area, mean (range), mm2 | 206.3
(10.461–811.125) |
| Cytokeratin
AE1/AE3-stained area, mean (range), mm2 | 49.4 (0–231.7) |
| Mitosis, mean
(range) | 20.5 (0–69.0) |
| Macro diameter, mean
(range), mm | 44.6
(14.0–108.0) |
| Interval from CT/MRI
before NAC to NAC start date, mean, days | 18.42 |
| Interval from CT/MRI
after NAC to surgery date, mean, days | 26.28 |
| Radiological
donut-shaped image before NAC, mean (range), mm2 | 1293
(245.8–3596.4) |
| Radiological
donut-shaped image after NAC, mean (range), mm2 | 958.8
(103.0–1959.8) |
| Cancer volume
reduction ratio on CT/MRI, mean (range), % | 23 (−44.8–68.1) |
| Table II.Chemotherapy regimens and the mean
number of cycles. |
Table II.
Chemotherapy regimens and the mean
number of cycles.
| Chemotherapy
regimen | n (%) | Mean cycles |
|---|
| FOLFOX + Pmab | 1 (2) | 6.0 |
| mFOLFOX6 | 1 (2) | 6.0 |
| mFOLFOX6+Bv | 2 (4) | 6.0 |
| SOX | 38 (76) | 2.9 |
| SOX + Bv | 7 (14) | 4.0 |
| SOX + Bv→FOLFIRI +
Bv | 1 (2) | 5.0 |
| Table III.cStage before and after NAC, and the
pStage. |
Table III.
cStage before and after NAC, and the
pStage.
| Stage | cStage before NAC, n
(%) | cStage after NAC, n
(%) | pStage, n (%) |
|---|
| 0 | 0 (0) | 1 (2) | 6 (12) |
| I | 0 (0) | 7 (14) | 14 (28) |
| II | 19 (38) | 24 (48) | 15 (30) |
| III | 31 (62) | 18 (36) | 15 (30) |
Pathological examinations of primary
cancer
Sections were obtained from every 5 mm at a cancer
site, and all parts of each cancer lesion were sampled. For the
histopathological examination, rectal cancer specimens were
routinely 10% formalin-fixed (formalin fixation time, 48–120 h,
room temperature), paraffin-embedded, thinly sectioned (4 µm), and
stained with hematoxylin and eosin (H&E: Hematoxylin 20 min and
eosin 3 min at room temperature, usually 25°C). Pathological tumor
stage (pT) and pathological node stage (pN) were graded according
to the AJCC staging manual (13).
The pT, pN and pStage were each categorized into two groups (pT0-1
and pT2-4; pN0 and pN1-2; and pStage0-I and pStageII–III). Cancer
lesions were graded based on histological analysis of the invasion
of vessels (lymphatic invasion and venous invasion) and lymph node
metastasis (pN0, pN1 and pN2). Lymphatic invasion criteria were as
follows: Ly0, no invasion; ly1, minimal invasion; ly2, moderate
invasion; and ly3, severe invasion. Venous invasion criteria were:
V0, no invasion; v1, minimal invasion; v2, moderate invasion; and
v3, severe invasion. The lymphatic invasion and venous invasion
were grouped into High (ly2, ly3/v2 and v3) and Low (ly0, ly1/v0
and v1) categories. The histological type was classified into
tubular adenocarcinoma (well-differentiated type), tubular
adenocarcinoma (moderately differentiated type), poorly
differentiated type and mucinous adenocarcinoma. Mitosis was
defined as the sum of three hotspots (×400) where mitosis was
observed using a light microscope. The entire cancer tissues were
scanned at low-magnification using a light microscope, and hot
spots were selected; hot spots are representative areas including
the highest number of mitotic cells in a field of light microscope
(×400). We counted the mitosis of cancer in each hot spot in a
field of the light microscope (×400). The macro diameter was
defined as the macroscopic cancer size (mm).
Evaluation of cancer area on
radiological images
Using DICOM data (EV Insite R version 3.4.0.0 from
PSP Corporation or ShadeQuest/ViewR V1.24 from Yokogawa Medical
Solutions) of CT and/or MRI images, the primary rectal cancer areas
were calculated prior to and following NAC. CT scans were performed
prior to and following NAC in most cases. In cases which CT could
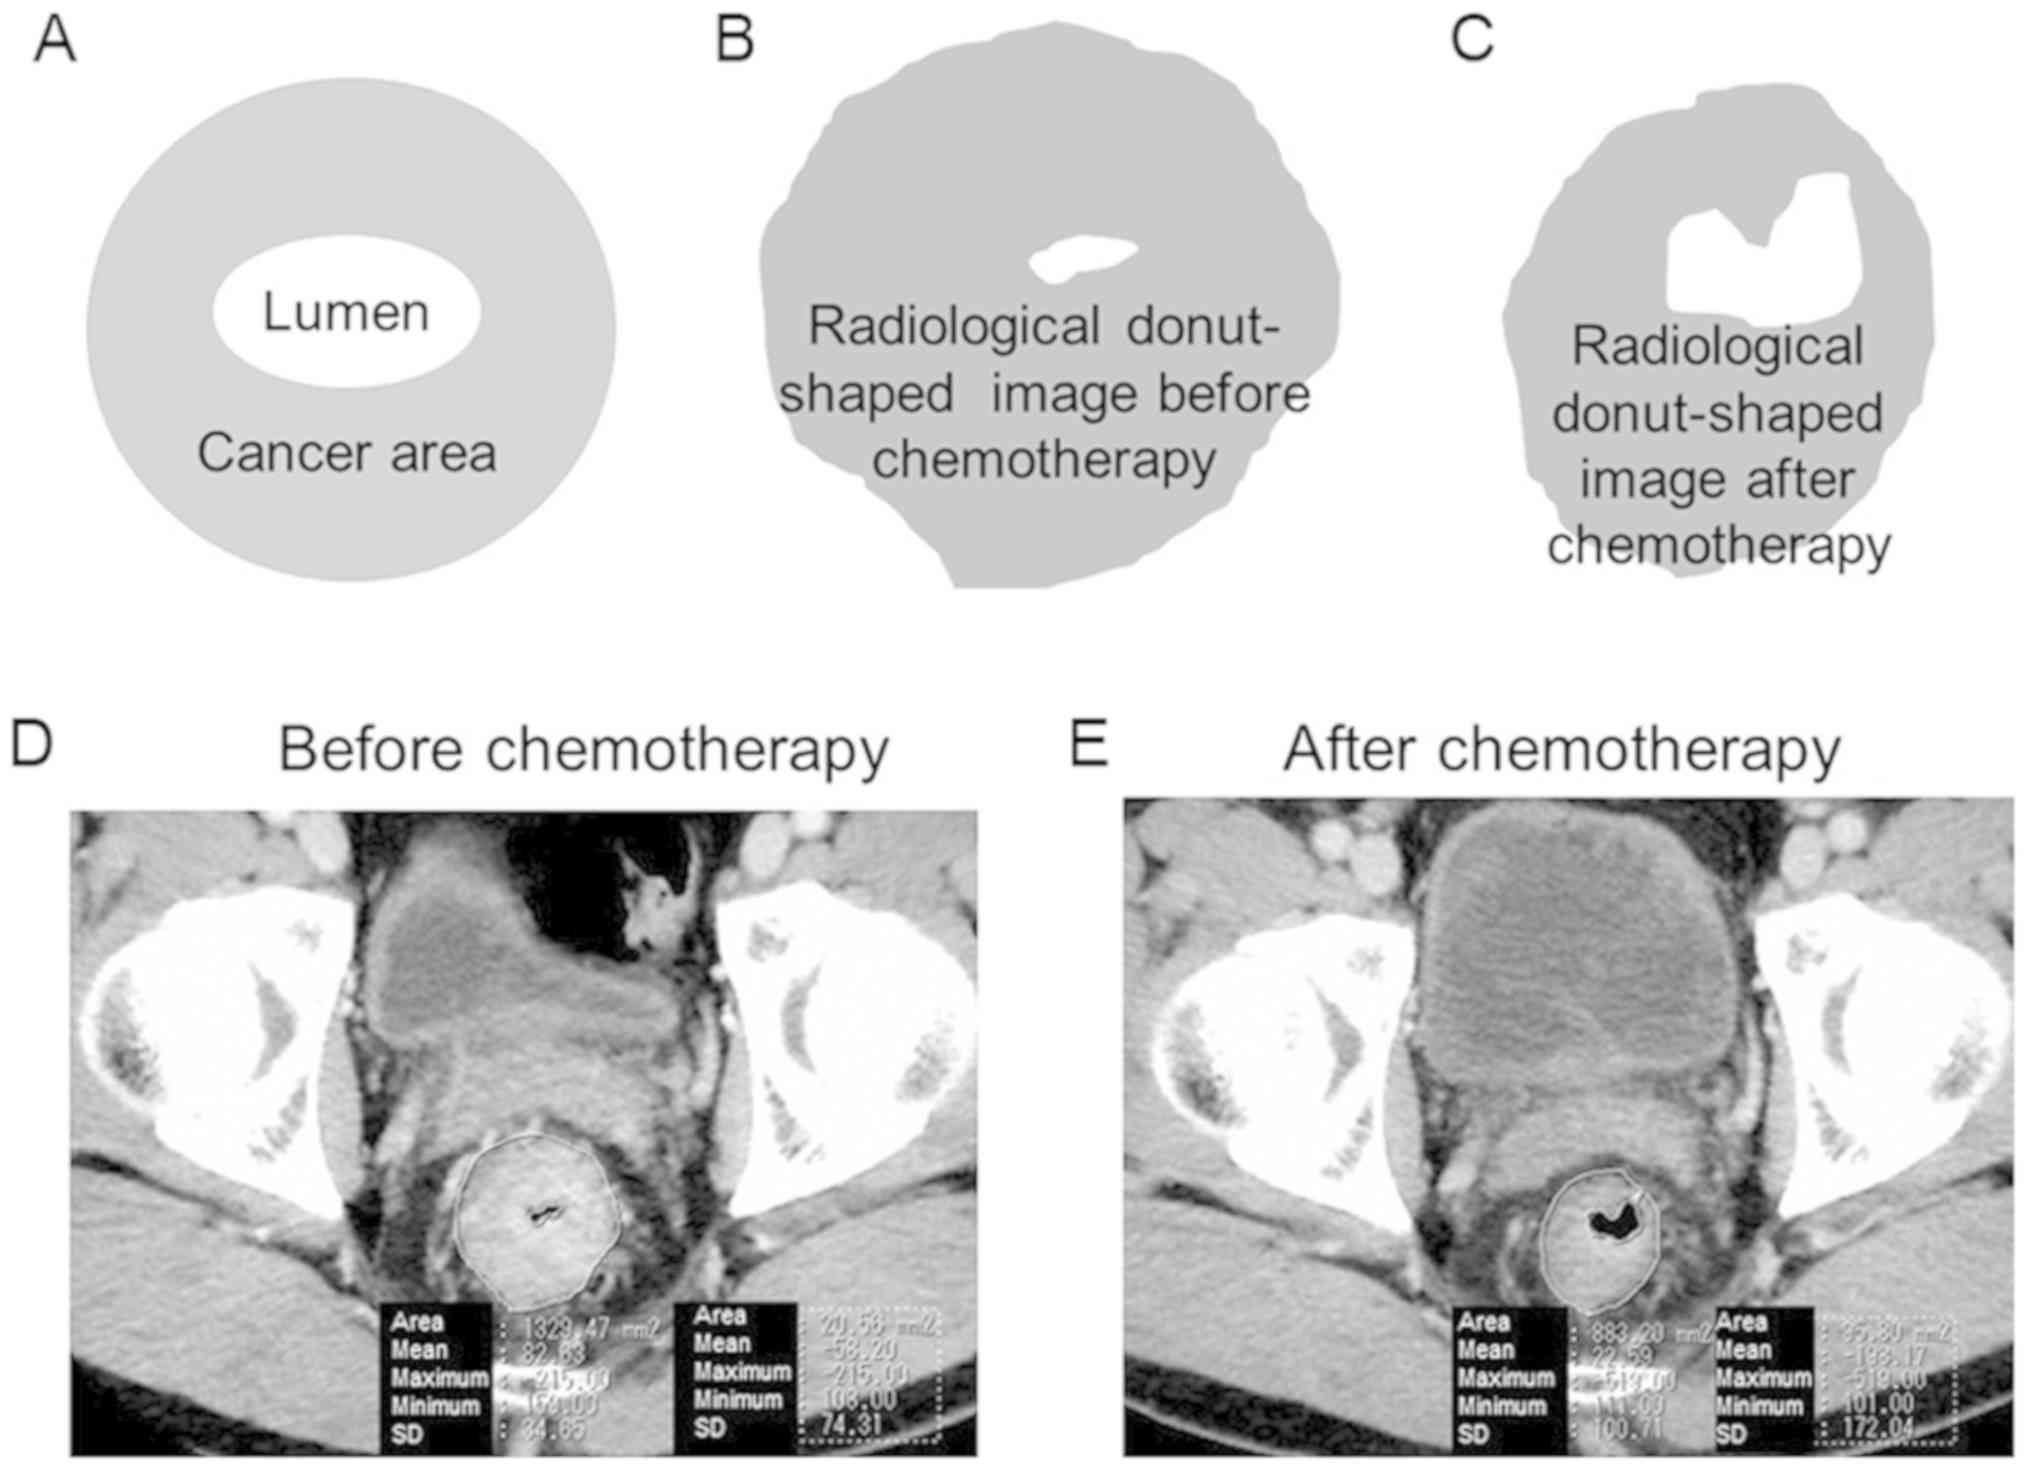
not be perform, MRI was performed instead. The radiological
donut-shaped image was considered to be the cancer area, due to the
precise identification of the tumor being challenging. Fig. 1 presents the whole intestinal wall at
the dimension showing the greatest cancer area. The radiological
donut-shaped image was defined as the area which remained following
subtraction of the area of the gut lumen from the area enclosed by
the perimeter of the intestinal tract at the dimension showing the
greatest cancer area. The radiological cancer volume reduction
ratio was also assessed using the radiological donut-shaped image
prior to and following NAC as follows: Radiological cancer volume
reduction ratio (%)=(1-radiological donut-shaped image following
NAC/radiological donut-shaped image before NAC) ×100.
Residual cancer area on H&E
staining images
Whole tissue sections were examined in the current
study. All slides comprising the maximal cancer section were
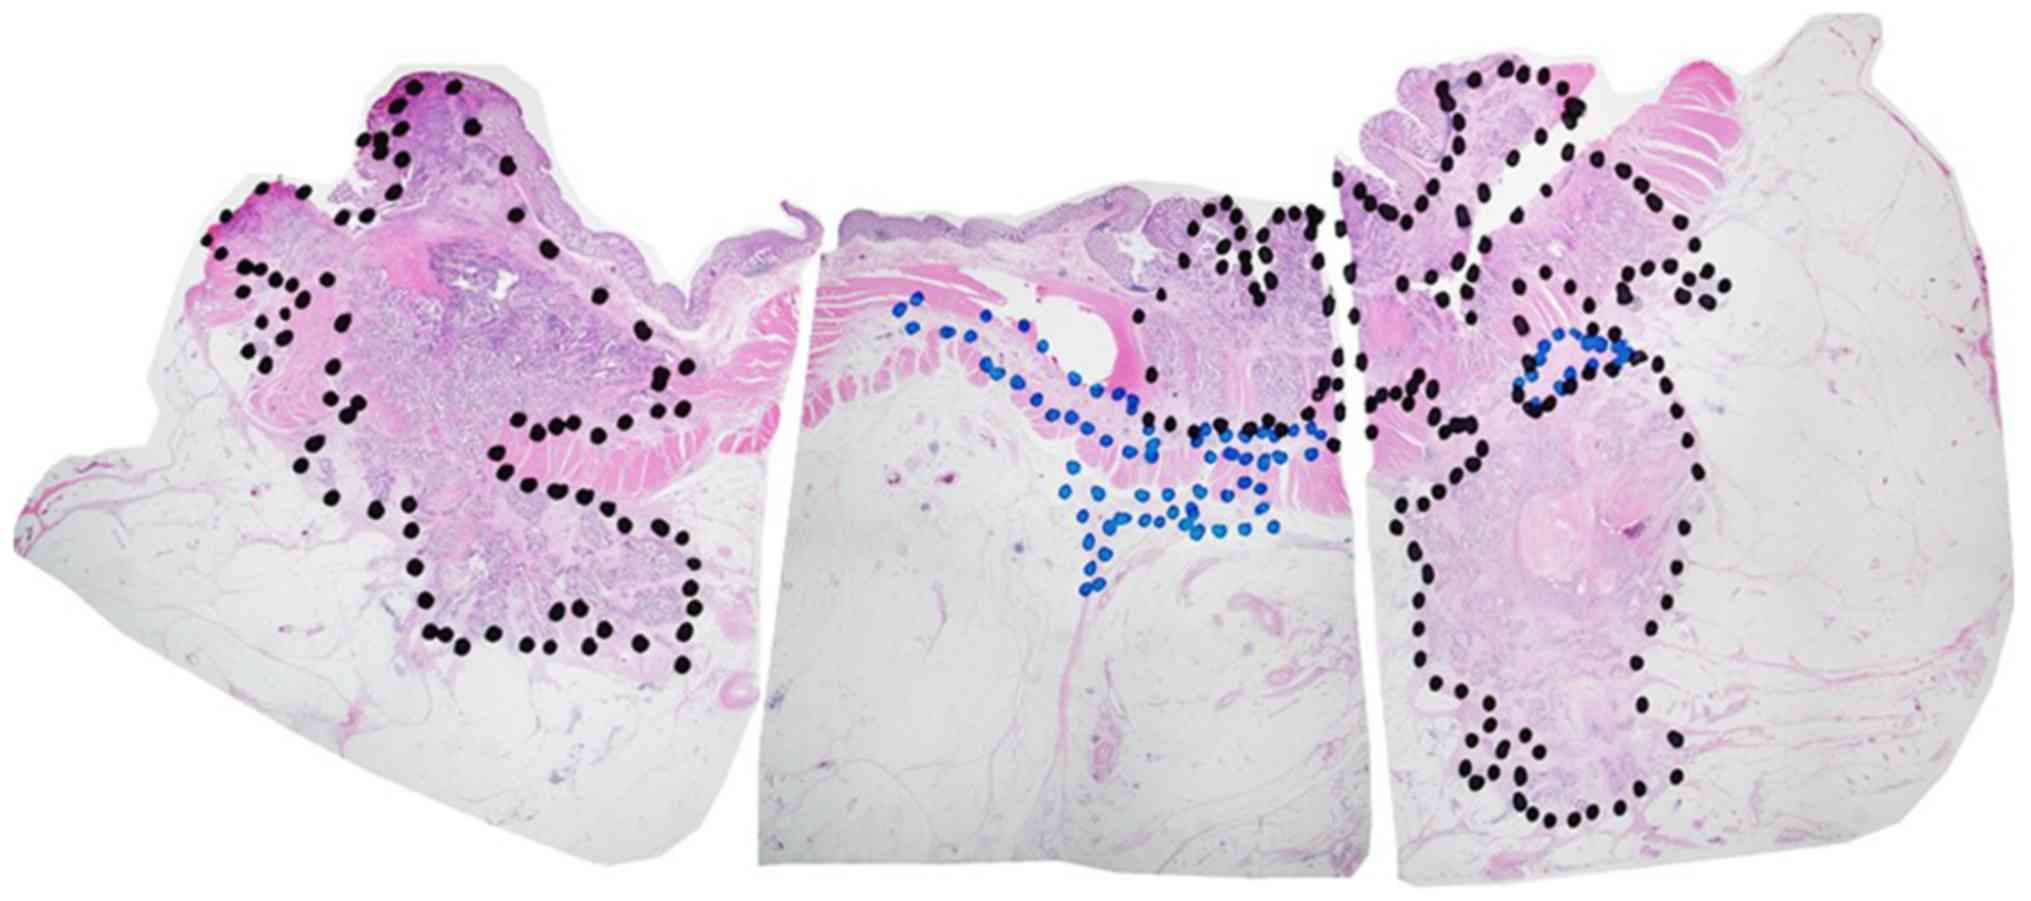
examined. The pathological cancer area and pathological changed
area were marked on the selected H&E stained slides using a
permanent marker (Fig. 2). Black
permanent marker was used to indicate the pathological cancer area,
and blue permanent marker was used to indicate the pathological
changed area. The pathological cancer area was defined as the
region in which cancer cells were distributed, including the region
of fibrous stroma and inflammatory cells surrounding the cancer
cells. Conversely, the pathological changed area was defined as the
region in which cancer cells were not distributed. The pathological
changed area was indicated by the disappearance of cancer cells
following NAC, which also included granulated tissue, inflammatory
cells and fibrosis. Sections were scanned using light microscopy at
a low magnification (×12.5). Composite images were created so that
one preparation could be seen in one image. The composition of
images were created in Adobe Photoshop CC2014 (Adobe Systems,
Inc.). Furthermore, the pathological cancer and pathological
changed areas, which were marked using permanent marker, were
measured using ImageJ software [Java 1.6.0_24 (64-bit); National
Institutes of Health; http://imagej.nih.gov/ij; Fig. 2] (14). The pathological total area was
calculated as the sum of the pathological cancer area and the
pathological changed area.
Immunohistochemistry
Immunohistochemistry was performed on deparaffinized
tissue sections using the standard avidin-biotin-peroxidase complex
method with an automated immunostainer (Benchmark XT; Ventana
Medical Systems, Inc.). The formalin fixation conditions were the
same as those used for H&E staining. All slides containing the
maximal cancer section were subjected immunostaining for the
detection of Cytokeratin AE1/AE3. The antibody was used under the
following conditions: Cytokeratin AE1/AE3 [M3515; dilution 1:100;
or IS053 (Ready-to-Use); both Dako, Agilent Technologies, Inc.].
iVIEW DAB Universal kit (Roche Diagnostics KK), which includes a
secondary antibody, inhibitor and DAB reagent, was used according
to the manufacturer's protocol. The primary antibody was reacted
for 16 min at room temperature (usually 25°C). The cancer cells
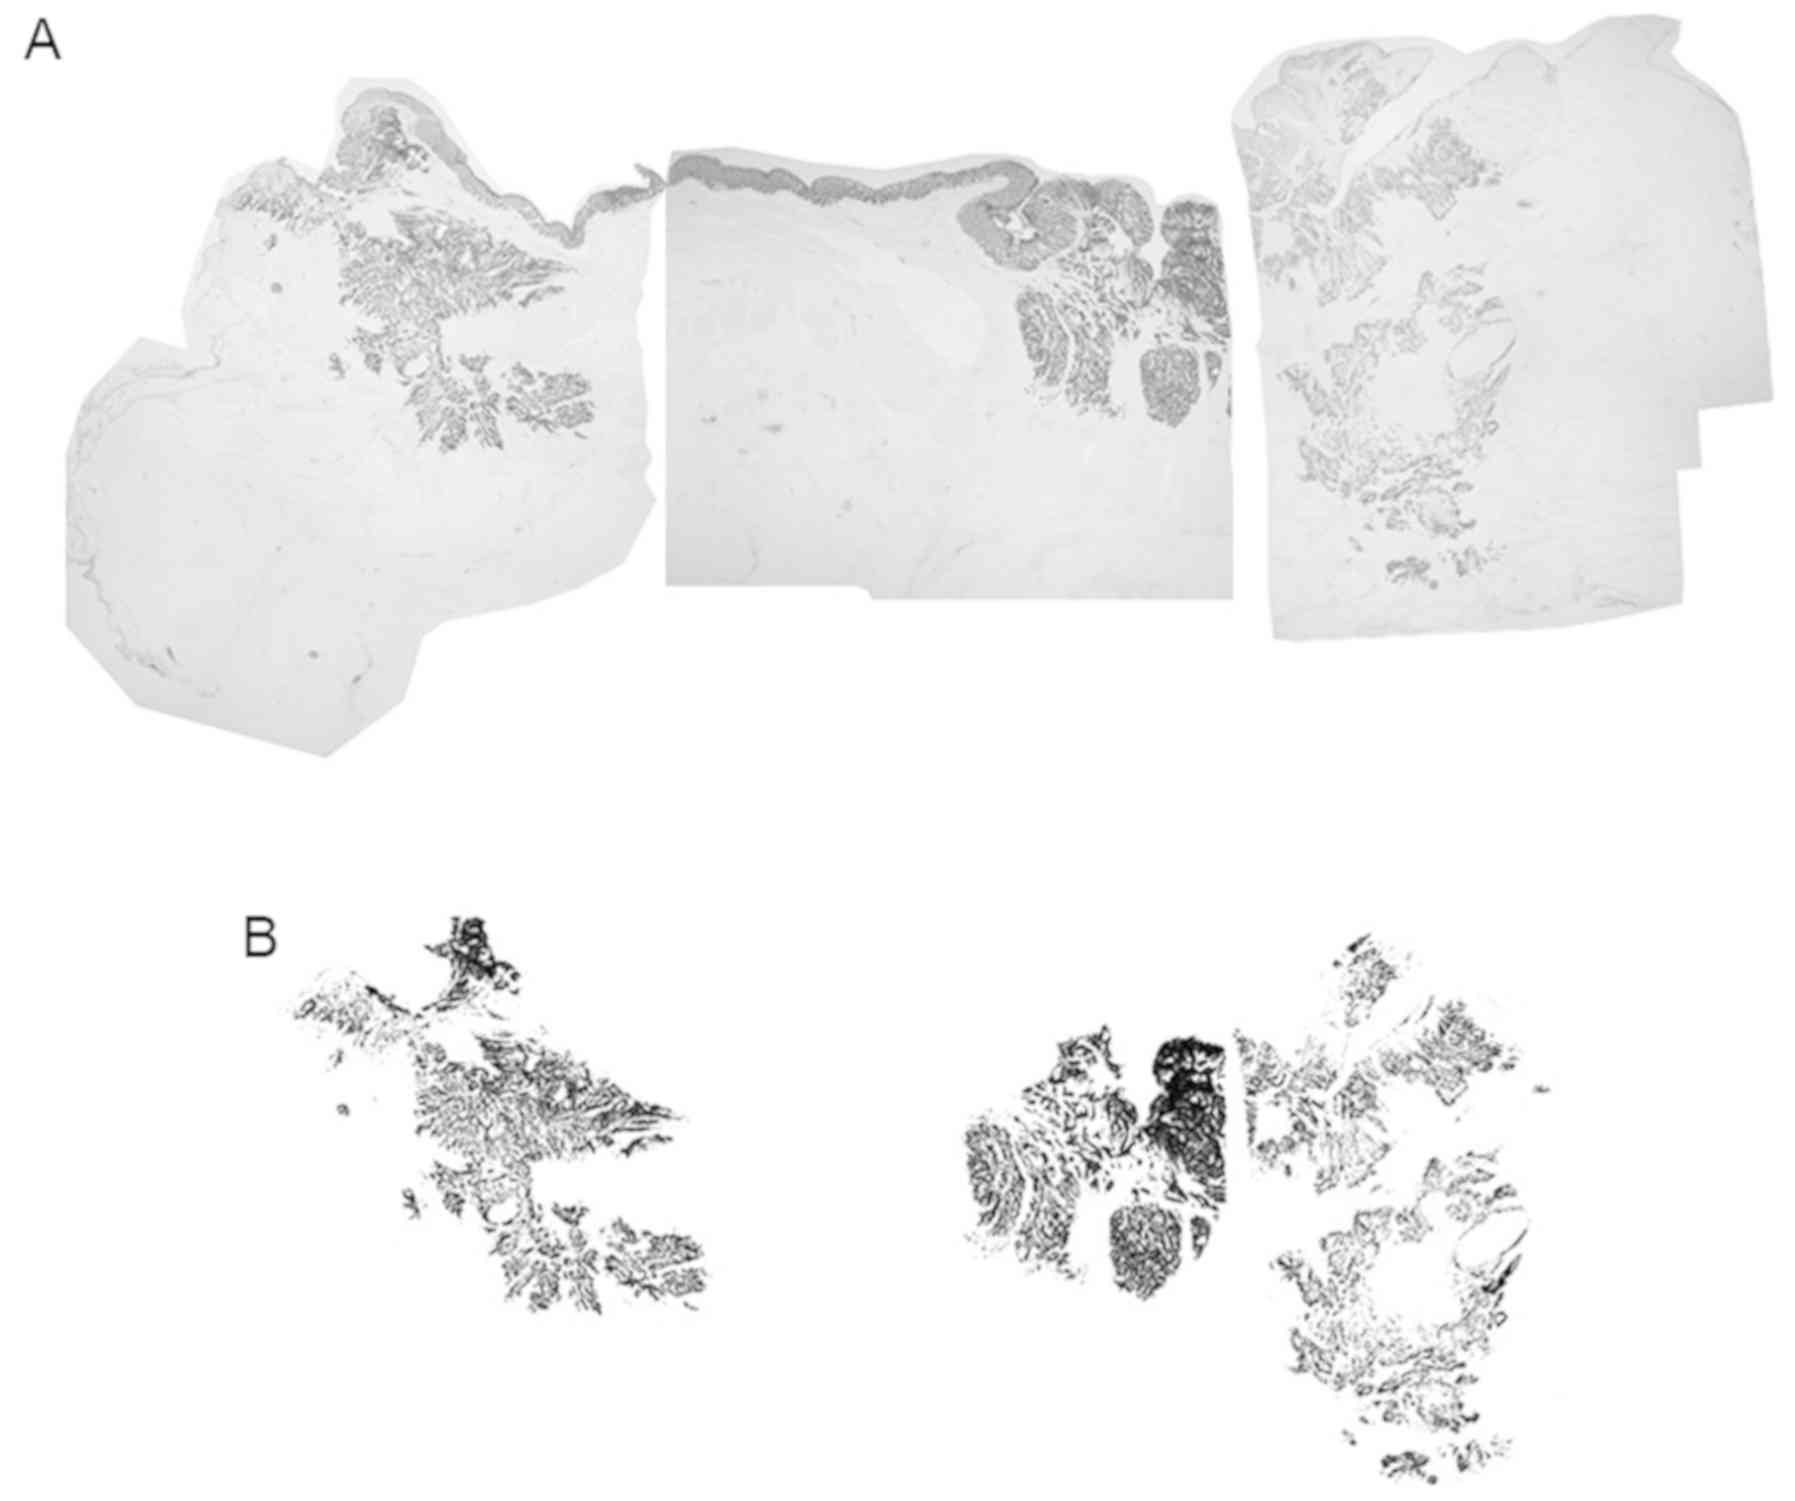
were then quantified by measuring the cytokeratin AE1/AE3-stained
area of the rectal cancer. Specifically, the immunostained sections
were scanned using light microscopy at a low magnification (×12.5).
All pieces from the immunostained sections were combined into a
single figure using Adobe Photoshop software. The color
deconvolution plugin was used to obtain a binarization image using
ImageJ software [Java 1.6.0_24 (64-bit)]. The cytokeratin
AE1/AE3-stained area was outlined in black using ImageJ software
and the cancer area was cropped out to remove the pathologically
non-cancerous area. Subsequently, cytokeratin AE1/AE3-stained
cancer cells were assessed using ImageJ software (Fig. 3).
Statistical analyses
Statistical comparisons were performed between high
and low cancer volume reduction ratio groups, on radiological
images, using a Pearson's Chi-square test. When the expected value
was <5, a Fisher's test was used instead. The between-group
statistical comparisons were analyzed using the Wilcoxon rank-sum
test for non-normally distributed continuous data and a two sample
t-test for normally distributed data. P<0.05 was considered to
indicate a statistically significant result. All statistical
analyses were performed using R (http://www.r-project.org).
Results
Clinicopathological features
Table I summarizes
the clinicopathological characteristics of the 50 rectal cancer
cases treated with NAC. The average age of the patients was 62.7
years. There were 38 male patients (76%) and 12 female patients
(24%). The locations of the rectal cancer were Ra (2 patients, 4%),
RaRb (1 patient, 2%), RaRbP (1 patient, 2%), Rb (43 patients, 86%)
and RbP (3 patients, 6%). Pathological T stages were pT0 (6
patients, 12%), pT1 (3 patients, 6%), pT2 (13 patients, 26%), pT3
(23 patients, 46%) and pT4 (5 patients, 10%). Pathological N stages
were pN0 (35 patients, 70%), pN1 (13 patients, 26%) and pN2 (2
patients, 4%). Histology was tubular adenocarcinoma, well
differentiated type (10 patients, 20%), moderately differentiated
type (33 patients, 66%), poorly differentiated (0 patient, 0%),
mucinous adenocarcinoma (1 patient, 2%) and not available (N.A.; 6
patients, 12%). Lymphatic invasion was as follows: Ly0, 21 patients
(42%); ly1, 19 patients (38%); ly2, 8 patients (16%); and ly3, 2
patients (4%). Venous invasion was as follows: V0, 11 patients
(22%); v1, 9 patients (18%); v2, 22 patients (44%); and v3, 8
patients (16%). A total of 6 patients achieved a complete
pathological response. All 6 complete pathological response cases
were graded after NAC as follows: pT0, pN0, N.A. (histology), ly0
and v0. The 6 complete response patients did not have any cancer
cells, so all 6 cases were classified as histologic type N.A. The
mean number of dissected lymph nodes was 27.48. The mean
pathological cancer area was 168.1 mm2. The mean
pathological changed area and pathological total area were 38.3 and
206.3 mm2, respectively. The cytokeratinAE1/AE3-stained
area was 49.4 mm2. The mean intervals from CT/MRI before
NAC to the NAC start date, and from CT/MRI after NAC to the surgery
date was 18.42 and 26.28 days, respectively. The mean radiological
donut-shaped image before and after NAC were 1,293 and 958.8
mm2, respectively. The mean cancer volume reduction
ratio on CT/MRI was 23%.
cStage prior to, and cStage and pStage
following, NAC
Table III presents
the cStage prior to, and cStage and pStage following NAC. No
cStage0 or cStageI cases were classified prior to NAC; however,
some Stage0 and StageI cases were classified following NAC. There
were many cStageIII cases prior to NAC; however, the number of
patients with StageIII decreased after NAC (cStage and pStage).
Definition and characteristics of the
high and low radiological cancer volume reduction groups
In the current study, the average value of the
radiological cancer volume reduction ratio was 23%. Therefore, ≥23%
was considered as the high radiological cancer volume reduction
group, whereas <23% was regarded as the low radiological cancer
volume reduction ratio group. These patient groups were used for
subsequent analysis.
A total of 25 patients were included in the high
radiological cancer volume reduction group, and 25 patients were
included in the low radiological cancer volume reduction group. The
cytokeratin AE1/AE3-stained area (P=0.04), mitosis (P=0.0027) and
radiological donut-shaped image after NAC (P=0.010) were
significantly lower in the high radiological cancer volume
reduction ratio group compared with the low radiological cancer
volume reduction group (Table IV).
There was no difference between the two groups regarding age, sex,
pT, pN, pStage, lymphatic invasion, venous invasion, pathological
cancer area, pathological changed area, pathological total area,
macro diameter and donut-shaped image before chemotherapy. All 6
complete pathological response cases were in the high radiological
cancer volume reduction ratio group.
| Table IV.Clinicopathological characteristics
of the low and high radiological cancer volume reduction ratio
groups. |
Table IV.
Clinicopathological characteristics
of the low and high radiological cancer volume reduction ratio
groups.
| Clinicopathological
feature | Low radiological
cancer volume reduction ratio group (n=25) | High radiological
cancer volume reduction ratio group (n=25) | P-value |
|---|
| Age, median,
years | 65 | 66 | 0.85 |
| Sex,
male/female | 20 (80)/5 (20) | 18 (72)/7 (28) | 0.51 |
| Pathological T
stage, pT0-1/pT2-4 | 2 (8)/23 (92) | 7 (28)/18 (72) | 0.069 |
| Pathological N
stage, pN0/pN1-2 | 16 (64)/9 (36) | 19 (76)/6 (24) | 0.355 |
| Pathological stage,
pStage0-I/pStageII–III | 7 (28)/18 (72) | 13 (52)/12
(48) | 0.083 |
| Lymphatic invasion,
high (ly2-3)/low (ly0-) | 8 (32)/17 (68) | 2 (8)/23 (92) | 0.074 |
| Venous invasion,
high (v2-3)/low (v0-1) | 18 (72)/7 (28) | 12 (48)/13
(52) | 0.083 |
| Pathological cancer
area, median, mm2 | 105 | 55.6 | 0.14 |
| Pathological
changed area, median, mm2 | 24.3 | 26.7 | 0.8 |
| Pathological total
area, median, mm2 | 137 | 76.2 | 0.22 |
|
CytokeratinAE1/AE3-stained area, median,
mm2 | 42.8 | 14.3 | 0.04 |
| Mitosis,
median | 26 | 12 | 0.0027 |
| Macro diameter,
median, mm | 36 | 37 | 0.97 |
| Radiological
donut-shaped image before NAC, median | 1075.7 | 1259.8 | 0.095 |
| Radiological
donut-shaped image after NAC, median | 987.4 | 728.1 | 0.010 |
Discussion
A number of studies have demonstrated the
correlation between pathological therapeutic effect and prognosis
in rectal cancer after preoperative chemoradiotherapy (3,15).
However, to the best of our knowledge, no study has compared the
radiological images and pathology of rectal cancer cases treated
with NAC. In the current study, clinicopathological differences
were compared between high and low radiological cancer volume
reduction ratio groups in patients with rectal cancer treated with
NAC. The rectal cancer area is difficult to measure accurately as a
luminal organ using CT and/or MRI, so the radiological donut-shaped
image of the rectum was used, at the maximum cancer size prior to
and following NAC. The radiological cancer reduction ratio was then
calculated from this analysis.
The cytokeratin AE1/AE3-stained area was smaller in
the high radiological cancer volume reduction ratio group compared
with the low radiological cancer volume reduction ratio group. This
result may suggest that the radiological cancer volume reduction
ratio can be used to estimate the approximate cancer cell mass
following NAC treatment. There was no previous indication that CT
and/or MRI imaging could predict cancer cell mass following NAC. CT
and MRI are two commonly used clinical non-invasive imaging
techniques. In the current study, CT and MRI were used to determine
if the tumor size decreased following NAC treatment, and the
results indicated that tumor cell mass reduced following NAC.
Additionally, mitosis was lower in the high radiological cancer
volume reduction ratio group compared with the low radiological
cancer volume reduction ratio group. High radiological cancer
volume reduction ratio may indicate low cancer cell proliferation.
The association exhibited between radiological images and pathology
after NAC may potentially influence the management of patients with
rectal cancer. Radiological cancer volume reduction ratio could
potentially be used to indicate if NAC treatment is pathologically
effective in patients with rectal cancer, and this may influence
treatment decisions. The pathological cancer area and pathological
changed areas were not observed to be directly associated with the
radiological reduction ratio. This discrepancy could be attributed
to radiologically reduced cancer volumes without pathological
fibrosis/scar formation. In some patient cases, cancer tissues
completely disappeared after NAC and marked histological changes
(including fibrosis or scarring) were not identified, whereas tumor
volumes declined in the radiological image. Due to this, the
assessment of the pathological therapeutic effect is indicated to
be subjective, which could also account for the
pathological/radiological discrepancy. The radiological
donut-shaped image after NAC was smaller in the high radiological
cancer volume reduction ratio group. The radiological cancer volume
reduction ratio was associated with the radiological donut-shaped
image following NAC, irrespective of the image captured prior to
NAC, suggesting that the preoperative size (prior to NAC) of the
cancer area was not crucial, but the cancer area after NAC
(radiological donut-shaped image following NAC) was crucial.
Dworak et al (16) proposed the grading of regression as a
pathological feature of rectal cancer after preoperative
chemoradiotherapy. Dworak's regression was graded from grade 0 to
4. The grading of regression is focused on fibrosis in cancer and
is a semiquantitative system that associates treatment effect with
the amount of fibrosis. Reportedly, tumor regression grade (TRG)
has prognostic significance after preoperative chemoradiotherapy in
rectal cancer (3,15). Mandard et al (17) reported TRG in esophageal cancer after
preoperative therapy. TRG comprises five grades from TRG1 to TRG5
and is also a semiquantitative system that associates the amount of
residual cancer with the amount of fibrosis. The present study
examined pathological changed area as the treatment effect area.
However, no significant differences were exhibited between the high
and low radiological cancer volume reduction ratio groups in
pathologically changed area. For preoperative chemoradiation and
NAC in rectal cancer, histological therapeutic effects may differ.
New histological therapeutic effect classifications are required
for NAC in rectal cancer. CytokeratinAE1/AE3-stained area may be
used to develop new histological therapeutic classifications.
In conclusion, the current study indicated an
association between radiological images and the pathology of rectal
cancer treated with NAC. Only 50 patient cases were examined;
however, the results of the current study may facilitate the
estimation of pathological factors in surgical specimens from
radiological image examination, with the accumulation of further
analysis in the future.
Acknowledgements
Not applicable.
Funding
The present study was supported by Grants-in-Aid for
Science from The Ministry of Education, Culture, Sports, Science
and Technology of Japan; The Hirosaki University Institutional
Research and The Fund for the Promotion of International Scientific
Research (grant no. 17H04057).
Availability of data and materials
The datasets used and/or analyzed during the current
study are available from the corresponding author on reasonable
request.
Authors' contributions
SM wrote the manuscript and made substantial
contribution to acquisition of data and analysis. HS, TY, TH, SG,
YW, and HK provided substantial contributions to analysis and
interpretation of data in the present study. HM, YS, and KH made
substantial contributions to the acquisition of data. All authors
read and approved the final manuscript.
Ethics approval and consent to
participate
This study performed in accordance with the
Declaration of Helsinki and was approved by the Ethics Committee of
Hirosaki University Graduate School of Medicine (organization no.
2015-118).
Patient consent for publication
The patients provided written informed consent for
the publication of any associated data and accompanying images.
Competing interests
The authors declare that they have no competing
interests.
Glossary
Abbreviations
Abbreviations:
|
NAC
|
neoadjuvant chemotherapy
|
References
|
1
|
Hori M, Matsuda T, Shibata A, Katanoda K,
Sobue T and Nishimoto H; Japan Cancer Surveillance Research Group,
: Cancer incidence and incidence rates in Japan in 2009: A study of
32 population-based cancer registries for the monitoring of cancer
incidence in Japan (MCIJ) project. Jpn J Clin Oncol. 45:884–891.
2015. View Article : Google Scholar : PubMed/NCBI
|
|
2
|
Díaz-González JA, Calvo FA, Cortés J,
García-Sabrido JL, Gómez-Espí M, Del Valle E, Muñoz-Jiménez F and
Alvarez E: Prognostic factors for disease-free survival in patients
with T3-4 or N+ rectal cancer treated with preoperative
chemoradiation therapy, surgery, and intraoperative irradiation.
Int J Radiat Oncol Biol Phys. 64:1122–1128. 2006. View Article : Google Scholar : PubMed/NCBI
|
|
3
|
Rödel C, Martus P, Papadoupolos T, Füzesi
L, Klimpfinger M, Fietkau R, Liersch T, Hohenberger W, Raab R,
Sauer R and Wittekind C: Prognostic significance of tumor
regression after preoperative chemoradiotherapy for rectal cancer.
J Clin Oncol. 23:8688–8696. 2005. View Article : Google Scholar : PubMed/NCBI
|
|
4
|
Valentini V, Coco C, Picciocchi A,
Morganti AG, Trodella L, Ciabattoni A, Cellini F, Barbaro B,
Cogliandolo S, Nuzzo G, et al: Does downstaging predict improved
outcome after preoperative chemoradiation for extraperitoneal
locally advanced rectal cancer? A long-term analysis of 165
patients. Int J Radiat Oncol Biol Phys. 53:664–674. 2002.
View Article : Google Scholar : PubMed/NCBI
|
|
5
|
Vecchio FM, Valentini V, Minsky BD, Padula
GD, Venkatraman ES, Balducci M, Miccichè F, Ricci R, Morganti AG,
Gambacorta MA, et al: The relationship of pathologic tumor
regression grade (TRG) and outcomes after preoperative therapy in
rectal cancer. Int J Radiat Oncol Biol Phys. 62:752–760. 2005.
View Article : Google Scholar : PubMed/NCBI
|
|
6
|
Chee CG, Kim YH, Lee KH, Lee YJ, Park JH,
Lee HS, Ahn S and Kim B: CT texture analysis in patients with
locally advanced rectal cancer treated with neoadjuvant
chemoradiotherapy: A potential imaging biomarker for treatment
response and prognosis. PLoS One. 12:e01828832017. View Article : Google Scholar : PubMed/NCBI
|
|
7
|
Hasegawa S, Goto S, Matsumoto T, Hida K,
Kawada K, Matsusue R, Yamaguchi T, Nishitai R, Manaka D, Kato S, et
al: A multicenter phase 2 study on the feasibility and efficacy of
neoadjuvant chemotherapy without radiotherapy for locally advanced
rectal cancer. Ann Surg Oncol. 24:3587–3595. 2017. View Article : Google Scholar : PubMed/NCBI
|
|
8
|
Peeters KC, van de Velde CJ, Leer JW,
Martijn H, Junggeburt JM, Kranenbarg EK, Steup WH, Wiggers T,
Rutten HJ and Marijnen CA: Late side effects of short-course
preoperative radiotherapy combined with total mesorectal excision
for rectal cancer: Increased bowel dysfunction in irradiated
patients-a Dutch colorectal cancer group study. J Clin Oncol.
23:6199–6206. 2005. View Article : Google Scholar : PubMed/NCBI
|
|
9
|
Chen FC, Mackay JR, Woods RJ, Collopy BT,
Fink RJ and Guiney MJ: Early experience with postoperative adjuvant
chemoradiation for rectal carcinoma: Focus on morbidity. Aust N Z J
Surg. 65:732–736. 1995. View Article : Google Scholar : PubMed/NCBI
|
|
10
|
Kollmorgen CF, Meagher AP, Wolff BG,
Pemberton JH, Martenson JA and Illstrup DM: The long-term effect of
adjuvant postoperative chemoradiotherapy for rectal carcinoma on
bowel function. Ann Surg. 220:676–682. 1994. View Article : Google Scholar : PubMed/NCBI
|
|
11
|
Da Silva GM, Berho M, Wexner SD, Efron J,
Weiss EG, Nogueras JJ, Vernava AM III, Connor JT and Gervaz P:
Histologic analysis of the irradiated anal sphincter. Dis Colon
Rectum. 46:1492–1497. 2003. View Article : Google Scholar : PubMed/NCBI
|
|
12
|
Nishizawa Y, Fujii S, Saito N, Ito M,
Ochiai A, Sugito M, Kobayashi A and Nishizawa Y: The association
between anal function and neural degeneration after preoperative
chemoradiotherapy followed by intersphincteric resection. Dis Colon
Rectum. 54:1423–1429. 2011. View Article : Google Scholar : PubMed/NCBI
|
|
13
|
Milburn Jessup J, Goldber RM, Asare EA,
Benson ALB III, Brierley JD, Chang GJ, Chen V, Compton CC, De Nard
P, Goodman KA, et al: AJCC: AJCC cancer staging manualColon and
Rectum. 8th. Springer; Switzerland: pp. 251–274. 2017
|
|
14
|
Abramoff MD, Magelhaes PJ and Ram SJ:
Image Processing with ImageJ. Biophot Int. 11:36–42. 2004.
|
|
15
|
Fokas E, Strobel P, Fietkau R, Ghadimi M,
Liersch T, Grabenbauer GG, Hartmann A, Kaufmann M, Sauer R, Graeven
U, et al: Tumor regression grading after preoperative
chemoradiotherapy as a prognostic factor and individual-level
surrogate for disease-free survival in rectal cancer. J Natl Cancer
Inst. 109:2017. View Article : Google Scholar : PubMed/NCBI
|
|
16
|
Dworak O, Keilholz L and Hoffmann A:
Pathological features of rectal cancer after preoperative
radiochemotherapy. Int J Colorectal Dis. 12:19–23. 1997. View Article : Google Scholar : PubMed/NCBI
|
|
17
|
Mandard AM, Dalibard F, Mandard JC, Marnay
J, Henry-Amar M, Petiot JF, Roussel A, Jacob JH, Segol P, Samama G,
et al: Pathologic assessment of tumor regression after preoperative
chemoradiotherapy of esophageal carcinoma. Clinicopathologic
correlations. Cancer. 73:2680–2686. 1994. View Article : Google Scholar : PubMed/NCBI
|