Introduction
Multiple myeloma (MM) is characterized by the
infiltration and growth of malignant plasma cells in the bone
marrow. When the signs of end-organ damage occur, systemic
treatment should be initiated (1).
Initially, Durie and Salmon determined that lytic bone lesions on
radiographs, hemoglobin levels, serum calcium and monoclonal
proteins were correlated with tumor mass and patient survival. The
criteria of end-organ damage are based on the Durie-Salmon (D-S)
staging system (2). Notably, this
staging system has been widely used in recent decades. However, the
primary limitation of X-ray modality is the requirement of a
minimum of 30% trabecular bone involvement for lesion detectability
(3). To assess bone disease with
more sensitivity (1,4), a newer D-S PLUS staging system
including MR imaging and 18F-FDG PET/CT was introduced
by the International Myeloma Working Group (IMWG). The D-S PLUS
staging primarily relies on two clinical factors: The number of
focal lesions (FLs) and the diffuse infiltration (DI) level of bone
marrow (Table I).
 | Table ID-S and D-S PLUS staging system. |
Table I
D-S and D-S PLUS staging system.
| Stages | D-S staging
system | D-S PLUS staging
system (MR imaging/PET) |
|---|
| I | All of the following:
Hemoglobin, >10 g/dl; Albumin, >3.5 g/dl; Serum calcium, ≤12
mg/dl; Low M-protein concentration (IgG, <5 g/d; IgA, <3 g/d;
and Bence Jones protein, <4 g/24 h); and X-ray, normal bone
structure or solitary bone plasmocytoma only. | A: Normal skeletal
survey or single lesion (plasmocytoma). Ba: 0-4 FLs or mild DI. |
| II | Neither stage I nor
stage III. | A/Ba: 5-20 FLs or moderate DI. |
| III | One or more of the
following: Hemoglobin, <8.5 g/dl; Serum calcium, <12 mg/dl;
extensive lytic bone lesions; and high M-protein concentration (IgG
>7 g/dl, IgA >5 g/dl or Bence Jones protein >12 g/24
h). | A/Ba: >20 FLs or severe DI. |
The main task for radiologists is to identify the
number and extent of bone lesions via those sensitive imaging
technologies. MR imaging of the spine or pelvis is used to evaluate
the DI of MM, which is considered as the gold standard technique
for assessing DI of the bone marrow, according to a number of
systematic reviews with large samples (5,6).
18F-FDG PET/CT is applied for FLs assessment more often
than routine MR imaging, because of a larger field of view (FOV)
and more availability than whole-body MR imaging. DI assessment
(via MR imaging of the spine or pelvis) and FL assessment (via
PET/CT) are combined to perform D-S PLUS staging. For simplified
procedure or patients who have MR imaging contraindications, PET/CT
alone is also used to perform one-stop D-S PLUS staging, that is,
both FLs and DI can be assessed by PET/CT.
18F-FDG PET/CT has been considered a
valuable tool for the evaluation of newly diagnosed and relapsed MM
by the IMWG, the National Comprehensive Cancer Network of MM and
the British Society for Haematology (7,8).
However, to the best of our knowledge, there is no available
standard for the interpretation of PET/CT alone in D-S PLUS
staging. To further promote the application of PET/CT, a group of
nuclear medicine physicians and hematologists are attempting to
formulate guidelines or criteria for imaging interpretation
(9), in which only the levels of FDG
uptake were adopted for DI assessment, while the CT component of
PET/CT is not included. This may be unsuitable for patients with
low or no uptake of 18F-FDG in lesions but with
osteolytic destruction that can be manifested on CT imaging. In
this study, we investigated a method for DI assessment that focused
on the CT component of PET/CT for diagnostic purposes. In addition,
the D-S PLUS staging system was compared with the Revised
International Staging System (R-ISS) in the assessment of disease
burden and prognosis at initial staging, the later relying
primarily on laboratory parameters (10).
Patients and methods
Patients
This retrospective study was performed following
approval by the Ethics Comittee of Shanghai General Hospital
(Shanghai, China). The Ethics board waived informed patient
consent. Patients were diagnosed with MM on the basis of the
criteria defined by IMWG (11).
A total of 28 patients with untreated newly
diagnosed MM between 2012 and 2017 were included in the present
study. All patients underwent whole-body 18F-FDG PET and
vertebral column or pelvic MR imaging within a period of a week.
The following staging and diagnostic data were simultaneously
available for all patients: Whole blood count, routine
biochemistry, serum β2-microglobulin levels, C-reactive protein,
serum and urinary immunofixation, complete immunoglobulin and
serum-free light chain concentrations, 24 h proteinuria, bone
marrow biopsy and chromosomal abnormalities detected by interphase
fluorescent in situ hybridization (iFISH). The follow-up
data of 4 patients could not be collected. The 24 remaining
patients containing 6 women and 18 men with a mean age of 61 years
(range from 24-77 years) were treated with therapeutic regimens
including immunomodulatory agents or proteasome inhibitors. The
treatment was subsequently followed by autologous bone marrow
transplantation in 5 patients. The median follow-up time was 17.4
months (range from 1 to 42 months). Patients were followed up from
the date of diagnosis up to May 2018 or when death occurred.
Additionally, progression-free survival (PFS) was considered the
endpoint. Image acquisition of PET/CT and MR imaging and image
interpretation criterion are provided in Data S1.
Statistical analysis
The McNemar and Kappa tests were performed to
evaluate the differences and concordance among the results,
respectively. The degree of agreement by Kappa was interpreted as
follows: Kappa ≥0.75, substantial agreement; 0.75> Kappa ≥0.4,
moderate agreement; and Kappa <0.4, slight or fair agreement.
Data were analyzed using SPSS 17.0 (SPSS, Inc.). P<0.05 was
considered to indicate a statistically significant difference. The
PFS curves of D-S PLUS staging and R-ISS staging were estimated
using the Kaplan-Meier method and compared using the log-rank
test.
Results
The new method that considered the CT component of
PET/CT for DI assessment, was classified into three levels
according to the MR imaging results (Table II). The three levels of MRI are
shown in Figs.
S1-S3, respectively. The P-value of the McNemar test between
the new method and the MR imaging results was P=0.513, suggesting
no significant difference between the new method and MR imaging for
DI assessment. The Kappa value was 0.745, indicating moderate
agreement (a Kappa value ≥0.75 means substantial agreement). The
routine method PET/CT, in which only the results of PET component
were analyzed, was compared with MR imaging for the concordance of
DI assessment. The P-value for the McNemar test was 0.03, showing a
significant difference between the two methods, while the Kappa
value was 0.547 indicating moderate agreement. This might be caused
by using different methods to analyze the data. The Kappa value
could be used as a reference for this test.
| Table IIOptimal combination of CT and PET
component for DI assessment. |
Table II
Optimal combination of CT and PET
component for DI assessment.
| PET | CT | DI-PET/CT
(stage) |
|---|
| 0 | 0 | Mild DI |
| 0 | 1 | Moderate DI |
| 1 | 0 | Moderate DI |
| 1 | 1 | Severe DI |
The new method and routine method of performing
PET/CT for DI assessment were applied in the D-S PLUS staging
system for comparison. MR imaging with the D-S PLUS staging was
considered the control group for DI assessment. There was no
significant difference between the new method and the control group
(McNemar test, P=0.317). The Kappa value was 0.930, suggesting
substantial agreement. In addition, no significant difference was
found between the routine method and the control group (McNemar
test, P=0.223). The Kappa value was 0.811, suggesting substantial
agreement. Notably, the Kappa value was lower than that of the new
method (Kappa=0.93).
Thus, the results of new method PET/CT including the
CT component for the diagnostic purpose of DI assessment were more
consistent with these of MR imaging when compared with the routine
method PET/CT, which consisted of only the levels of
18F-FDG uptake (Kappa, 0.745 vs. 0.547). The same
statistical outcomes could be obtained when the methods were
considered for D-S PLUS staging (Kappa, 0.930 vs. 0.811).
And CT manifested 3 modes in DI of MM in our study, Osteolytic
type, osteoporosis type and insect-corroded osteolytic type, shown
on Figs.
1-3 respectively, which will be discussed in detail later.
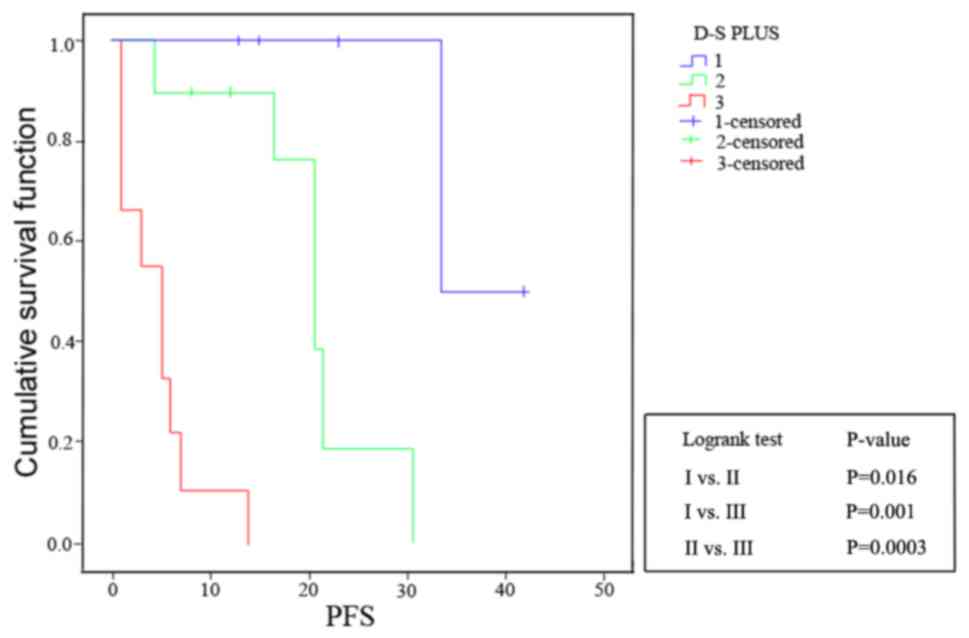
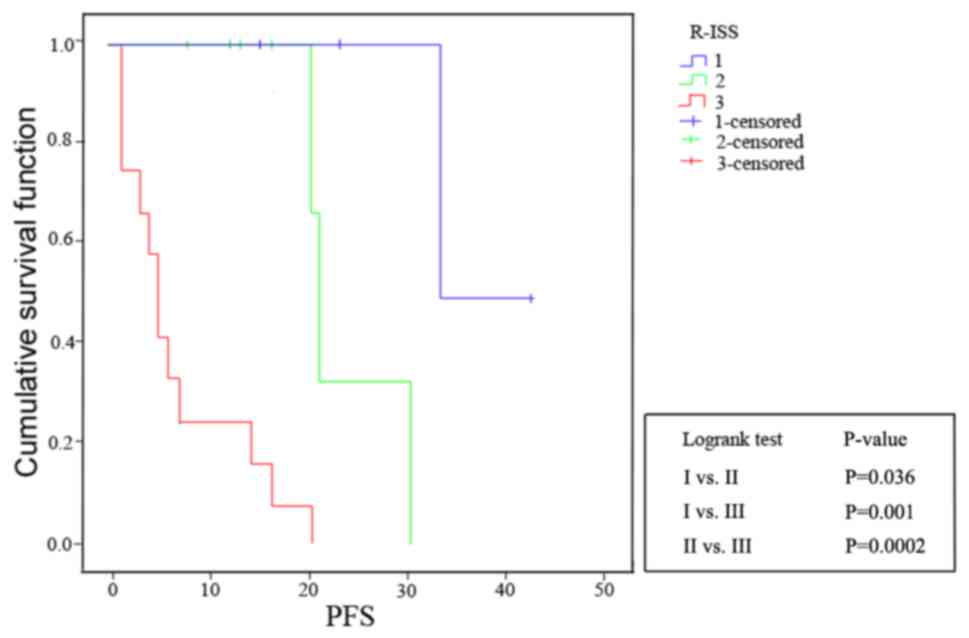
The PFS curves showed that both current D-S PLUS
staging with MR imaging for DI assessment and R-ISS staging had
good prognostic value (D-S PLUS staging: I vs. II, P=0.016;
I vs. III, P=0.001; and II vs. III, P=0.0003; R-ISS
staging: I vs. II, P=0.036; I vs. III, P=0.001; and
II vs. III, P=0.0002), which were shown in Figs. 4 and 5. The P-value of McNemar test for D-S PLUS
stage system and R-ISS stage system was 0.223, indicating no
significant difference between them. Furthermore, a Kappa value of
0.6789 (0.4≤ Kappa <0.75) showed moderate agreement.
Discussion
MR imaging is considered as the gold standard for DI
assessment. Due to the infiltration of the bone marrow via
displacement of fat cells by neoplastic cells, the lesions can be
visualized as areas of low signal intensity on T1-weighted
spin-echo images and high signal intensity on T2 fat-suppressed
images, when the tumor cells accumulate to a certain extent.
The levels of 18F-FDG uptake can reflect
the activity of neoplastic cells. In a consensus statement by the
IMWG in 2017, 12 studies containing 859 patients reported the
sensitivity and specificity of 18F-FDG PET in detecting
bone damage caused by neoplastic cells (80-100%). For CT imaging, a
certain amount of time must pass before the osteoclastic activity
of myeloma cells leads to the destruction of trabecular or cortical
bone (12). Thus, in the majority of
PET/CT studies concerning DI of bone marrow, only the PET component
of PET/CT is considered to be able to identify the progression of
DI. While the CT component of PET/CT has not been widely considered
for diagnostic purposes in the assessment of DI, and only used for
primary level attenuation correction and focal localization in PET
imaging. In a systematic review concerning diagnostic performance
of whole-body MR imaging and 18F-FDG PET/CT in patients
with myeloma, only one study considered the CT component of PET/CT
for reference standard of assessing lesions, and the others focused
on the PET component only (13).
However, the PET component does not always hold true. Taking a case
from our study for example, all MR imaging, CT results and
pathological tests revealed positive DI of bone marrow, however,
the uptake of 18F-FDG was negative. These results
indicated that the 18F-FDG uptake of myeloma cells might
be suppressed, leading to an inferior DI assessment by PET/CT when
compared with MR imaging.
The CT component of PET/CT can aid the assessment of
DI cases with no or low 18F-FDG uptake, although it may
be still negative when the early MM does not present bone
destruction. In our study, compared with the routine method without
the CT component of PET/CT, the new method that considered the CT
component of PET/CT has a better consistency with MR imaging
(Kappa, 0.745 vs. 0.547). The same results could be obtained
when performed D-S PLUS staging.
According to the European Myeloma Network
Guidelines, the grading levels of evidence of CT in evaluating bone
destruction lesions is 1A compared with that of the traditional
X-ray (14). However, CT evaluation
of bone marrow invasion also requires careful identification. In
the analysis of cases in this study, we found that diffuse bone
marrow invasion and positive manifestations of MM were mainly
divided into three modes on CT, Osteolytic type, osteoporosis type
and insect-corroded osteolytic type, and illustrated in the
Results. The first type requires identification via osteoclastic
metastatic tumors and is mainly manifested as diffuse circular bone
destruction area with clear boundary, no hardening edge and
periosteal osteogenesis; The second needs to be distinguished from
osteoporosis caused by senile non-myelogenous, long-term alcoholism
and hormone therapy, and is mainly observed with reduced bone
density, sparse bone ridges and irregular thickening of residual
bone trabeculae without obvious bone damage; The last identified
via osteolytic bone damage with clear boundaries and no hardening,
is diffuse and punctured. All the above types can be combined with
pathological fractures and should be identified via fractures
caused by osteoporosis.
It is well known that hyperglycemia and the recent
administration of high-dose steroids can lead to a transient
metabolic suppression. Besides that, there may be some other
reasons associated with the intrinsic features of myeloma cells.
Several studies have shown that myeloma cells might not be
18F-FDG-avid (15-17).
In the study by Rasche et al, 227 newly diagnosed MM
patients were prospectively and simultaneously studied at baseline
with diffusion weighted imaging (DWI) whole-body MR imaging and
18F-FDG PET, along with iFISH and gene expression
profiling (GEP) (18). The
researchers found that 11% of those patients were PET
false-negative/DWI MR imaging-positive, and none of these patients
belonged to the GEP-defined hyperdiploid or proliferative molecular
subgroup. Most importantly, in those 21 differentially expressed
genes between the PET false-negative/DWI MR imaging-positive group
and PET-positive/DWI MR imaging-positive group, the top gene was
the one coding for hexokinase-2, and its expression was
significantly lower in the PET false-negative group. Furthermore,
deregulation of 5 other genes involved in metabolism was also
observed (18). The reason for the
decline of related genes regulation remains to be further studied.
According to the reverse Warburg effect, aerobic glycolysis takes
place in tumor-associated fibroblasts but not in cancer cells.
Therefore, we can speculate that the level of 18F-FDG
uptake of DI may be associated with the oxygen content in the
microenvironment of bone marrow and vary with the different
processes of MM. However, such hypotheses have not been explored in
18F-FDG studies.
In addition to false negatives, false positives of
18F-FDG uptake can occasionally be found in routine
clinical practice. Most of false positives are associated with
increased red bone marrow conversion due to anemia, and the false
positives caused by bone marrow conversion are difficult for
antidiastole with DI of tumor cells in either PET/CT or MR imaging.
Prospective trials that extensively apply novel techniques must be
performed. At present, researchers have been investigating new
PET/CT tracers that target different metabolic pathways or
receptors expressed by MM cells to improve the sensitivity and
specificity of imaging modalities in the D-S PLUS stage system.
Preliminary results have been recorded (19,20).
In the present study, both the D-S PLUS staging
systems mainly relying on imaging findings and R-ISS staging
systems basing on clinical laboratory data have good prognostic
value for PFS. However, the former is considered more intuitive and
stable, particularly useful for monitoring disease status and
comparing treatment response in non-secretory patients (21,22). Due
to the limitation of the sample size, we did not analyze the rate
of PET/CT false negatives in detail because the small numbers might
lead to statistical bias. In addition, the diffuse bone marrow
invasion performance by CT might not be exhaustive in previously
discussion. To provide more reliable evidence for clinical
practice, larger studies are required.
In conclusion, the inclusion of CT findings from
PET/CT for diagnostic purposes can further improve the ability to
assess DI by reducing the false negatives when compared with the
routine PET/CT method, especially in those cases with no or low
avidity to 18F-FDG. Notably, the CT findings can be
false negatives when the bone trabeculae has not been destroyed in
early MM. Implementing this method may be helpful for clinicians
when considering PET/CT for one-stop D-S PLUS staging in cases
where patients have contraindications for MR imaging or if
whole-body MR imaging is not available.
Supplementary Material
Data S1.
Figure S1. (A and B) Normal pattern of
the bone marrow in a 77-year-old man. (A) T1wi indicated a
hyperintense signal compared with the intervertebral disk. (B) T2wi
revealed the hyperintense signal caused yellow bone marrow. (C and
D) FLs in the first lumbar vertebral body of a 64-year-old man. (C)
T1wi indicated a hypointense signal, and (D) T2-TIRM revealed a
hyperintense signal. FL, focal lesions.
Figure S2. A 65-year-old male with
severe DI. (A) T1wi indicated a decreased signal, which was as low
as that of the intervertebral discs. (B) T2-TIRM revealed a
hyperintense signal compared with muscle.
Figure S3. A 64-year-old male with the
S&P pattern. (A) T1wi showed mixed hyper- and hypointense, also
known as a S&P pattern. (B) On T2-TIRM images no focal lesions
were identified, this finding corresponds to normal bone marrow. A
T12 vertebral body compression fracture was indicated.
Acknowledgements
Not applicable.
Funding
This study was supported by the Shanghai Science and
Technology Commission Research Project (grant no. 17411953200); the
Shanghai Shenkang Hospital Development Center Clinical Auxiliary
Departments Capacity Building Project (grant no. SHDC22015032).
Availability of data and materials
The datasets used and analyzed during the present
study are available from the corresponding author on reasonable
request.
Authors' contributions
JZ and JY conceived and designed the present study.
TW and XP performed the experiments and wrote the manuscript. TW,
JY and WQ acquired the data. XP and YX analyzed and interpreted the
data. TW, WQ and YX performed statistical analysis. JZ revised the
manuscript for important intellectual content. All authors read and
approved the final manuscript.
Ethics approval and consent to
participate
This retrospective study was performed following
approval by the Ethics Comittee of Shanghai General Hospital
(Shanghai, China). The Ethics board waived informed patient
consent. (approval no. 2018KY167).
Patient consent for publication
Not applicable.
Competing interests
The authors declare that they have no competing
interests.
References
|
1
|
Durie BG, Kyle RA, Belch A, Bensinger W,
Blade J, Boccadoro M, Child JA, Comenzo R, Djulbegovic B, Fantl D,
et al: Myeloma management guidelines: A consensus report from the
scientific advisors of the International Myeloma Foundation.
Hematol J. 4:379–398. 2003.PubMed/NCBI
|
|
2
|
Dimopoulos M, Kyle R, Fermand JP, Rajkumar
SV, San Miguel J, Chanan-Khan A, Ludwig H, Joshua D, Mehta J, Gertz
M, et al: Consensus recommendations for standard investigative
workup: Report of the International Myeloma Workshop Consensus
Panel 3. Blood. 117:4701–4705. 2011.PubMed/NCBI View Article : Google Scholar
|
|
3
|
Durie BG and Salmon SE: A clinical staging
system for multiple myeloma. Correlation of measured myeloma cell
mass with presenting clinical features, response to treatment, and
survival. Cancer. 36:842–854. 1975.PubMed/NCBI View Article : Google Scholar
|
|
4
|
International Myeloma Working Group.
Criteria for the classification of monoclonal gammopathies,
multiple myeloma and related disorders: A report of the
International Myeloma Working Group. Br J Haematol. 121:749–757.
2003.PubMed/NCBI
|
|
5
|
Mesguich C, Fardanesh R, Tanenbaum L,
Chari A, Jagannath S and Kostakoglu L: State of the art imaging of
multiple myeloma: Comparative review of FDG PET/CT imaging in
various clinical settings. Eur J Radio. 83:2203–2223.
2014.PubMed/NCBI View Article : Google Scholar
|
|
6
|
van Lammeren-Venema D, Regelink JC,
Riphagen II, Zweegman S, Hoekstra OS and Zijlstra JM:
18F-Fluoro-deoxyglucose positron emission tomography in
assessment of myeloma-related bone disease: A systematic review.
Cancer. 118:1971–1981. 2012.PubMed/NCBI View Article : Google Scholar
|
|
7
|
Cavo M, Terpos E, Nanni C, Moreau P,
Lentzsch S, Zweegman S, Hillengass J, Engelhardt M, Usmani SZ,
Vesole DH, et al: Role of 18F-FDG PET/CT in the
diagnosis and management of multiple myeloma and other plasma cell
disorders: A consensus statement by the International Myeloma
Working Group. Lancet Oncol. 18(e206-e217)2017.PubMed/NCBI View Article : Google Scholar
|
|
8
|
Chantry A, Kazmi M, Barrington S, Goh V,
Mulholland N, Streetly M, Lai M and Pratt G: British Society for
Haematology Guidelines. Guidelines for the use of imaging in the
management of patients with myeloma. Br J Haematol. 178:380–393.
2017.PubMed/NCBI View Article : Google Scholar
|
|
9
|
Nanni C, Versari A, Chauvie S, Bertone E,
Bianchi A, Rensi M, Bellò M, Gallamini A, Patriarca F, Gay F, et
al: Interpretation criteria for FDG PET/CT in multiple myeloma
(IMPeTUs): Final results. IMPeTUs (Italian myeloma criteria for PET
USe). Eur J Nucl Med Mol Imaging. 45:712–719. 2018.PubMed/NCBI View Article : Google Scholar
|
|
10
|
Palumbo A, Avet-Loiseau H, Oliva S,
Lokhorst HM, Goldschmidt H, Rosinol L, Richardson P, Caltagirone S,
Lahuerta JJ, Facon T, et al: Revised international staging system
for multiple myeloma: A report from international myeloma working
group. J Clin Oncol. 33:2863–2869. 2015.PubMed/NCBI View Article : Google Scholar
|
|
11
|
Rajkumar SV, Dimopoulos MA, Palumbo A,
Blade J, Merlini G, Mateos MV, Kumar S, Hillengass J, Kastritis E,
Richardson P, et al: International Myeloma Working Group updated
criteria for the diagnosis of multiple myeloma. Lancet Oncol.
15(e538-e548)2014.PubMed/NCBI View Article : Google Scholar
|
|
12
|
Baur-Melnyk A, Buhmann S, Becker C,
Schoenberg SO, Lang N, Bartl R and Reiser MF: Whole-body MRI versus
whole-body MDCT for staging of multiple myeloma. AJR Am J
Roentgenol. 190:1097–1104. 2008.PubMed/NCBI View Article : Google Scholar
|
|
13
|
Gariani J, Westerland O, Natas S, Verma H,
Cook G and Goh V: Comparison of whole body magnetic resonance
imaging (WBMR imaging) to whole body computed tomography (WBCT) or
18F-fluorodeoxyglucose positron emission tomography/CT
(18F-FDG PET/CT) in patients with myeloma: Systematic
review of diagnostic performance. Crit Rev Oncol Hematol.
124:66–72. 2018.PubMed/NCBI View Article : Google Scholar
|
|
14
|
Terpos E, Kleber M, Engelhardt M, Zweegman
S, Gay F, Kastritis E, van de Donk NW, Bruno B, Sezer O, Broijl A,
et al: European Myeloma Network guidelines for the management of
multiple myeloma-related complications. Haematologica.
100:1254–1266. 2015.PubMed/NCBI View Article : Google Scholar
|
|
15
|
Zamagni E, Patriarca F, Nanni C, Zannetti
B, Englaro E, Pezzi A, Tacchetti P, Buttignol S, Perrone G, Brioli
A, et al: Prognostic relevance of 18-F FDG PET/CT in newly
diagnosed multiple myeloma patients treated with up-front
autologous transplantation. Blood. 118:5989–5995. 2011.PubMed/NCBI View Article : Google Scholar
|
|
16
|
Bartel TB, Haessler J, Brown TL,
Shaughnessy JD Jr, van Rhee F, Anaissie E, Alpe T, Angtuaco E,
Walker R, Epstein J, et al: F18-fluorodeoxyglucose positron
emission tomography in the context of other imaging techniques and
prognostic factors in multiple myeloma. Blood. 114:2068–2076.
2009.PubMed/NCBI View Article : Google Scholar
|
|
17
|
Nanni C, Zamagni E, Celli M, Caroli P,
Ambrosini V, Tacchetti P, Brioli A, Zannetti B, Pezzi A, Pantani L,
et al: The value of 18F-FDG PET/CT after autologous stem
cell transplantation (ASCT) in patients affected by multiple
myeloma (MM): Experience with 77 patients. Clin Nucl Med.
38(e74-e79)2013.PubMed/NCBI View Article : Google Scholar
|
|
18
|
Rasche L, Angtuaco E, McDonald JE, Buros
A, Stein C, Pawlyn C, Thanendrarajan S, Schinke C, Samant R,
Yaccoby S, et al: Low expression of hexokinase-2 is associated with
false-negative FDG-positron emission tomography in multiple
myeloma. Blood. 130:30–34. 2017.PubMed/NCBI View Article : Google Scholar
|
|
19
|
Herrmann K, Schottelius M, Lapa C, Osl T,
Poschenrieder A, Hänscheid H, Lückerath K, Schreder M, Bluemel C,
Knott M, et al: First-in-human experience of CXCR4-Directed
endoradiotherapy with 177Lu- and 90Y-Labeled
pentixather in advanced-stage multiple myeloma with extensive
intra- and extramedullary disease. J Nucl Med. 57:248–251.
2016.PubMed/NCBI View Article : Google Scholar
|
|
20
|
Okasaki M, Kubota K, Minamimoto R, Miyata
Y, Morooka M, Ito K, Ishiwata K, Toyohara J, Inoue T, Hirai R, et
al: Comparison of (11)C-4'-thiothymidine, (11)C-methionine, and
(18)F-FDG PET/CT for the detection of active lesions of multiple
myeloma. Ann Nucl Med. 29:224–232. 2015.PubMed/NCBI View Article : Google Scholar
|
|
21
|
Lonial S and Kaufman JL: Non-secretory
myeloma: A clinician's guide. Oncology (Williston Park).
27(924-928, 930)2013.PubMed/NCBI
|
|
22
|
Dammacco F, Rubini G, Ferrari C, Vacca A
and Racanelli V: 18F-FDG PET/CT: A review of diagnostic
and prognostic features in multiple myeloma and related disorders.
Clin Exp Med. 15:1–18. 2015.PubMed/NCBI View Article : Google Scholar
|