Introduction
In 1993, ‘sarcopenia’ was coined by Evans and
Campbell (1) from a combination of
the Greek ‘sarx’ for flesh and ‘penia’ for loss (2). The term sarcopenia, which was used for
age-related loss of skeletal muscle mass and function, has also
been adapted to refer to the severe loss of muscle mass and
function associated with adverse outcomes in oncology (3,4). In
the clinical definition of cancer cachexia, sarcopenia is part of
the diagnostic criteria along with weight loss and low Body mass
index (BMI) (5). In clinical
practice, ovarian cancers are often diagnosed at advanced stages,
complicated by large tumors, massive ascites, and comorbidities,
such as deep vein thrombosis (DVT) and pulmonary embolism (PE). As
a result, many patients with ovarian cancers experience cachexia
and sarcopenia because of appetite loss and systemic inflammation
(6,7).
Several reports, in which digital axial computed
tomography (CT) was used, have suggested that sarcopenia is
associated with poor prognoses in several solid cancers, including
ovarian cancers (8,9). In those papers, sarcopenia was
assessed by the total area of the skeletal muscle mass at the third
lumbar vertebra, which was demarcated using specialized imaging
software that analyzed the number of Hounsfield units (HU) in the
CT scans (8,9). On the other hand, Rutten et al
(10) reported that the psoas
muscle area at the third lumbar vertebra was not representative of
the total skeletal muscle area for the assessment of sarcopenia in
ovarian cancer.
The purpose of this study is to evaluate the
association between the prognoses of epithelial ovarian cancer
patients and sarcopenia assessed based on the psoas major muscle
area at the fifth lumbar vertebra, which was easily detected
relative to the position of the ilium and sacrum (11).
Materials and methods
Patients
After the institutional review board of the National
Defense Medical College approved the study protocol of the present
retrospective analyses, patients with ovarian cancers who met the
inclusion criteria were enrolled. Comprehensive informed consent to
use medical records had been obtained from each patient at the time
of primary treatment. After IRB approval, the notice of the
protocol including the use patients' records were open to the
public, without any objection or rejection. So, all the records of
the patients were used in the present study. The inclusion criteria
were met for the following: (a) Patients with pathologically
confirmed epithelial ovarian carcinoma who received primary therapy
at the National Defense Medical College Hospital between April 2010
and January 2015, (b) patients who received combination
chemotherapy using paclitaxel (PTX) and carboplatin (CBDCA; TC) as
primary chemotherapy, (c) patients who had been scheduled to
receive at least six cycles of combination chemotherapy using TC,
(d) patients whose CT scan images of the abdomen and pelvis prior
to chemotherapy were available, and (e) patients whose medical
information was available (11).
A total of 72 patients were identified and enrolled
in the present study. Of the patients in our previous study,
excluded from the present study were those with a component of
sarcoma or germ cell tumor (11).
The median age of all patients was 62 years (range, 33-81 years),
and the median follow-up duration was 49.5 months (range, 2-106
months). The number of patients according to the International
Federation of Obstetrics and Gynecology (FIGO) classification
(12) was as follows: 20 in stage
I, 12 in stage II, 29 in stage III, and 11 in stage IV.
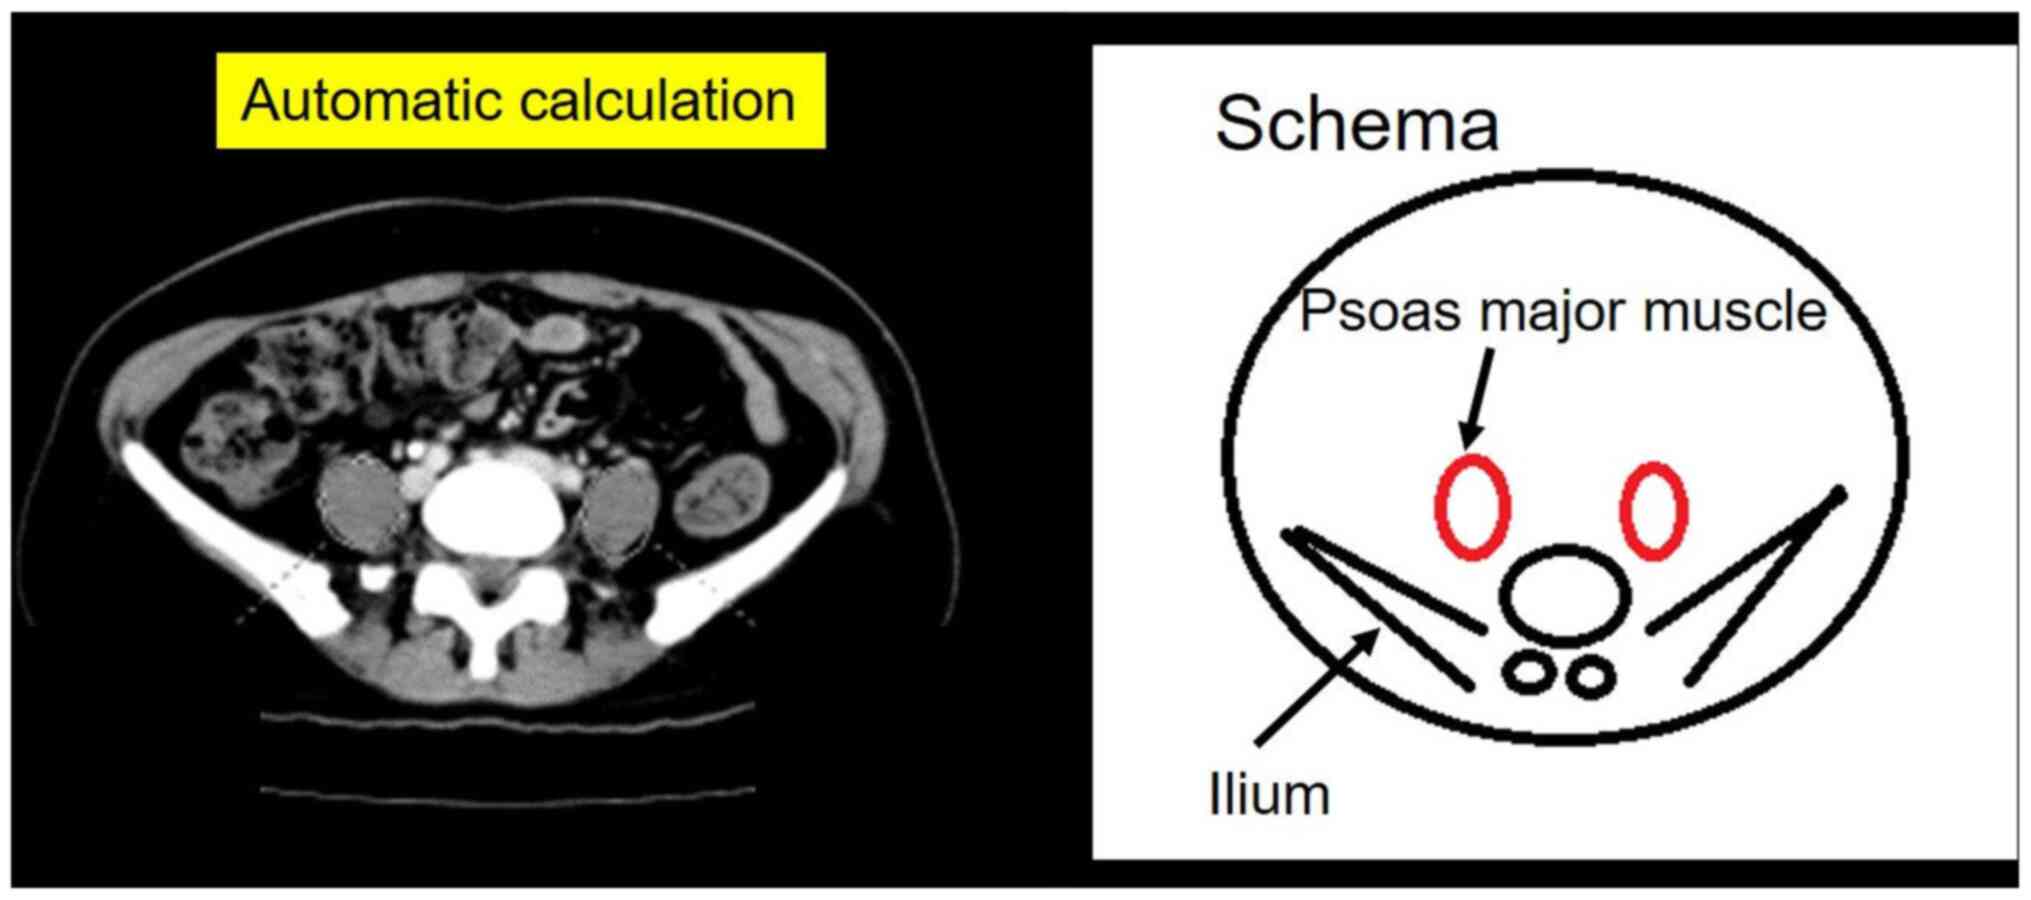
Measurement and definitions
We used the psoas muscle index (PMI
[cm2/m2]; psoas muscle major cross-sectional
area divided by height squared), as previously described (11). The areas of the right and left psoas
major muscles at the fifth lumbar vertebra were measured using
digital axial CT images, and these areas were calculated using the
elliptical region of interest (ROI) with the picture archiving and
communication system SYNAPSE (Fujifilm Corporation; Fig. 1).
Data collection
The other clinical variables assessed in this study
were the following: Age, Eastern Cooperative Oncology Group (ECOG)
performance status (PS) (https://ecog-acrin.org/resources/ecog-performance-status),
FIGO stage (12), body mass index
(BMI), serum albumin level, estimated creatinine clearance
calculated using the Cockcroft-Gault equation just before
chemotherapy, presence of massive ascites, comorbidities of DVT and
PE, and type of chemotherapy (adjuvant or neoadjuvant
chemotherapy), as previously described (11).
Treatment
In all cases, primary chemotherapy was combination
therapy using the TC regimen. The TC regimen consisted of 175
mg/m2 of paclitaxel and area under the curve (AUC)=five
to six of carboplatin on day one, repeated every three to four
weeks. The relative dose intensity (RDI) was separately calculated
for paclitaxel and carboplatin. We defined the standard TC regimen
for RDI as 175 mg/m2 of paclitaxel and AUC=five of
carboplatin on day one every three weeks.
Statistical analysis
Statistical analyses were performed using JMP Pro
version 14 (SAS Institution Inc.). Overall survival (OS) was
defined as the interval between the initial treatment and death.
Serum tumor markers, including CA125, were not used for the
definition of disease progression. Comparisons were evaluated using
the chi-square test or the Fisher's exact probability test when
appropriate. OS curves were generated using the Kaplan-Meier
method. The comparison of the survival distributions was made using
a log-rank test. Cox's proportional hazards model was used for
univariate and multivariate analysis. Values of P<0.05 were
considered significant.
Results
Patient characteristics
A total of 72 patients with epithelial ovarian
carcinomas were identified. The median psoas muscle index (PMI) was
5.39 cm2/m2 (range, 3.26-9.99). All of the
patients were divided into two groups according to PMI value and
further analyzed. The patients with lower PMI (PMI <5.4
cm2/m2) were significantly associated with
advanced stage (P=0.013), upfront chemotherapy (P=0.0007),
histological type (Adeno, NOS; P=0.007), hypoalbuminemia (serum
albumin <3.0 g/dl; P<0.0001), and massive ascites (P=0.002;
Table I).
 | Table ICharacteristics of the patients
according to psoas muscle index. |
Table I
Characteristics of the patients
according to psoas muscle index.
| | Psoas muscle
index | |
|---|
| Characteristics | High (n=36) | Low (n=36) | P-value |
|---|
| Age, years | | | 0.10 |
|
Median | 60 | 65 | |
|
Range | 33-78 | 41-81 | |
|
≥70, n
(%) | 7 (19.4) | 10 (27.8) | |
|
<70, n
(%) | 29 (80.6) | 26 (72.2) | |
| BMI, n (%) | | | 0.06 |
|
≥25
kg/m2 | 10 (27.8) | 3 (8.3) | |
|
<25
kg/m2 | 26 (72.2) | 33 (91.7) | |
| ECOG performance
status, n (%) | | | 0.13 |
|
0 | 29 (80.6) | 21 (58.3) | |
|
1 | 6 (16.7) | 11 (30.6) | |
|
2 | 1 (2.8) | 4 (11.1) | |
| FIGO stage, n
(%) | | | 0.01 |
|
I | 15 (41.7) | 5 (13.9) | |
|
II | 7 (19.4) | 5 (13.9) | |
|
III | 12 (33.3) | 17 (47.2) | |
|
IV | 2 (5.6) | 9 (25.0) | |
| Histological type,
n (%) | | | <0.01 |
|
Serous | 9 (25.0) | 20 (55.6) | |
|
Endometrioid | 6 (16.7) | 5 (13.9) | |
|
Clear
cell | 11 (30.6) | 5 (13.9) | |
|
Mucinous | 2 (5.6) | 0 (0.0) | |
|
Mixed | 4 (11.1) | 0 (0.0) | |
|
Others | 2 (5.6) | 0 (0.0) | |
|
Adeno,
NOS | 2 (5.6) | 6 (16.7) | |
| Initial therapy, n
(%) | | | <0.01 |
|
PDS | 28 (77.8) | 13 (36.1) | |
|
Chemotherapy | 8 (22.2) | 23 (63.9) | |
|
Residual
disease at PDS, n (%) | | | 0.89 |
|
Complete | 21 (58.3) | 10 (27.8) | |
|
Optimal
or Suboptimal | 7 (19.4) | 3 (8.3) | |
|
Upfront
chemotherapy, n (%) | | | 0.27 |
|
NAC
followed by IDS | 6 (16.7) | 21 (58.3) | |
|
Induction
chemotherapy alone | 2 (5.6) | 2 (5.6) | |
| PTX RDI, % | | | 0.63 |
|
Median | 70.6 | 68.7 | |
|
≥70, n
(%) | 20 (55.6) | 17 (47.2) | |
|
<70, n
(%) | 16 (44.4) | 19 (52.8) | |
| CBDCA RDI, % | | | 0.63 |
|
Median | 72.9 | 71.0 | |
|
≥70, n
(%) | 22 (61.1) | 19 (52.8) | |
|
<70, n
(%) | 14 (38.9) | 17 (47.2) | |
| Serum albumin, n
(%) | | | <0.01 |
|
≥3.0
g/dl | 34 (94.4) | 19 (52.8) | |
|
<3.0
g/dl | 2 (5.6) | 17 (47.2) | |
| Ccr, n (%) | | | 0.71 |
|
≥60
ml/min | 33 (91.7) | 31 (86.1) | |
|
<60
ml/min | 3 (8.3) | 6 (16.7) | |
| Massive ascites, n
(%) | | | <0.01 |
|
Yes
(>1,000 ml) | 5 (13.9) | 18 (50.0) | |
|
No | 31 (86.1) | 18 (50.0) | |
| PE or DVT, n
(%) | | | 0.48 |
|
Yes | 3 (8.3) | 6 (16.7) | |
|
No | 33 (91.7) | 30 (83.3) | |
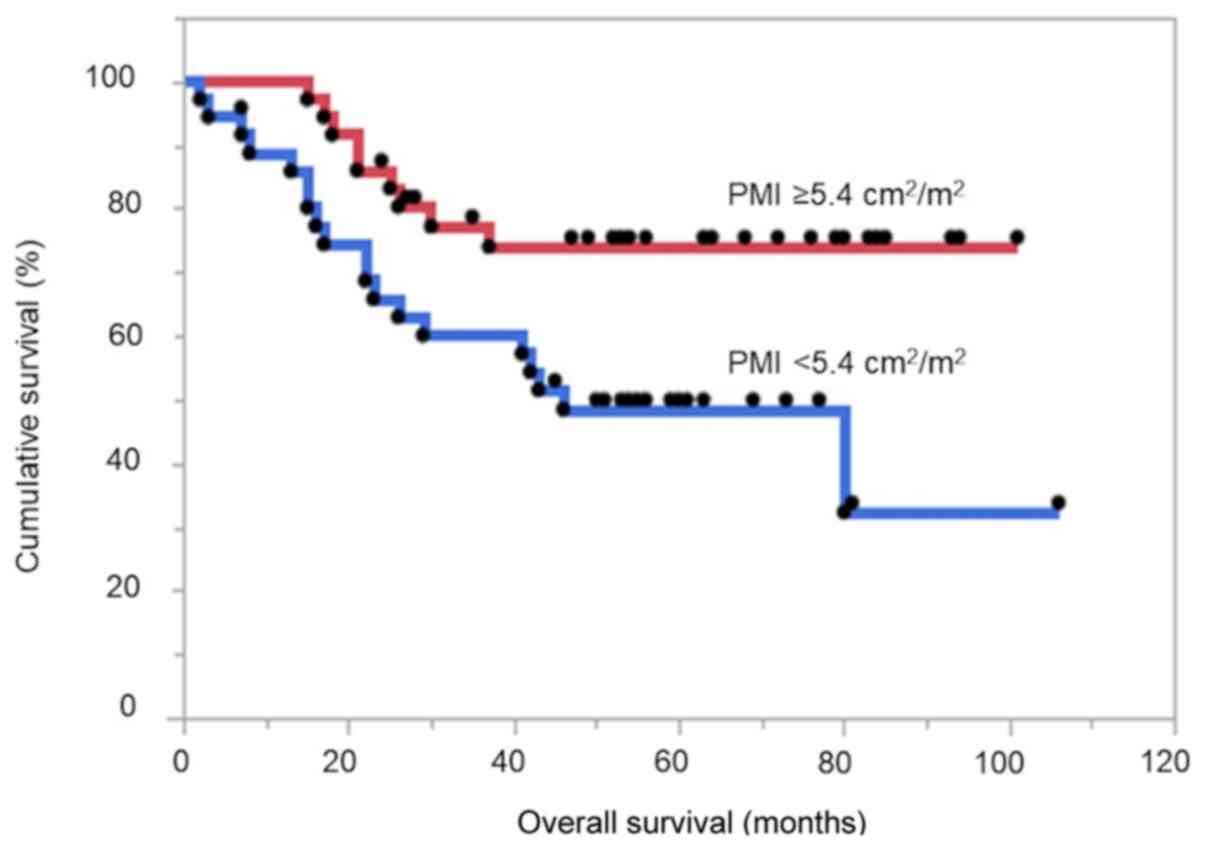
Survival analyses
The patients with higher PMI had significantly
improved OS compared with those with lower PMI (log-rank test
P=0.014; hazard ratio (HR), 2.61; 95% confidence interval (CI),
1.21-6.06; Fig. 2). In the
univariate analyses for OS, 11 variables reached statistical
significance (BMI, ECOG PS, FIGO stage, histological type, initial
therapy, residual disease status, PTX RDI, CBDCA RDI, serum
albumin, massive ascites, and PMI; Table II). We investigated the
multivariate analyses for OS with two patterns. In multivariate
analysis #1 for OS, all 11 explanatory variables were induced. In
multivariate analysis #2 for OS, four factors that were not known
risk factors were excluded because of sample size, so 7 of 11
explanatory variables were induced. Lower PMI was identified as an
independent unfavorable prognostic factor for OS in both
multivariate analysis #1 (HR, 3.83; 95% CI, 1.29-13.0; P=0.015) and
multivariate analysis #2 (HR, 3.87; 95% CI, 1.37-12.1; P=0.0098;
Table II). Additionally,
histological type was a significant independent prognostic factor
in both multivariate analyses #1 and #2. Moreover, BMI (≥25
kg/m2) and residual disease status before chemotherapy
was a significant independent poor prognostic factor in
multivariate analysis #2 (Table
II).
| Table IICox univariate and multivariate
analyses for overall survival. |
Table II
Cox univariate and multivariate
analyses for overall survival.
| | Univariate
analysis | Multivariate
analysis #1 | Multivariate
analysis #2 |
|---|
| Variables | HR (95% CI) | P-value | HR (95% CI) | P-value | HR (95% CI) | P-value |
|---|
| Age, years | | 0.45 | | | | |
|
<70 | 1 | | | | | |
|
≥70 | 1.38
(0.57-3.03) | | | | | |
| BMI,
kg/m2 | | 0.04 | | 0.10 | | 0.04 |
|
<25 | 1 | | 1 | | 1 | |
|
≥25 | 2.52
(1.03-5.58) | | 2.88
(0.81-10.0) | | 3.37
(1.05-10.5) | |
| ECOG performance
status | | 0.03 | | 0.72 | | 0.68 |
|
0 | 1 | | 1 | | 1 | |
|
1, 2 | 2.37
(1.09-4.99) | | 0.82
(0.27-2.43) | | 1.21
(0.48-3.10) | |
| FIGO stage | | <0.01 | | 0.13 | | 0.39 |
|
I, II | 1 | | 1 | | 1 | |
|
III, IV | 3.14
(1.39-7.99) | | 2.49
(0.76-8.11) | | 1.72
(0.48-3.09) | |
| Histological
type | | <0.01 | | 0.04 | | <0.01 |
|
Adeno,
NOS | 7.78
(2.95-18.5) | | 3.20
(1.04-9.89) | | 5.15
(1.75-14.6) | |
|
Others | 1 | | 1 | | 1 | |
| Initial
therapy | | <0.01 | | 0.89 | | 0.12 |
|
Surgery | 1 | | 1 | | 1 | |
|
Chemotherapy | 3.01
(1.42-6.65) | | 0.89
(0.13-5.20) | | 0.32
(0.08-1.35) | |
| Residual disease
status before chemotherapy | | <0.01 | | 0.22 | | 0.03 |
|
None | 1 | | 1 | | 1 | |
|
Others | 5.31
(2.18-15.9) | | 2.25
(0.60-8.87) | | 4.04
(1.14-14.9) | |
| PTX RDI, % | | <0.01 | | 0.10 | | |
|
≥70 | 1 | | 1 | | | |
|
<70 | 4.97
(2.20-12.7) | | 4.51
(0.70-25.1) | | | |
| CBDCA RDI, % | | <0.01 | | 0.91 | | |
|
≥70 | 1 | | 1 | | | |
|
<70 | 3.56
(1.67-8.09) | | 1.09
(0.24-6.55) | | | |
| Serum albumin,
g/dl | | <0.05 | | | | |
|
≥3.0 | 1 | | 1 | 0.29 | | |
|
<3.0 | 2.30
(1.01-4.91) | | 0.45
(0.11-2.05) | | | |
| Ccr, ml/min | | 0.65 | | | | |
|
≥60 | 1 | | | | | |
|
<60 | 1.29
(0.38-3.34) | | | | | |
| Massive ascites
(≥1,000 ml) | | 0.02 | | 0.70 | | |
|
No | 1 | | 1 | | | |
|
Yes | 2.44
(1.12-5.14) | | 1.37
(0.28-7.36) | | | |
| PE or DVT | | 0.39 | | | | |
|
No | 1 | | | | | |
|
Yes | 1.63
(0.47-4.26) | | | | | |
| Psoas muscle
index | | <0.01 | | <0.01 | | <0.01 |
|
High (≥5.4
cm2/m2) | 1 | | 1 | | 1 | |
|
Low (<5.4
cm2/m2) | 2.61
(1.21-6.06) | | 3.83
(1.29-13.0) | | 3.87
(1.37-12.1) | |
Discussion
In the present study, the PMI evaluated at the fifth
lumbar vertebra as an index for sarcopenia was identified as an
independent unfavorable prognostic factor in Japanese patients who
received upfront treatment for ovarian cancers. To our knowledge,
this is the first report using multivariate analyses to demonstrate
the association between the loss of psoas major muscle mass and
risk of poor outcome in ovarian cancer patients who received TC
therapy. This finding provides evidence that we might be able to
evaluate only one muscle to determine the prognosis of epithelial
ovarian cancer in primary therapy using the TC regimen. PMI was
associated with overall survival in ovarian cancer patients, and
the significant impact of PMI on prognosis was confirmed by two
independent multivariate analyses.
Conrad et al (13) reported that pre-operative PMI at the
fourth lumbar vertebra was not associated with poor prognosis and
that PMI, in combination with hypoalbuminemia, was associated with
unfavorable prognosis in advanced ovarian cancer. In their paper,
the mean PMI was 2.80 cm2/m2. On the other
hand, in this study, the mean PMI was 5.48
cm2/m2. We speculate that the difference in
muscle volume distribution due to the range of stages had a strong
influence on survival.
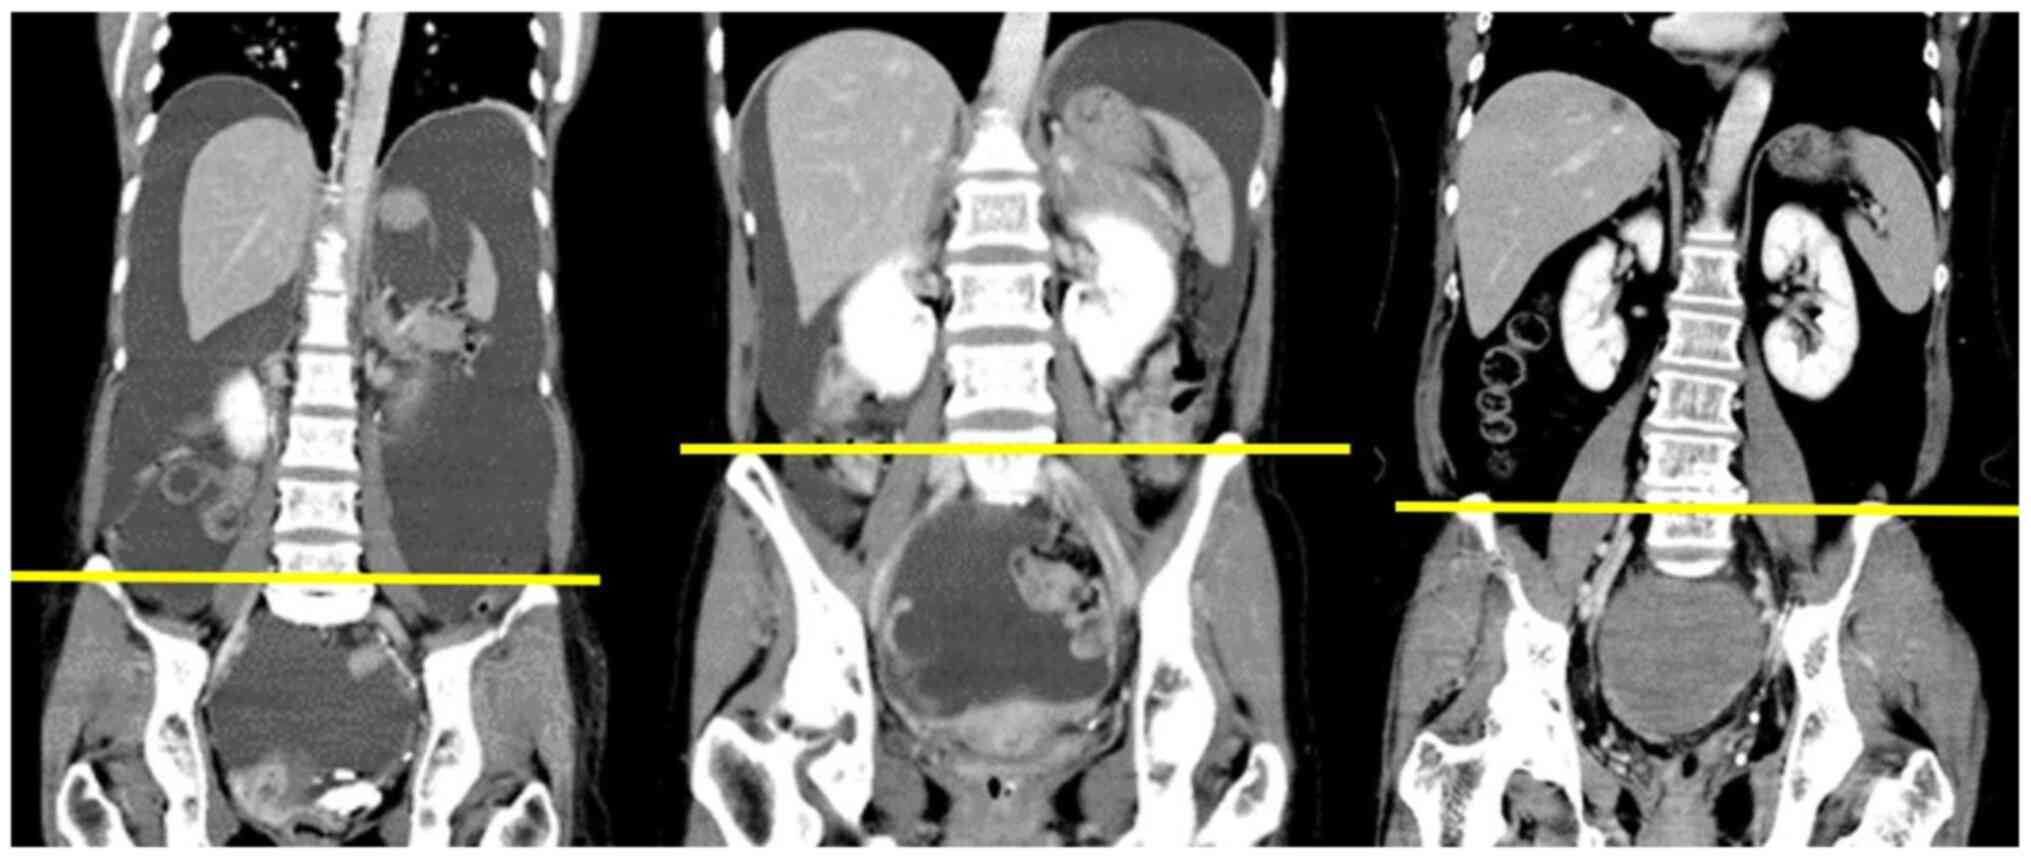
Rutten et al (10) insisted that the change in psoas
muscle area was not representative of the change in total muscle
area and should not be used as a substitute for the total skeletal
muscle in predicting survival in patients with ovarian cancer. In
their study, the median psoas muscle area at the third lumbar
vertebra was 13.3 cm2. On the other hand, in this study,
the median psoas muscle area at the fifth lumbar vertebra was 12.7
cm2. We speculated that our patients had a smaller
muscle mass because the fifth lumbar vertebra has a larger muscle
area than the third lumbar vertebra (Fig. 3). In our study, the proportion of
overweight and obese patients (18.1%) was small compared to the
proportion (35.7%) in Rutten's report. As shown in our previous
study, there is a positive and moderate correlation between BMI and
PMI, which might have influenced the different results between
their study and ours (11).
The psoas area is often measured at a standard
lumbar vertebral landmark (L3 or L4), but sometimes, unreliable
soft tissue landmarks, such as the umbilicus, have been used
(14). Previous papers mainly
reported on sarcopenia assessed by the total area of skeletal
muscle mass at the third lumbar vertebra (3,6,8-10).
It is easy to measure the psoas major muscle areas when the fifth
lumbar vertebra, where the ilium bones are located in the lower
half dorsal side in the horizontal section of CT imaging, is used
as a landmark. When evaluating sarcopenia using the psoas major
muscle only, the belly of the muscle is not located at the third
lumbar vertebra but actually at the fifth lumbar vertebra (Fig. 3). In this study, we used a PMI
calculated using the elliptical region of interest that could be
obtained with a simple method, as previously described (11). We believe that easier detection and
measurement of PMI are of great importance for clinical
practice.
In a recent meta-analysis not including Asian
countries, the skeletal mass index was significantly associated
with survival (15). Conversely, in
a cohort study from the United States of America, sarcopenia was
not associated with poor survival outcomes in epithelial ovarian
cancer patients receiving upfront platinum and taxane-based
chemotherapy (16). In a report
from Asia, Kim et al (17)
found that the skeletal mass index was not associated with worse
survival outcomes, but patients with a high fat-to-muscle ratio
showed significantly worse OS in advanced-stage, high-grade serous
ovarian carcinoma. Conversely, Huang et al (18) reported that the skeletal muscle
index was independently associated with poor OS in patients with
stage III epithelial ovarian cancer treated with primary debulking
surgery and adjuvant platinum-based chemotherapy. Although
sarcopenia has been recognized as an important prognostic factor,
sarcopenia remains controversial in terms of what its optimal index
is and what the optimal cut-off values are. Moreover, values will
differ according to the number of lumbar vertebra and the patient's
race.
In pancreatic cancer, sarcopenic obesity has been
recognized as a poor prognostic factor in meta-analysis (19). In ovarian cancer, a Korean group
reported that a high fat-to-muscle ratio was related to
significantly worse OS (17).
Furthermore, in the present study, being overweight (BMI ≥25
kg/m2) was a poor prognostic factor, independent of
sarcopenia, for OS in multivariate analysis #2. These results are
congruent with those reported by Kim et al (17). Sarcopenic obesity is associated with
elevated markers of inflammation such as interleikin-6 (IL-6),
tumor necrosis factor (TNF) and C-reactive protein (CRP) in
postmenopausal women (20).
Inflammation that causes cachexia and sarcopenia causes sarcopenic
obesity, and obesity itself has a negative effect on inflammation
and tumor-promoting effects (21).
We believe that sarcopenic obesity potentially has a significant
impact on survival, even in ovarian cancer.
In conclusion, sarcopenia assessed using PMI values
measured at the fifth lumbar vertebra had a significant and
independent impact on OS in patients with epithelial ovarian
cancers, though further analyses including a large number of
patients are needed. Moreover, the PMI value should be evaluated
along with impacts of other drugs, such as molecularly targeted
drugs and immune checkpoint inhibitors. The measurement of the
psoas major muscle areas at the fifth lumbar vertebra could be an
important indicator for the prognosis of epithelial ovarian
cancers.
Acknowledgements
The authors would like to thank Ms. Hiromi Kubota
(Department of Clinical Oncology, National Defense Medical College
Hospital, Tokorozawa, Japan) and Ms. Aya Yokoyama (Tokyo, Japan)
for continuous contribution to the present clinical study.
Funding
No funding was received.
Availability of data and materials
The datasets used and/or analysed during the current
study are available from the corresponding author on reasonable
request.
Authors' contributions
TY and MT conceived the study. TY, MM, TA, HM, HIw,
HIs, SK, TS, KT, JS, HT, HK, AY and MT designed the analysis. TY,
MM, TA, HM, HIw, HIs, SK, TS, KT and JS collected and interpreted
the patient data. TY, MM, HT and MT confirmed the authenticity of
the raw data. TY, MM and TA analysed the data. TY, HT, HK, AY and
MT wrote the draft of manuscript. TY, MM, HT, HK, AY and MT
critically revised the manuscript critically for important
intellectual content. TY, HT, HK, AY and MT provided final approval
of the version to be published. All authors read and approved the
final manuscript.
Ethics approval and consent to
participate
The Institutional Review Board at National Defense
Medical College Hospital (Saitama, Japan) approved this study
(approval no. 4021), which proceeded in accordance with the ethical
standards established in the Declaration of Helsinki in 1995
(Brazil 2013 revision). The comprehensive written informed consent
to use medical records had been obtained from each patient at the
time of primary treatment. Consent from the participants was
obtained using the opt-out principle. The nature of the study and
the right of refusal to participate were disclosed to the public
online.
Patient consent for publication
Not applicable.
Competing interests
The authors declare that they have no competing
interests.
References
|
1
|
Evans WJ and Campbell WW: Sarcopenia and
age-related changes in body composition and functional capacity. J
Nutr. 123 (Suppl 2):S465–S468. 1993.PubMed/NCBI View Article : Google Scholar
|
|
2
|
Ryan AM, Power DG, Daly L, Cushen SJ, Ní
Bhuachalla Ē and Prado CM: Cancer-associated malnutrition, cachexia
and sarcopenia: The skeleton in the hospital closet 40 years later.
Proc Nutr Soc. 75:199–211. 2016.PubMed/NCBI View Article : Google Scholar
|
|
3
|
Baumgartner RN, Koehler KM, Gallagher D,
Romero L, Heymsfield SB, Ross RR, Garry PJ and Lindeman RD:
Epidemiology of sarcopenia among the elderly in New Mexico. Am J
Epidemiol. 147:755–763. 1998.PubMed/NCBI View Article : Google Scholar
|
|
4
|
Shachar SS, Williams GR, Muss HB and
Nishijima TF: Prognostic value of sarcopenia in adults with solid
tumours: A meta-analysis and systematic review. Eur J Cancer.
57:58–67. 2016.PubMed/NCBI View Article : Google Scholar
|
|
5
|
Fearon K, Strasser F, Anker SD, Bosaeus I,
Bruera E, Fainsinger RL, Jatoi A, Loprinzi C, MacDonald N,
Mantovani G, et al: Definition and classification of cancer
cachexia: An international consensus. Lancet Oncol. 12:489–495.
2011.PubMed/NCBI View Article : Google Scholar
|
|
6
|
Solheim TS, Fayers PM, Fladvad T, Tan B,
Skorpen F, Fearon K, Baracos VE, Klepstad P, Strasser F and Kaasa
S: European Palliative Care Research Collaborative (EPCRC) and the
European Pharmacogenetic Study (EPOS). Is there a genetic cause of
appetite loss?-an explorative study in 1,853 cancer patients. J
Cachexia Sarcopenia Muscle. 3:191–198. 2012.PubMed/NCBI View Article : Google Scholar
|
|
7
|
Feliciano EM, Kroenke CH, Meyerhardt JA,
Prado CM, Bradshaw PT, Kwan ML, Xiao J, Alexeeff S, Corley D,
Weltzien E, et al: Association of systemic inflammation and
sarcopenia with survival in nonmetastatic colorectal cancer:
Results from the C SCANS study. JAMA Oncol.
3(e172319)2017.PubMed/NCBI View Article : Google Scholar
|
|
8
|
Rutten IJ, van Dijk DP, Kruitwagen RF,
Beets-Tan RG, Olde Damink SW and van Gorp T: Loss of skeletal
muscle during neoadjuvant chemotherapy is related to decreased
survival in ovarian cancer patients. J Cachexia Sarcopenia Muscle.
7:458–466. 2016.PubMed/NCBI View Article : Google Scholar
|
|
9
|
Kumar A, Moynagh MR, Multinu F, Cliby WA,
McGree ME, Weaver AL, Young PM, Bakkum-Gamez JN, Langstraat CL,
Dowdy SC, et al: Muscle composition measured by CT scan is a
measurable predictor of overall survival in advanced ovarian
cancer. Gynecol Oncol. 142:311–316. 2016.PubMed/NCBI View Article : Google Scholar
|
|
10
|
Rutten IJ, Ubachs J, Kruitwagen RF,
Beets-Tan RG, Olde Damink SW and Van Gorp T: Psoas muscle area is
not representative of total skeletal muscle area in the assessment
of sarcopenia in ovarian cancer. J Cachexia Sarcopenia Muscle.
8:630–638. 2017.PubMed/NCBI View Article : Google Scholar
|
|
11
|
Yoshikawa T, Takano M, Miyamoto M, Yajima
I, Shimizu Y, Aizawa Y, Suguchi Y, Moriiwa M, Aoyama T, Soyama H,
et al: Psoas muscle volume as a predictor of peripheral
neurotoxicity induced by primary chemotherapy in ovarian cancers.
Cancer Chemother Pharmacol. 80:555–561. 2017.PubMed/NCBI View Article : Google Scholar
|
|
12
|
Javadi S, Ganeshan DM, Qayyum A, Iyer RB
and Bhosale P: Ovarian cancer, the revised FIGO staging system, and
the role of imaging. AJR Am J Roentgenol. 206:1351–1360.
2016.PubMed/NCBI View Article : Google Scholar
|
|
13
|
Conrad LB, Awdeh H, Acosta-Torres S,
Conrad SA, Bailey AA, Miller DS and Lea JS: Pre-operative core
muscle index in combination with hypoalbuminemia is associated with
poor prognosis in advanced ovarian cancer. J Surg Oncol.
117:1020–1028. 2018.PubMed/NCBI View Article : Google Scholar
|
|
14
|
Baracos VE: Psoas as a sentinel muscle for
sarcopenia: A flawed premise. J Cachexia Sarcopenia Muscle.
8:527–528. 2017.PubMed/NCBI View Article : Google Scholar
|
|
15
|
Ubachs J, Ziemons J, Minis-Rutten IJ,
Kruitwagen RF, Kleijnen J, Lambrechts S, Olde Damink SW, Rensen SS
and Van Gorp T: Sarcopenia and ovarian cancer survival: A
systematic review and meta-analysis. J Cachexia Sarcopenia Muscle.
10:1165–1174. 2019.PubMed/NCBI View Article : Google Scholar
|
|
16
|
Staley SA, Tucker K, Newton M, Ertel M,
Oldan J, Doherty I, West L, Zhang Y and Gehrig PA: Sarcopenia as a
predictor of survival and chemotoxicity in patients with epithelial
ovarian cancer receiving platinum and taxane-based chemotherapy.
Gynecol Oncol. 156:695–700. 2020.PubMed/NCBI View Article : Google Scholar
|
|
17
|
Kim SI, Kim TM, Lee M, Kim HS, Chung HH,
Cho JY and Song YS: Impact of CT-determined sarcopenia and body
composition on survival outcome in patients with advanced-stage
high-grade serous ovarian carcinoma. Cancers (Basel).
12(559)2020.PubMed/NCBI View Article : Google Scholar
|
|
18
|
Huang CY, Yang YC, Chen TC, Chen JR, Chen
YJ, Wu MH, Jan YT, Chang CL and Lee J: Muscle loss during primary
debulking surgery and chemotherapy predicts poor survival in
advanced-stage ovarian cancer. J Cachexia Sarcopenia Muscle.
11:534–546. 2020.PubMed/NCBI View Article : Google Scholar
|
|
19
|
Mintziras I, Miligkos M, Wächter S,
Manoharan J, Maurer E and Bartsch DK: Sarcopenia and sarcopenic
obesity are significantly associated with poorer overall survival
in patients with pancreatic cancer: Systematic review and
meta-analysis. Int J Surg. 59:19–26. 2018.PubMed/NCBI View Article : Google Scholar
|
|
20
|
Dutra MT, Avelar BP, Souza VC, Bottaro M,
Oliveira RJ, Nóbrega OT and Moreno Lima R: Relationship between
sarcopenic obesity-related phenotypes and inflammatory markers in
postmenopausal women. Clin Physiol Funct Imaging. 37:205–210.
2017.PubMed/NCBI View Article : Google Scholar
|
|
21
|
Iyengar NM, Gucalp A, Dannenberg AJ and
Hudis CA: Obesity and cancer mechanisms: Tumor microenvironment and
inflammation. J Clin Oncol. 34:4270–4276. 2016.PubMed/NCBI View Article : Google Scholar
|